Duck Production and Harvest in St. Croix and Polk...
44
Duck Production and Harvest in St. Croix and Polk Counties, Wisconsin Technical Bulletin No. 194, 2002 Department of Natural Resources · Madison, Wisconsin 53707 <
Transcript of Duck Production and Harvest in St. Croix and Polk...
Duck Production and Harvest in St. Croix and Polk Counties,
Wisconsin
Technical Bulletin No. 194, 2002 Department of Natural Resources · Madison, Wisconsin 53707
<
Cover photos: Bruce Bacon
ABSTRACT
A study, conducted during 1982-91 in northwest Wisconsin, evaluated management techniques designed to increase Mallard (Anas platyrhynchos) and Blue-winged Teal (Anas discors) production and determined the contribution of duck production to the local hunting harvest. The 415-rni2 (321,280 acre) study area in St. Croix and southern Polk counties contained around 7,000 acres (2.1%) of state and federal Waterfowl Production Areas (WPAs). Each year duck breeding pairs and broods were censused by air and by ground and approximately 1,000 acres of upland nesting cover were searched for nests. I sampled nest predators and alternate prey populations annually and captured, marked, and released over 5,000 immature and adult waterfowl during 1982-90. I interviewed hunters in the field during the first 2 days of the hunting season to determine their success. The major objective of the study (to evaluate habitat management techniques to increase duck production in WPAs) was only partially met, primarily due to inadequate sample sizes. Wetland densities, duck occupancy, and breeding pair densities declined during the 1987-88 drought. Mean 1982-91 duck breeding pair densities fo.r the study area were 7.0 pairs/rni2 (1.6 Mallard, 2.6 Blue-winged Teal, 2.8 other species). Mean duck breeding pair densities on the WPAs were 68.4pairs/mi2
(17.9 Mallard, 29.0 Blue-winged Teal, 21.5 other). Mean 1982-90 nest success was 21.3% for 621 WPA duck nests of which 63% were Blue-winged Teal, 36% Mallard, and 1% other species. This rate exceeds the 20% nest success needed for a stable population under Wisconsin conditions. There was no difference between mean Mallard and Blue-winged Teal nest success for the 9-year period (p=0.8). Mean duckling production was 3 ducklings/WPA wetland acre based upon mark/ resight estimates. Thirteen percent of marked Mallards and 5% of marked Blue-winged Teal were shot within the study area. Mallards and Blue-winged Teal comprised 35% and 12% of the harvest respectively during the first two days of the season. Mean hunter success was 0.8 ducks/hunter trip, with 10 hours being needed to bag one duck during dry years.
The Wisconsin Department of Natural Resources provides equal opportunity in its employment, programs, services, and functions under an Affinnative Action Plan. If you have any questions, please write to Equal Opportunity Office, Department of Interior, Washington, D.C. 20240.
This publication is available in alternative fonnat (large print, Braille, audio tape. etc.) upon request. Please call (608) 266-Q531 for more infonnation.
DUCK PRODUCTION AND HARVEST IN ST. CROIX AND POLK COUNTIES, WISCONSIN
By James 0. Evrard
Technical Bulletin No. 194 Department of Natural Resources
PO Box 7921 Mad ison, WI 53707
2002
DUCK PRODUCTION AND HARVEST IN
ST. CROIX AND POLK COUNTIES, WISCONSIN
By James 0. Evrard
Technical Bulletin No. 194 Department of Natural Resources PO Box 7921 Madison, WI 53707 2002
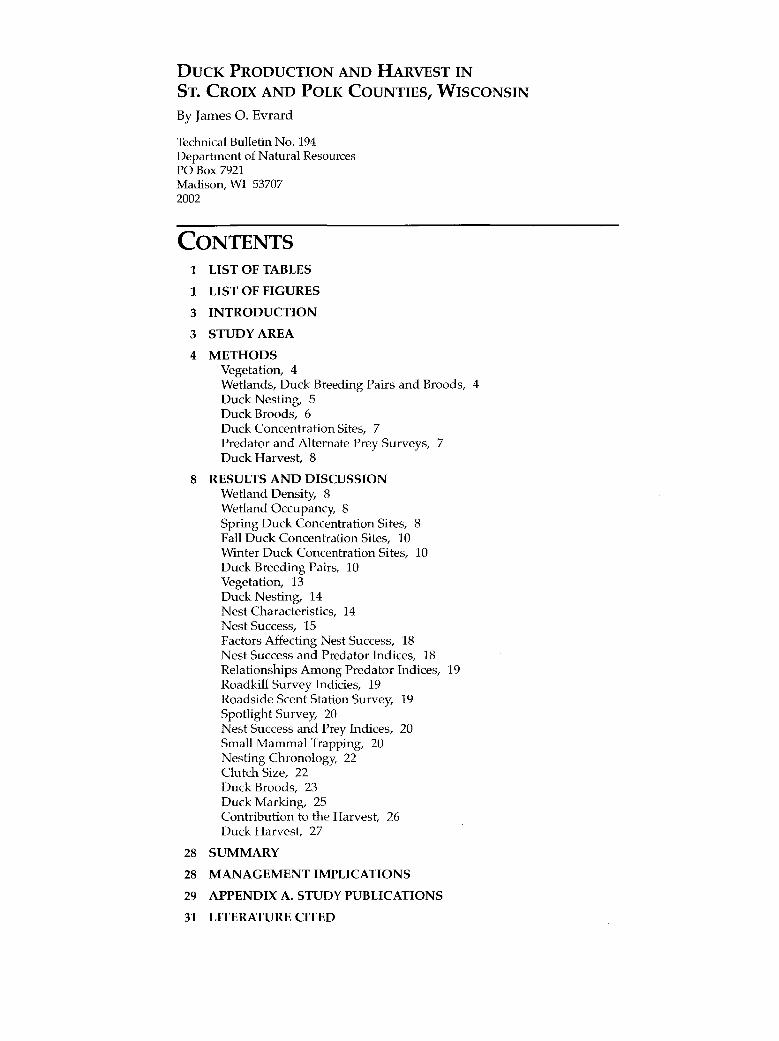
CONTENTS 1 LIST OF TABLES
1 LIST OF FIGURES
3 INTRODUCTION
3 STUDY AREA
4 METHODS Vegetation, 4 Wetlands, Duck Breeding Pairs and Broods, 4 Duck Nesting, 5 Duck Broods, 6 Duck Concentration Sites, 7 Predator and Alternate Prey Surveys, 7 Duck Harvest, 8
8 RESULTS AND DISCUSSION Wetland Density, 8 Wetland Occupancy, 8 Spring Duck Concentration Sites, 8 Fall Duck Concentration Sites, 10 Winter Duck Concentration Sites, 10 Duck Breeding Pairs, 10 Vegetation, 13 Duck Nesting, 14 Nest Characteristics, 14 Nest Success, 15 Factors Affecting Nest Success, 18 Nest Success and Predator Indices, 18 Relationships Among Predator Indices, 19 Roadkill Survey lndicies, 19 Roadside Scent Station Survey, 19 Spotlight Survey, 20 Nest Success and Prey Indices, 20 Small Mammal Trapping, 20 Nesting Chronology, 22 Clutch Size, 22 Duck Broods, 23 Duck Marking, 25 Contribution to the Harvest, 26 Duck Harvest, 27
28 SUMMARY
28 MANAGEMENT IMPLICATIONS
29 APPENDIX A. STUDY PUBLICATIONS
31 LITERATURE CITED
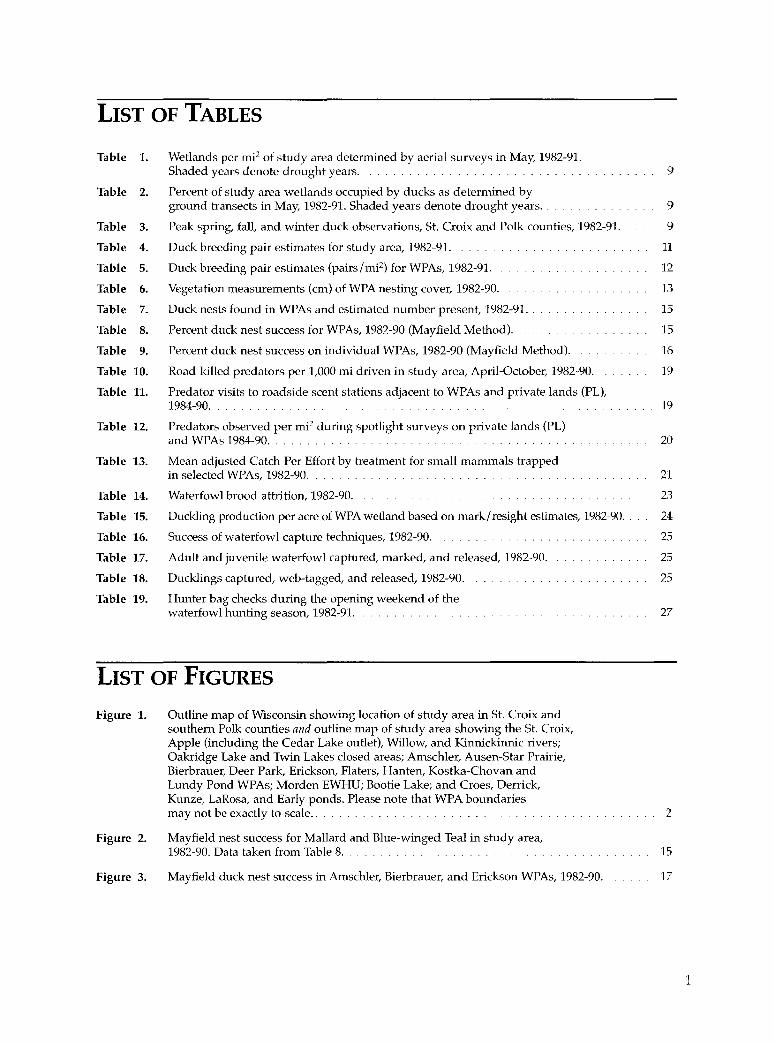
LIST OF TABLES
Table 1. Wetlands per mi2 of study area determined by aerial surveys in May, 1982-91. Shaded years denote drought years. 9
Table 2. Percent of study area wetlands occupied by ducks as determined by ground transects in May, 1982-91. Shaded years denote drought years. . 9
Table 3. Peak spring, fall, and winter duck observations, St. Croix and Polk counties, 1982-91. 9
Table 4. Duck breeding pair estimates for study area, 1982-91. 11
Table 5. Duck breeding pair estimates (pairs/mi2) for WPAs, 1982-91. 12
Table 6. Vegetation measurements (em) of WPA nesting cover, 1982-90. 13
Table 7. Duck nests found in WPAs and estimated number present, 1982-91. . 15
Table 8. Percent duck nest success for WPAs, 1982-90 (Mayfield Method). 15
Table 9. Percent duck nest success on individual WPAs, 1982-90 (Mayfield Method). 16
Table 10. Road-killed predators per 1,000 mi driven in study area, April-October, 1982-90. 19
Table 11. Predator visits to roadside scent stations adjacent to WPAs and private lands (PL), 1984-90. 19
Table 12. Predators observed per mi2 during spotlight surveys on private lands (PL) and WPAs 1984-90. . 20
Table 13. Mean adjusted Catch Per Effort by treatment for small mammals trapped in selected WPAs, 1982-90. 21
Table 14. Waterfowl brood attrition, 1982-90. 23
Table 15. Duckling production per acre of WPA wetland based on mark/ resight estimates, 1982-90. . 24
Table 16. Success of waterfowl capture techniques, 1982-90. 25
Table 17. Adult and juvenile waterfowl captured, marked, and released, 1982-90. 25
Table 18. Ducklings captured, web-tagged, and released, 1982-90. 25
Table 19. Hunter bag checks during the opening weekend of the waterfowl hunting season, 1982-91. 27
LIST OF FIGURES
Figure 1.
Figure 2.
Figure 3.
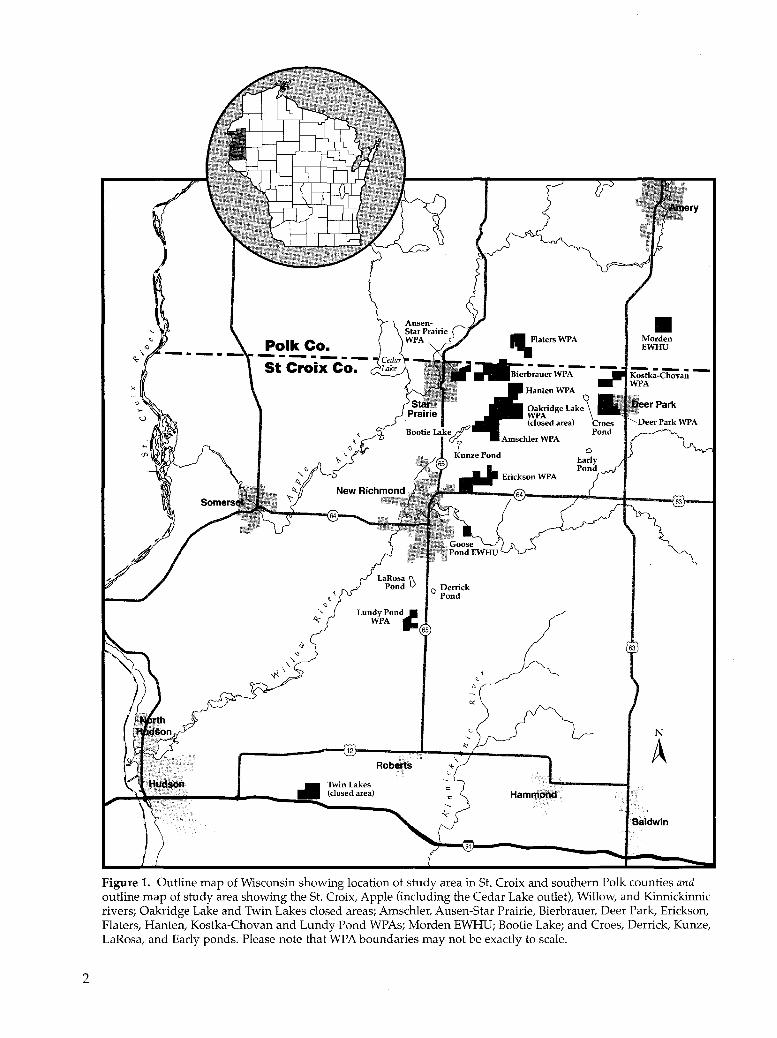
Outline map of Wisconsin showing location of study area in St. Croix and southern Polk counties and outline map of study area showing the St. Croix, Apple (including the Cedar Lake outlet), Willow, and Kinnickinnic rivers; Oakridge Lake and Twin Lakes closed areas; Amschler, Ausen-Star Prairie, Bierbrauer, Deer Park, Erickson, Platers, Hanten, Kostka-Chovan and Lundy Pond WPAs; Morden EWHU; Bootie Lake; and Croes, Derrick, Kunze, LaRosa, and Early ponds. Please note that WPA boundaries may not be exactly to scale ..
Mayfield nest success for Mallard and Blue-winged Teal in study area, 1982-90. Data taken from Table 8.
Mayfield duck nest success in Amschler, Bierbrauer, and Erickson WPAs, 1982-90.
2
15
17
1
2
Polk Co.
St Croix Co.
• Morden EWHU
N
A
Baldwin
Figure 1. Outline map of Wisconsin showing location of study area in St. Croix and southern Polk counties and outline map of study area showing the St. Croix, Apple (including the Cedar Lake outlet), Willow, and Kinnickinnic rivers; Oakridge Lake and Twin Lakes closed areas; Amschler, Ausen-Star Prairie, Bierbrauer, Deer Park, Erickson, Platers, Hanten, Kostka-Chovan and Lundy Pond WPAs; Morden EWHU; Bootie Lake; and Croes, Derrick, Kunze, LaRosa, and Early ponds. Please note that WPA boundaries may not be exactly to scale.
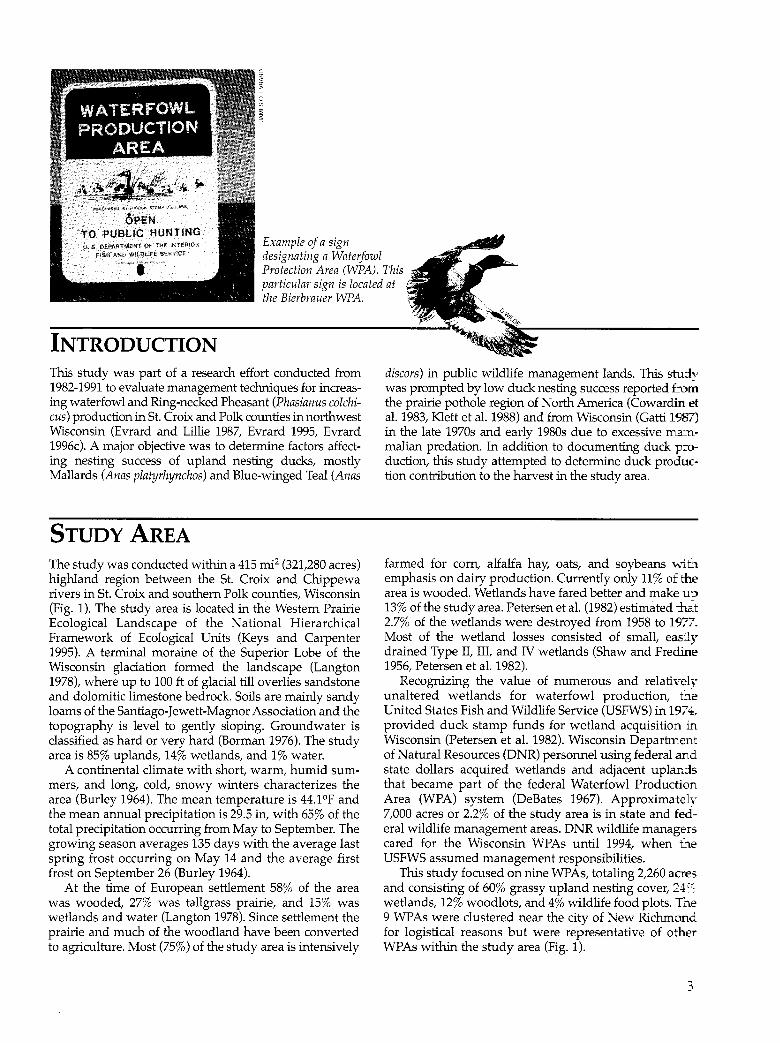
Example of a sign designating a Waterfowl Protection Area (WPA). This particular sign is located at the Bierbrauer WPA.
INTRODUCTION This study was part of a research effort conducted from 1982-1991 to evaluate management techniques for increasing waterfowl and Ring-necked Pheasant (Phasianus colchicus) production in St. Croix and Polk counties in northwest Wisconsin (Evrard and Lillie 1987, Evrard 1995, Evrard 1996c). A major objective was to determine factors affecting nesting success of upland nesting ducks, mostly Mallards (Anas platyrhynchos) and Blue-winged Teal (Anas
STUDY AREA The study was conducted within a 415 rni2 (321,280 acres) highland region between the St. Croix and Chippewa rivers in St. Croix and southern Polk counties, Wisconsin (Fig. 1). The study area is located in the Western Prairie Ecological Landscape of the National Hierarchical Framework of Ecological Units (Keys and Carpenter 1995). A terminal moraine of the Superior Lobe of the Wisconsin glaciation formed the landscape (Langton 1978), where up to 100ft of glacial till overlies sandstone and dolomitic limestone bedrock. Soils are mainly sandy loams of the Santiago-Jewett-Magnor Association and the topography is level to gently sloping. Groundwater is classified as hard or very hard (Borman 1976). The study area is 85% uplands, 14% wetlands, and 1% water.
A continental climate with short, warm, humid summers, and long, cold, snowy winters characterizes the area (Burley 1964). The mean temperature is 44.1°F and the mean annual precipitation is 29.5 in, with 65% of the total precipitation occurring from May to September. The growing season averages 135 days with the average last spring frost occurring on May 14 and the average first frost on September 26 (Burley 1964).
At the time of European settlement 58% of the area was wooded, 27% was tallgrass prairie, and 15% was wetlands and water (Langton 1978). Since settlement the prairie and much of the woodland have been converted to agriculture. Most (75%) of the study area is intensively
discors) in public wildlife management lands. This study was prompted by low duck nesting success reported from the prairie pothole region of North America (Cowardin et al. 1983, Klett et al. 1988) and from Wisconsin (Gatti 1987) in the late 1970s and early 1980s due to excessive mammalian predation. In addition to documenting duck production, this study attempted to determine duck production contribution to the harvest in the study area.
farmed for com, alfalfa hay, oats, and soybeans v.ith emphasis on dairy production. Currently only 11% of the area is wooded. Wetlands have fared better and make up 13% of the study area. Petersen et al. (1982) estimated that 2.7% of the wetlands were destroyed from 1958 to 1977. Most of the wetland losses consisted of small, easilv drained Type II, III, and IV wetlands (Shaw and Fredin~ 1956, Petersen et al. 1982).
Recognizing the value of numerous and relatively unaltered wetlands for waterfowl production, the United States Fish and Wildlife Service (USFWS) in 1974, provided duck stamp funds for wetland acquisition in Wisconsin (Petersen et al. 1982). Wisconsin Department of Natural Resources (DNR) personnel using federal and state dollars acquired wetlands and adjacent uplands that became part of the federal Waterfowl Production Area (WPA) system (DeBates 1967). Approximately 7,000 acres or 2.2% of the study area is in state and federal wildlife management areas. DNR wildlife managers cared for the Wisconsin WPAs until 1994, when the USFWS assumed management responsibilities.
This study focused on nine WPAs, totaling 2,260 acres and consisting of 60% grassy upland nesting cover, 24% wetlands, 12% woodlots, and 4% wildlife food plots. The 9 WPAs were clustered near the city of New Richmond for logistical reasons but were representative of other WPAs within the study area (Fig. 1).
3
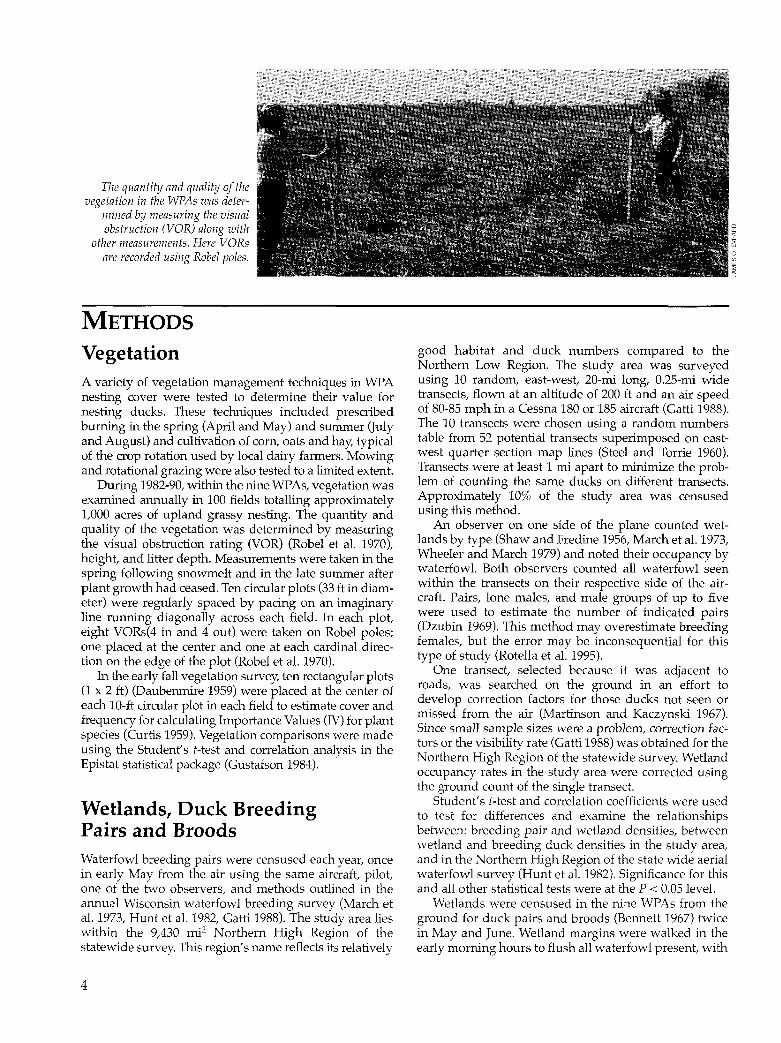
The quantity and quality of the vegetation in the WPAs was deter
mined by measuring the visual obstruction (VOR) along with
other measurements. Here VORs are recorded using Robel poles.
METHODS
Vegetation A variety of vegetation management techniques in WP A nesting cover were tested to determine their value for nesting ducks. These techniques included prescribed burning in the spring (April and May) and summer Ouly and August) and cultivation of corn, oats and hay, typical of the crop rotation used by local dairy farmers. Mowing and rotational grazing were also tested to a limited extent.
During 1982-90, within the nine WPAs, vegetation was examined annually in 100 fields totalling approximately 1,000 acres of upland grassy nesting. The quantity and quality of the vegetation was determined by measuring the visual obstruction rating (VOR) (Robel et al. 1970), height, and litter depth. Measurements were taken in the spring following snowmelt and in the late summer after plant growth had ceased. Ten circular plots (33ft in diameter) were regularly spaced by pacing on an imaginary line running diagonally across each field. In each plot, eight VORs(4 in and 4 out) were taken on Robel poles; one placed at the center and one at each cardinal direction on the edge of the plot (Robel et al. 1970).
In the early fall vegetation survey, ten rectangular plots (1 x 2ft) (Daubenrnire 1959) were placed at the center of each 10-ft circular plot in each field to estimate cover and frequency for calculating Importance Values (IV) for plant species (Curtis 1959). Vegetation comparisons were made using the Student's t-test and correlation analysis in the Epistat statistical package (Gustafson 1984).
Wetlands, Duck Breeding Pairs and Broods Waterfowl breeding pairs were censused each year, once in early May from the air using the same aircraft, pilot, one of the two observers, and methods outlined in the annual Wisconsin waterfowl breeding survey (March et al. 1973, Hunt et al. 1982, Gatti 1988). The study area lies within the 9,430 rni2 Northern High Region of the statewide survey. This region's name reflects its relatively
4
good habitat and duck numbers compared to the Northern Low Region. The study area was surveyed using 10 random, east-west, 20-rni long, 0.25-rni wide transects, flown at an altitude of 200 ft and an air speed of 80-85 mph in a Cessna 180 or 185 aircraft (Gatti 1988). The 10 transects were chosen using a random numbers table from 52 potential transects superimposed on eastwest quarter section map lines (Steel and Torrie 1960). Transects were at least 1 mi apart to minimize the problem of counting the same ducks on different transects. Approximately 10% of the study area was censused using this method.
An observer on one side of the plane counted wetlands by type (Shaw and Fredine 1956, March et al. 1973, Wheeler and March 1979) and noted their occupancy by waterfowl. Both observers counted all waterfowl seen within the transects on their respective side of the aircraft. Pairs, lone males, and male groups of up to five were used to estimate the number of indicated pairs (Dzubin 1969). This method may overestimate breeding females, but the error may be inconsequential for this type of study (Rotella et al. 1995).
One transect, selected because it was adjacent to roads, was searched on the ground in an effort to develop correction factors for those ducks not seen or missed from the air (Martinson and Kaczynski 1967). Since small sample sizes were a problem, correction factors or the visibility rate (Gatti 1988) was obtained for the Northern High Region of the statewide survey. Wetland occupancy rates in the study area were corrected using the ground count of the single transect.
Student's t-test and correlation coefficients were used to test for differences and examine the relationships between: breeding pair and wetland densities, between wetland and breeding duck densities in the study area, and in the Northern High Region of the state wide aerial waterfowl survey (Hunt et al. 1982). Significance for this and all other statistical tests were at the P < 0.05 level.
Wetlands were censused in the nine WPAs from the ground for duck pairs and broods (Bennett 1967) twice in May and June. Wetland margins were walked in the early morning hours to flush all waterfowl present, with
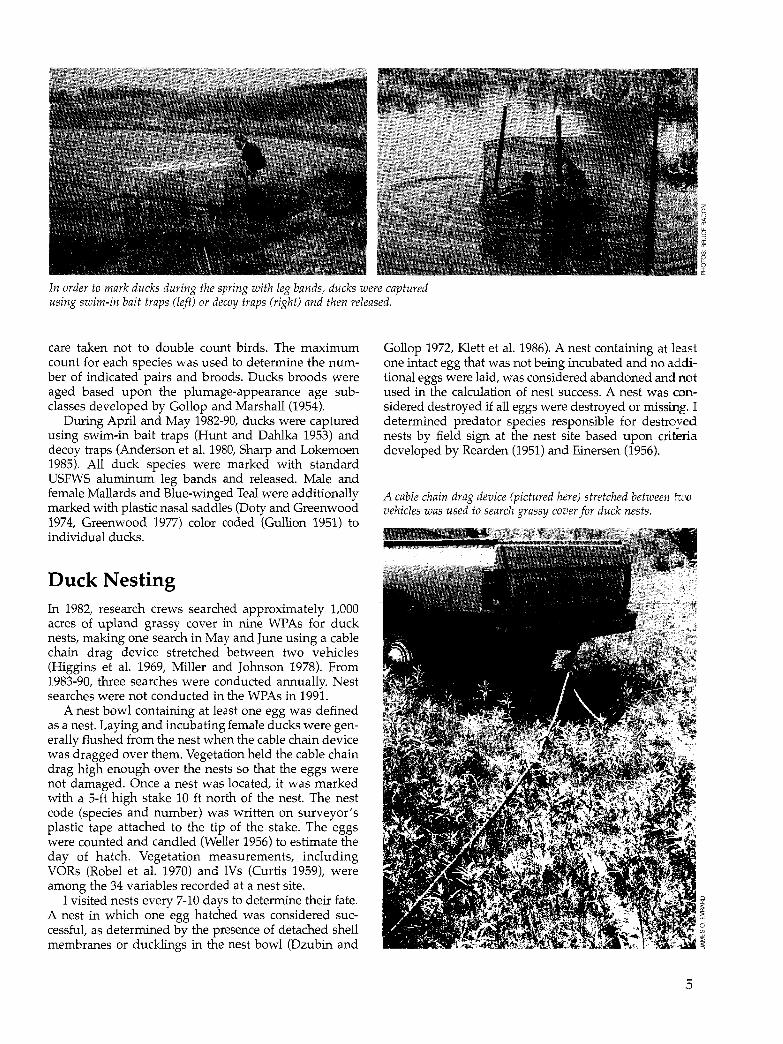
In order to mark ducks during the spring with leg bands, ducks were captured using swim-in bait traps (left) or decoy traps (right) and then released.
care taken not to double count birds. The maximum count for each species was used to determine the number of indicated pairs and broods. Ducks broods were aged based upon the plumage-appearance age subclasses developed by Gallop and Marshall (1954).
During April and May 1982-90, ducks were captured using swim-in bait traps (Hunt and Dahlka 1953) and decoy traps (Anderson et al. 1980, Sharp and Lokemoen 1985). All duck species were marked with standard USFWS aluminum leg bands and released. Male and female Mallards and Blue-winged Teal were additionally marked with plastic nasal saddles (Doty and Greenwood 1974, Greenwood 1977) color coded (Gullion 1951) to individual ducks.
Duck Nesting In 1982, research crews searched approximately 1,000 acres of upland grassy cover in nine WPAs for duck nests, making one search in May and June using a cable chain drag device stretched between two vehicles (Higgins et al. 1969, Miller and Johnson 1978). From 1983-90, three searches were conducted annually. Nest searches were not conducted in the WPAs in 1991.
A nest bowl containing at least one egg was defined as a nest. Laying and incubating female ducks were generally flushed from the nest when the cable chain device was dragged over them. Vegetation held the cable chain drag high enough over the nests so that the eggs were not damaged. Once a nest was located, it was marked with a 5-ft high stake 10 ft north of the nest. The nest code (species and number) was written on surveyor's plastic tape attached to the tip of the stake. The eggs were counted and candled (Weller 1956) to estimate the day of hatch. Vegetation measurements, including VORs (Robel et al. 1970) and IVs (Curtis 1959), were among the 34 variables recorded at a nest site.
I visited nests every 7-10 days to determine their fate. A nest in which one egg hatched was considered successful, as determined by the presence of detached shell membranes or ducklings in the nest bowl (Dzubin and
Gallop 1972, Klett et al. 1986). A nest containing at least one intact egg that was not being incubated and no additional eggs were laid, was considered abandoned and not used in the calculation of nest success. A nest was considered destroyed if all eggs were destroyed or missing. I determined predator species responsible for destroyed nests by field sign at the nest site based upon criteria developed by Rearden (1951) and Einersen (1956).
A cable chain drag device (pictured here) stretched between fwo vehicles was used to search grassy cover for duck nests.
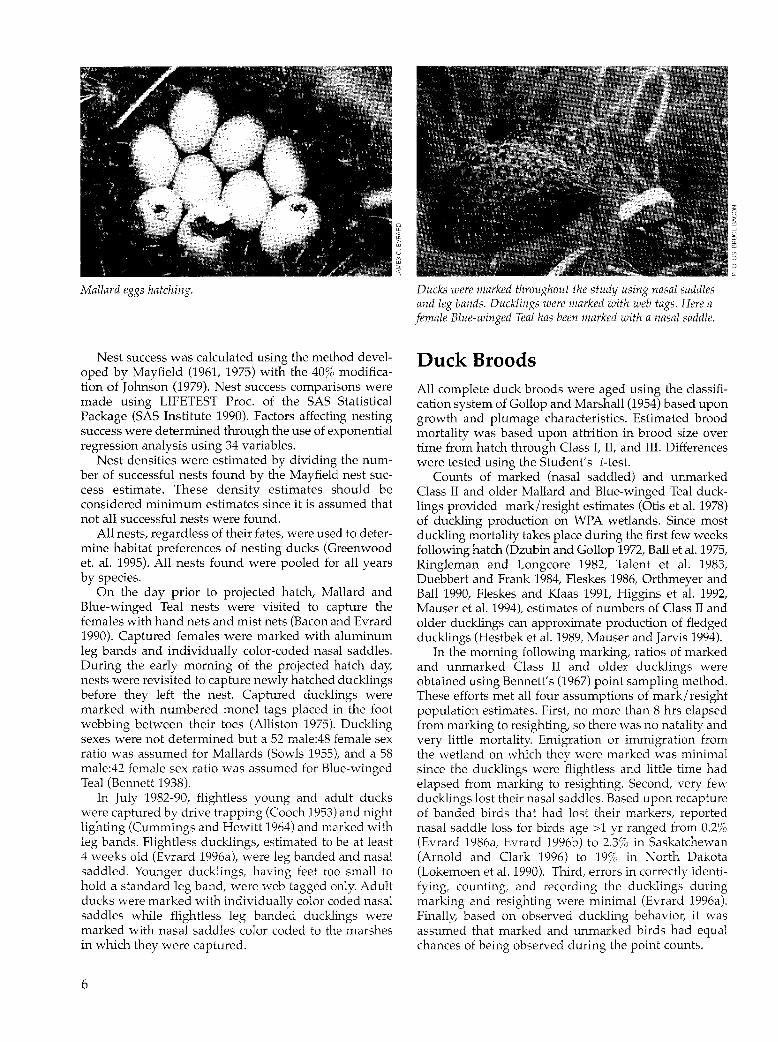
Mallard eggs hatching.
Nest success was calculated using the method developed by Mayfield (1961, 1975) with the 40% modification of Johnson (1979). Nest success comparisons were made using LIFETEST Proc. of the SAS Statistical Package (SAS Institute 1990). Factors affecting nesting success were determined through the use of exponential regression analysis using 34 variables.
Nest densities were estimated by dividing the number of successful nests found by the Mayfield nest success estimate. These density estimates should be considered minimum estimates since it is assumed that not all successful nests were found.
All nests, regardless of their fates, were used to determine habitat preferences of nesting ducks (Greenwood et. al. 1995). All nests found were pooled for all years by species.
On the day prior to projected hatch, Mallard and Blue-winged Teal nests were visited to capture the females with hand nets and mist nets (Bacon and Evrard 1990). Captured females were marked with aluminum leg bands and individually color-coded nasal saddles. During the early morning of the projected hatch day, nests were revisited to capture newly hatched ducklings before they left the nest. Captured ducklings were marked with numbered monel tags placed in the foot webbing between their toes (Alliston 1975). Duckling sexes were not determined but a 52 male:48 female sex ratio was assumed for Mallards (Sowls 1955), and a 58 male:42 female sex ratio was assumed for Blue-winged Teal (Bennett 1938).
In July 1982-90, flightless young and adult ducks were captured by drive trapping (Cooch 1953) and night lighting (Cummings and Hewitt 1964) and marked with leg bands. Flightless ducklings, estimated to be at least 4 weeks old (Evrard 1996a), were leg banded and nasal saddled. Younger ducklings, having feet too small to hold a standard leg band, were web tagged only. Adult ducks were marked with individually color coded nasal saddles while flightless leg banded ducklings were marked with nasal saddles color coded to the marshes in which they were captured.
6
Ducks were marked throughout the study using nasal saddles and leg bands. Ducklings were marked with web tags. Here a female Blue-winged Teal has been marked with a nasal saddle.
Duck Broods All complete duck broods were aged using the classification system of Gallop and Marshall (1954) based upon growth and plumage characteristics. Estimated brood mortality was based upon attrition in brood size over time from hatch through Class I, II, and III. Differences were tested using the Student's t-test.
Counts of marked (nasal saddled) and unmarked Class II and older Mallard and Blue-winged Teal ducklings provided mark/ resight estimates (Otis et al. 1978) of duckling production on WPA wetlands. Since most duckling mortality takes place during the first few weeks following hatch (Dzubin and Gallop 1972, Ballet al. 1975, Ringleman and Longcore 1982, Talent et al. 1983, Duebbert and Frank 1984, Fleskes 1986, Orthmeyer and Ball 1990, Fleskes and Klaas 1991, Higgins et al. 1992, Mauser et al. 1994), estimates of numbers of Class II and older ducklings can approximate production of fledged ducklings (Hestbek et al. 1989, Mauser and Jarvis 1994).
In the morning following marking, ratios of marked and unmarked Class II and older ducklings were obtained using Bennett's (1967) point sampling method. These efforts met all four assumptions of mark/ resight population estimates. First, no more than 8 hrs elapsed from marking to resighting, so there was no natality and very little mortality. Emigration or immigration from the wetland on which thev were marked was minimal since the ducklings were flightless and little time had elapsed from marking to resighting. Second, very few ducklings lost their nasal saddles. Based upon recapture of banded birds that had lost their markers, reported nasal saddle loss for birds age > 1 yr ranged from 0.2% (Evrard 1986a, Evrard 1996b) to 2.3% in Saskatchewan (Arnold and Clark 1996) to 19% in North Dakota (Lokemoen et al. 1990). Third, errors in correctly identifying, counting, and recording the ducklings during marking and resighting were minimal (Evrard 1996a). Finally, based on observed duckling behavior, it was assumed that marked and unmarked birds had equal chances of being observed during the point counts.

ln August and September, flying young and adult ducks were captured using swim-in bait traps and marked with leg bands. NasaJ saddle codes, leg band, and wC'b tag numbers were recorded when marked ducks were resightcd and rccaph.1rcd throughout the year.
Banded birds were sepamted by sex into three age classes: adult, immature, and local. An adult is classified as a bird hatched before the yea r of banding; an immature is classified as a hatching year bird capable of fli ght; and a local is classified as a hatching year bird not yet capable of flight (Munro and Kimball 1982). Immature and local birds were combined into a young class. Chisquare analysis was used to determine if differences exist between the recovery rates of the various age and sex cohorts.
Duck Concentration Sites Although no forma l surveys were conducted i.n the spring, summer, or fall to de termine waterfow l concentration s ites, g roups of waterfowl encountexed within the st-udy area were noted, with priority given to recording wa terfow l concentrations contajning marked birds .
ln conjunction with formal USFWS surveys, winter (December and january) waterfowl coUJ1ts at known and suspected concentration sites were taken from aircraft and from the ground by DNR personnel. Open water areas of the Kinnikinn.ic, Apple, Willow, and St. Croix Rivers were censused, including several spring-fed ponds.
Predator and Alternate Prey Surveys Three indirect indices (counts of pocket gopher mounds, counts of fossor ial mammal burrows, and small mammal trapping) and three direct indices (roadki,ll, scent station, and spotlight surveys) were used to determine how predator popu lations and selected prey fluctuated in relation to waterfowl nest success. Differences and relationships were tested using the Student's /-test and correlation coefficients.
Numbers of pocket gopher (Geomys bursarius) mounds and fossorial mamm<1l burrows within the 33-ft diameter vegetation sampling plots were used as indices to asses prey availabil ity and potential nest predators.
Small mammal trapping provided another prey index (Zippen 195R). Small mamma ls were snap trapped in 12 different nesti ng fields i11 S WPAs each year from 1982-90. Th~: n ~:s ling fidds w~:r~: man<~g~:d l>y bw:nj11g, nwwi.ng, and cultivation, representing nest cover of various ages (i.e. Lime after management disturbance). Six grids of 50 snap traps each were set for two lO-day periods in June and July each year. five rows of 10 traps (40 mouse- and 10 rat-sized) were placed in each 0.7 acre rectangular grid. Trap locations were marked with orange surveyor's tape. The traps were baited with peanut butter and checked daily. Fields trapped were chosen to represent sera! vegetation stages produced by lhe management
techniques listed above. A ca tch per effort statiStic, adjusted for snapped traps (Nelson and Clark 1973), wa~ used as a simple index for sm<.11l mammal populations.
Road killed predators were recorded on all ~tudy area roads April th1·ough October fro m 1982-90. Dist<mces that vehicles were driven withjn the !>tudy area during the same period were recorded. No estimates of traffic volume were available. The index used wa!> expressed as road killed predators per 1,000 mi driven. McCiun: (1951) and Case (1978) conclude that road kills proviJe information for monitoring wild life popu lations. Verts (1967) and Rolley and Lehman (19Y2) use road kill data to compare regional stTiped skunk (Mephitis mephitis ) and common raccoon (l)rocyo11 Ialor) populations.
A scent s ta tion survey (Linhart and Know lton 1975) cons is ts of 10 lines 2 mi long along secondary rands, 5 adjacent to WPAs and 5 in private lands (PL) (Rough tun and Sweeny 1982). The line transects were loca ted > 'I mi apart to prevent biases from mobile predators. Each transect had 10 scent stations spaced 0.2 mi apa rt ond were located in a grassy ditch adjacent to the road. About 30% of the WPA tram;ects were adjacent to public wildlife management lnnds. The PL transects were > 1 mi fTom the nea rest WPA,
Each scent station consisted of a 3-ft diameter d rclc of bare, finely sifted sand. The stations were treated each autumn with a soil sterila11 t herbicide to conh·ol vegetation encroachment. A single fatty acid scent (f-AS) tablet (Houghton 1982) was placed in the center of the freshly silted sand. The stations were revisited the following moming, recording aruma! sign, and removing the FAS tablet. Each FAS tablet was used only once. Transects were run monthly from May through Aub'\.ISt in 1984-90.
Two road spotlight transects (Rybarc:~.yk et at. 1 SlRl) were selected with one traversing an a rea with li ttle public wildli fe management properties (PL) and the other traversing an area with cons id erably more pllblic lands (WPA).
Maki11g n St"l'llf stntio11.
7

The PL transect was 25 mi long from which 7,360 acres (woods were excluded due to leaf out) were searched. Wildlife management lands adjacent to the road were 7% of the total transect. The WPA transect was 26 mi long from which 7,044 acres (woods excluded) were searched. Wildlife management land adjacent to the road was 22% of the total transect. Nearly 5% of the study area was included within these two transects.
Roads were driven at 10-15 mph one hour after sunset on nights of high humidity. Roads were driven three times annually in late April (after leafout) and May, 2 weeks apart from 1984-90. Transect route directions were alternated. Two observers, including the driver, each used 200,000-candle power spotlights to search habitat to a distance of 0.25 mi on each side of the road. Binoculars and occasionally a 20X scope were used to identify animals. Dogs were not recorded. Surveys were not conducted during high winds, low humidity, rain, fog, or below freezing temperatures.
RESULTS AND DISCUSSION
Wetland Density During the first 5 years of the study, the number of wetlands in the study area was relatively stable (Table 1). Wetland density, however, was less than that found in the Northern High Region (13.0 I mi2, Andryk et al. 1991)during the same period (t=3.156, df=8, P=0.01). There was a significant relationship between total wetland densities compared to the Northern High Region during the ten years of the study (r=0.745, t=3.155, P=0.01). During a drought period from late 1986 through 1988, temporary wetlands (Types I, VII, and VIII, Shaw and Fredine 1956) disappeared and densities of more permanent wetlands declined (Table 1).
Wetland Occupancy Waterfowl occupancy rates followed a trend similar to wetland occurrence. Mean occupancy for all wetlands in the 10 years of the study was 28.5%, ranging from 19% to 43% (Table 2). Occupancy dropped dramatically throughout the drought period from 1986 to 1988. With the return to normal precipitation in 1989, wetland occupancy rose along with wetland densities (Tables 1 and 2). Occupancy
8
Duck Harvest DNR crews interviewed hunters in St. Croix County during the first 2 days of the 1982-91 duck hunting seasons. Crews drove through the county beginning at noon on the opening day of the season and in the early morning of the second day, counting all vehicles of suspected duck hunters on public and private lands. The numbers of hunters and vehicles involved in interviews were also recorded. Crews asked hunters encountered if they had bagged any ducks and how many hours they had hunted. Any ducks bagged were checked to determine species, sex, age, and for the presence of web tags, bands, and nasal saddles.
Hunter numbers were determined by multiplying the number of vehicles counted by the mean number of hunters per vehicle involved in the interviews. Relative hunter success was expressed as the number of ducks bagged per hunter trip Qahn and Hunt 1964). Minimum estimated duck harvest for the first 2 days of the season, an index to the total season harvest, was determined by multiplying hunter success by hunter numbers. Hunter effort was determined by calculating the number of hours hunted to bag a bird.
rates from previous Wisconsin studies ranged from 11% in the central plain Qahn and Hunt 1964) to 56% in southeastern Wisconsin (Wheeler and March 1979). The more permanent wetlands (Types III, IV, and V) in my study area had consistently higher occupancy rates than the more temporary wetland (Types I, II, VI, and VII) (Table 2). Occupancy rates for streams and ditches were low (Table 2). This agrees with earlier work done iri. Wisconsin (March et al. 1973, Wheeler and March 1979, Petersen et al. 1982, Andryk et al. 1991) and Minnesota (Lee et al. 1964).
Spring Duck Concentration Sites Ducks favored flooded fields and other temporary wetlands when they arrived in the spring. This was probably a response to food availability. Concentration sites included publicly owned areas (Oakridge Lake, Ausen Pond, Hanten Pond, Lundy Pond, Amschler WPAs, and Morden Extensive Wildlife Habitat Unit (EWHU)) and privately held wetlands (Bootie Lake, Twin Lakes, and Derrick Pond) (Fig. 1). These larger, more permanent wetlands also served as roost sites. The largest number of ducks observed at any one site in the spring was 1,800 birds on Oakridge Lake in 1990 (Table 3).

Table 1. Wetlands per mi2 of study area determined by aerial surveys in May, 1982-91. Shaded years denote drought years.
Year
1982 1983 1984 1985 1989 1990 1991 Mean
Wetland Type" I 1.3 1.0 1.6 0.4 {).0 0.4 0.4 2.2 1.0 II and VI 1.8 3.7 4.6 2.7 1:5. 2.6 3.0 3.4 3.0 III 2.2 1.1 1.5 1.5 1.7; 1.8 1.7 2.2 1.7 IV 1.8 1.2 1.8 2.1 1;2 2.4 2.5 2.6 1.9 v 3.8 2.7 2.2 2.1 1.() 2.3 1.5 2.5 2.2 VII and VIII 0.4 0.2 1.1 0.5 0.0 0.3 0.2 0.8 0.4
Subtotal 11.3 9.3 12.8 9.3 13:4. 6.3 9.8 9.2 13.7 10.2 Streams 2.1 1.4 2.4 1.7 1.3 1.3. 1.8 1.7 1.8 2.0 1.8 Ditches 0.3 0.5 0.5 0.4 0.2 0.1. 0.2 0.1 0.3 0.3 0.3
Total 13.7 11.2 15.7 11.4 14.9 7.2 8.5 11.6 11.3 16.0 12.3
awetland types taken from Shaw and Fredine 1956.
Table 2. Percent of study area wetlands occupied by ducks as determined by ground transect, May, 1982-91. Shaded years denote drought years.
Year
1982 1983 1984 1985 19.88 1989 1990 1991 Mean
Wetland Type" I 12 0 0 0 33 0 0 4.5 II and VI 12 7 18 23 12 0 11 12.2 III 27 33 67 46 36 50 54 34.3 IV 54 40 60 50 60 44 70 50.1 v 50 67 0 0 100 0 33 36.7 VII and VIII 0 0 0 0 0 0 0 0.0
Subtotal 27 29 29 28 41 33 43 28.5 Streams 25 0 0 0 50 33 0 25 21.6 Ditches 0 0 0 0 0 0 0 0 0.0
Total 26 26 31 26 41 33 41 28.7 3 Wetland Types taken from Shaw and Fredine 1956.
Table 3. Peak spring, fall, and winter duck observations, St. Croix and Polk counties, 1982-91.
Year Season Date Location No. Ducks Observed No. Species Observed
1982•83 Twin Lakes ···10 Oakridge Lake (dosed area)
1983-84 Spring 19Apr North Fish Lake 250 2 Fall 25 Oct Oakridge Lake (closed area) 2,000 1
1984-85 Spring 14Apr Flooded cornfield 269 6 Fall 14Nov Oakridge Lake (closed area) 998 6 Winter 12Feb St. Croix River, Hudson 380 3
1985-86 Spring 27Mar Twin Lakes 400 6 Fall 2 Oct Amschler WPA 297 3 Winter 9 Jan St. Croix River, Hudson 242 2
1986-87 Spring 21Apr Cedar Lake 249 5 Fall 3Nov East Twin Lake 950 5 Wmter 8Jan St. Croix River, Hudson 431 4
1987-88 Spring 26Mar Ausen WPA 361 5 Fall 170ct Oakridge Lake (closed area) 1,102 7 Winter 8 Jan St. Croix River, Hudson 502 4
1988-89 Spring 5Apr Oakridge Lake (closed area) 300 1 Fall 70ct Oakridge Lake (dosed area) 580 3 Wmter 4Jan St. Croix River, Hudson 347 1
1989-90 Spring 19Apr Morden WPA 500 8 Fall 14Nov Oakridge Lake (closed area) 5,050 3 Winter 12 Feb St. Croix River, Hudson 360 3
1990-91 Spring 10Apr Oakridge Lake (dosed area) 1,800 Fall 31 Oct Oakridge Lake (closed area) 3,420 3 Wmter 10Dec St. Croix River, Hudson 1,136 5
1991-92 Spring 19Mar Apple River, Johannesburg 113 4 Fall 5 Oct Oakridge Lake (closed area) 1,300 2
9
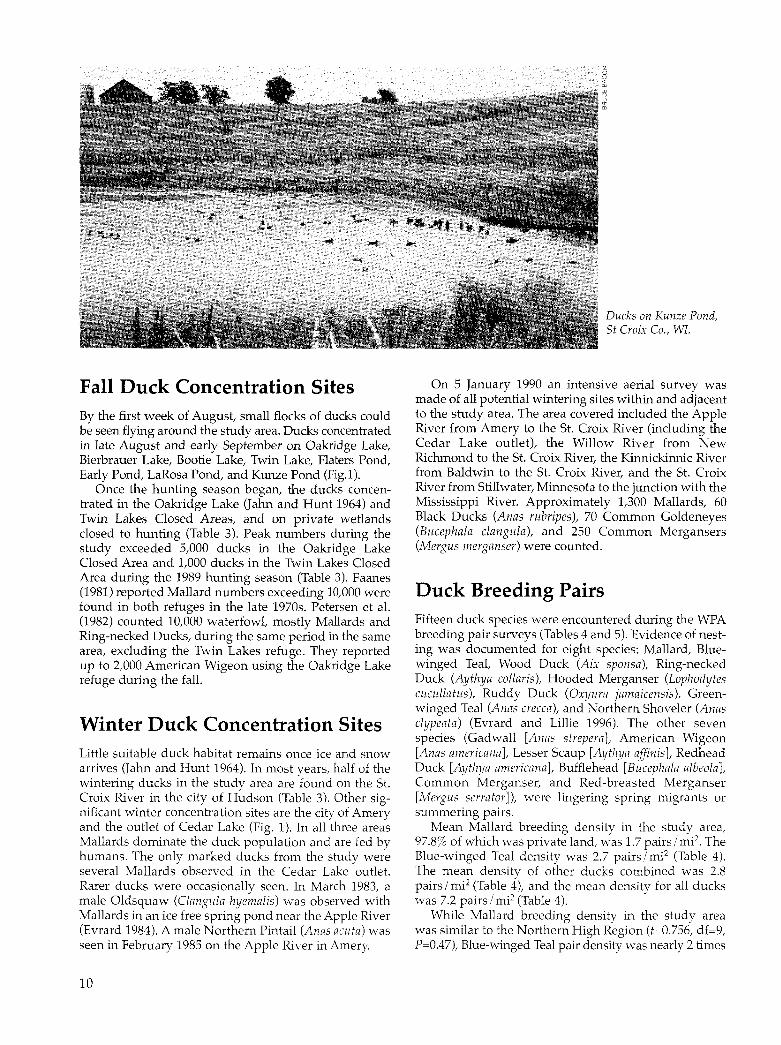
Fall Duck Concentration Sites By the first week of August, small flocks of ducks could be seen flying around the study area. Ducks concentrated in late August and early September on Oakridge Lake, Bierbrauer Lake, Bootie Lake, Twin Lake, Platers Pond, Early Pond, LaRosa Pond, and Kunze Pond (Fig.l).
Once the hunting season began, the ducks concentrated in the Oakridge Lake (Jahn and Hunt 1964) and Twin Lakes Closed Areas, and on private wetlands closed to hunting (Table 3). Peak numbers during the study exceeded 5,000 ducks in the Oakridge Lake Closed Area and 1,000 ducks in the Twin Lakes Closed Area during the 1989 hunting season (Table 3). Faanes (1981) reported Mallard numbers exceeding 10,000 were found in both refuges in the late 1970s. Petersen et al. (1982) counted 10,000 waterfowl, mostly Mallards and Ring-necked Ducks, during the same period in the same area, excluding the Twin Lakes refuge. They reported up to 2,000 American Wigeon using the Oakridge Lake refuge during the fall.
Winter Duck Concentration Sites Little suitable duck habitat remains once ice and snow arrives (Jahn and Hunt 1964). In most years, half of the wintering ducks in the study area are found on the St. Croix River in the city of Hudson (Table 3). Other significant winter concentration sites are the city of Amery and the outlet of Cedar Lake (Fig. 1). In all three areas Mallards dominate the duck population and are fed by humans. The only marked ducks from the study were several Mallards observed in the Cedar Lake outlet. Rarer ducks were occasionally seen. In March 1983, a male Oldsquaw (Clangula hyemalis) was observed with Mallards in an ice free spring pond near the Apple River (Evrard 1984). A male Northern Pintail (Anas acuta) was seen in February 1985 on the Apple River in Amery.
10
Ducks on Kunze Pond, St Croix Co., WI.
On 5 January 1990 an intensive aerial survey was made of all potential wintering sites within and adjacent to the study area. The area covered included the Apple River from Amery to the St. Croix River (including the Cedar Lake outlet), the Willow River from New Richmond to the St. Croix River, the Kinnickinnic River from Baldwin to the St. Croix River, and the St. Croix River from Stillwater, Minnesota to the junction with the Mississippi River. Approximately 1,300 Mallards, 60 Black Ducks (Anas rubripes ), 70 Common Goldeneyes (Bucephala clangula), and 250 Common Mergansers (Mergus merganser) were counted.
Duck Breeding Pairs Fifteen duck species were encountered during the WPA breeding pair surveys (Tables 4 and 5). Evidence of nesting was documented for eight species: Mallard, Bluewinged Teal, Wood Duck (Aix sponsa), Ring-necked Duck (Aythya collaris), Hooded Merganser (Lophodytes cucullatus), Ruddy Duck (Oxyura jamaicensis), Greenwinged Teal (Anas crecca), and Northern Shoveler (Anas clypeata) (Evrard and Lillie 1996). The other seven species (Gadwall [Anas strepera], American Wigeon [Anas americana], Lesser Scaup [Aythya affinis], Redhead Duck [Aythya americana], Bufflehead [Bucephala albeola], Common Merganser, and Red-breasted Merganser [Mergus serrator]), were lingering spring migrants or summering pairs.
Mean Mallard breeding density in the study area, 97.8% of which was private land, was 1.7 pairs I mi2. The Blue-winged Teal density was 2.7 pairs/ mi2 (Table 4). The mean density of other ducks combined was 2.8 pairs I mi2 (Table 4), and the mean density for all ducks was 7.2 pairs I mi2 (Table 4).
While Mallard breeding density in the study area was similar to the Northern High Region (t=0.756, df=9, P=0.47), Blue-winged Teal pair density was nearly 2 times

greater in the study area compared the the Northern High Region (t=3.88, df=9, P=0.004). There was no difference in mean pair density for other ducks (t=0.567, df=9, P=0.58) and for total ducks (t=1.442, df=9, P=0.18) when compared to the Northern High Region.
The Mallard and Blue-winged Teal pair estimates for this study (Table 4) were within the lower limits of the 95% confidence interval reported by Petersen et al. (1982). Breeding pair densities reported in this study were comparable to other areas in the state. Wheeler and March (1979) estimated a total duck breeding density of 8.8 pairs/mi2 (1.8 Mallard, 5.7 Blue-winged Teal, and 1.3 other ducks) from helicopter surveys in southeastern Wisconsin. In another southern Wisconsin study, Wheeler et al. (1984) indicated a total breeding density of 5.2 pairs/mi2 (1.8 Mallard, 2.6 Bluewinged Teal, and 0.8 other ducks).
As would be expected within the study area, breeding pair densities were significantly higher on WPAs than on private land (t=12.320, df=9, P<O.OOOOOl). There was no synchrony in density changes from year to year (r=-0.258, t=0.754, P=0.47) (Table 5). Mean Mallard breeding pair density was 18 pairs/mi2
and mean Blue-winged Teal density was 29 pairs/mi2 in the WPA (Table 5). Pair densities of other ducks ranged from 12 to 39 pairs/mi2 in the WPA. The mean pair density estimate for all ducks was 69 pairs/mi2.
In the same study area, Petersen et al. (1982) reported mean WPA breeding pair
Table 4. Duck breeding pair estimates for study area, 1982-91.
Breeding Air/Ground Breeding Breeding Year/Species Pair Index Ratio• Pair Estimate Pairs/mF
1982 Mallard Blue-winged Teal Other<
Total 1983
Mallard Blue-winged Teal Other
Total 1984 Mallar<~ Blue-winged Teal Other
Total 1985
Mallard Blue-winged Teal Other
Total 1986
Mallard Blue-winged Teal Other
Total 1987
Mallard 131ue-winged Teal Other
Total 1988
Mallard Blue-winged Teal Other
Total 1989
Mallard Blue-winged Teal Other
Total 1990
Mallard Blue-winged Teal Other
Total 1991
Mallard Blue-winged Teal Other
Total
480 360 110 950
450 290 110 850
350 240 120 710
530 550 190
1,270
240 180 60
480
470 530 150
1,150
340 280 260 880
660 440 170
1,270
520 530 160
1,210
570 410 100
1,080
0.46 0.28 0.08
0.64 0.14 0.07
0.64 0.09 0.06
0.32 0.375 0.035
0.20 0.30 0.19
0.69 0.31 0.29
0.70 0.31 0.28
0.88 0.60 0.21
0.66 0.335 0.25
0.775 0.731 0.258
l,D40 (28)b 1,290 (35) 1,380{37) 3,71D
750 (17) 2,070 (47) 1,570 (36) 4,390
550 (10) 2,670 (51) 2,000 (39) 5,220
1,660 (19) 1,470 (17) 5,430 (64) 8,560
1,200 (57) 600 (29) 320 (14)
2,100
680 (24) 1,710 (58)
520 (18) 2,910
490 (21) 900 (39) 930 (40)
2,320
750 (33) 730 (32) 810 (35)
2,290
790 (26) 1,580 (52)
640 (22) 3,010
730 (44) 560 (33) 390 (23)
1,680
a Derived from statewide aerial surveys (Andryk et al. 1991). b Numbers in parentheses represent percent of total. c Other species include: Green-winged Teal, Shoveler, Wood Duck,
Ring-necked Duck, Lesser Scaup, Bufflehead, and Hooded Merganser.
2.1 2.6 2.7 7.4
1.4 4.1 3.1 8.6
1.1 5.3 4.0
lOA
3.3 2.9
10.8 17.0
2.4 1.2 0.6 4.2
1.3 3.4 1.0 5.7
1.0 1.8 1.8 4.6
1.5 1.4 1.5 4.5
1.6 3.1 1.2 5.9
1.5 1.1 0.8 3.4
11
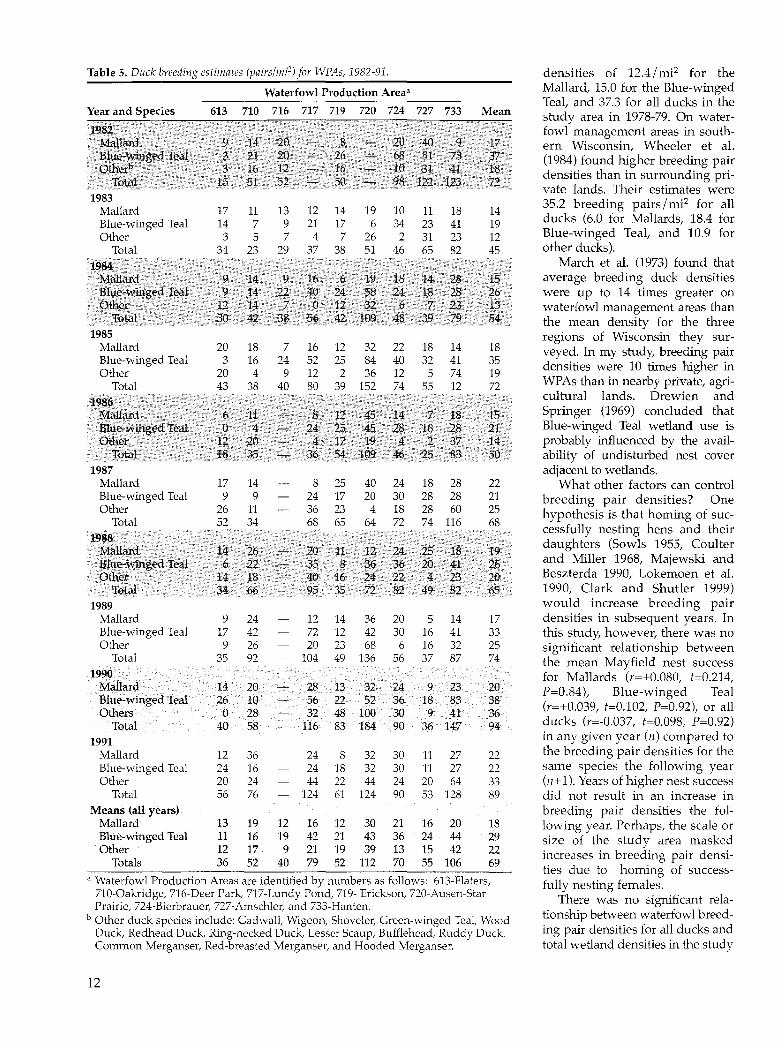
Table 5. Duck breeding estimates (pairs/mi2) for WPAs, 1982-91. densities of 12.4/mi2 for the
Waterfowl Production Area• Mallard, 15.0 for the Blue-winged
Year and Species 613 710 716 717 719 720 724 727 733 Mean Teal, and 37.3 for all ducks in the study area in 1978-79. On water-
19$2 fowl management areas in south-Mallani 9 14 20 8 2lJ \40 9 17 ern Wisconsin, Wheeler et al. Blue~vyinged real .3 2l ~Q 26 68 51 73 37 (1984) found higher breeding pair othe~· · · · 3 16 12\ J6. 10 31 41 is densities than in surrounding pri-
Totru' 15 51 52 50 98 1~ 123· V2 vate lands. Their estimates were
1983 35.2 breeding pairs I mi2 for all Mallard 17 11 13 12 14 19 10 11 18 14 Blue-winged Teal 14 7 9 21 17 6 34 23 41 19 ducks (6.0 for Mallards, 18.4 for
Other 3 5 7 4 7 26 2 31 23 12 Blue-winged Teal, and 10.9 for Total 34 23 29 37 38 51 46 65 82 45 other ducks).
1984 March et al. (1973) found that Mallard 9 14 9, 16 6 19 18 14 2.8 15 average breeding duck densities ~~~,.t~winged real 9 14 22 40 24 58 24 18 28 26 were up to 14 times greater on ·.Qther 12 14 .7. 0 12··· 31 6·< 7 23 13 waterfowl management areas than
· 'total 30 42 38 56 42 109. 48 39 79 54 the mean density for the three 1985 regions of Wisconsin they sur-
Mallard 20 18 7 16 12 32 22 18 14 18 veyed. In my study, breeding pair Blue-winged Teal 3 16 24 52 25 84 40 32 41 35 densities were 10 times higher in Other 20 4 9 12 2 36 12 5 74 19
Total 43 38 40 so 39 152 74 55 12 72 WPAs than in nearby private, agri-
1986 cultural lands. Drewien and
M:a1l~a 6 i1 ~ 8 12 45 14 18 15 Springer (1969) concluded that
Blue-winged Tea} 0 4 .- 24 25 45 28 16 2$ 21 Blue-winged Teal wetland use is other 12 20 4 .· 17 . 19 .4 2 37 14 probably influenced by the avail-
'rota~ 18 315 36 54 109 46 25 83 50 ability of undisturbed nest cover 1987 adjacent to wetlands.
Mallard 17 14 8 25 40 24 18 28 22 What other factors can control Blue-winged Teal 9 9 24 17 20 30 28 28 21 breeding pair densities? One Other 26 11 36 23 4 18 28 60 25 hypothesis is that homing of sue-
Total 52 34 68 65 64 72 74 116 68 1988
cessfully nesting hens and their
Mallard 1.4 26 20. 11 12 24 25 18 19 daughters (Sowls 1955, Coulter
Bll!:e~winged Teal 6 22 35 8 36 36 2.0 41 26 and Miller 1968, Majewski and
other 14 18 40 16 24 22 4 23 2.0 Beszterda 1990, Lokemoen et al. Total 34 66 95 35 72 82 49 82 65 1990, Clark and Shutler 1999)
1989 would increase breeding pair Mallard 9 24 12 14 36 20 5 14 17 densities in subsequent years. In Blue-winged Teal 17 42 72 12 42 30 16 41 33 this study, however, there was no Other 9 26 20 23 68 6 16 32 25 significant relationship between
Total 35 92 104 49 136 56 37 87 74 the mean Mayfield nest success 1990 for Mallards (r=+0.080, f=0.214,
Mallard 14 20 28 13 32 24 9 23 20 P=0.84), Blue-winged Teal Blue-winged Teal 26 10 56 22 52 36 18 83 38 (r=+0.039, t=0.102, P=0.92), or all Others 0 28 32 48 100 30 9 41 36
Total 40 58 116 83 184 90 36 147 94 ducks (r=-0.037, t=0.098, P=0.92)
1991 in any given year (n) compared to
Mallard 12 36 24 8 32 30 11 27 22 the breeding pair densities for the Blue-winged Teal 24 16 24 18 32 30 11 27 22 same species the following year Other 20 24 44 22 44 24 20 64 33 (n+ 1). Years of higher nest success
Total 56 76 124 61 124 90 53 128 89 did not result in an increase in Means (all years) breeding pair densities the fol-
Mallard 13 19 12 16 12 30 21 16 20 18 lowing year. Perhaps, the scale or Blue-winged Teal 11 16 19 42 21 43 36 24 44 29 size of the study area masked Other 12 17 9 21 19 39 13 15 42 22 increases in breeding pair densi-
Totals 36 52 40 79 52 112 70 55 106 69 ties due to homing of success-
a Waterfowl Production Areas are identified by numbers as follows: 613-Flaters, fully nesting females. 710-0akridge, 716-Deer Park, 717-Lundy Pond, 719- Erickson, 720-Ausen-Star There was no significant rela-Prairie, 724-Bierbrauer, 727-Amschler, and 733-Hanten.
b Other duck species include: Gadwall, Wigeon, Shoveler, Green-winged Teal, Wood tionship between waterfowl breed-
Duck, Redhead Duck, Ring-necked Duck, Lesser Scaup, Bufflehead, Ruddy Duck, ing pair densities for all ducks and Common Merganser, Red-breasted Merganser, and Hooded Merganser. total wetland densities in the study
12
area (r=-0.040, t=0.112, P=0.91). The same lack of relationship was evident when comparing only wetlands with the highest occupancy by all ducks, Types III, IV, and V (r=-0.161, t=0.462, P=0.66). These results agree with those reported by March et al. (1973) for Wisconsin, but are contrary to what Krapu et al. (1983) found in eastern North Dakota for Mallards and what Leitch and Kaminski (1985) found in Saskatchewan for Blue-winged Teal, where breeding pair densities increased with an increase in density of May ponds or wetlands.
When examining individual wetlands types, a significant relationship was found between Type III wetland densities and Blue-winged Teal breeding pair densities (r=-0.688, t= 2.683, P=0.03). As the density of Type III wetlands in the study area increased, teal breeding pair densities decreased. Reasons for this response are unclear.
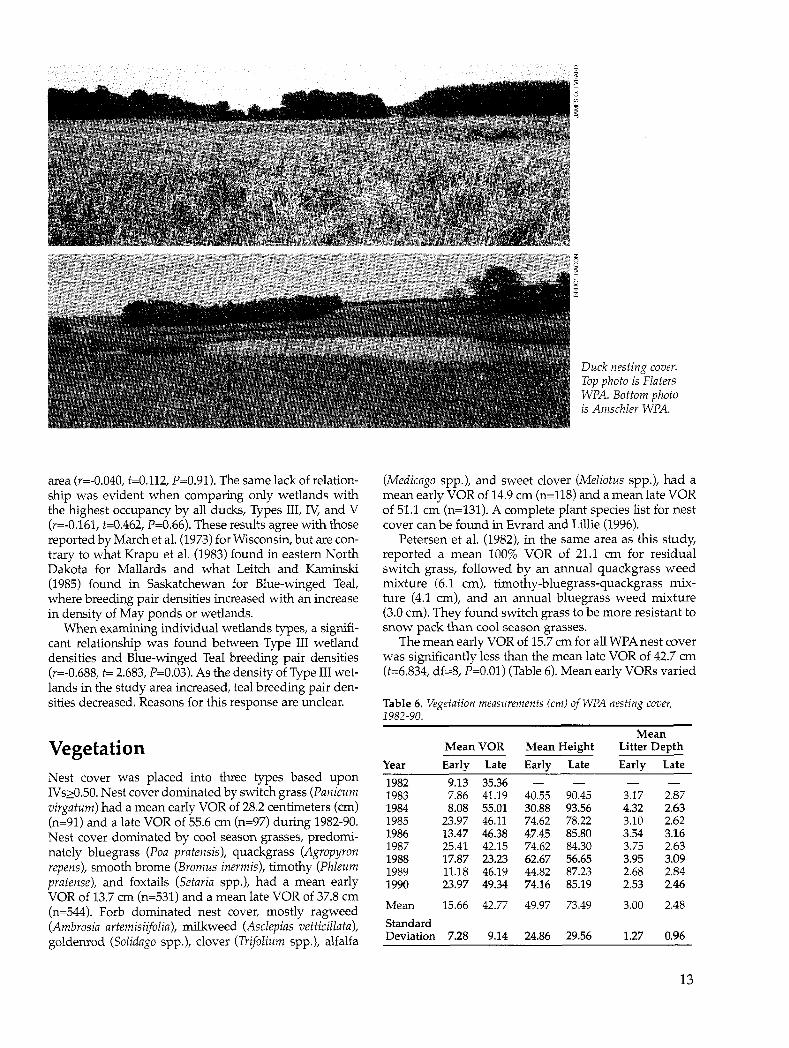
Vegetation Nest cover was placed into three types based upon IVs;::::0.50. Nest cover dominated by switch grass (Panicum virgatum) had a mean early VOR of 28.2 centimeters (em) (n=91) and a late VOR of 55.6 em (n=97) during 1982-90. Nest cover dominated by cool season grasses, predomi-nately bluegrass (Poa pratensis ), quackgrass (Agropyron repens ), smooth brome (Bromus inermis ), timothy (Phleum pratense), and foxtails (Setaria spp.), had a mean early VOR of 13.7 em (n=531) and a mean late VOR of 37.8 em (n=544). Forb dominated nest cover, mostly ragweed (Ambrosia artemisiifolia), milkweed (Asclepias vetticillata), goldemod (Solidago spp.), clover (Trifolium spp.), alfalfa
Duck nesting cover. Top photo is Flaters WPA. Bottom photo is Amschler WPA.
(Medicago spp.), and sweet clover (Meliotus spp.), had a mean early VOR of 14.9 em (n=ll8) and a mean late VOR of 51.1 em (n=131). A complete plant species list for nest cover can be found in Evrard and Lillie (1996).
Petersen et al. (1982), in the same area as this study, reported a mean 100% VOR of 21.1 em for residual switch grass, followed by an annual quackgrass weed mixture (6.1 em), timothy-bluegrass-quackgrass mixture (4.1 em), and an annual bluegrass weed mixture (3.0 em). They found switch grass to be more resistant to snow pack than cool season grasses.
The mean early VOR of 15.7 em for all WPA nest cover was significantly less than the mean late VOR of 42.7 em (t=6.834, df=8, P=O.Ol) (Table 6). Mean early VORs varied
Table 6. Vegetation measurements (em) ofWPA nesting cover, 1982-90.
Mean Mean VOR Mean Height Litter Depth
Year Early Late Early Late Early Late
1982 9.13 35.36 1983 7.86 41.19 40.55 90.45 3.17 2.87 1984 8.08 55.01 30.88 93.56 4.32 2.63 1985 23.97 46.11 74.62 78.22 3.10 2.62 1986 13.47 46.38 47.45 85.80 3.54 3.16 1987 25.41 42.15 74.62 84.30 3.75 2.63 1988 17.87 23.23 62.67 56.65 3.95 3.09 1989 11.18 46.19 44.82 87.23 2.68 2.84 1990 23.97 49.34 74.16 85.19 2.53 2.46
Mean 15.66 42.77 49.97 73.49 3.00 2.48
Standard Deviation 7.28 9.14 24.86 29.56 1.27 0.96
13
between years with a low of 7.86 em in 1983 to a high of 25.41 em in 1987 (Table 6). The low mean late VOR recorded in 1988, was due to the lack of rainfall caused by the drought (Table 6). Mean early vegetation height (49.97 em) was significantly less than mean late height (73.49 em, t=2.828, df=8, P=0.02) (Table 6). As with the VORs, there was less variation in the mean late height than in the mean early height (Table 6).
There was a significant relationship between early vegetation VORs and early vegetation height (r=+0.862, t=4.491, P=0.03), but not between late VORs and late vegetation height (r=+0.567, t=1.920, P=O.lO). As the mean early vegetation VORs increase, the mean early vegetation height increased.
Based upon the differences between mean early and late vegetation VORs and height, it is apparent that heavy snow in some winters flattened and decreased the quality of the vegetation available as residual nesting cover the following spring.
The mean early litter depth (3.0 em) was greater than the mean late litter depth (2.48 em, t=2.648, df=8, P=0.03) (Table 6). This relationship was consisted among years (r=+0.893, t=5.251, P=O.OOl). It appears that the snow pack, which flattened the residual vegetation (i.e. lowered mean early VORs and height), increased the mean early litter depth. Decomposition of the dead residual vegetation during the growing season reduced the mean litter depth measured at the cessation of plant growth in the early autumn (Table 6).
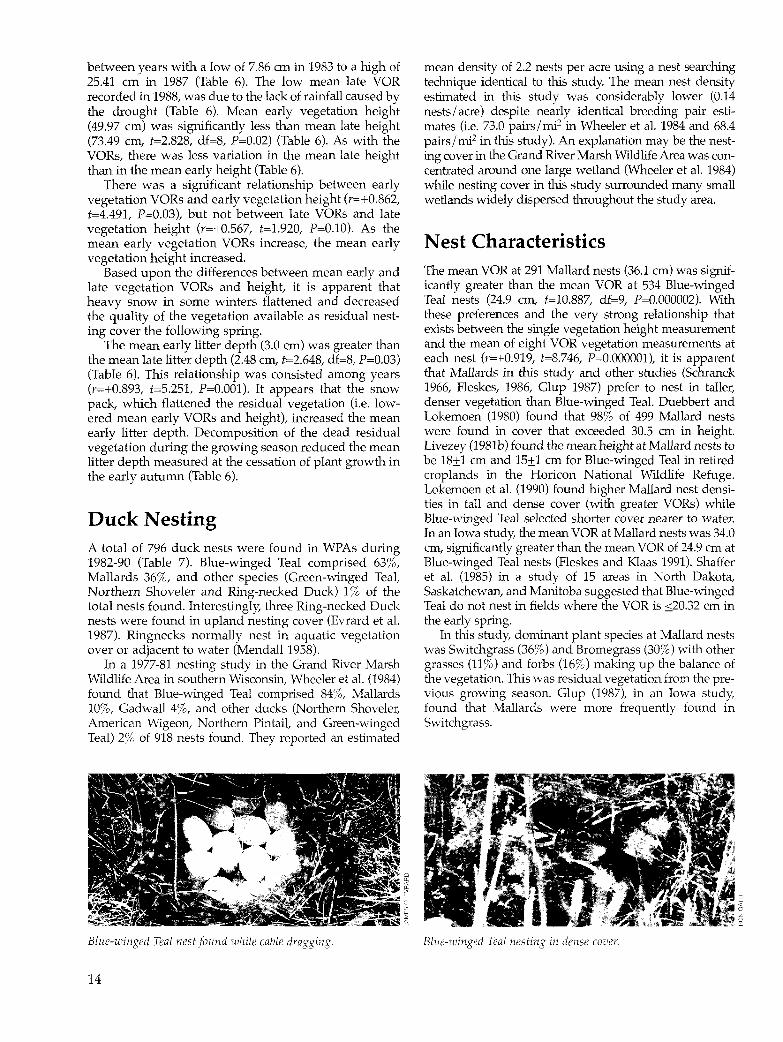
Duck Nesting A total of 796 duck nests were found in WPAs during 1982-90 (Table 7). Blue-winged Teal comprised 63%, Mallards 36%, and other species (Green-winged Teal, Northern Shoveler and Ring-necked Duck) 1% of the total nests found. Interestingly, three Ring-necked Duck nests were found in upland nesting cover (Evrard et al. 1987). Ringnecks normally nest in aquatic vegetation over or adjacent to water (Mendall1958).
In a 1977-81 nesting study in the Grand River Marsh Wildlife Area in southern Wisconsin, Wheeler et al. (1984) found that Blue-winged Teal comprised 84%, Mallards 10%, Gadwall 4%, and other ducks (Northern Shoveler, American Wigeon, Northern Pintail, and Green-winged Teal) 2% of 918 nests found. They reported an estimated
Blue-winged Teal nest found while cable dragging.
14
mean density of 2.2 nests per acre using a nest searching technique identical to this study. The mean nest density estimated in this study was considerably lower (0.14 nests/ acre) despite nearly identical breeding pair estimates (i.e. 73.0 pairs/mi2 in Wheeler et al. 1984 and 68.4 pairs/mi2 in this study). An explanation may be the nesting cover in the Grand River Marsh Wildlife Area was concentrated around one large wetland (Wheeler et al. 1984) while nesting cover in this study surrounded many small wetlands widely dispersed throughout the study area.
Nest Characteristics The mean VOR at 291 Mallard nests (36.1 em) was significantly greater than the mean VOR at 534 Blue-winged Teal nests (24.9 em, t=10.887, df=9, P=0.000002). With these preferences and the very strong relationship that exists between the single vegetation height measurement and the mean of eight VOR vegetation measurements at each nest (r=+0.919, t=8.746, P=O.OOOOOl), it is apparent that Mallards in this study and other studies (Schranck 1966, Fleskes, 1986, Glup 1987) prefer to nest in taller, denser vegetation than Blue-winged Teal. Duebbert and Lokemoen (1980) found that 98% of 499 Mallard nests were found in cover that exceeded 30.5 em in height. Livezey (1981b) found the mean height at Mallard nests to be 18±1 em and 15±1 em for Blue-winged Teal in retired croplands in the Horicon National Wildlife Refuge. Lokemoen et al. (1990) found higher Mallard nest densities in tall and dense cover (with greater VORs) while Blue-winged Teal selected shorter cover nearer to water. In an Iowa study, the mean VOR at Mallard nests was 34.0 em, significantly greater than the mean VOR of 24.9 em at Blue-winged Teal nests (Fleskes and Klaas 1991). Shaffer et al. (1985) in a study of 15 areas in North Dakota, Saskatchewan, and Manitoba suggested that Blue-winged Teal do not nest in fields where the VOR is ::::;20.32 em in the early spring.
In this study, dominant plant species at Mallard nests was Switchgrass (36%) and Bromegrass (30%) with other grasses (11%) and forbs (16%) making up the balance of the vegetation. This was residual vegetation from the previous growing season. Glup (1987), in an Iowa study, found that Mallards were more frequently found in Switchgrass.
Blue-winged Teal nesting in dense cover.

Dominant plant species at Bl ocwinged Teal nests in this s tudy was bluegrass (31 r,, ), BromegTass (26%), and q unckgrass (20%) w ith the ba lance being othe r grasses (8'ft,) a nd fo rbs (8'Y,,). Some of lhese grasses were resid ua l, but green growing g rass was also impor tant. Bluegrass and bromegrass was heavily used by Blue-w inged Teal as nesti ng cover in other stud ies (Burgess et a l. 1965, Krapu et a l. 1970, Heiser 1971, Miller 1976, Kaiser et a l. 1979, Weller "1979, Livezey 1981b, Glup 1987).
Blue -w inged Teal tended to nest closer to water (mca11 d istanct:!=357.5 ft) than the Mallard (mea n d is ta nce=591.4 ft ). T hi s fi nding agrt:!es closely w ith p revious s tud ies (Sowls 1955, Bergquist 1973, Ducbbcrt a nd Lokcmocn 1976, Ducbbe rt and Frank 1984).
Nest Success Mean Mayfield d uck nest success d uring this s tu dy was 21 .3% for 621 d uck nests (Tab le 8, F ig. 2). Wheeler c t a l. (1984) found a mean Mayfield nest s uccess o f 17% in h is southern Wisconsin s tudy during 1977-81.
In this study, the re was no difference between pooled 1982-90 mea n Mayfie ld nest success for the Malla rd (2 1.6%) and l)lue-w inged Tea l (22.2%) in lhe WPAs (1=0.265, d f=7, P=O.SO) (Table 8). The 1982 MaJia rd nest success estimate (617(, ) i:-; questio nable d ue to the s ma ll sa mp le size of eigh t n ests (Greenwood e t al. 1995). Initially, nest success for Ma llards a nd Blue-w inged Teal were similar,
Table 7. Duck m•::ls j(nmrl i11 WPI\s a11d csti111ali!tl 1111111/1<'1' Jln'' t'll/, Fi82-90.
Year
1982 1983 1984 1985 1986 1987 1988 1989 1990 Total
Species Malla rd 15 23 27 33 33 48 45 27 33 284 !J i ue~w i nged Teal 49 67 77 52 45 58 46 5 1 51i 501 Green-winged Teal 0 2 1 1 0 0 0 0 0 4 Northern Shoveler 1 I () () () 0 0 4 Ring-necked Duck 0 0 1 1 0 n 0 0 3
Tota l nes ts 65 93 107 1>8 78 lOb l) l 79 HY 7% Eslimaled nests• 94 115 131 168 180 200 156 138 153 1,335
Percent found 69 Sl 82 52 43 53 58 57 58 "i9.f>
Acres searched 998 897 1,082 1,082 1,089 1,092 1,092 l,080 1,087 9,499
Nes ls"/100 acres 9.2 12.8 12.0 152 16.4 18.0 14.0 12.H 14.0 14.t)
·• Dens ity = Nu mber of hatched nests d ivided by Mayfield nest succcs~ (Miller and Johnson 1978).
Table 8. J'crcm/ duck 11csl succ<'ss for WPAs, 1982-9U (Mnyfidd M<' l ifllrl).
Mallard Blue-winged Teal O ther Species• Total
Year 1982 6 (8)b 20 (24) - (0) 16 (32) 1983 33 (18) 33 (48) -(2) 12 (6K) 1984 31 (14) 33 (61) - (2) 34 (77) 1985 19 (19) 25 (40) - (3) 23 ((12) 1986 ll:! (30) 13 (39) - (0) 15 (69) 1987 23 (40) 22 (57) (0) 22 (97) 1988 17 (28) 23 (43) - (0) 15 (71) 1989 II (24) 20 (42) - (1) 16 (67) 1990 36 (30) 11 (48) - (0) 19 (78)
Mean 2 J.6 (2 J'I ) 22.2 (402) - (8) 2 1.3 (62 1)
''Other d uck species includ~:•: Shoveler, Creen-winged Teal a nd Ring-necked Duck. h Numbers in pa renthesis represen t the number of nests where fates wen! known 11nd
that were used in Mayfield nest s uccess ca lculations. No e!;timates of ne~t sucres~ were made for sam ples o f <5 nests.
40
~ 30 Q) CJ CJ ::I en 0 .-. 20 ~ -c Q) CJ
a.~ 10
0
Mallard
• Blue-winged Teal
1982 83 84 85 86 87 88 Year
89
- 20% nocdod lor Slablc nonulahon 1r\ W•sconsm
90
Hgure 2. Mayfield 111!51 success fur Mnl/nrcl nncl/3/uc-wingcd Tca/ i11 Wnle!fowl Production Areas.
15

Table 9. Percent duck' nest success on individual WPAs, 1982-90 [Mayfield method].
Year
1983
1985
1987
1989
1990
613
24 (10)
(17] (13)
29 (6)
[12]
(6)
3 (3)
[17] (3)
28 (5)
[8]
(6)
20 (8)
[15] (8)
Waterfowl Production Areab
710 716 717 719 720 724 727 733 Total
15 (6)
[12] (8)
44 6 58 60 26 (5) (4) (16) (13) (12) [7] [50] [21] [16] [15] (5) (7) (17) (14) (13)
100 100 (1) (1) [1] [1] (4) (1)
15 (4)
[8]
(5)
2
(8)
(8)
0 (3)
(7)
100 17 (3) (19)
0 10 40 (1) (16) (11)
[3] (54] [O] [64] [14] (3) (31) (1) (17) (16)
24 14 14 54 15 (2) (28) (8) (28) (17)
[14] [50] [33] [37] [32] (2) (26) (8) (31) (17)
12 40 20 32 11
(7) (14) (1) (18) (5)
[6] [20] [32] [18] (7) (14) (1) (19) (9)
2 11 100 43 3 (11) (16) (3) (24) (10)
[17] [40] [35] [17} (13) (19) (5) (24) (10)
1 32 (3) (69)
[0] [138] (6) (83)
29 23 (4) (61) [9] [158] (4) (83)
9 (8)
[33]
(9)
10 (8)
[20] (11)
27 (2) [3] (2)
22
(96) [224]
(101)
16 (68)
[104] (75)
19 (77)
[127] (88)
a Duck species include: Mallard, Blue-winged Teal, Shoveler, Green-winged Teal, and Ring-necked Duck.
b Waterfowl Production Areas are identified by numbers as follows: 613-Flaters WPA, 710-0akridge WPA, 716-Kostka-Chovan WPA, 717-Lundy Pond WPA, 719-Erickson WPA, 720-Star Prairie-Ausen WPA, 724-Bierbrauer WPA, 727-Amschler WPA and 733-Hanten WPA.
c Numbers in parenthesis represent the number of nests used to calculate Mayfield nest success.
d Numbers in brackets represent the number of estimated nests using the Mayfield method.
e Italic numbers in parenthesis represent the number of nests actually found.
16
nsmg and falling synchronously (Fig. 2). However in 1989, Bluewinged Teal nest success was nearly double that of Mallards. In 1990, that situation was reversed with Mallards having a nest success nearly three times greater than Blue-winged Teal (Fig. 2).
USFWS researchers in the Dakotas determined that a Mayfield nest success of 15% was needed to maintain a stable Mallard population (Cowardin et al. 1983) and a Mayfield nest success of 20% for a stable Bluewinged Teal population (Klett et al. 1988). In Wisconsin, Gatti (1987) calculated that a Mayfield nest success of 20% was needed for a stable Mallard population due to higher mortality factors in Wisconsin than in the Dakotas. Mean nest success for the Mallard and the Bluewinged Teal in this study was at or above the 20% population maintenance level in 7 of the 9 years (Fig. 2). The mean nest success was higher than 1982-85 nest success reported for Canadian prairie potholes by Greenwood et al. (1995).
Duck nest success is highly dynamic, varying both temporally and spatially. When nest density increases, nest success often decreases (Glover 1956, Weller 1979, Martz 1967, Kaiser et al. 1979, Livezey 1981a, Cowan 1982, Hill 1984b, Hill 1984c, Fleskes 1986, Fleskes and Klass 1991). Gatti (1987), studying nesting ducks in three Wisconsin study areas during 1983-85, found lower nest success on larger management areas. The past studies he reviewed showed an inverse relationship between nest success and duck population densities, which are generally higher on larger properties (Gatti 1987). It may be that the relatively small and widely dispersed WPAs make it more difficult for predators to encounter nests compared to larger wildlife management areas and refuges (Dzubin and Gollop 1972, Sargeant 1972).
There was no relationship between yearly nest success and nest density for pooled WPAs
Predator destroyed Mallard nest.
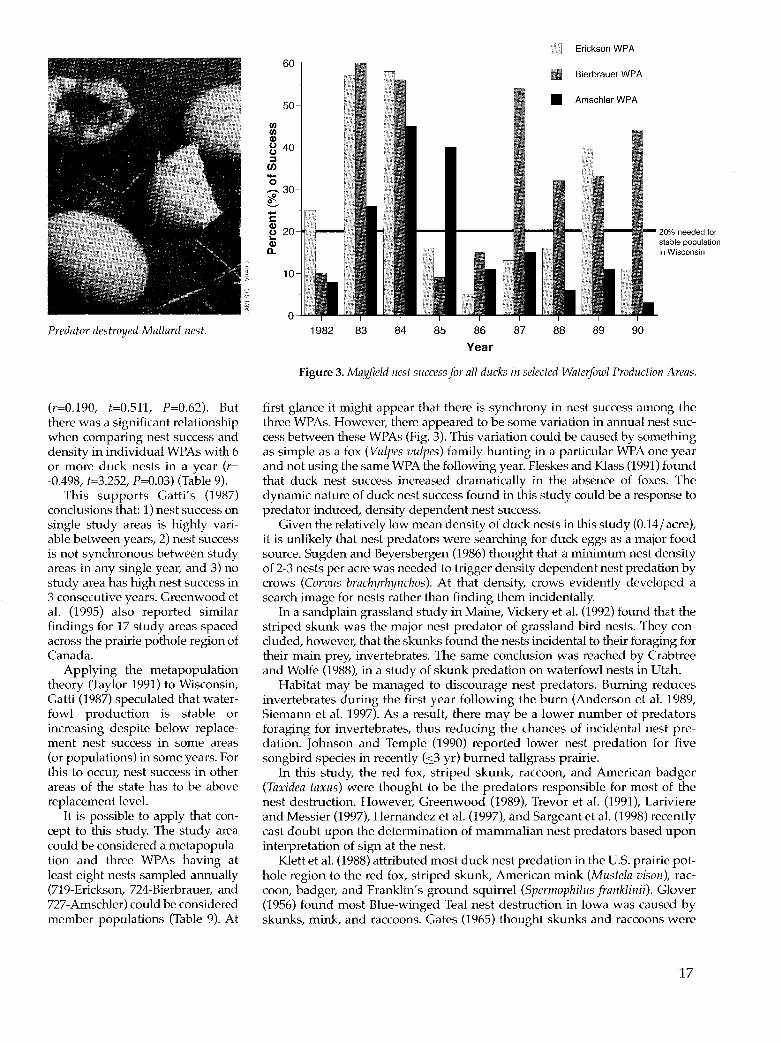
(r=0.190, t=0.5ll, P=0.62). But there was a significant relationship when comparing nest success and density in individual WPAs with 6 or more duck nests in a year (r= -0.498, t=3.252, P=0.03) (Table 9).
This supports Gatti's (1987) conclusions that: 1) nest success on single study areas is highly variable between years, 2) nest success is not synchronous between study areas in any single year, and 3) no study area has high nest success in 3 consecutive years. Greenwood et al. (1995) also reported similar findings for 17 study areas spaced across the prairie pothole region of Canada.
Applying the metapopulation theory (Taylor 1991) to Wisconsin, Gatti (1987) speculated that waterfowl production is stable or increasing despite below replacement nest success in some areas (or populations) in some years. For this to occur, nest success in other areas of the state has to be above replacement level.
It is possible to apply that concept to this study. The study area could be considered a metapopulation and three WPAs having at least eight nests sampled annually (719-Erickson, 724-Bierbrauer, and 727-Amschler) could be considered member populations (Table 9). At
II) II) Q) u u :1
CJ) -0 ...... ~ -c Q) u ... Q)
D..
1982 83 84 85 86
Year
87
Erickson WPA
Bierbrauer WPA
• Amschler WPA
----lllll-- 20% needed for
88 89 90
stable population in Wisconsin
Figure 3. Mayfield nest success for all ducks in selected Waterfowl Production Areas.
first glance it might appear that there is synchrony in nest success among the three WPAs. However, there appeared to be some variation in annual nest success between these WPAs (Fig. 3). This variation could be caused by something as simple as a fox (Vulpes vulpes) family hunting in a particular WPA one year and not using the same WPA the following year. Fleskes and Klass (1991) found that duck nest success increased dramatically in the absence of foxes. The dynamic nature of duck nest success found in this study could be a response to predator induced, density dependent nest success.
Given the relatively low mean density of duck nests in this study (0.14/ acre), it is unlikely that nest predators were searching for duck eggs as a major food source. Sugden and Beyersbergen (1986) thought that a minimum nest density of 2-3 nests per acre was needed to trigger density dependent nest predation by crows (Corvus brachyrhynchos). At that density, crows evidently developed a search image for nests rather than finding them incidentally.
In a sandplain grassland study in Maine, Vickery et al. (1992) found that the striped skunk was the major nest predator of grassland bird nests. They concluded, however, that the skunks found the nests incidental to their foraging for their main prey, invertebrates. The same conclusion was reached by Crabtree and Wolfe (1988), in a study of skunk predation on waterfowl nests in Utah.
Habitat may be managed to discourage nest predators. Burning reduces invertebrates during the first year following the burn (Anderson et al. 1989, Siemann et al. 1997). As a result, there may be a lower number of predators foraging for invertebrates, thus reducing the chances of incidental nest predation. Johnson and Temple (1990) reported lower nest predation for five songbird species in recently (s3 yr) burned tallgrass prairie.
In this study, the red fox, striped skunk, raccoon, and American badger (Taxidea taxus) were thought to be the predators responsible for most of the nest destruction. However, Greenwood (1989), Trevor et al. (1991), Lariviere and Messier (1997), Hernandez et al. (1997), and Sargeant et al. (1998) recently cast doubt upon the determination of mammalian nest predators based upon interpretation of sign at the nest.
Klett et al. (1988) attributed most duck nest predation in the U.S. prairie pothole region to the red fox, striped skunk, American mink (Mustela vison), raccoon, badger, and Franklin's ground squirrel (Spermophilus franklinii). Glover (1956) found most Blue-winged Teal nest destruction in Iowa was caused by skunks, mink, and raccoons. Gates (1965) thought skunks and raccoons were
17

the most important duck nest predators in his east central Wisconsin study area. Bergquist (1973) reported that the skunk, raccoon, and ground squirrels were responsible for most of the nest predation encountered in northwest Wisconsin. More recently, Sovada et al. (1999) found a high frequency of ducks and duck eggs in the diet of badgers in west central Minnesota and southeastern North Dakota.
An examination of pooled 1982-90 nests for Mallards and Blue-winged Teal showed no difference in success rates between early and late nests. Mallard nest success for 116 early nests and 108late nests was 19% and 26% respectively (x2=1.03, df=1, P=0.31). Blue-winged Teal nest success for 240 early nests and 174late nests was 24% and 26% respectively (x2=0.03, df=1, P=0.87). Nests were categorized as early or late if their initiation date (date of first egg) occurred before or after the mean nest initiation date.
Factors Affecting Nest Success The 34 variables measured at the nest were included in a exponential regression model to determine what environmental factors, if any, affected nest success for Mallard and Blue-winged Teal in WPAs.
Since there was no difference between mean Mallard and mean Blue-winged Teal nest success pooled for years (P=O.SO, Table 8) the two species were combined. Nest success for pooled Mallard and Blue-winged Teal varied significantly between years (x2=22.42, df=7, P=0.01) and between WPAs (x2=27.54, df=5, P=O.OOOl).
Hatched Mallard nests had only slightly greater VORs (14.6 in) than destroyed Mallard nests (14.3 in; x2=4.200, df=1, P=0.04). Hatched Blue-winged Teal nests also had slightly greater VORs (10.1 in) than destroyed nests (9.3 in, x2=7.17, df=1, P=0.007). Some studies have reported higher nest success related to greater vegetation concealment at the nest (Glover 1956, Duebbert 1969, Kirsch 1969, Bengston 1970, Heiser 1971, Dwernychuk and Boag 1972, Kirsch et al. 1978, Livezey 1981a, Hines and Mitchell1983, Hill1984a, Cowardin et al. 1985, Glup 1987, Higgens et al. 1992, Guyn and Clark 1997, Clark and Shutler 1999), whereas other studies found no relationship between vegetative nest cover and nest success (Byers 1974, Wheeler et al. 1984, Clark et al. 1991) had.
Hatched Mallard nests had slightly less grass coverage at the nest (76%) than destroyed nests (SO%; x2=4.72, df=1, P=0.03) and conversely, higher coverage of forbs at hatched nest (24%) than at destroyed nests (16%; x2=3.89, df=1, P=0.05).
Successful Blue-winged Teal nests also had slightly less grass coverage around the nest (83%) than unsuccessful nests (88%; x2=7.01, df=1, P=O.OOS). Heiser (1971) reported significantly more forb cover at hatched Blue-winged Teal nests than at destroyed nests. In this study, hatched Bluewinged Teal nests had more bromegrass cover (29% vs. 20%; x2=5.80, df=1, P=0.02) and less bluegrass cover (25% vs. 34%; x2=8.85, df=l, P=0.003) than destroyed nests.
18
There were no differences in Mallard (x2=0.52, df=2, P=0.772) and Blue-winged Teal (x2=2.303, df=2, P=0.32) nest success in nest cover dominated by switch grass, cool season grasses, or forbs. Mallard nest success was 22% in switch grass dominated nest cover (:2:0.50 IV) (n=17 nests), 23% in cool season grasses (n=118 nests), and 19% in forbs (n=38 nests). Blue-winged Teal nest success in switch grass was 29% (n=21), 23% in cool season grasses (n=259), and 20% in forb dominated nest cover (n=45).
Litter depth at the nest was less for successful Bluewinged Teal nests (2.8 em) than for destroyed nests (3.6 em; x2=4.48, df=1, P=0.03). A possible explanation for this result may be that deeper litter could result in more voles and, therefore, lower nest success. Successful and destroyed Blue-winged Teal nests appeared to be located nearly the same distance from the edge of the nesting cover (mean distance=134 ft vs. 138ft, respectively) but were further from water (388 ft vs. 310 ft, respectively; x2=8.35, df=1, P=0.004). Kantrud (1993) reported that duck nest success increased with and increase in the distance from water.
Nest Success and Predator Indices When pooled mean WPA Mayfield nest success is compared by years with predator and prey indices, several relationships became apparent. Although no relationships were found for the Mallard, nest success for Bluewinged Teal was correlated with the roadkill index for all predators (r=-0.70, t=2.624, P=0.03), for red fox (r=-0.804, t=2.707, P=0.05), and for raccoon (r=-0.910, t=4.375, P=0.01). As the predator populations increased, nest success for the Blue-winged Teal, but not the Mallard, decreased. This could explain the disparity between nest success of Mallards and Blue-winged Teal in 1989 and 1990 (Fig. 2). Byers (1974) found that predator abundance in one Iowa management area was inversely related to Blue-winged Teal nesting success. There were no apparent relationships between nest success and the other two predator indices, the spotlight survey and the scent station survey in this study.
The results of this part of the study suggest that the relatively inexpensive roadkill survey can provide indices to predator populations which can be related to Blue-winged Teal nest success. As the number of roadkilled fox and raccoon increased throughout the study area, nesting success for Blue-winged Teal in the WPAs decreased.

Relationships Among Predator Indices The roadkill index for all predators was significantly related to the scent station index (r=0.853, t=3.265, P=0.03) but not the spotlight index (r=-0.263, t=0.54, P=0.61). The scent station index was not significantly related to the spotlight index (r=-0.207, t=0.42, P=0.69). When examined on a species level, the only significant relationship existed between raccoon population indices on spotlight transects and scent station transects (r=+0.898, t=4.088, P=0.02).
Roadkill Survey Indices During 1983-1985, 95.7% of all road-killed predators were recorded. The striped skunk was the most numerous and consistent road-killed species followed by the raccoon and the red fox during 1984-90 (Table 10). A few badger and mink were occasionally recorded. As a result of a recent range extension from the south, the Virginia opossum (Didelphis virginiana) appeared late in the study and was first recorded as a roadkill in 1990.
There appeared to be two peaks in predator roadkills, one in 1986 and the other in 1990, and lows in 1983 and 1989. The 1986 peak indicated high skunk population with modest raccoon and fox populations (Table 10). The 1990 peak indicated high raccoon and fox numbers, not skunk (Table 10). The causes for fluctuations of numbers of the nest predators are unknown.
Roadside Scent Station Survey The red fox was the most common predator recorded on WPA scent station transects followed by the dog, cat, and striped skunk during 1984-90 (Table 11). On the PL transects, the dog was most common followed by the cat, fox, and skunk. Predator numbers (fox, raccoon, skunk, badger, mink, and weasel) at WPA transects were significantly correlated with predator numbers at PL transects (r=0.77222, df=5, P=0.04). The number of predators fluctuated similarly on both WPA and PL scent station transects but were significantly higher on WPA transects (t=4.565, df=6, P=0.004). There was a significant difference in cover types between the WPA and PL transects (x2=24.560, df=7, P=0.001). WPA transects were characterized by fewer agricultural fields (58% vs. 78%), more undisturbed grassland (22% vs. 5%) and wetlands (8% vs. 1% ), and fewer buildings (3% vs. 6%). The habitat differences existing between WPA and PL transects may be the reason for the larger number of potential duck nest predators recorded on the WPA transects.
Table 10. Road-killed predators per 1,000 miles driven in study area, April - October, 1982-90.
Year
1982 1983 1984 1985 1986 1987 1988 1989 1990
Predator ():0$. . OJZ> o;o2 : 6;{)& ,,'<!.04' • ~~$:2.·
Common Raccoon 0.05 0.08 0.12 0.20 0.38 0.15 0.18 0.15 0.45
OJ~ Virginia Opossum 0.05
· .. · trh~n¢~ B<l~gef. Mink 0.02 0.02 0.02 0.05 0.05 0.05 0.02 0.01 0.05
.i'Qtaf 0.31· 0.22 ,''0!46• Jl.$.· .1~53' (}.7:2, .'lMi2 ···o~3Q 1.07 Miles Driven (thousands) 19.6 27.2 29.4 24.8 22.1 28.3 27.1 35.6 31.4
Table 11. Predator visits to roadside scent stations adjacent to WPAs and private lands (PL), 1984-90.
Year
1984 1985 1986 1987 1988 1989 1990 Totals
WPA PL WPA PL WPA PL WPA PL WPA PL WPA PL WPA PL WPA PL
Predator Red Fox 4 0 9 8 8 3 10 8 5 2 7 1 9 6 52 28 Common Raccoon 0 3 0 2 2 2 1 2 3 0 4 2 3 2 13 13 Striped Skunk 4 3 7 7 3 2 6 6 0 1 6 4 1 1 27 24 American Badger 1 0 1 0 0 0 0 0 0 0 0 0 0 0 2 0 Mink 1 0 1 0 1 0 2 2 0 0 0 0 0 0 5 2 Weasel 0 1 2 0 1 0 3 0 1 0 0 0 0 0 7 1 Domestic Cat 1 0 4 2 8 2 2 2 2 4 3 7 9 13 29 20 Dog 5 10 4 8 9 8 2 2 5 11 2 13 9 5 36 57 Unknown 1 2 0 0 5 2 0 0 0 1 1 0 0 0 7 5
Total 17 19 28 27 37 19 26 22 16 19 23 27 31 27 178 160
19
Red fox population trends on WPA transects were correlated with trends on PL transects (r=0.81595, df=5, P=0.02). Red fox numbers were also significantly higher on WPA transects than PL transects (t=5.694, df=6, P=O.OOl) (Table 11). Striped skunk populations on WPAs were strongly correlated with PL transects (r=0.98295, df=5, P=0.00007) but skunk numbers were only slightly higher on WPA transects vs. PL transects (t=2.35907, df=6, P=0.056). There was no significant relationship between raccoon, house cat, and dog population trends or numbers on WPA and PL scent station (r=0.674731, df=5, P=O.lO).
Scent station indices were found to agree with known populations of raccoons in western Tennessee (Leberg and Kennedy 1987) and Florida (Conner et al. 1983), but not in eastern Tennessee (Nottingham et al. 1989) and Alabama (Hill and Summer 1980). Gabor et al. (1994) found that roadside scent stations were not as valuable scent stations placed randomly. However, scent stations were valid population indices for striped skunks in Minnesota (Fuller and Kuehn 1985) and dogs (Canus domesticus) and house cats (Felis catus) in Alabama (Hill and Sumner 1980).
Spotlight Survey The house cat (Felis catus) was the most numerous predator recorded on both WPA and PL spotlight transects (Table 12). There were no statistical differences between the cover components of the WPA and PL transects (x2=8.444, df=6, P=0.21). However, numbers of house cats were significantly higher on WPA transects (t=3.509, df=5, P=0.02) where slightly more idle land could provide better hunting habitat for the exotic predator. Spotlight surveys have been tested as a population index for various species including raccoon (Rybarczyk 1978, Rybarczyk et al. 1981) and striped skunk (Jacobson 1969, Cool and Fredrickson 1976).
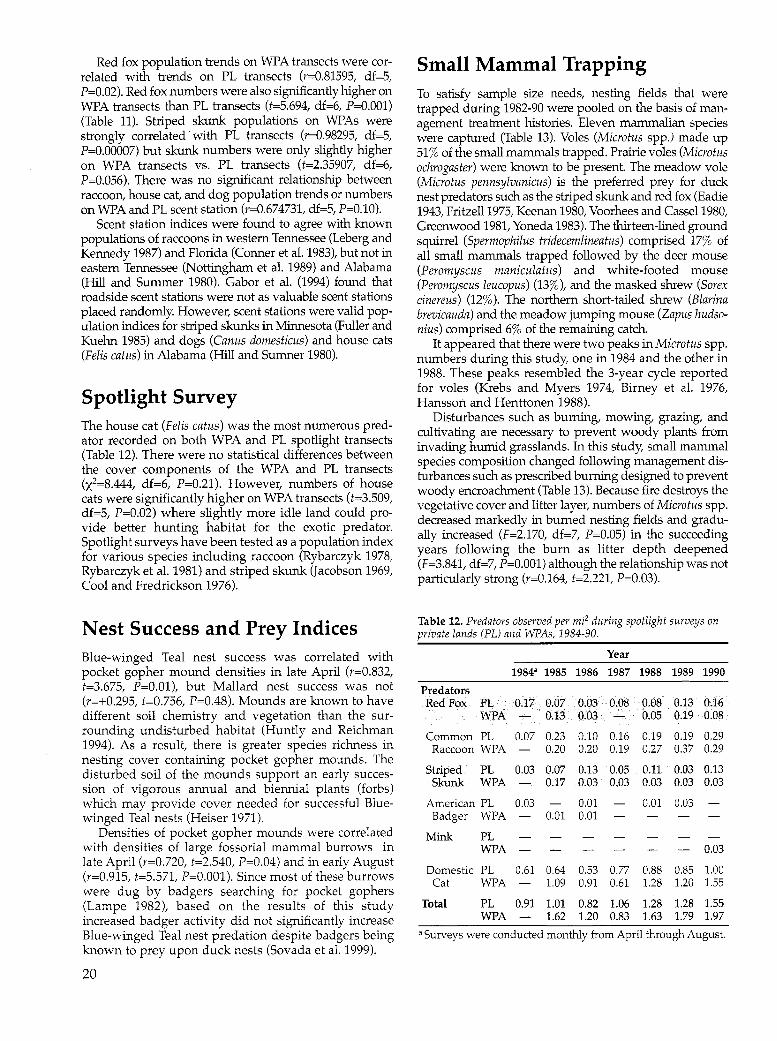
Nest Success and Prey Indices Blue-winged Teal nest success was correlated with pocket gopher mound densities in late April (r=0.832, t=3.675, P=O.Ol), but Mallard nest success was not (r=+0.295, t=0.756, P=0.48). Mounds are known to have different soil chemistry and vegetation than the sur-rounding undisturbed habitat (Huntly and Reichman 1994). As a result, there is greater species richness in nesting cover containing pocket gopher mounds. The disturbed soil of the mounds support an early succes-sion of vigorous annual and biennial plants (forbs) which may provide cover needed for successful Blue-winged Teal nests (Heiser 1971).
Densities of pocket gopher mounds were correlated with densities of large fossorial mammal burrows in late April (r=0.720, t=2.540, P=0.04) and in early August (r=0.915, t=5.571, P=O.OOl). Since most of these burrows were dug by badgers searching for pocket gophers (Lampe 1982), based on the results of this study increased badger activity did not significantly increase Blue-winged Teal nest predation despite badgers being known to prey upon duck nests (Sovada et al. 1999).
20
Small Mammal Trapping To satisfy sample size needs, nesting fields that were trapped during 1982-90 were pooled on the basis of management treatment histories. Eleven mammalian species were captured (Table 13). Voles (Microtus spp.) made up 51% of the small mammals trapped. Prairie voles (Microtus ochrogaster) were known to be present. The meadow vole (Microtus pennsylvanicus) is the preferred prey for duck nest predators such as the striped skunk and red fox (Eadie 1943, Fritzell1975, Keenan 1980, Voorhees and Cassell980, Greenwood 1981, Yoneda 1983). The thirteen-lined ground squirrel (Spermophilus tridecemlineatus) comprised 17% of all small mammals trapped followed by the deer mouse (Peromyscus maniculatus) and white-footed mouse (Peromyscus leucopus) (13%), and the masked shrew (Sorex cinereus) (12%). The northern short-tailed shrew (Blarina brevicauda) and the meadow jumping mouse (Zapus hudsonius) comprised 6% of the remaining catch.
It appeared that there were two peaks in Microtus spp. numbers during this study, one in 1984 and the other in 1988. These peaks resembled the 3-year cycle reported for voles (Krebs and Myers 1974, Birney et al. 1976, Hansson and Henttonen 1988).
Disturbances such as burning, mowing, grazing, and cultivating are necessary to prevent woody plants from invading humid grasslands. In this study, small mammal species composition changed following management disturbances such as prescribed burning designed to prevent woody encroachment (Table 13). Because fire destroys the vegetative cover and litter layer, numbers of Microtus spp. decreased markedly in burned nesting fields and gradually increased (F=2.170, df=7, P=0.05) in the succeeding years following the bum as litter depth deepened (F=3.841, df=7, P=O.OOl) although the relationship was not particularly strong (r=0.164, t=2.221, P=0.03).
Table 12. Predators observed per mi2 during spotlight surveys on private lands (PL) and WPAs, 1984-90.
Year
1984• 1985 1986 1987 1988 1989 1990
Predators RedFox PL 0.17 0.07 0.03 0.08 0.08 0.13 0.16
WPA 0.13 0.03 0.05 0.19 0.08
Common PL 0.07 0.23 0.10 0.16 0.19 0.19 0.29 Raccoon WPA 0.20 0.20 0.19 0.27 0.37 0.29
Striped PL 0.03 O.D7 0.13 0.05 0.11 0.03 0.13 Skunk WPA 0.17 0.03 0.03 0.03 0.03 0.03
American PL 0.03 0.01 0.01 0.03 Badger WPA 0.01 0.01
Mink PL WPA 0.03
Domestic PL 0.61 0.64 0.53 0.77 0.88 0.85 1.00 Cat WPA 1.09 0.91 0.61 1.28 1.20 1.55
Total PL 0.91 1.01 0.82 1.06 1.28 1.28 1.55 WPA 1.62 1.20 0.83 1.63 1.79 1.97
• Surveys were conducted monthly from April through August.
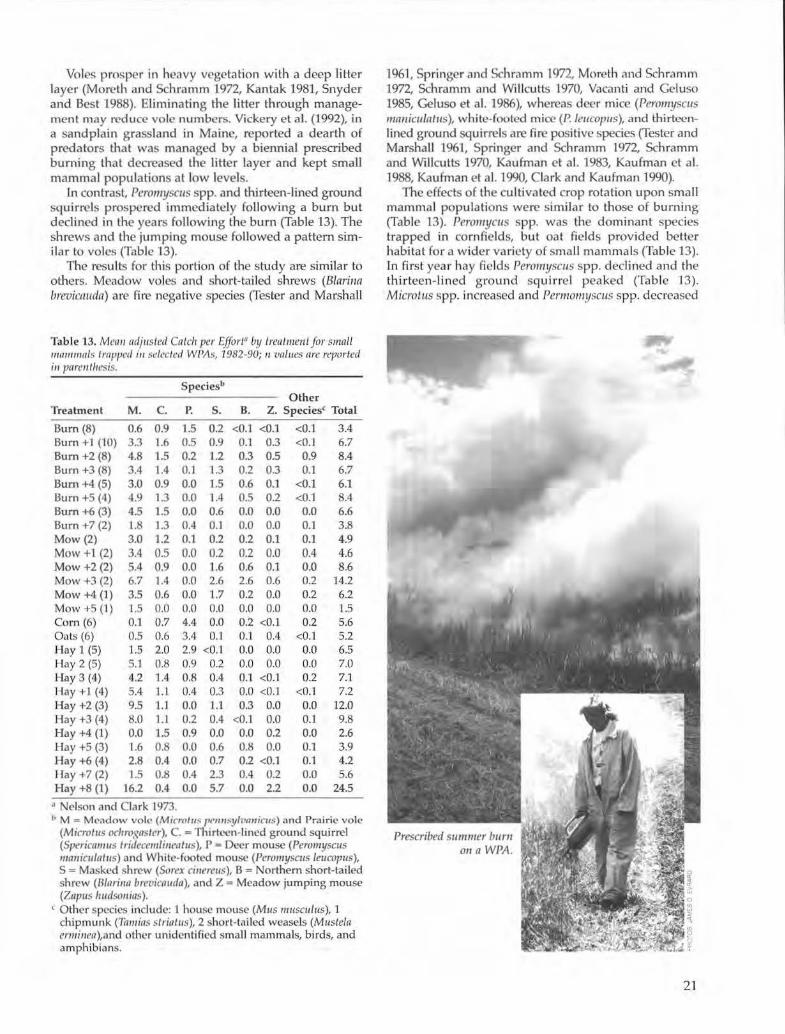
Voles prosper in heavy vegetation with a deep litter layer (Mon~th and Schramm 1972, Kantak 1981, Snyder and Best 1988). Eliminating the litter through management may reduce vole numbers. Vickery et al. (1992), in a sandplain grassland in Maine, reported a dearth of predators that was managed by a biennial prescribed burning that decreased the litter layer and kept smalJ mammal populations at low levels.
In contrast, Peromyscus spp. and thirteen-lined ground squirre ls pros pered immediately fo llowing a burn but declined in the years following the burn (Table 13). The shrews and the jumping mouse followed a pattern similar to voles (Table 13).
The results for this portion of the s tudy are similar to others. Meadow voles and short-tailed shrews (8/arina brevicnudn) are fire negative species (Tester and Marsha ll
Table 13. Mea11adjustcd Catch per Effort" by treatment for small IIWIIIIIWIS tmpped i11 selcclt•tl WP/\s, 1982-90; rr values are n·pvrted ;, parclllltcsis.
Speciesb Other
Treatment M. c. P. s. B. Z. Speciesc Total
Burn (8) 0.6 0.9 1.5 0.2 <0.1 <0.1 <0.1 3.4 Bum +I (10) 3.3 1.6 0.5 0.9 0.1 0.3 <0.1 6.7 Bum +2 (8) 4.8 1.5 0.2 1.2 0.3 0.5 0.9 8.4 Burn +3 (8) 3.4 1.4 0.1 1.3 0.2 0.3 0.1 6.7 Bum +4(5) 3.0 0.9 0.0 1.5 0.6 0.1 <0.1 6.1 Burn +5 (4) 4.9 1.3 0.0 1.4 0.5 0.2 <0.1 8.4 Burn +6 (3) 4.5 1.5 0.0 0.6 0.0 0.0 0.0 6.6 Burn +7 (2) 1.8 1.3 0.4 0.1 0.0 0.0 0.1 3.8 Mow (2) 3.0 1.2 0.1 0.2 0.2 0.1 0.1 4.9 Mow +1 (2) 3.4 0.5 0.0 0.2 0.2 0.0 0.4 4.6 Mow +2 (2) 5.4 0.9 0.0 1.6 0.6 0.1 0.0 8.6 Mow +3 (2) 6.7 1.4 0.0 2.6 2.6 0.6 0.2 14.2 Mow +4 (1) 3.5 0.6 0.0 1.7 0.2 0.0 0.2 6.2 Mow +5 (1) 1.5 0.0 0.0 0.0 0.0 0.0 0.0 1.5 Corn (6) 0.1 0.7 4.4 0.0 0.2 <0.1 0.2 5.6 Oats (6) 0.5 0.6 3.4 0.1 0.1 0.4 <0.1 5.2 Hay 1 (5) 1.5 2.0 2.9 <0.1 0.0 0.0 0.0 6.5 Hay 2 (5) 5.1 0.8 0.9 0.2 0.0 o.o 0.0 7.0 Hay 3 (4) 4.2 1.4 0.8 0.4 0.1 <0.1 0.2 7.1 Hay +1 (4) 5.4 1.1 0.4 0.3 0.0 <0.1 <0.1 7.2 Hay +2 (3) 9.5 1.1 0.0 1.1 0.3 0.0 0.0 12.0 Hay +3 (4) 8.0 1.1 0.2 0.4 <0.'1 0.0 0.1 9.8 Hay +4 (1) 0.0 1.5 0.9 0.0 0.0 0.2 0.0 2.6 Hay +5 (3) 1.6 0.8 0.0 0.6 0.8 0.0 0.1 3.9 Hay +6 (4) 2.8 0.4 0.0 0.7 0.2 <0.1 0.1 4.2 Hay +7 (2) 1.5 0.8 0.4 2.3 0.4 0.2 0.0 5.6 Hay +8 (1) 16.2 0.4 0.0 5.7 0.0 2.2 0.0 24.5
• Nelson and Clark 1973. ~ M ~ M~ildow volt• (Micrnltt< t•rnnsyltmuictts) nnd Prairie vole
(Micmtus ochro,'{nstcr), C. -Thirteen-lined ground squirrel (SperiCI/1111/S tricleCI'IIIIiiiCIIIIIS), r = Deer mouse (Peromyscus 11umiculatus) and White-footed mouse (Pcromyscus leucopus), S = Masked shrew (Sorex cille'YCIIS), B = Northern short-tailed shrew (8/arina brevicauda), and Z = Meadow jumping mouse (Zapus lwdsonins).
c Other species include: J house mouse (Mus lllftSCII/us), 1 chipmunk (Tamias stria/us), 2 short-tailed weasels (Mustela ermi11ea),and other ur,idcntificd small mammals, birds, and amphibians.
1961, Springer and Schramm 1972, Moreth and Schramm 1972, Schramm and Willcutts 1970, Vacanti and Geluso 1985, Geluso et al. 1986), whereas deer mice (Peromyscus maniculntus), whit<.~footed mice (P.Ieucopus), and thirteenLined ground squirrels arc fire positive species (Tester and Marshall 1961, Springer and Schramm 1972, Schramm and Willcults 1970, Kaufman et al. 1983, Kaufman et al. 1988, Kaufman e l al. 1990, Clark and Kaufman 1990).
The effects of the cultivated crop rotation upon small mamma] populations were s imilar to those of burning (Table 13). Pero111ycus spp. was the dominant species trapped in cornfi~lds, but oat fields provided better habitat for a wider va riety of small mammals (Table 13). ln firs t year hay fields Peromyscus spp. declined and the thirteen-lined ground squi rre l peaked (Table 13). Microtus spp. increased and Pennomyscus spp. decreased
21
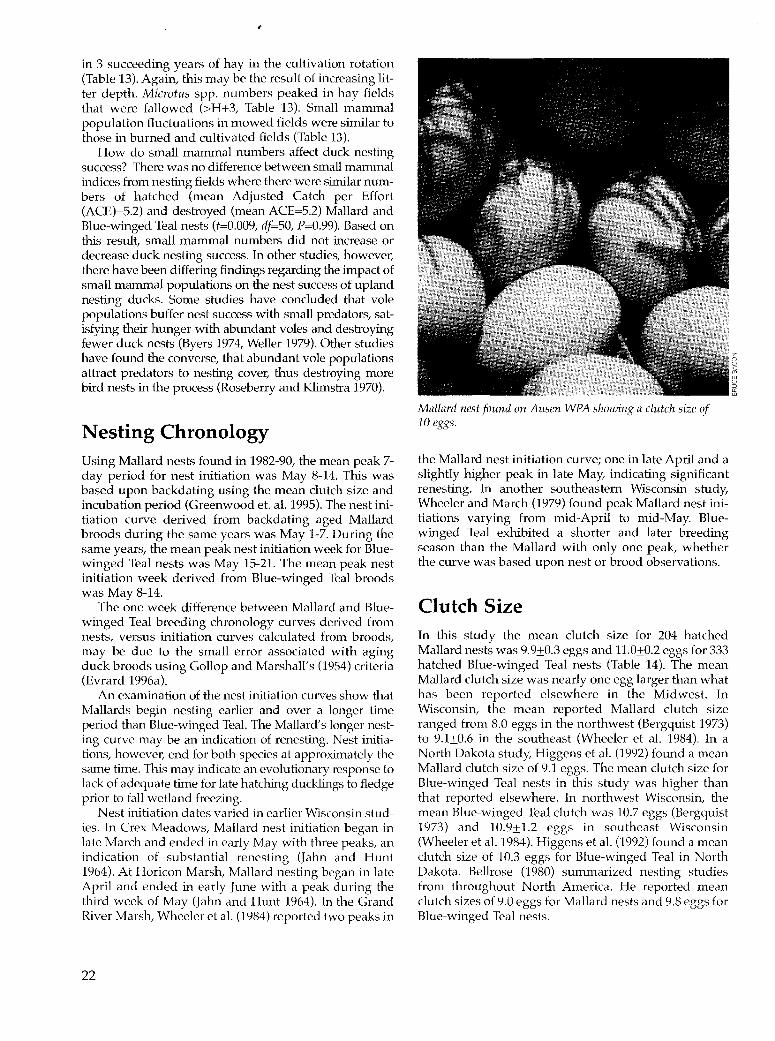
in 3 succeeding years of hay in the cultivation rotation (Table 13). Again, this may be the result of increasing litter depth. Microtus spp. numbers peaked in hay fields that were fallowed (>H+3, Table 13). Small mammal population fluctuations in mowed fields were similar to those in burned and cultivated fields (Table 13).
How do small mammal numbers affect duck nesting success? There was no difference between small mammal indices from nesting fields where there were similar numbers of hatched (mean Adjusted Catch per Effort (ACE)=5.2) and destroyed (mean ACE=5.2) Mallard and Blue-winged Teal nests (t=0.009, df=50, P=0.99). Based on this result, small mammal numbers did not increase or decrease duck nesting success. In other studies, however, there have been differing findings regarding the impact of small mammal populations on the nest success of upland nesting ducks. Some studies have concluded that vole populations buffer nest success with small predators, satisfying their hunger with abundant voles and destroying fewer duck nests (Byers 1974, Weller 1979). Other studies have found the converse, that abundant vole populations attract predators to nesting cover, thus destroying more bird nests in the process (Roseberry and Klimstra 1970).
Nesting Chronology Using Mallard nests found in 1982-90, the mean peak 7-day period for nest initiation was May 8-14. This was based upon backdating using the mean clutch size and incubation period (Greenwood et. al. 1995). The nest initiation curve derived from backdating aged Mallard broods during the same years was May 1-7. During the same years, the mean peak nest initiation week for Bluewinged Teal nests was May 15-21. The mean peak nest initiation week derived from Blue-winged Teal broods was May 8-14.
The one week difference between Mallard and Bluewinged Teal breeding chronology curves derived from nests, versus initiation curves calculated from broods, may be due to the small error associated with aging duck broods using Gallop and Marshall's (1954) criteria (Evrard 1996a).
An examination of the nest initiation curves show that Mallards begin nesting earlier and over a longer time period than Blue-winged Teal. The Mallard's longer nesting curve may be an indication of renesting. Nest initiations, however, end for both species at approximately the same time. This may indicate an evolutionary response to lack of adequate time for late hatching ducklings to fledge prior to fall wetland freezing.
Nest initiation dates varied in earlier Wisconsin studies. In Crex Meadows, Mallard nest initiation began in late March and ended in early May with three peaks, an indication of substantial renesting (Jahn and Hunt 1964). At Horicon Marsh, Mallard nesting began in late April and ended in early June with a peak during the third week of May (Jahn and Hunt 1964). In the Grand River Marsh, Wheeler et al. (1984) reported two peaks in
22
Mallard nest found on Ausen WPA showing a clutch size of 10 eggs.
the Mallard nest initiation curve; one in late April and a slightly higher peak in late May, indicating significant renesting. In another southeastern Wisconsin study, Wheeler and March (1979) found peak Mallard nest initiations varying from mid-April to mid-May. Bluewinged Teal exhibited a shorter and later breeding season than the Mallard with only one peak, whether the curve was based upon nest or brood observations.
Clutch Size In this study the mean clutch size for 204 hatched Mallard nests was 9.9±0.3 eggs and 11.0±0.2 eggs for 333 hatched Blue-winged Teal nests (Table 14). The mean Mallard clutch size was nearly one egg larger than what has been reported elsewhere in the Midwest. In Wisconsin, the mean reported Mallard clutch size ranged from 8.0 eggs in the northwest (Bergquist 1973) to 9.1±0.6 in the southeast (Wheeler et al. 1984). In a North Dakota study, Higgens et al. (1992) found a mean Mallard clutch size of 9.1 eggs. The mean clutch size for Blue-winged Teal nests in this study was higher than that reported elsewhere. In northwest Wisconsin, the mean Blue-winged Teal clutch was 10.7 eggs (Bergquist 1973) and 10.9±1.2 eggs in southeast Wisconsin (Wheeler et al. 1984). Higgens et al. (1992) found a mean clutch size of 10.3 eggs for Blue-winged Teal in North Dakota. Bellrose (1980) summarized nesting studies from throughout North America. He reported mean clutch sizes of 9.0 eggs for Mallard nests and 9.8 eggs for Blue-winged Teal nests.

Table 14. Waterfowl brood attrition, 1982-90.
Mean Brood Size
Year and Species Clutch At Hatch Class I• Class II Class III
1982 Mallard 9.8 (8)1:> 8] (5) 6.8 (12) 5.5 (13) 7.8 (10) Blue-winged Teal 10.4 (26) 10.5 (13) 8.2 (33) 7.5 (17) 7.4(8)
1983 Mallard 9.8 (19) 9.2 (10) 6.9 (48) 6.8 (30) 6.2 (47) Blue-winged Teal 11.1 (47) 10.6 (32) 7.7 (39) 6.1 (26) 5.6 (32)
1984 Mallard 10.4 (19) 9.6 (16) 8.1 (34) 6.0 (7) 6.8 (6) Blue-Winged Teal 10.9 (57) 10.4 (38) 8.2 (46) 8.8 (25} 7.1 (30)
1985 Mallard 9.9 (24) 9.6 (14) 6.8 (25) 6.0 (6) 6.8 (15) Blue-winged Teal 10.9 (38) 10.8 (22) 6.5 (49) 6.8 (17) 6.3 (19)
1986. Mallard 10.3 (26) 8.0 (12} 8.1 (17) 6.6 (14) 6.4 (8) Blue-Winged Teal 11.0 (28) 10.9 (14) 8:0 (39) 7.2 (33) 6.8 (8)
1987 Mallard 10.1 (36) 9.7 (22) 7.2 (55) 6.1 (31) 6.0 (22) Blue-Winged Teal 10.9 (45) 10.0 (23) 8.3 (45) 6.3 (35) 6.3 (16)
1988 Mallard 9.8 (26) 8.5 {8) 7.4 (58) 7.5 (17) 5.9 (37) Blue-winged Teal 11.3 (32) 9.8 (17) 5.3(35) 7.4.(12) 4.6 (13)
1989 Mallard 9.2 (18) 7.9 (7) 6.9 (43) 5.5 (27) 5.9 (16) Blue-winged Teal 11.2 (33) 10.0 (15) 9.1 (41) 6.8 (24) 6.2 (17)
1990 Mallard· 9.9 (28) 9.4 (18) (.1 (45) 6.0(42) 6.4 (17) Blue-winged Teal 11.4(27) 10.7 (13) 7.7 (42) 6.8 (37) 5.6 (19)
Mean 1982-90 Mallard 9.9±0.3c (204) 9.0±0.5 (112) 7.3±0.4 (337) 6.2±0.5 (187) 6.5±0.5 (178) Blue-winged Teal 11.0±0.2 (333) 10.4±0.3 (187) 7.7±0.9 (369) 7.1±0.6 (226) 6.2±0.7 (162)
a Class I= 1-18 days, Class II= 19-42 days, Class III= 43-55 days. Classes taken from Gollop and Marshal (1954). b Number in parenthesis represents the number of nests or broods. c 95% confidence limits at p < 0.05.
Duck Broods Estimated brood mortality was based upon observed attrition of mean brood size between duckling age classes (Gollop and Marshall 1954). This method provides an estimate of minimum mortality since it does not account for broods that are lost in their entirety during the brood period (Dzubin and Gallop 1972, Ballet al. 1975, Bellrose 1980, Wheeler et al. 1984, Duncan 1986, Rotella and Ratti 1992, Mauser et al. 1994). Another problem is the potential error that can be made in classifying broods in the field (Evrard 1996a).
For Mallards, there was a significant difference in mean brood size from hatch to Class I (t=5.556, df=8, P=O.OOOS) and from Class I to Class II (t=4.510, df=8, P=0.002), resulting in a 19% and 15% duckling loss respectively (Table 14). There was no difference in mean brood size from Class II to Class III ducklings (Table 14, t=0.679, df=8, P=0.52). Total observed Mallard duckling mortality, not including loss of entire broods, was 28% from hatch to Class III.
For Blue-winged Teal, there was a significant difference in mean brood size from hatch to Class I (t=7.152, df=8, P=O.OOOl) and from Class II to Class III (t=2.898, df=8, P=0.02), resulting in a 26% and a 13% loss respectively (Table 14). There was no difference from Class I to Class II (Table 14, t=l.268, df=8, P=0.24). Total observed Blue-winged Teal duckling losses in this study were 40% from hatch to fledgling.
Jahn and Hunt (1964) reported a 16% loss between Class I and III Mallard broods for 1950-56 in Wisconsin. Dzubin and Gollop (1972) reported an 11% loss between Class I and III Mallard broods in a Canadian prairie. When adding losses of entire broods, they estimated an average loss of 36% between hatching and Class III broods. Mean Mallard brood mortality from hatch to fledgling (including losses of entire broods) was 56% in north central Minnesota (Ball et al. 1975), 65% in south central North Dakota (Talent et al. 1983), and 78% in southwest Manitoba (Rotella and Ratti 1992). Jahn and Hunt (1964) estimated the average loss for Blue-winged Teal from Class I to Class III was 10%.
23
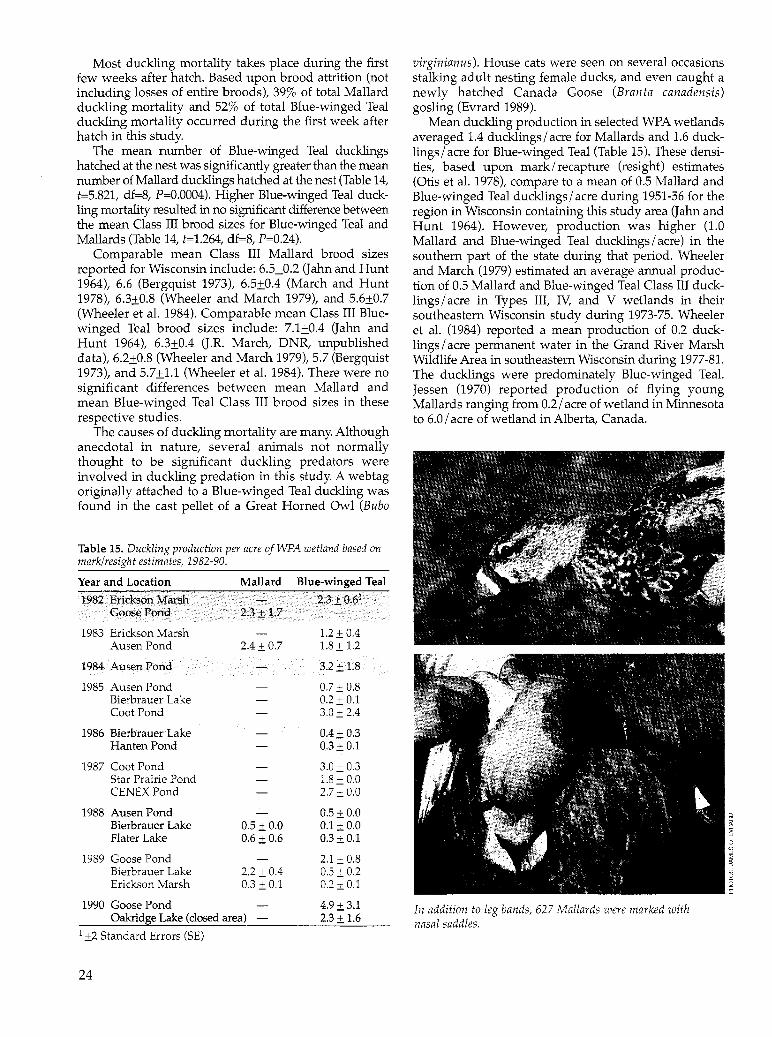
Most duckling mortality takes place during the first few weeks after hatch. Based upon brood attrition (not including losses of entire broods), 39% of total Mallard duckling mortality and 52% of total Blue-winged Teal duckling mortality occurred during the first week after hatch in this study.
The mean number of Blue-winged Teal ducklings hatched at the nest was significantly greater than the mean number of Mallard ducklings hatched at the nest (Table 14, t=5.821, df=8, P=0.0004). Higher Blue-winged Teal duckling mortality resulted in no significant difference between the mean Class III brood sizes for Blue-winged Teal and Mallards (Table 14, t=l.264, df=8, P=0.24).
Comparable mean Class III Mallard brood sizes reported for Wisconsin include: 6.5±0.2 (Jahn and Hunt 1964), 6.6 (Bergquist 1973), 6.5±0.4 (March and Hunt 1978), 6.3±0.8 (Wheeler and March 1979), and 5.6±0.7 (Wheeler et al. 1984). Comparable mean Class III Bluewinged Teal brood sizes include: 7.1±0.4 (Jahn and Hunt 1964), 6.3±0.4 (J.R. March, DNR, unpublished data), 6.2±0.8 (Wheeler and March 1979), 5.7 (Bergquist 1973), and 5.7±1.1 (Wheeler et al. 1984). There were no significant differences between mean Mallard and mean Blue-winged Teal Class III brood sizes in these respective studies.
The causes of duckling mortality are many. Although anecdotal in nature, several animals not normally thought to be significant duckling predators were involved in duckling predation in this study. A webtag originally attached to a Blue-winged Teal duckling was found in the cast pellet of a Great Horned Owl (Bubo
Table 15. Duckling production per acre ofWPA wetland based on mark/resight estimates, 1982-90.
Year and Location
1982.·. Erickson Marsh Goose Pond
1983 Erickson Marsh Ausen Pond
1984 Ausen Pond
1985 Ausen Pond Bierbrauer Lake Coot Pond
1986 Bierbrauer Lake Hanten Pond
1987 Coot Pond Star Prairie Pond CENEX Pond
1988 Ausen Pond Bierbrauer Lake Flater Lake
1989 Goose Pond Bierbrauer Lake Erickson Marsh
1990 Goose Pond
Mallard Blue-winged Teal
2.3.±0.61
2.3 ±1.7
1.2±0.4 2.4 ± 0.7 1.8 ± 1.2
0.5 ± 0.0 0.6±0.6
2.2 ± 0.4 0.3 ± 0.1
3.2± 1.8
0.7 ± 0.8 0.2 ± 0.1 3.0 ± 2.4
0.4± 0.3 0.3± 0.1
3.0 ± 0.3 1.8 ± 0.0 2.7 ± 0.0
0.5±0.0 0.1 ± 0.0 0.3± 0.1
2.1 ± 0.8 0.5 ± 0.2 0.2 ± 0.1
Oakridge Lake (closed area) 4.9 ± 3.1 2.3 + 1.6
1 ±2 Standard Errors (SE)
24
virginianus). House cats were seen on several occasions stalking adult nesting female ducks, and even caught a newly hatched Canada Goose (Branta canadensis) gosling (Evrard 1989).
Mean duckling production in selected WPA wetlands averaged 1.4 ducklings/ acre for Mallards and 1.6 ducklings/ acre for Blue-winged Teal (Table 15). These densities, based upon mark/ recapture (resight) estimates (Otis et al. 1978), compare to a mean of 0.5 Mallard and Blue-winged Teal ducklings/ acre during 1951-56 for the region in Wisconsin containing this study area (J ahn and Hunt 1964). However, production was higher (1.0 Mallard and Blue-winged Teal ducklings/ acre) in the southern part of the state during that period. Wheeler and March (1979) estimated an average annual production of 0.5 Mallard and Blue-winged Teal Class III ducklings I acre in Types III, IV, and V wetlands in their southeastern Wisconsin study during 1973-75. Wheeler et al. (1984) reported a mean production of 0.2 ducklings I acre permanent water in the Grand River Marsh Wildlife Area in southeastern Wisconsin during 1977-81. The ducklings were predominately Blue-winged Teal. Jessen (1970) reported production of flying young Mallards ranging from 0.2/ acre of wetland in Minnesota to 6.0/ acre of wetland in Alberta, Canada.
In addition to leg bands, 627 Mallards were marked with nasal saddles.
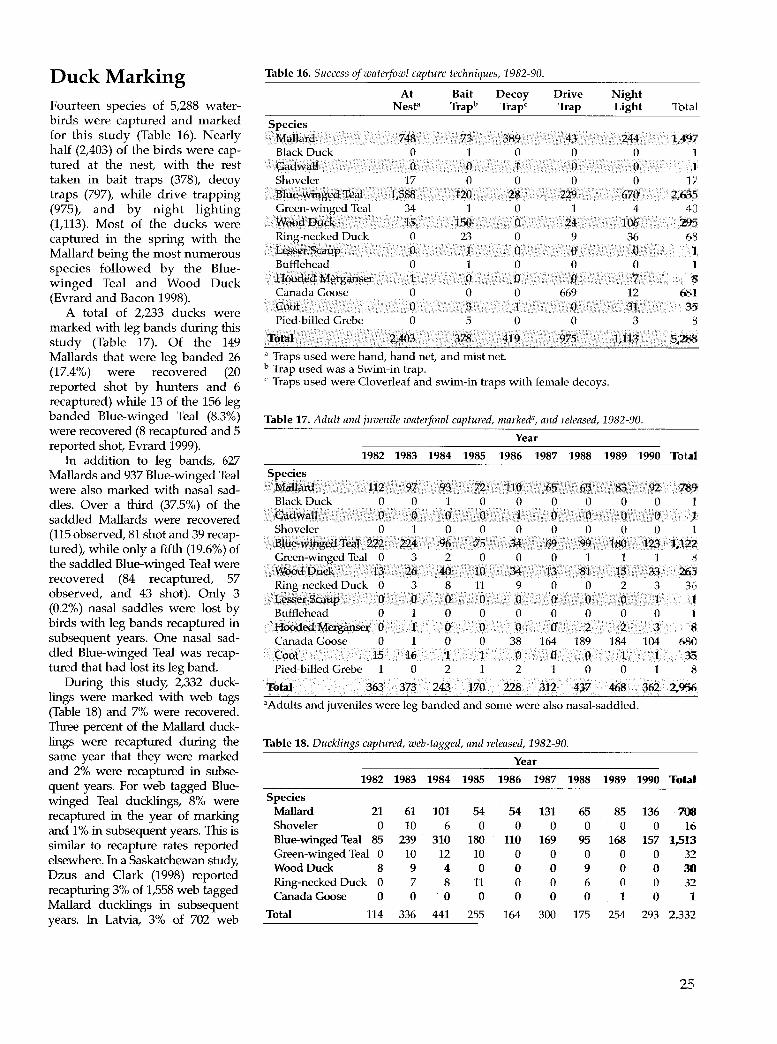
Duck Marking Table 16. Success of waterfowl capture techniques, 1982-90.
At Bait Decoy Drive Night Fourteen species of 5,288 water- Nest• Trapb Trapc Trap Light Total birds were captured and marked Species for this study (Table 16). Nearly Mllilard 748 73 389 43 244 1,497 half (2,403) of the birds were cap- Black Duck 0 1 0 0 0 1 tured at the nest, with the rest Gadwall 0 0 1 0 0 1 taken in bait traps (378), decoy Shoveler 17 0 0 0 0 17 traps (797), while drive trapping Blue-wing~ Teal 1,588 120 28 229 670 4635 (975), and by night lighting Green-winged Teal 34 1 0 1 4 4D (1,113). Most of the ducks were Wood Duck 15 150 0 24 106 295
captured in the spring with the Ring-necked Duck 0 23 0 9 36 68
Mallard being the most numerous Lesser Scaup 0 1 0 0 0 1
species followed by the Blue- Bufflehead 0 1 0 0 0 I
winged Teal and Wood Duck Hooded Merganser 1 .0 0 0 7 8
(Evrard and Bacon 1998). Canada Goose 0 0 0 669 12 6tH
A total of 2,233 ducks were Coot 0 3 1 0 31 35
marked with leg bands during this Pied-billed Grebe 0 5 0 0 3 8
study (Table 17). Of the 149 Total 2,403 378 419 975 1,113 5~288
Mallards that were leg banded 26 a Traps used were hand, hand net, and mist net. (17.4%) were recovered (20 b Trap used was a Swim-in trap.
reported shot by hunters and 6 c Traps used were Cloverleaf and swim-in traps with female decoys.
recaptured) while 13 of the 156 leg banded Blue-winged Teal (8.3%) Table 17. Adult and juvenile waterfowl captured, marked", and released, 1982-90. were recovered (8 recaptured and 5 Year reported shot, Evrard 1999).
1982 1983 1984 1985 1986 1987 1988 1989 1990 Total In addition to leg bands, 627 Mallards and 937 Blue-winged Teal Species were also marked with nasal sad- Mallard 112 97 93 72 110 65 65 83 92 789 dies. Over a third (37.5%) of the Black Duck 0 0 1 0 0 0 0 0 0 I
saddled Mallards were recovered ·Gadwall 0 0 0 0 1 0 0 0 0 1
(115 observed, 81 shot and 39 recap- Shoveler 0 1 0 0 0 0 0 0 0 1
tured), while only a fifth (19.6%) of Blue-winged.Teal . .222 224 96 75 34 69 99 180 123 1;122
the saddled Blue-winged Teal were Green-winged Teal 0 3 2 0 0 0 1 1 1 8 Wood Duck 13 26 40 10 34 13 81 15 33 265
recovered (84 recaptured, 57 Ring-necked Duck 0 3 8 11 9 0 0 2 3 36 observed, and 43 shot). Only 3 Lesser Scaup 0 0 0 0 "0 0 0 .0. ..... 1 1 (0.2%) nasal saddles were lost by Bufflehead 0 1 0 0 0 0 0 0 0 1 birds with leg bands recaptured in Hooded Merganser 0 1 0 0 0 0 2 2 3 8 subsequent years. One nasal sad- Canada Goose 0 1 0 0 38 164 189 184 104 68() died Blue-winged Teal was recap- Coot 15 16 1 1 0 0 0 1 1 35 tured that had lost its leg band. Pied-billed Grebe 1 0 2 1 2 1 0 0 1 8
During this study, 2,332 duck- Total 363 373 243 170 228 312 437 468 362 2,956 lings were marked with web tags
•Adults and juveniles were leg-banded and some were also nasal-saddled. (Table 18) and 7% were recovered. Three percent of the Mallard duck-lings were recaptured during the Table 18. Ducklings captured, web-tagged, and released, 1982-90. same year that they were marked Year and 2% were recaptured in subse-
1982 1983 1984 1985 1986 1987 1988 1989 1990 Total quent years. For web tagged Blue-winged Teal ducklings, 8% were Species
recaptured in the year of marking Mallard 21 61 101 54 54 131 65 85 136 708
and 1% in subsequent years. This is Shoveler 0 10 6 0 0 0 0 0 0 16
similar to recapture rates reported Blue-winged Teal 85 239 310 180 110 169 95 168 157 1,513
elsewhere. In a Saskatchewan study, Green-winged Teal 0 10 12 10 0 0 0 0 0 31 Wood Duck 8 9 4 0 0 0 9 0 0 30
Dzus and Clark (1998) reported Ring-necked Duck 0 7 8 11 0 0 6 0 0 31 recapturing 3% of 1,558 web tagged Canada Goose 0 0 0 0 0 0 0 1 0 1 Mallard ducklings in subsequent
Total 114 336 441 255 164 300 175 254 293 2,332 years. In Latvia, 3% of 702 web
25

tagged Mallard ducklings were recaptured in the same year (Blurns et al. 1994). The ducklings were doublemarked and it was determined that there was a 5% loss of web tags during the first 3 months after hatch.
Contribution to the Harvest Hunters shot a minimum 13.0% of local Mallards and 5.1% of local Blue-winged Teal banded within the study area from 1982-90. Direct recoveries or those birds recovered during the first hunting season after banding (Munro and Kimball1982), accounted for 10.6% of local Mallards and 4.6% of local Blue-winged Teal. March and Hunt (1978) reported a direct recovery rate for local Mallards banded in Wisconsin during 1961-72 to be from 11% to 14%. Jahn and Hunt (1964) estimated that 16% of the immature Mallards banded in 1947-57 were first year recoveries.
In three areas of Minnesota from 1956 to 1960, Jessen (1970) reported direct recovery rates for local Mallards ranging from 17.0 to 19.6%. He concluded that 70% of mortality of local Mallards occurred within Minnesota. Mallard direct recovery rates in this study were similar between adult males (7.6% ), young males (9.9% ), and young females (11.4%) (Evrard 1990). The recovery rate for adult females (3.4%) was significantly lower than the rates for adult males, young males, and young females
Band return jar located on Erickson WPA.
26
(x2=4.717, df=1, P=0.03). March and Hunt (1978) also reported a higher direct recovery rate for adult male than for adult female Mallards. In this study, the combined direct recovery rate for young Mallards (10.6%) was greater than for adults (6.5% ), although it was not a significant difference (x2=3.630, df=1, P=0.057). This may be a good indication that young Mallards had a higher mortality rate than adult Mallards Oahn and Hunt 1964, March and Hunt 1978, Johnson et al. 1992).
The direct recovery rate for adult male Blue-winged Teal (0.9%) was not significantly different than the adult female recovery rate (4.0%; x2=1.574, d£=1, P=0.21), young male recovery rate (4.2%; x2=1.982, df=1, P=0.16), or young female recovery rate (5.1%; x2=2.798, df=l, P=0.09). Combined direct recovery rates for Blue-winged Teal did not differ between adults (3.0%) and young (4.6%; x2=1.182, df=l, P=0.28), or between males (3.5%) and females (4.7%) (x2=0.659, df=1, P=0.42). These results are comparable to a direct recovery rate of 2% for adult Blue-winged Teal and 4% for immature blue-wings in Wisconsin during 1947-57 Oahn and Hunt 1964).
Hunters in this study did not select nasal saddled ducks over leg banded ducks (Evrard 1996b, Evrard 1999). There was no difference between first year recovery rates for leg banded and nasal saddled ducks (5.6%) (including: adult and young, male and female Mallards and Blue-winged Teal) than for leg banded only ducks (6.6%) during the years 1982-90 (x2=0.253, df=1, P=0.62). There was no difference in indirect recovery rates for saddled and banded birds (2.4%) vs. banded only birds (2.3%; x2=0.017, df=1, P=0.90). Similarly, there was no difference between the combined direct and indirect recovery rates of 8.0% for banded and saddled ducks and 8.9% for banded only ducks (x2=0.151 df=1, P=0.70).
Hunters shot 97 Mallards marked within the study area. Approximately 21.7% were recovered in the study area and adjacent townships of Polk and Pierce counties. The remaining marked Mallards were bagged elsewhere in Wisconsin and Minnesota (17.6%), Arkansas (12.5% ), Illinois (10.3% ), Iowa and Louisiana (5.1% each), North Dakota and Mississippi (4.1% each), Michigan and Missouri (3.1% each), South Dakota, Indiana, and Tennessee (2.1% each), and Saskatchewan, Ontario, Manitoba, Nebraska, Kentucky, Georgia, and Texas (1.0% each). Based on these results, most Mallards move south from the study area along the Mississippi River to Arkansas and adjacent Missouri, Louisiana, Mississippi, and Texas for the winter. This agrees with the observations of Jahn and Hunt (1964), Bellrose (1968), and March and Hunt (1978).
Kirby (1976) reported that 30% to 50% of the local Mallards left his Minnesota study area before October 1. Most of the adult breeding Mallards left the same study area earlier in the summer (Gilmer et al. 1977).
Forty-eight Blue-winged Teal marked in the study area were reported shot by hunters with 20.6% shot in the study area. The remaining Blue-winged Teal were shot in: Wisconsin and Minnesota (14.4%), Florida (10.2%), Louisiana ( 6.1% ), Iowa, Illinois, Indiana, Kansas, Texas, Cuba, and Columbia (4.1% each), and Ontario, Nebraska,

Missouri, Ohio, Tennessee, Kentucky, Pennsylvania, Virginia, Mexico, and Venezuela (2.0% each). Based on these results, Blue-winged Teal migrate along two routes to their winter habitat. The major route southeast through Florida, Cuba, and northern South America and a minor route southwest through Louisiana, Texas, and Mexico Gahn and Hunt 1964, Wheeler et al. 1984).
Seventeen Mallards marked elsewhere were recovered in the area of study. Six ducks originated in Wisconsin. Five were banded at the Crex Meadows Wildlife Area (approximately 60 rni north of the study area) and one was banded in east central Wisconsin. Three Mallards were banded in Saskatchewan, two each in Minnesota and South Dakota, and one each in Illinois, Kentucky, Kansas, and Arkansas. No Blue-winged Teal marked outside the study area were recovered.
Duck Harvest The Mallard was the most common species bagged during the first 2 days of the season accounting for 35% of the harvest, followed by Wood Ducks with 24% of the harvest, and Blue-winged and Green-winged Teal each comprising 12% of the harvest (Table 19). Nine other duck species made up the remaining 17% of the harvest.
During season-long bag checks in the study area in 1977-78, Petersen et al. (1982) found that Mallards made up 52% of the bag, followed by Wood Ducks with 20%, and Blue-winged Teal with 9%. Seven other species made up the remaining 19% of the harvest.
During 1954-57, Jahn and Hunt (1964) reported that Mallards averaged 29% of the statewide harvest during early October. Blue-winged Teal were the most important species comprising 50% of the bag. Green-winged Teal averaged 7% of the early October harvest. Hunting Wood Ducks was prohibited during this period.
Relative hunting success in this study, expressed as duck bagged per hunter trip, averaged 0.8 ducks/hunter (range 0.2 -1.3) during the first 2 days of the season during 1982-91 (Table 19). Hunters had poor success during the drought years of 1986 and 1988, when it took 10 hrs of hunting effort to bag a duck. Even during the most successful hunting years, it took more than 3 hrs of hunting to bag 1 duck.
During the hunting seasons of 1977-78, hunters averaged 0.5 ducks I trip, taking 3.4 hrs to bag each bird in the study area (Petersen et al. 1982). In 1949 to 1952, Jahn and Hunt (1964) reported a mean of 0.9 ducks/hunter trip for 8 sites throughout Wisconsin for the whole season. The average for the first few days of the season, however, was slightly higher (1 duck/hunter).
Table 19. Hunter bag checks during the opening weekend of the waterfowl hunting season, 1982-91.
Year
1982 1983 1984 1985 1986 1987 1988 19893 1990 1991
33 Black Duck 1 0 0 0 0 1 0 0 0 0 ·:rmtail 3 1: (). 6 Gadwall 0 0 0 0 0 0 0 1 0 0 Wige6n 1 0 2 {} 1 1 5 1 1 Blue-winged Teal 20 25 4 4 8 3 0 6 7 3 Green-winged Teal lS .4 2 8 l 2 3 11 10 6 Wood Duck 49 37 14 3 5 17 2 32 25 3 Redhead Duck 1 0 1 4 0 0 0 0 0 0 Ring-necked Duck 1 6 2 25 1 3 0 0 2 0 Lesser Scaup 1 5 0 0 5 2 0 0 0 0 Hooded Merganser 2 0 0 0 0 0 0 0 1 0 Common Merganser 0 0 0 0 1 0 0 0 0 0
Total Ducks 125 105 42 57 31 57 20 93 83 19
Canada Goose 7 4 1 2 5 10 30 2a 1 0 Coot 0 1 0 0 1 0 0 0 0 0
Number of Hunters 182 91 54 91 85 75 81 72 73 33 Number of Ducks/Hunter 0.7 1.2 0.8 0.6 0.4 0.8 0.2 1.3 1.1 0.6 Number of Hours Hunted 577 322 203 306 352 306 242 300 301 129 Number of Ducks/Hour 0.2 0.3 0.3 0.2 0.1 0.2 0.1 0.3 0.3 0.2
DaysofWeek F,S,S s,s M,T s,s S,S T,F S,S S,S s,s s,s October Date 1,2,3 1,2 1,2 5,6 4,5 1,2 8,9 7,8 6,7 5,6
a Beginning in 1989, the goose season opened in September. Twenty-nine geese were shot by 88 hunters on September 23 and 24, the opening weekend. Thirty-two geese were shot by 78 hunters on September 22 and 23, the opening weekend in 1990. Thirteen geese were shot by 60 hunters on September 21 and 22, the opening weekend in 1991.
27
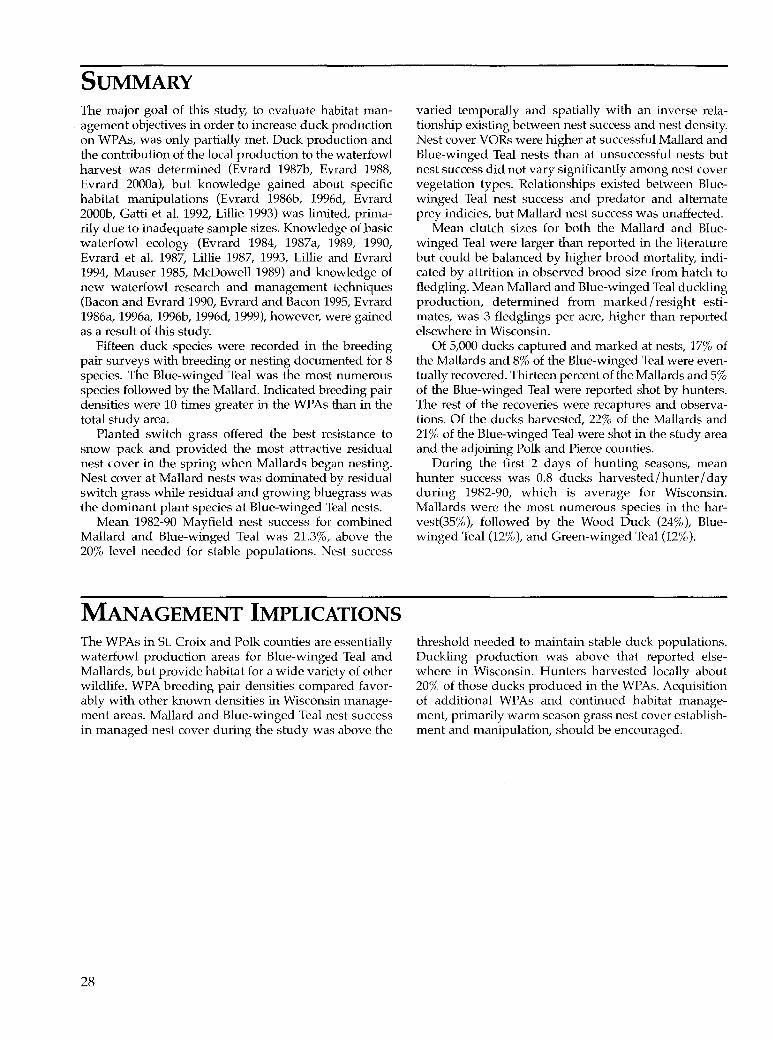
SUMMARY The major goal of this study, to evaluate habitat management objectives in order to increase duck production on WPAs, was only partially met. Duck production and the contribution of the local production to the waterfowl harvest was determined (Evrard 1987b, Evrard 1988, Evrard 2000a), but knowledge gained about specific habitat manipulations (Evrard 1986b, 1996d, Evrard 2000b, Gatti et al. 1992, Lillie 1993) was limited, primarily due to inadequate sample sizes. Knowledge of .basic waterfowl ecology (Evrard 1984, 1987a, 1989, 1990, Evrard et al. 1987, Lillie 1987, 1993, Lillie and Evrard 1994, Mauser 1985, McDowell 1989) and knowledge of new waterfowl research and management techniques (Bacon and Evrard 1990, Evrard and Bacon 1995, Evrard 1986a, 1996a, 1996b, 1996d, 1999), however, were gained as a result of this study.
Fifteen duck species were recorded in the breeding pair surveys with breeding or nesting documented for 8 species. The Blue-winged Teal was the most numerous species followed by the Mallard. Indicated breeding pair densities were 10 times greater in the WPAs than in the total study area.
Planted switch grass offered the best resistance to snow pack and provided the most attractive residual nest cover in the spring when Mallards began nesting. Nest cover at Mallard nests was dominated by residual switch grass while residual and growing bluegrass was the dominant plant species at Blue-winged Teal nests.
Mean 1982-90 Mayfield nest success for combined Mallard and Blue-winged Teal was 21.3%, above the 20% level needed for stable populations. Nest success
MANAGEMENT IMPLICATIONS The WPAs in St. Croix and Polk counties are essentially waterfowl production areas for Blue-winged Teal and Mallards, but provide habitat for a wide variety of other wildlife. WPA breeding pair densities compared favorably with other known densities in Wisconsin management areas. Mallard and Blue-winged Teal nest success in managed nest cover during the study was above the
28
varied temporally and spatially with an inverse relationship existing between nest success and nest density. Nest cover VORs were higher at successful Mallard and Blue-winged Teal nests than at unsuccessful nests but nest success did not vary significantly among nest cover vegetation types. Relationships existed between Bluewinged Teal nest success and predator and alternate prey indicies, but Mallard nest success was unaffected.
Mean clutch sizes for both the Mallard and Bluewinged Teal were larger than reported in the literature but could be balanced by higher brood mortality, indicated by attrition in observed brood size from hatch to fledgling. Mean Mallard and Blue-winged Teal duckling production, determined from marked/resight estimates, was 3 fledglings per acre, higher than reported elsewhere in Wisconsin.
Of 5,000 ducks captured and marked at nests, 17% of the Mallards and 8% of the Blue-winged Teal were eventually recovered. Thirteen percent of the Mallards and 5% of the Blue-winged Teal were reported shot by hunters. The rest of the recoveries were recaptures and observations. Of the ducks harvested, 22% of the Mallards and 21% of the Blue-winged Teal were shot in the study area and the adjoining Polk and Pierce counties.
During the first 2 days of hunting seasons, mean hunter success was 0.8 ducks harvested/hunter/ day during 1982-90, which is average for Wisconsin. Mallards were the most numerous species in the harvest(35% ), followed by the Wood Duck (24% ), Bluewinged Teal (12% ), and Green-winged Teal (12% ).
threshold needed to maintain stable duck populations. Duckling production was above that reported elsewhere in Wisconsin. Hunters harvested locally about 20% of those ducks produced in the WPAs. Acquisition of additional WPAs and continued habitat management, primarily warm season grass nest cover establishment and manipulation, should be encouraged.

APPENDIX A. STUDY PUBLICATIONS Bacon, B.R. and J.O. Evrard. 1990. Horizontal mist net for cap
hiring upland nesting ducks. North American Bird Bander 15:18-19.
Evrard, J.O. 1984a. Gray partridge in northwestern Wisconsin. Transactions of the Wisconsin Academy of Sciences, Arts, and Letters 71:57-59.
Evrard, J.O. 1984b. Oldsquaw duck in Polk County. Passenger Pigeon 46:79-80.
Evrard, J.O. 1984c. Research notes. Wisconsin Waterfowlers Association News 1(2):9.
Evrard, J.O. 1985. Great blue heron killed by kite string. Passenger Pigeon 47:90-91.
Evrard, J.O. 1986a. Loss of nasal saddle on mallard. Journal of Field Ornithology 57:170-71.
Evrard, J.O. 1986b. Managing grassland with fire. (abstract) Pp. 62 In P. Willms and R. Umberger, (eds.). Proceedings Wildlife Management on Public Lands Workshop. Sept. 15-18, Carbondale, Il. 71 pp.
Evrard, J.O. 1986c. Production study. Wisconsin Waterfowl Association News 3(2):6.
Evrard, J.O. 1987a. Red-necked grebe attacks wood duck duckling. Passenger Pigeon 49:22.
Evrard, J.O. 1987b. Breeding waterfowl on Wisconsin's prairie potholes. (abstract) Pp. 31 In Batt, B.D.J., (ed.). Symposium on the Ecology and Management of Breeding Waterfowl. Aug. 18-22, Winnipeg, Manitoba, Canada.
Evrard, J.O. 1987c. Common loon breeding in St. Croix County. Passenger Pigeon 49:98-100.
Evrard, J.O. 1987d. Oakridge lake waterfowl production area. Wisconsin Natural Resources Magazine 11(6):54.
Evrard, J.O. 1988a. Mallard production in northwest Wisconsin. (abstract) Pp. 130 In Johnson, M.J. (ed.). Proceedings of the Mallard Symposium. Aug. 19-22, Jamestown, ND. 148 pp.
Evrard, J.O. 1988b. Nesting red-necked grebes in St. Croix County, Wisconsin. Passenger Pigeon 50:291-295.
Evrard, J.O. 1989a. House cat captures gosling. Passenger Pigeon 51:261-262.
Evrard, J.O. 1989b. Stocking pheasants in northwestern Wisconsin. Research Management/Findings (24):1-4. Wisconsin Department of Natural Resources, Madison.
Evrard, J.O. 1990a. Male philopatry in mallards. Condor 92:247-248.
Evrard, J.O. 1990b. Trumpeter swans in St. Croix and Polk counties. Passenger Pigeon 52:29-33.
Evrard, J.O. 1991. An update on trumpeter swans in St. Croix County. Passenger Pigeon 53:122-125.
Evrard, J.O. 1992. Canada goose production and harvest in 5t. Croix County, Wisconsin. (abstract). ill R. Lawrenz, (ed.). St. Croix River Research Rendezvous. Oct. 20, Marine on St. Croix, MN.
Evrard, J.O. 1993. Small mammal populations of managed grasslands in St. Croix County, Wisconsin. (abstrac(l In R. Lawrenz, (ed.). St. Croix River Research Rendezv01"s. Oct. 19, Marine on St. Croix, MN.
Evrard, J.O. 1994. Spotlight - CRP to the rescue. Pheasrmts Forever, The Journal of Upland Game Conservation 11(1):16-55.
Evrard, J.O. 1995. Canada goose populations and harvest in St. Croix County, Wisconsin. Research Report (168):1-9. Wisconsin Department of Natural Resources, Madison.
Evrard, J.O. 1996a. Waterfowl use of nesting structures :in northwest Wisconsin. Research Management/Findi11gs (39):1-4. Wisconsin Department of Natural Resources, Madison.
Evrard, J.O. 1996b. Winter weather and pheasant populations and harvests in northwestern Wisconsin. Research Report (171):1-18. Wisconsin Department of Natural Resources, Madison.
Evrard, J.O. 1996c. Effects of nasal saddles on mallards and blue-winged teal. Wildlife Society Bulletin 24:717-721.
Evrard, J.O. 1996d. Accuracy of aging duck broods in the field. Journal of Field Ornithology 67:453-455.
Evrard, J.O. 1999. Mallard and blue-winged teal philopatry in northwest Wisconsin. North American Bird Bander 24:38-4.2.
Evrard, J.O. 2000. The conservation reserve program and duck and pheasant production in northwest Wisconsin. Research Report (183):1-12. Wisconsin Department of Natural Resources, Madison.
Evrard, J.O. 2000. Overwinter food plots for pheasants. Research/Management Findings (44):1-4. Wisconsin Department of Natural Resources, Madison.
Evrard, J.O. 2000. Short duration grazing and duck production: a Wisconsin case history. Research/Managem,mt Findings (45):1-4. Wisconsin Department of Natural Resources, Madison.
2.9

Appendix A. (continued)
Evrard, J.O. and B.R. Bacon. 1995a. Bird nest densities in managed grasslands. Passenger Pigeon 57:89-95.
Evrard, J.O. and B.R. Bacon. 1995b. Blue-winged teal clutch augmentation. Passenger Pigeon 57:259-261.
Evrard, J.O. and B.R. Bacon. 1998a. Duck trapping success and mortality using four trap designs. North American Bird Bander 23:110-114.
Evrard, J.O. and B.R. Bacon. 1998b. Northern harrier nest site characteristics. Passenger Pigeon 60:305-312.
Evrard, J.O., D.A. Snoble, P.B. Doeneir and J.A. Dechant. 1991. Nesting short-eared owls and voles in St. Croix County. Passenger Pigeon 53:223-226.
Evrard, J.O. and B.A. Moss. 1987. Cost-effective release dates for pen-reared pheasant cocks in Wisconsin's day-old-chick program. (abstract) Mid-West Wildlife Conference 49:206.
Evrard, J.O. and R.A. Lillie. 1987. Duck and pheasant management in the pothole region of Wisconsin. Wisconsin Department of Natural Resources. Interim Rept. Study 316. Madison. 114 pp.
Evrard, J.O. and R.A. Lillie. 1996. The flora and fauna of northwest Wisconsin waterfowl production areas. Transactions of the Wisconsin Academy of Sciences Arts and Letters 84:69-102.
Evrard, J.O., R.A. Lillie and T.R. Grunewald. 1987. Unusual upland nests of the ring-necked duck. Journal of Field Ornithology 58:31.
Gatti, R.C., J.O. Evrard and W.J. Vander Zowen. 1992. Electric fencing for duck and pheasant production in Wisconsin. Wisconsin Department of Natural Resources Technical Bulletin Number 178. 19 pp.
30
Lillie, R.A. 1987. Limnological characteristics of Wisconsin's prairie potholes. (abstract) Pp. 40 In Batt, B.D,J., (ed.). Symposium on the ecology and management of breeding waterfowl. Aug. 18-22, Winnipeg, Manitoba, Canada.
Lillie, R.A. 1991. The adult aquatic and semiaquatic Coleoptera of nine northwestern Wisconsin wetlands. Coleopterists Bulletin 45(2):101-111.
Lillie, R.A. 1993a. Limnological characteristics of wetlands in the prairie pothole region of western Wisconsin. (abstract) Pp. 29-30 ln Batt, B.D.J., (ed.). Proceedings of the Symposium on Prairie Ecosystems: Wetland Ecology, Management and Restoration. Aug. 9-13, Jamestown, ND.
Lillie, R.A. 1993b. Use of federal waterfowl production area wetlands for rearing walleyes: impacts on macroinvertebrates. Research/Management Findings (36):1-4. Wisconsin Department of Natural Resources, Madison.
Lillie, R.A. and J.O. Evrard. 1994. Influence of macroinvertebrates and macrophytes on waterfowl utilization of wetlands in the prairie pothole region of northwestern Wisconsin. Hydrobiologia 279/280:235-246.
Mauser, D.M. 1985. Invertebrates, aquatic plants, and waterfowl broods on four selected wetlands in St. Croix County, Wisconsin. University of Wisconsin, Stevens Point. M.S. Thesis. 85 pp.
McDowell, P.K. 1989. The impact of waterfowl production area (WPA) fish communities upon the invertebrate food base of waterfowl. University of Wisconsin, Stevens Point. M.S. Thesis. 66 pp.
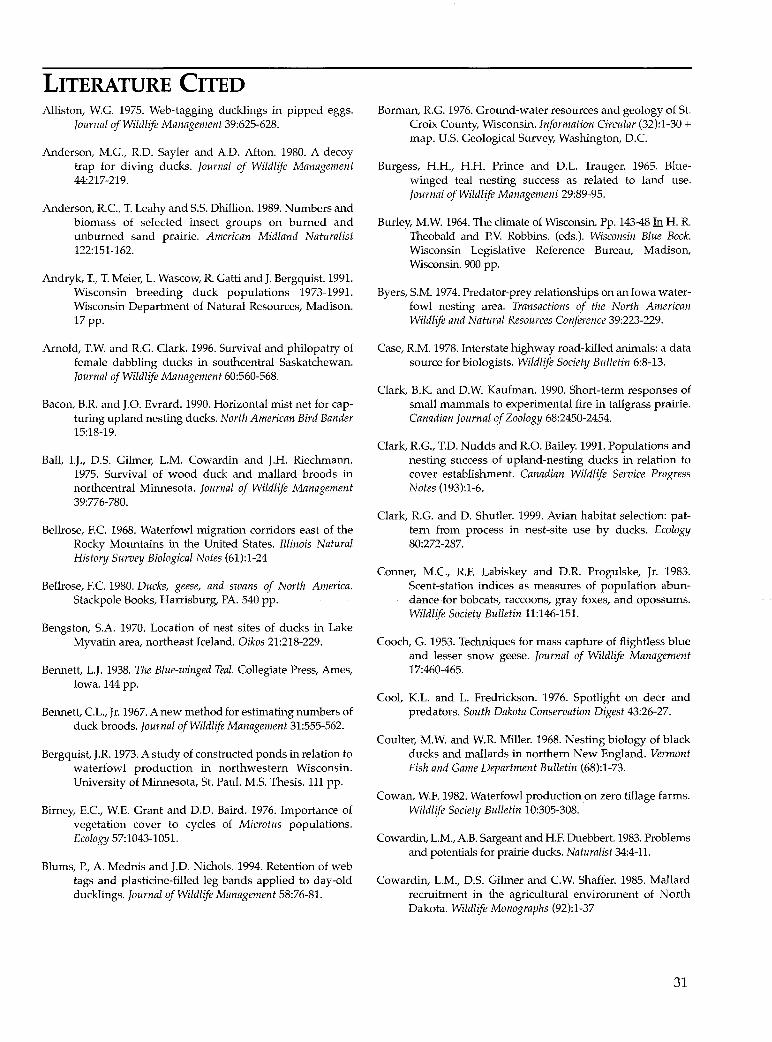
LITERATURE CITED Alliston, W.G. 1975. Web-tagging ducklings in pipped eggs.
Journal of Wildlife Management 39:625-628.
Anderson, M.G., RD. Sayler and A.D. Afton. 1980. A decoy trap for diving ducks. Journal of Wildlife Management 44:217-219.
Anderson, R.C., T. Leahy and S.S. Dhillion. 1989. Numbers and biomass of selected insect groups on burned and unburned sand prairie. American Midland Naturalist 122:151-162.
Andryk, T., T. Meier, L. Wascow, R. Gatti and J. Bergquist. 1991. Wisconsin breeding duck populations 1973-1991. Wisconsin Department of Natural Resources, Madison. 17pp.
Arnold, T.W. and R.G. Clark. 1996. Survival and philopatry of female dabbling ducks in southcentral Saskatchewan. Journal of Wildlife Management 60:560-568.
Bacon, B.R. and J.O. Evrard. 1990. Horizontal mist net for capturing upland nesting ducks. North American Bird Bander 15:18-19.
Ball, I.J., D.S. Gilmer, L.M. Cowardin and J.H. Riechmann. 1975. Survival of wood duck and mallard broods in northcentral Minnesota. Journal of Wildlife Management 39:776-780.
Bellrose, F.C. 1968. Waterfowl migration corridors east of the Rocky Mountains in the United States. Illinois Natural History Survey Biological Notes (61):1-24
Bellrose, F.C. 1980. Ducks, geese, and swans of North America. Stackpole Books, Harrisburg, PA. 540 pp.
Bengston, S.A. 1970. Location of nest sites of ducks in Lake Myvatin area, northeast Iceland. Oikos 21:218-229.
Bennett, L.J. 1938. The Blue-winged Teal. Collegiate Press, Ames, Iowa. 144 pp.
Bennett, C.L., Jr. 1967. A new method for estimating numbers of duck broods. Journal of Wildlife Management 31:555-562.
Bergquist, J.R. 1973. A study of constructed ponds in relation to waterfowl production in northwestern Wisconsin. University of Minnesota, St. Paul. M.S. Thesis. 111 pp.
Birney, E.C., W.E. Grant and D.D. Baird. 1976. Importance of vegetation cover to cycles of Microtus populations. Ecology 57:1043-1051.
Blums, P., A. Mednis and J.D. Nichols. 1994. Retention of web tags and plasticine-filled leg bands applied to day-old ducklings. Journal of Wildlife Management 58:76-81.
Borman, R.G. 1976. Ground-water resources and geology of St. Croix County, Wisconsin. Information Circular (32):1-30 + map. U.S. Geological Survey, Washington, D.C.
Burgess, H.H., H.H. Prince and D.L. Trauger. 1965. Bluewinged teal nesting success as related to land use. Journal of Wildlife Management 29:89-95.
Burley, M.W. 1964. The climate of Wisconsin. Pp. 143-48 In H. R. Theobald and P.V. Robbins. (eds.). Wisconsin Blue Book. Wisconsin Legislative Reference Bureau, Madison, Wisconsin. 900 pp.
Byers, S.M. 1974. Predator-prey relationships on an Iowa waterfowl nesting area. Transactions of the North American Wildlife and Natural Resources Conference 39:223-229.
Case, R.M. 1978. Interstate highway road-killed animals: a data source for biologists. Wildlife Society Bulletin 6:8-13.
Clark, B.K. and D.W. Kaufman. 1990. Short-term responses of small mammals to experimental fire in tallgrass prairie. Canadian Journal of Zoology 68:2450-2454.
Clark, R.G., T.D. Nudds and R.O. Bailey. 1991. Populations and nesting success of upland-nesting ducks in relation to cover establishment. Canadian Wildlife Service Progress Notes (193):1-6.
Clark, R.G. and D. Shutler. 1999. Avian habitat selection: pattern from process in nest-site use by ducks. Ecology 80:272-287.
Conner, M.C., R.F. Labiskey and D.R. Progulske, Jr. 1983. Scent-station indices as measures of population abundance for bobcats, raccoons, gray foxes, and opossums. Wildlife Society Bulletin 11:146-151.
Cooch, G. 1953. Techniques for mass capture of flightless blue and lesser snow geese. Journal of Wildlife Management 17:460-465.
Cool, K.L. and L. Fredrickson. 1976. Spotlight on deer and predators. South Dakota Conservation Digest 43:26-27.
Coulter, M.W. and W.R. Miller. 1968. Nesting biology of black ducks and mallards in northern New England. Vermont Fish and Game Department Bulletin (68):1-73.
Cowan, W.F. 1982. Waterfowl production on zero tillage farms. Wildlife Society Bulletin 10:305-308.
Cowardin, L.M., A.B. Sargeant and H.F. Duebbert. 1983. Problems and potentials for prairie ducks. Naturalist 34:4-11.
Cowardin, L.M., D.S. Gilmer and C.W. Shaffer. 1985. Mallard recruitment in the agricultural environment of North Dakota. Wildlife Monographs (92):1-37
31
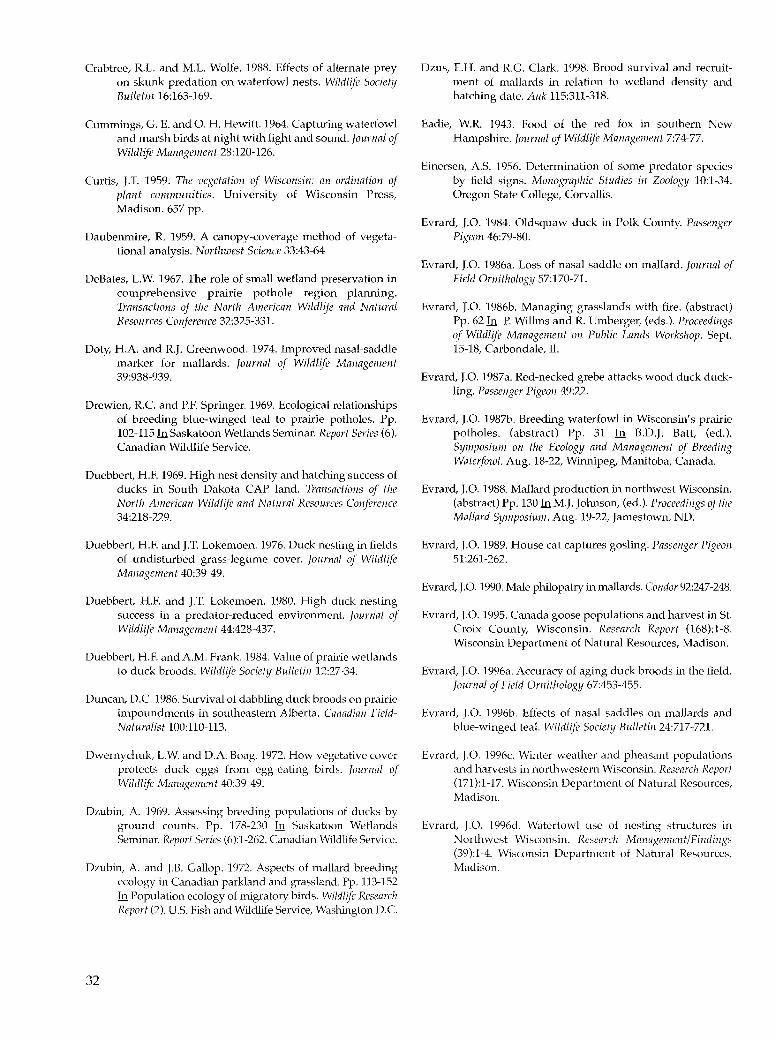
Crabtree, R.L. and M.L. Wolfe. 1988. Effects of alternate prey on skunk predation on waterfowl nests. Wildlife Society Bulletin 16:163-169.
Cummings, G. E. and 0. H. Hewitt. 1964. Capturing waterfowl and marsh birds at night with light and sound. Journal of Wildlife Management 28:120-126.
Curtis, J.T. 1959. The vegetation of Wisconsin: an ordination of plant communities. University of Wisconsin Press, Madison. 657 pp.
Daubenmire, R. 1959. A canopy-coverage method of vegetational analysis. Northwest Science 33:43-64
DeBates, L.W. 1967. The role of small wetland preservation in comprehensive prairie pothole region planning. Transactions of the North American Wildlife and Natural Resources Conference 32:325-331.
Doty, H.A. and R.J. Greenwood. 1974. Improved nasal-saddle marker for mallards. Journal of Wildlife Management 39:938-939.
Drewien, R.C. and P.F. Springer. 1969. Ecological relationships of breeding blue-winged teal to prairie potholes. Pp. 102-115 In Saskatoon Wetlands Seminar. Report Series (6). Canadian Wildlife Service.
Duebbert, H.F. 1969. High nest density and hatching success of ducks in South Dakota CAP land. Transactions of the North American Wildlife and Natural Resources Conference 34:218-229.
Duebbert, H.F. and J.T. Lokemoen. 1976. Duck nesting in fields of undisturbed grass-legume cover. Journal of Wildlife Management 40:39-49.
Duebbert, H.F. and J.T. Lokemoen. 1980. High duck nesting success in a predator-reduced environment. Journal of Wildlife Management 44:428-437.
Duebbert, H.F. and A.M. Frank. 1984. Value of prairie wetlands to duck broods. Wildlife Society Bulletin 12:27-34.
Duncan, D.C. 1986. Survival of dabbling duck broods on prairie impoundments in southeastern Alberta. Canadian FieldNaturalist 100:110-113.
Dwernychuk, L.W. and D.A. Boag. 1972. How vegetative cover protects duck eggs from egg-eating birds. Journal of Wildlife Management 40:39-49.
Dzubin, A. 1969. Assessing breeding populations of ducks by ground counts. Pp. 178-230 In Saskatoon Wetlands Seminar. Report Series (6):1-262. Canadian Wildlife Service.
Dzubin, A. and J.B. Gallop. 1972. Aspects of mallard breeding ecology in Canadian parkland and grassland. Pp. 113-152 In Population ecology of migratory birds. Wildlife Research Report (2). U.S. Fish and Wildlife Service, Washington D.C.
32
Dzus, E.H. and R.G. Clark. 1998. Brood survival and recruitment of mallards in relation to wetland density and hatching date. Auk 115:311-318.
Eadie, W.R. 1943. Food of the red fox in southern New Hampshire. Journal of Wildlife Management 7:74-77.
Einersen, A.S. 1956. Determination of some predator species by field signs. Monographic Studies in Zoology 10:1-34. Oregon State College, Corvallis.
Evrard, J.O. 1984. Oldsquaw duck in Polk County. Passenger Pigeon 46:79-80.
Evrard, J.O. 1986a. Loss of nasal saddle on mallard. Journal of Field Ornithology 57:170-71.
Evrard, J.O. 1986b. Managing grasslands with fire. (abstract) Pp. 62 In P. Willms and R. Umberger, (eds.). Proceedings of Wildlife Management on Public Lands Workshop. Sept. 15-18, Carbondale, Il.
Evrard, J.O. 1987a. Red-necked grebe attacks wood duck duckling. Passenger Pigeon 49:22.
Evrard, J.O. 1987b. Breeding waterfowl in Wisconsin's prairie potholes. (abstract) Pp. 31 In B.D.J. Batt, (ed.). Symposium on the Ecology and Management of Breeding Waterfowl. Aug. 18-22, Winnipeg, Manitoba, Canada.
Evrard, J.O. 1988. Mallard production in northwest Wisconsin. (abstract) Pp. 130 In M.J. Johnson, (ed.). Proceedings of the Mallard Symposium. Aug. 19-22, Jamestown, ND.
Evrard, J.O. 1989. House cat captures gosling. Passenger Pigeon 51:261-262.
Evrard, J.O. 1990. Male philopatry in mallards. Condor 92:247-248.
Evrard, J.O. 1995. Canada goose populations and harvest in St. Croix County, Wisconsin. Research Report (168):1-8. Wisconsin Department of Natural Resources, Madison.
Evrard, J.O. 1996a. Accuracy of aging duck broods in the field. Journal of Field Ornithology 67:453-455.
Evrard, J.O. 1996b. Effects of nasal saddles on mallards and blue-winged teal. Wildlife Society Bulletin 24:717-721.
Evrard, J.O. 1996c. Winter weather and pheasant populations and harvests in northwestern Wisconsin. Research Report (171):1-17. Wisconsin Department of Natural Resources, Madison.
Evrard, J.O. 1996d. Waterfowl use of nesting structures in Northwest Wisconsin. Research Management/Findings (39):1-4. Wisconsin Department of Natural Resources, Madison.

Evrard, J.O. 1999. Mallard and blue-winged teal philopatry in northwest Wisconsin. North American Bird Bander 24:38-42.
Evrard, J.O. 2000a. The Conservation Reserve Program and duck and pheasant production in northwest Wisconsin. Research Report (183):1-9. Wisconsin Department of Natural Resources, Madison.
Evrard, J.O. 200Gb. Short duration grazing and duck production: a Wisconsin case history. Research Management/Findings (45):1-4. Wisconsin Department of Natural Resources, Madison
Evrard, J.O. and R.A. Lillie. 1987. Duck and pheasant management in the pothole region of Wisconsin. Wisconsin Department of Natural Resources. Interim Rept. Study 316. Pittman-Robertson Project W-141-R. Madison. 115 pp.
Evrard, J.O. and R.A. Lillie. 1996. Flora and fauna of northwest Wisconsin waterfowl production areas. Transactions of the Wisconsin Academy of Sciences, Arts and Letters 84:69-102.
Evrard, J.O., B.R. Bacon and T.R. Grunewald. 1987. Unusual upland nests of the ring-necked duck. Journal of Field Ornithology 58:31.
Evrard, J.O. and B.R. Bacon. 1995. Blue-winged teal nest augmentation. Passenger Pigeon 57:259-261.
Evrard, J.O. and B.R. Bacon. 1998. Duck trapping success and mortality using four trap designs. North American Bird Bander 23:110-114.
Faanes, C.A. 1981. Birds of the St. Croix River Valley: Minnesota and Wisconsin. North American Fauna (73):1-196. U.S. Fish and Wildlife Service, Washington D.C.
Fleskes, J.P. 1986. Evaluation of waterfowl recruitment at Union Slough National Wildlife Refuge. Iowa State University, Ames. M.S. Thesis 139 pp.
Fleskes, J.P. and E.E. Klass. 1991. Dabbling duck recruitment in relation to habitat and predators at Union Slough National Wildlife Refuge, Iowa. Fish and Wildlife Technical Report (32):1-19. U.S. Fish and Wildlife Service, Washington D.C.
Fritzell, E.K. 1975. Effects of agricultural burning on nesting waterfowl. Canadian Field-Naturalist 89:21-27.
Fuller, T.K. and D.W. Kuehn. 1985. Population characteristics of striped skunks in northcentral Minnesota. Journal of Mammalogy 66:813-815.
Gabor, T.M., R.E. Kissell, Jr., D.A. Elrod and R.E. Lizotte, Jr. 1994. Factors affecting scent station visitation rates by raccoons and bobcats. Proceedings of the Annual Conference Southeastern Association of Fish and Wildlife Agencies 48:182-190.
Gates, J.M. 1965. Duck nesting and production on Wiscons:in farmlands. Journal of Wildlife Management 29:515-523.
Gatti, R.C. 1987. Duck production: the Wisconsin picture. Research Management/Findings (1):1-4. Wisconsin Department of Natural Resources, Madison.
Gatti, R.C. 1988. Trends in Wisconsin's spring duck surveys. Research Management/Findings (10):1-4. Wisconsin Department of Natural Resources, Madison.
Gatti, R.C., J.O. Evrard and W.J. Vander Zowen. 1992. Electric fencing for duck and pheasant production in Wisconsin. Technical Bulletin (176):1-19. Wisconsin Department of Natural Resources, Madison.
Geluso, K. N., G. D. Schroeder and T. B. Bragg. 1986. Fire avoidance behavior of meadow voles (Microtus pennsylvanicus). American Midland Naturalist 116:202-205.
Gilmer, D.S., R.E. Kirby, I.J. Ball and J.H. Reichmann. 1977. Post-breeding activities of mallards and wood ducks in north-central Minnesota. Journal of Wildlife Management 41:345-359.
Glover, F.A. 1956. Nesting and production of the blue-winged teal in northwest Iowa. Journal of Wildlife Management 20:28-46.
Glup, S.S. 1987. Effect of land use and predation on waterfowl production on Valentine national wildlife refuge, Nebraska. University of Nebraska, Lincoln. M.S. Thesis. 89pp.
Gollop, J.B. and W.H. Marshall. 1954. A guide for aging duck broods in the field. Mississippi Flyway Council Technical Section. 14 pp. Mimeo.
Greenwood, R.J. 1977. Evaluation of nasal marker for ducks. Journal of Wildlife Management 41:582-585.
Greenwood, R.J. 1981. Food of prairie raccoons during the waterfowl nesting season. Journal of Wildlife Management 45:754-760.
Greenwood, R.J. 1989. Influence of striped skunk removal on upland duck nest success in North Dakota. Wildlife Society Bulletin 14:6-11.
Greenwood, R.J., A.B. Sargeant, D.H. Johnson, L.M. Woardin and T.L. Shaffer. 1995. Factors association with duck nest success in the prairie pothole region of Canada. Wildlife Monographs (128):1-57.
Gullion, G.W. 1951. A marker for waterfowl. Journal of Wildlife Management 15:222-223.
Gustafson, T.L. 1984. Epistat statistical package. Epistat Inc., Round Rock, Texas.
33

Guyn, K. L. and R. G. Clark. 1997. Cover characteristics and success of natural and artificial duck nests. Journal of Field Ornitholgy 68:33-41.
Hansson, L. and H. Henttonen. 1988. Rodent dynamics as a community process. Trends in Ecology and Evolution 3:195-200.
Heiser, N.G. 1971. Nest site selection by blue-winged teal (Anas discors) in northwest Iowa. Iowa St. Univ., Ames. M.S. Thesis. 29 pp.
Hernandez, F., D. Rollins and R. Cantu. 1997. Evaluating evidence to identify ground-nest predators in west Texas. Wildlife Society Bulletin 25:826-831.
Higgins, K.F., L.M. Kirsch and I.J. Ball, Jr. 1969. A cable chain device for locating duck nests. Journal of Wildlife Management 33:1009-1011.
Higgins, K.F., L.M. Kirsch, A.T. Klett and H.W. Miller. 1992. Waterfowl production on the Woodworth station in south-central North Dakota, 1965-1981. Research Publication (180):1-79. U.S. Fish and Wildlife Service, Washington, D.C.
Hill, E.P. and P.W. Sumner. 1980. Scent-stations as indices of abundance in some furbearers of Alabama. Alabama Department of Conservation and Natural Resources, Game and Fish Division. Final Rept. PR Proj. W-44-5 Study VI. 32 pp.
Hill, D.A. 1984a. Factors affecting nest success in the mallard and tufted duck. Ornis Scandinavica 15:115-122.
Hill, D.A. 1984b. Population regulation in the mallard (Anas platyrhynchos). Journal of Animal Ecology 53:191-202.
Hill, D.A. 1984c. Clutch predation in relation to nest density in mallard and tufted duck. Wildfowl 35:151-156.
Hines, J.E. and G.J. Mitchell. 1983. Gadwall nest-site selection and nesting success. Journal of Wildlife Management 47:1063-1071.
Hunt, G.S. and K.J. Dahlka. 1953. Live trapping of diving ducks. Journal of Wildlife Management 17:92-95.
Hunt, R.A., D.E. Evenson and M. L. Andersen. 1982. Wisconsin breeding duck populations 1973-1982. Wisconsin Department of Natural Resources, Madison. 10 pp.
Huntly, N. and O.J. Reichman. 1994. Effects of subterranean mammalian herbivores on vegetation. Journal of Mammalogy 75:852-859.
Jacobson, J.O. 1969. Application of a night-time roadside census to striped skunk population studies. North Dakota State University, Fargo. M.S. Thesis. 83 pp.
34
Jahn, L.R. and R.A. Hunt. 1964. Duck and coot ecology and management in Wisconsin. Technical Bulletin (33):1-212. Wisconsin Conservation Department. Madison.
Jessen, R.L. 1970. Mallard population trends and hunting losses in Minnesota. Journal of Wildlife Management 34:93-105.
Johnson, D.H. 1979. Estimating nest success: the Mayfield method and an alternative. Auk 96:651-661.
Johnson, R. G. and S. A. Temple. 1990. Nest predation and brood parasitism of tallgrass prairie birds. Journal of Wildlife Management 54:106-111.
Johnson, D.H., J.D. Nichols and M.D. Swartz. 1992. Population dynamics of breeding waterfowl. pp. 446-485 In B.D.J. Batt, A.D. Afton, M.G. Anderson, C.D. Ankney, D.H. Johnson, J.A. Kadlec and G.L. Krapu, (eds.). Ecology and management of breeding waterfowl. University of Minnesota Press, Minneapolis. 39 pp.
Kaiser, P.H., S.S. Berlinger and L.H. Fredrickson. 1979. Response of blue-winged teal to range management on waterfowl production areas in southeastern South Dakota. Journal of Range Management 32:295-298.
Kantak, G.E. 1981. Small mammal communities in old fields and prairies of Wisconsin: significance of the microclimate. University of Wisconsin, Madison. Ph.D Thesis. 134 pp.
Kantrud, H.A. 1993. Duck nest success on conservation reserve program land in the prairie pothole region. Journal of Soil and Water Conservation 46:238-242.
Kaufman, D.W., G.A. Kaufman and E.J. Finck. 1983. Effects of fire on rodents in tallgrass prairie of the Flint Hills region of eastern Kansas. Prairie Naturalist 15:49-56.
Kaufman, D.W., S.K. Gurtz and G.A. Kaufman. 1988. Movements of Peromyscus maniculatus in response to prairie fire. Prairie Naturalist 20:225-229.
Kaufman, D.W., E.J. Finck and G.A. Kaufman. 1990. Small mammals and grassland fires. Pp. 46-80 in S. L. Collins and L. L. Wallace, ed(s). Fire in North American tallgrass prairies. University of Oklahoma Press, Norman and London. 173 pp.
Keenan, R J. 1980. Spatial use of home range among red foxes (Vulpes fulva) in south central Ontario. Pp. 1041-1067ln J. A. Chapman and D. Pursley, (eds.). Worldwide Furbearer Conference Proceedings. 1551 pp.
Keys, J.E., C. Carpenter, S.L. Hooks, F. G. Koeney, W.H. McNabb, W.E. Russell and M.L. Smith. 1995. Ecological units of the eastern United States: First approximation Map (scale 1:3,500,000). Technical Publication R8-TP 21. U.S. Forest Service, Atlanta, GA.
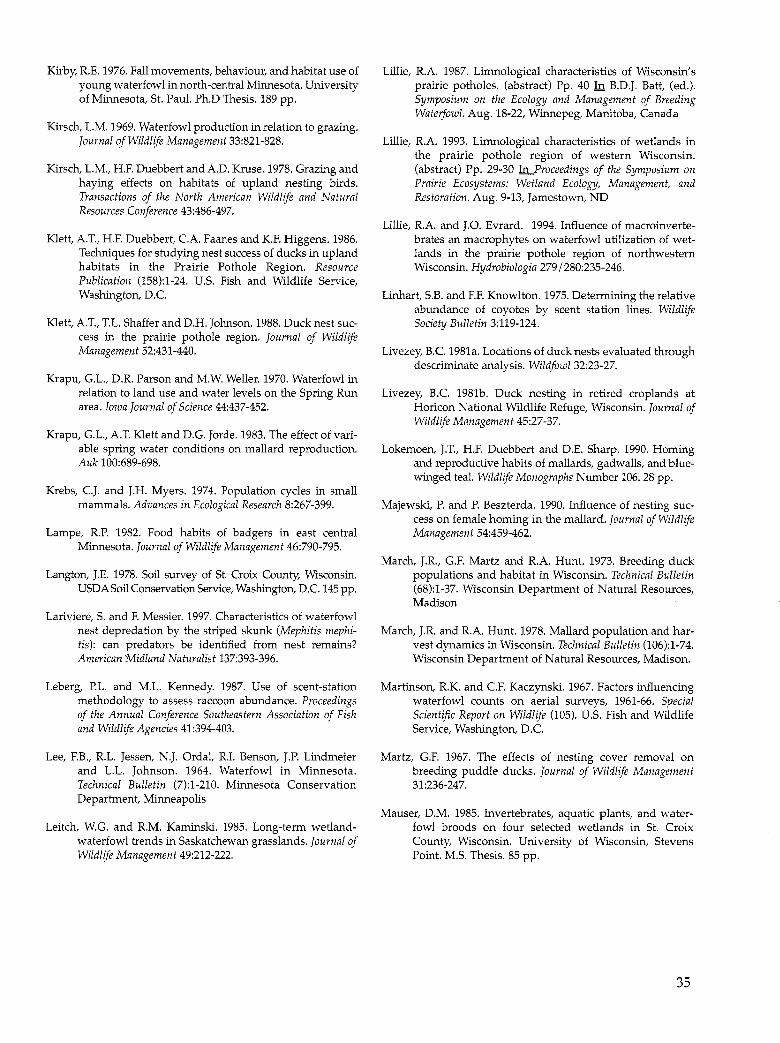
Kirby, R.E. 1976. Fall movements, behaviour, and habitat use of young waterfowl in north-central Minnesota. University of Minnesota, St. Paul. Ph.D Thesis. 189 pp.
Kirsch, L.M. 1969. Waterfowl production in relation to grazing. Journal of Wildlife Management 33:821-828.
Kirsch, L.M., H.F. Duebbert and A.D. Kruse. 1978. Grazing and haying effects on habitats of upland nesting birds. Transactions of the North American Wildlife and Natural Resources Conference 43:486-497.
Klett, A.T., H.F. Duebbert, C.A. Faanes and K.F. Higgens. 1986. Techniques for studying nest success of ducks in upland habitats in the Prairie Pothole Region. Resource Publication (158):1-24. U.S. Fish and Wildlife Service, Washington, D.C.
Klett, A.T., T.L. Shaffer and D.H. Johnson. 1988. Duck nest success in the prairie pothole region. Journal of Wildlife Management 52:431-440.
Krapu, G.L., D.R. Parson and M.W. Weller. 1970. Waterfowl in relation to land use and water levels on the Spring Run area. Iowa Journal of Science 44:437-452.
Krapu, G.L., A.T. Klett and D.C. Jorde. 1983. The effect of variable spring water conditions on mallard reproduction. Auk 100:689-698.
Krebs, C.J. and J.H. Myers. 1974. Population cycles in small mammals. Advances in Ecological Research 8:267-399.
Lampe, R.P. 1982. Food habits of badgers in east central Minnesota. Journal of Wildlife Management 46:790-795.
Langton, J.E. 1978. Soil survey of St. Croix County, Wisconsin. USDA Soil Conservation Service, Washington, D.C. 145 pp.
Lariviere, S. and F. Messier. 1997. Characteristics of waterfowl nest depredation by the striped skunk (Mephitis mephitis): can predators be identified from nest remains? American 'Midland Naturalist 137:393-396.
Leberg, P.L. and M.L. Kennedy. 1987. Use of scent-station methodology to assess raccoon abundance. Proceedings of the Annual Conference Southeastern Association of Fish and Wildlife Agencies 41:394-403.
Lee, F.B., R.L. Jessen, N.J. Ordal, R.I. Benson, J.P. Lindmeier and L.L. Johnson. 1964. Waterfowl in Minnesota. Technical Bulletin (7):1-210. Minnesota Conservation Department, Minneapolis
Leitch, W.G. and R.M. Kaminski. 1985. Long-term wetlandwaterfowl trends in Saskatchewan grasslands. Journal of Wildlife Management 49:212-222.
Lillie, R.A. 1987. Limnological characteristics of Wisconsin's prairie potholes. (abstract) Pp. 40 In B.D.J. Batt, (ed.). Symposium on the Ecology and Management of Breeding Waterfowl. Aug. 18-22, Winnepeg, Manitoba, Canada
Lillie, R.A. 1993. Limnological characteristics of wetlands in the prairie pothole region of western Wisconsin. (abstract) Pp. 29-30 In Proceedings of the Symposium on Prairie Ecosystems: Wetland Ecology, Management, and Restoration. Aug. 9-13, Jamestown, ND
Lillie, R.A. and J.O. Evrard. 1994. Influence of macroinvertebrates an macrophytes on waterfowl utilization of wetlands in the prairie pothole region of northwestern Wisconsin. Hydrobiologia 279 I 280:235-246.
Linhart, S.B. and F.F. Knowlton. 1975. Determining the relative abundance of coyotes by scent station lines. Wildlife Society Bulletin 3:119-124.
Livezey, B.C. 1981a. Locations of duck nests evaluated through descriminate analysis. Wildfowl 32:23-27.
Livezey, B.C. 1981b. Duck nesting in retired croplands at Horicon National Wildlife Refuge, Wisconsin. Journal of Wildlife Management 45:27-37.
Lokemoen, J.T., H.F. Duebbert and D.E. Sharp. 1990. Homing and reproductive habits of mallards, gad walls, and bluewinged teal. Wildlife Monographs Number 106. 28 pp.
Majewski, P. and P. Beszterda. 1990. Influence of nesting success on female homing in the mallard. Journal of Wildlife Management 54:459-462.
March, J.R., G.F. Martz and R.A. Hunt. 1973. Breeding duck populations and habitat in Wisconsin. Technical Bulletin (68):1-37. Wisconsin Department of Natural Resources, Madison
March, J.R. and R.A. Hunt. 1978. Mallard population and harvest dynamics in Wisconsin. Technical Bulletin (106):1-74. Wisconsin Department of Natural Resources, Madison.
Martinson, R.K. and C.F. Kaczynski. 1967. Factors influencing waterfowl counts on aerial surveys, 1961-66. Special Scientific Report on Wildlife (105). U.S. Fish and Wildlife Service, Washington, D.C.
Martz, G.F. 1967. The effects of nesting cover removal on breeding puddle ducks. Journal of Wildlife Management 31:236-247.
Mauser, D.M. 1985. Invertebrates, aquatic plants, and waterfowl broods on four selected wetlands in St. Croix County, Wisconsin. University of Wisconsin, Stevens Point. M.S. Thesis. 85 pp.
35
Mauser, D.M., R.L. Jarvis and D.S. Gilmer. 1994. Survival of radio-marked mallard ducklings in northeastern California. Journal of Wildlife Management 58:82-87.
Mauser, D.M. and R.L. Jarvis. 1994. Mallard recruitment in northeastern California. Journal of Wildlife Management 58:565-570.
Mayfield, H. 1961. Nesting success calculated from exposure. Wilson Bulletin 73:255-261
Mayfield, H. 1975. Suggestions for calculating nest success. Wilson Bulletin 87:456-466.
McClure, H.L. 1951. An analysis of animal victims on Nebraska's highways. Journal of Wildlife Management 15:410-420.
McDowell, P.K. 1989. The impact of waterfowl production area (WPA) fish communities upon the invertebrate food base of waterfowl. University of Wisconsin, Stevens Point. M.S. Thesis. 66 pp.
Mendall, H.L. 1958. The ring-necked duck in the Northeast. University of Maine Bulletin 60(16). 317 pp.
Miller, H.W. 1976. Activity patterns, vocalizations, and site selection in nesting blue-winged teal. Wildfowl 27:33-43.
Miller, H.W. and D.H. Johnson. 1978. Interpreting the results of nesting studies. Journal of Wildlife Management 42:471-76.
Moreth, L.H. and P. Schramm. 1972. A comparative survey of small mammal populations in various grassland habitat with emphasis on restored prairie. Proceedings of the Midwest Prairie Conference 3:79-84.
Munro, R.E. and C.F. Kimball. 1982. Population ecology of the mallard VII: distribution and derivation of the harvest. Resource Publication (147):1-127. U.S. Fish and Wildlife Service, Washington, D.C.
Nelson, L. and F.W. Clark. 1973. Correction for sprung traps in catch/ effort calculations of trapping results. Journal of Mammalogy 54:295-298.
Nottingham, B.G., Jr., KG. Johnson and M.R. Pelton. 1989. Evaluation of scent station surveys to monitor raccoon populations. Wildlife Society Bulletin 17:29-35.
Orthmeyer, D.L. and I.J. Ball. 1990. Survival of mallard broods on Benton Lake National Wildlife Refuge in north central Montana. Journal of Wildlife Management 54:62-66.
Otis, D.L., K.P. Burnham, G.C. White and D.R. Anderson. 1978. Statistical inference from capture data on closed animal populations. Wildlife Monographs 62:1-135.
Petersen, L.R., M.A. Martin, J.M. Cole, J.R. March and C.M.
36
Pils. 1982. Evaluation of waterfowl production areas in Wisconsin. Technical Bulletin (135):1-32. Wisconsin Department of Natural Resources, Madison.
Rearden, J.D. 1951. Identification of waterfowl nest predators. Journal of Wildlife Management 15:386-395.
Ringleman, J.K. and J.R. Longcore. 1982. Survival of juvenile black ducks during brood rearing. Journal of Wildlife Management 46:622-628.
Robel, R.J., J.N. Briggs, A.D. Dayton and L.C. Hulbert. 1970. Relationships between visual obstruction measurements and weight of grassland vegetation. Journal of Range Management 23:295-297.
Rolley, R.E. and L.E. Lehman. 1992. Relationships among raccoon roadkill surveys, harvests, and traffic. Wildlife Society Bulletin 20:313-318.
Roseberry, J.L. and W.D. Klimstra. 1970. The nesting ecology and reproductive performance of the eastern meadowlark. Wilson Bulletin 82:243-267.
Rotella, J.J. and J.T. Ratti. 1992. Mallard brood movements and wetland selection in southwestern Manitoba. Journal of Wildlife Management 56:508-515.
Rotella, J.J., J.H. Devries and D.W. Howerter. 1995. Evaluation of methods for estimating density of breeding female Mallards. Journal of Field Ornithology 66:391-399.
Roughton, R.D. 1982. A synthetic alternative to fermented egg as a canid attractant. Journal of Wildlife Management 46:230-234.
Roughton, R.D. and M.W. Sweeny. 1982. Refinements in scentstation methodology for assessing trends in carnivore populations. Journal of Wildlife Management 46:217-229.
Rybarczuk, W.B., R.D. Andrews, E.E. Klaas and J.M. Kienzler. 1981. Raccoon spotlight survey technique: a potential trend indicator. Pp. 1413-1430 In J. A. Chapmand and D. Pursley, (eds.). Worldwide Furbearer Conference Proceedings. Frostburg, Maryland. 1551 pp.
Sargeant, A.B. 1972. Red fox spatial characteristics in relation to waterfowl predation. Journal of Wildlife Management 36:225-236.
Sargeant, A.B., M.A. Sovada and R.J. Greenwood. 1998. Interpreting evidence of depredation of duck nests in the prairie pothole region. U.S. Geological Survey, Washington D.C. 72 pp.
SAS Institute, Inc. 1990. SAS user's guide: statistics. Version 6, fourth ed. SAS Institute Inc., Cary, NC. 1686 pp.
Schramm, P. and B.J. Willcutts. 1970. Habitat selection of small mammals in burned and unburned tallgrass prairie. Proceedings of the North American Prairie Conference 8:49-55.
Schranck, L.D. 1966. Waterfowl nest sites and nest predation. University of Missouri, Columbia. M.S. Thesis. 104 pp.
Shaffer, T.L., J.T. Lokemoen and D.H. Johnson. 1985. Relations between blue-winged teal and gadwall nest densities and habitat features. Report to Western Energy and Land Use Team. U.S. Fish and Wildlife Service, Northern Prairie Wildlife Research Center, Fort Collins, CO. 23 pp.
Sharp, D.E. and J.T. Lokemoen. 1985. A decoy trap for breeding-season mallards in North Dakota. Journal of Wildlife Management 51:711-715.
Shaw, S.P. and C.G. Fredine. 1956. Wetlands of the United States. Circular (39):1-67. U.S. Fish and Wildlife Service, Washington, D.C.
Siemann, E., J. Haarstad and D. Tilman. 1997. Short-term and long-term effects of burning on oak savanna arthropods. American Midland Naturalist 137:349-361.
Snyder, E.J. and L.B. Best. 1988. Dynamics of habitat use by small mammals in prairie communities. American Midland Naturalist 119:128-136.
Sousa, P.J. 1985. Habitat suitability index models: blue-winged teal (breeding). Biological Report 82(10.114):1-36. U.S. Fish and Wildlife Service, Washington, D.C.
Sovada, M.A., J.M. Roaldson and A.B. Sargeant. 1999. Foods of American badgers in west-central Minnesota and southeastern North Dakota during the duck nesting season. American Midland Naturalist 142:410-414.
Sowls, L.K. 1955. Prairie ducks: a study of their behavior, ecology and management. Stackpole Company, Harrisburg, PA. 193 pp.
Springer, J.T. and P. Schramm. 1972. The effects of fires on small mammal populations in a restored prairie with special reference to the short-tailed shrew (Blarina brevicauda). Proceedings of the Midwest Prairie Conference 2:91-96.
Steel, R.G.D. and J.H. Torrie. 1960. Principles and procedures of statistics. McGraw-Hill Book Company, Inc. New York. 481 pp.
Sugden, L.G. and G.W. Beyersbergen. 1986. Effect of density and concealment on American crow predation of simulated duck nests. Journal of Wildlife Management 50:9-14.
Talent, L.G., R.L. Jarvis and G.L. Krapu. 1983. Survival of mallard broods in south-central North Dakota. Condor 85:74-78.
Taylor, A.D. 1991. Studying metapopulation effects in predator-prey systems. Biological Journal of the Linnean Society 42:305-323.
Tester, J.R. and W.H. Marshall. 1961. A study of certain plant and animal interactions on a native prairie in northwestern Minnesota. Occasional Papers of the Minnesota Museum of Natural History (8):1-51.
Trevor, J.T., R.W. Seabloom and R. D. Sayler. 1991. Identification of mammalian predators at artificial waterfowl nests. Prairie Naturalist 23:93-99.
Vacanti, P.L. and K.N. Geluso. 1985. Recolonization of a burned prairie by meadow voles (Microtus pennsylvanicus ). Prairie Naturalist 17:15-22.
Verts, B.J. 1967. The biology of the Striped skunk. University of Illinois Press, Urbana. 218 pp.
Vickery, P.D., M.L. Hunter, Jr. and J.V. Wells. 1992. Evidence of incidental nest predation and its effects on nests of threatened grassland birds. Oikos 63:281-288
Voorhees, L.D. and J.F. Cassel. 1980. Highway right-of-way: mowing versus succession as related to duck nesting. Journal of Wildlife Management 44:155-163.
Weller, M.W. 1956. A simple field candler for waterfowl eggs. Journal of Wildlife Management 20:111-113.
Weller, M.W. 1979. Density and habitat relationships of bluewinged teal nesting in northwestern Iowa. Journal of Wildlife Management43:367 -37 4.
Wheeler, W.E. and J.R. March. 1979. Characteristics of scat-tered wetlands in relation to duck production in southeastern Wisconsin. Technical Bulletin (116):1-61. Wisconsin Department of Natural Resources, Madison.
Wheeler, W.E., R.C. Gatti and G.A. Bartelt. 1984. Duck breeding ecology and harvest characteristics on Grand River Marsh Wildlife Area. Technical Bulletin (145):1-49. Wisconsin Department of Natural Resources, Madison.
Yoneda, M. 1983. Influence of red fox predation upon a population of small rodents: III. Seasonal changes in predation pressure, prey preference, predation effect. Applied Entomology and Zoology 18:1-10.
Zippen, C. 1958. The removal method of population estimation. Journal of Wildlife Management 22:82-90.
37

38
Acknowledgments I wish to thank B. Bacon, B. Moss, R. Hunt (ret.), L. Petersen, C. Swanberg, K. Belling, seasonal employees, student interns, and numerous other DNR personnel, E. McLaury (ret.) of the U.S. Fish and Wildlife Service, L. Nauman (ret.) of the University of Wisconsin-Stevens Point, and private individuals for field assistance; J. Adams, S. Klugman, J. Gong, and P. Rassmussen of the DNR for statistical assistance; and L. Petersen of the DNR for critical review of the manuscript. Partial funding for this study was provided by the Federal Aid in Wildlife Restoration Act under Pittman-Robe•tson Wis. Proj. W-141-R. ® About the Author James 0. Evrard recently retired from his position as a wildlife research biologist with the DNR in Grantsburg. A native of Wisconsin, he received his B.S. and M.S. degrees at the University of Wisconsin - Madison. His career has included being a Peace Corps volunteer in Peru and a National Park Service interpretive naturalist. Address: Wisconsin Department of Natural Resources, PO Box 367, Grantsburg, WI 54840.
Production Credits Editor: Martin P. A Griffin Layout/Production: Michelle E. Voss Photographers: Bruce Bacon, James 0. Evrard, Ron Gatti Illustrators: James McEvoy, Georgine Price, Deann DeLaRonde Wilde

-r:ECHNICAL BULLETINS (1989-2002)
No. 167 Wisconsin recreation survey-1986. (1989) Unda J. Penaloza
No. 168 A postglacial vegetational history of Sauk County and Caledonia Township, Columbia County, South Central WISConsin. (1990) Kenneth I. lange
No. 169 A review of fisheries habitat improvement projects in warmwater streams. with recommendations for Wisconsin. (1990) John Lyons and Cheryl Courtney
No. 170 Ecosystem responses to growth and control of submerged macrophytes: a literature rev1ew. (1990) Sandy Engel
No. 171 The sport fishery for, and selected population characteristics of, smallmouth bass in Pallette Lake, Wisconsin, 1956-1984. (1990) Michael H. Hoff and Steven L Sems
No. 172 Restoration of canvasback migrational staging habitat in Wisconsin: a research plan with implications for shallow lake management. (1991) Rich Kahl
No. 173 Evaluation of a catch and release fishery for brown trout regulated by an unprotected slot length. (1991) Robert L Hunt
No. 174 Boating pressure on Wisconsin's lakes and rivers: results of the 1989-1990 Wisconsin recreational boating study, phase 1. (1991) Unda J. Penaloza
No. 175 Distnbution and relative abundance of fishes in Wisconsin. VIII. Summary report. (1992) Don Fago
No. 176 Electric fencing for duck and pheasant production in Wisconsin. (1992) Ronald C. Gatti, James 0. Evrard, and William J. Vander Zouwen
No. 177 Population biology and management of the walleye In western Lake Superior. (1992) Stephen T. Schram, Terry L. Margenau, and William H. Blust
No. 178 A survey of the aquatic Insects of the Lower Wisconsin River, 1985-1986, with notes on distribution and habitat. (1992) Richard A. Ullie and William L. Hilsenhoff
No. 179 Evaluation of trout habitat improvement structures in three hiQhijradient streams in WISConSin. (1992) Robert LHunt
No. 180 Boater attitudes and experiences: results of the 1989-1990 Wisconsin recreational boating study. phase 2. (1992) l.mda J. Penaloza
No. 181 The fishery of the Yahara lakes. (1992) Richard C. Lathrop, Susan B. Nehls, C6fford L Brynildson, and Karen R. Plass
No. 182 Aquatic macrophyte ecology in the Upper Winnebago Pool Lakes, WISCOOSin. (1993) Rich Kahl
No. 183 The fisher in Wisconsin. (1993) Bruce E. Kohn, NeU F. Payne, James E. Ashbrenner, and William A. Creed
No. 184 Chemical and biotic characteristics of two low-alkalinity lakes in northern WISCOOSin: relation to atmospheric deposition. (1993) Katherine E. Webster, Joseph M. Eilers, James G. Wiener, Gary E. Glass, Paul J. Garrison, and Mark D. Johnson
No. 185 Aquatic insects of the Bois Brule river system, Wisconsin. (1993) Robert B. DuBois
No. 186 Restoring Rice Lake at Milltown, WISCOnsin. (1994) Sandy Engel and Stanley A. Nichols
No. 187 Bibliography of fire effects and related literature applicable to the ecosystems and species of Wisconsin. (1995) Richard A. Henderson and Sandra H. Statz
No. 188 Plant species composition of WISCOnsin prairies: an aid to selecting species for plantings and restorations based upon University of WISCOOSilr Madson plant~ laboratory data (1995) Richard A. Henderson
No. 189 Integrating forest and ruffed grouse management a case study at the Stone Lake Area. (1996) Keith McCaffery, James E. Ashbrenner, William A. Creed, and Bruce E. Kohn
No. 190 Flora of Sauk County and Caledonia Township, Columbia County, south central WISCOnsin. (1998) Kenneth I. Lange
No. 191 Atlas of the Wisconsin prairie and savanna flora. (2000) Theodore S. Cochrane and Hugh H. litis
No. 192 Checklist of the vascular plants of Wisconsin. (2001) Mark A. Wetter, Theodore S. Cochrane, Mere! R. Black, Hugh H. litis, and Paul E. Berry
No. 193 The effects of Project Wild on fourth grade students in Wiscon· sin: results of a statewide study, 1989-90. (2002) Susan Cantrell Gilchrist .
No. 194 Duck production and harvest in St. Croix and Polk counties, Wisconsin. (2002) James 0. Evrard
Copies of the above publications and a complete list of all technical bulletins in the series are available from the Bureau of Integrated Science Services Research Center, Department of Natural Resources, 1350 Femrite Drive. Monona, WI 53716. PHONE 608·221·6320 FAX 608-221·6353 PUB·SS-194 2002
:D CD en 0 c: a CD en