Dubai - khda.gov.ae · PDF fileDubai TIMSS and PIRLS 2011 Report Analysis of Dubai’s...
88
www.khda.gov.ae Dubai TIMSS and PIRLS 2011 Report
Transcript of Dubai - khda.gov.ae · PDF fileDubai TIMSS and PIRLS 2011 Report Analysis of Dubai’s...
www.khda.gov.ae
DubaiTIMSS and PIRLS 2011 Report

Dubai TIMSS and PIRLS2011 Report

Dubai TIMSS and PIRLS2011 Report
Analysis of Dubai’s Student Performancein TIMSS (Trends in International Mathematics and Science Study)
and PIRLS (Progress of International Reading and Literacy Study) 2011
© 2012 Knowledge and Human Development Authority, Dubai, UAE. All rights reserved.
In the interests of enhancing the value of the information contained in this report, you may download, print, reproduce and distribute any material contained in the report so long as KHDA is acknowledged as the source.
Knowledge and Human Development AuthorityP. O. Box: 500008, Dubai, United Arab EmiratesTel: +971 4 364 0000 Fax: +971 4 364 0001www.khda.gov.ae
ContentsIntroduction 9
Section 1: Dubai‘s participation in TIMSS and PIRLS 2011 11
What are TIMSS and PIRLS? 12
Learning Contexts 15
International Benchmarks 15
What did we learn from TIMSS 2007? 16
TIMSS and PIRLS 2011: a joint cycle 16
Dubai‘s participation in TIMSS and PIRLS 2011 17
Section 2: Dubai’s Performance in TIMSS and PIRLS 2011: An International Perspective 22
Content Domains 28
Cognitive domains 28
Reading Purposes and Processes in PIRLS 29
Trends in Student Achievement 29
Section 3: Student Performance Across Curricula Types in Dubai 34
Achievement at Grade 4 34
Mathematics 34
Grade 4 Mathematics Achievement against International Benchmarks 35
Grade 4 Mathematics Performance in Content Domains 36
Grade 4 Mathematics Performance in Cognitive Domains 37
Grade 4 Mathematics Gender Differential 38
Science 39
Grade 4 Science Achievement against International Benchmarks 40
Grade 4 Science Performance in Content Domains 41
Grade 4 Science Performance in Cognitive Domains 42
Grade 4 Science Gender Differential 43
Reading (PIRLS) 44
Grade 4 Reading Achievement against International Benchmarks 45
Reading Purposes 46
Reading Processes 47
Grade 4 Reading Gender Differential 48
Grade 4: an overall view 49
Grade 4 Trends by curriculum in Dubai 50
ContentsAchievement at Grade 8 51
Mathematics 51
Grade 8 Mathematics Achievement against International Benchmarks 52
Grade 8 Mathematics Performance in Content Domains 54
Grade 8 Mathematics Performance in Cognitive Domains 55
Grade 8 Mathematics Gender Differential 56
Science 57
Grade 8 Science Achievement against International Benchmarks 58
Grade 8 Science Performance in Content Domains 59
Grade 8 Science Performance in Cognitive Domains 60
Grade 8 Science Gender Differential 61
Grade 8 Trends by curriculum in Dubai 62
Section 4: The Performance of Emirati Students in TIMSS and PIRLS 2011 66
Emirati Students in Dubai’s Schools 66
Grade 4 Knowledge and Skills 66
Grade 8 Knowledge and Skills 67
Gender Differential amongst Emirati students 68
Section 5: Dubai Schools’ Inspections and TIMSS and PIRLS 2011 72
Judging students’ attainment 72
Mathematics 73
Science 76
Reading 79
Concluding Remarks 81
Glossary 82
Appendices 83
Appendix I: How to interpret the average scale in TIMSS and PIRLS 83
Appendix II: TIMSS International Benchmark 84
Appendix III: PIRLS International Benchmark 88

Dubai TIMSS and PIRLS 2011 Report
8
9
IntroductionThe quality of education is one of the most fundamental priorities for a country’s present and future. Modern frameworks for improving education stress the importance of evidence-based approaches as a basis for educational planning. The type of rapid development experienced in Dubai and indeed around the world necessitates the continuous collection of robust evidence to help meet the needs of a dynamic student population. In order to do so, a fine balance is needed between meticulous evaluation of schooling within the system and an active awareness of international developments in teaching and learning. International research that utilises common methodologies and data collection instruments enhances our understanding of successful education policy and practice. Policymakers use this evidence, along with the benefit of their local institutional insight, to compare policy options, resulting in informed and improved decisions. Since its foundation in 2007, the Knowledge and Human Development Authority (KHDA) in Dubai, United Arab Emirates (UAE), has actively embraced the integration of evidence-based decision-making in policy formulation and dialogue with schools through a combination of quantitative and qualitative evidence.
Participating in international assessments has been an important step for KHDA with substantial benefits that can be seen throughout the school system. Motivated by the value of gauging what students in Dubai could do in comparison to their peers regionally and internationally, decision-makers have ensured Dubai is now a participant in all major international assessments. This is underpinned by an understanding that the benchmark for success can no longer solely be measured by national standards; rather on what students achieve and how education systems perform on an internationally comparable scale. The first international assessment in which Dubai participated was the Trends in International Mathematics and Science Study (TIMSS) in 2007. Results of TIMSS 2007 for Grade 4 and Grade 8 students formed initial baseline data about the performance of students in Dubai, and clearly indicated key data regarding the wide range of quality provided in Dubai’s schools. Following TIMSS 2007, Dubai’s 15 year-old students participated in the Programme for International Student Achievement (PISA) 2009.
Dubai pioneered national involvement in both international assessments as a Benchmarking Participant in 2007. In order to get a detailed view of the skills possessed by the various groups within the Emirate, Dubai tested a large number of students – equivalent to the number tested in Australia and twice those tested in England - to draw a representative picture of performance among all students in the relevant grade levels.
This report outlines Dubai’s second participation as a benchmarking entity in TIMSS and its first in a unique associated study of reading. In 2011 Dubai participated in the joint fifth cycle of TIMSS and the third cycle of the Progress of International Reading and Literacy Study (PIRLS). The Emirate’s joint participation in both of these studies heralds a new era of internationally comparable data at multiple grade levels. Moreover, as it is the second time Dubai has participated in TIMSS, it forms the first ever chance to examine the progress of students and schools over the 4 year period since TIMSS 2007.
Dubai‘s Participationin TIMSS and PIRLS 201111
Dubai TIMSS and PIRLS 2011 Report
12
What are TIMSS and PIRLS?
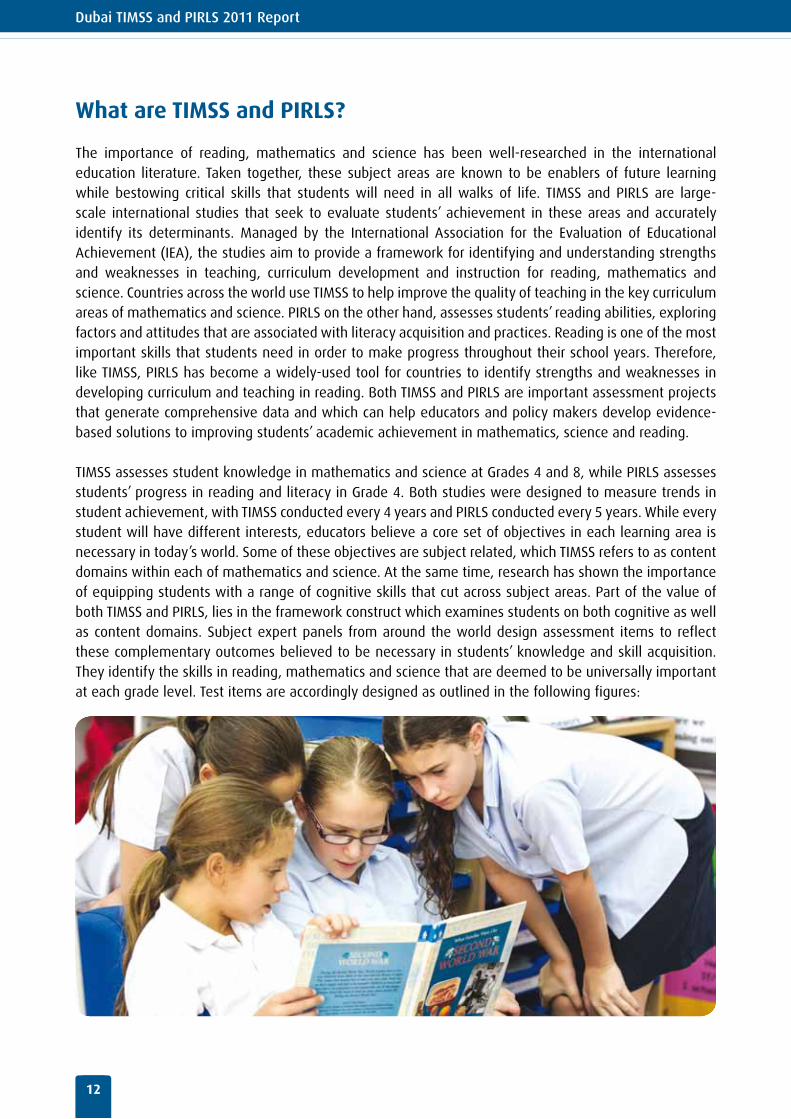
The importance of reading, mathematics and science has been well-researched in the international education literature. Taken together, these subject areas are known to be enablers of future learning while bestowing critical skills that students will need in all walks of life. TIMSS and PIRLS are large-scale international studies that seek to evaluate students’ achievement in these areas and accurately identify its determinants. Managed by the International Association for the Evaluation of Educational Achievement (IEA), the studies aim to provide a framework for identifying and understanding strengths and weaknesses in teaching, curriculum development and instruction for reading, mathematics and science. Countries across the world use TIMSS to help improve the quality of teaching in the key curriculum areas of mathematics and science. PIRLS on the other hand, assesses students’ reading abilities, exploring factors and attitudes that are associated with literacy acquisition and practices. Reading is one of the most important skills that students need in order to make progress throughout their school years. Therefore, like TIMSS, PIRLS has become a widely-used tool for countries to identify strengths and weaknesses in developing curriculum and teaching in reading. Both TIMSS and PIRLS are important assessment projects that generate comprehensive data and which can help educators and policy makers develop evidence-based solutions to improving students’ academic achievement in mathematics, science and reading.
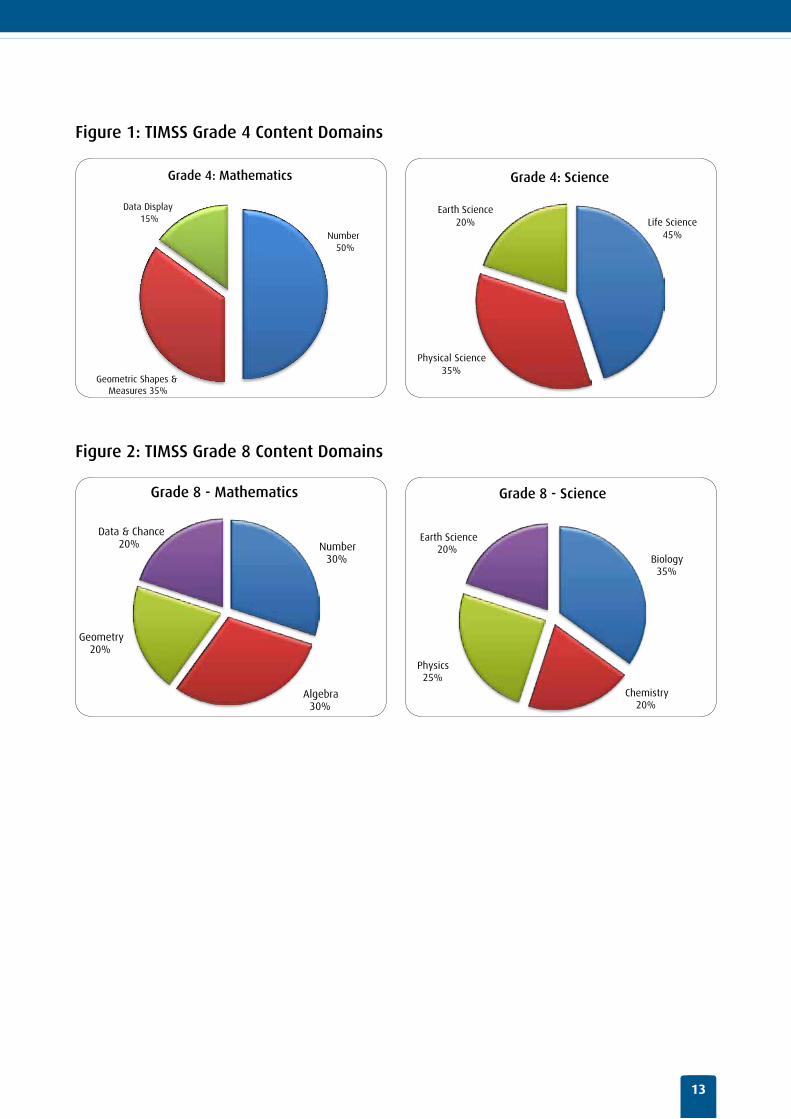
TIMSS assesses student knowledge in mathematics and science at Grades 4 and 8, while PIRLS assesses students’ progress in reading and literacy in Grade 4. Both studies were designed to measure trends in student achievement, with TIMSS conducted every 4 years and PIRLS conducted every 5 years. While every student will have different interests, educators believe a core set of objectives in each learning area is necessary in today’s world. Some of these objectives are subject related, which TIMSS refers to as content domains within each of mathematics and science. At the same time, research has shown the importance of equipping students with a range of cognitive skills that cut across subject areas. Part of the value of both TIMSS and PIRLS, lies in the framework construct which examines students on both cognitive as well as content domains. Subject expert panels from around the world design assessment items to reflect these complementary outcomes believed to be necessary in students’ knowledge and skill acquisition. They identify the skills in reading, mathematics and science that are deemed to be universally important at each grade level. Test items are accordingly designed as outlined in the following figures:
13
Figure 1: TIMSS Grade 4 Content Domains
Number50%
Geometric Shapes & Measures 35%
Data Display 15%
Grade 4: Mathematics
Life Science 45%
Physical Science
35%
Earth Science 20%
Grade 4: Science
Figure 2: TIMSS Grade 8 Content Domains
Number 30%
Algebra 30%
Geometry
20%
Data & Chance
20%
Grade 8 - Mathematics
Biology 35%
Chemistry
20%
Physics 25%
Earth Science 20%
Grade 8 - Science
Dubai TIMSS and PIRLS 2011 Report
14
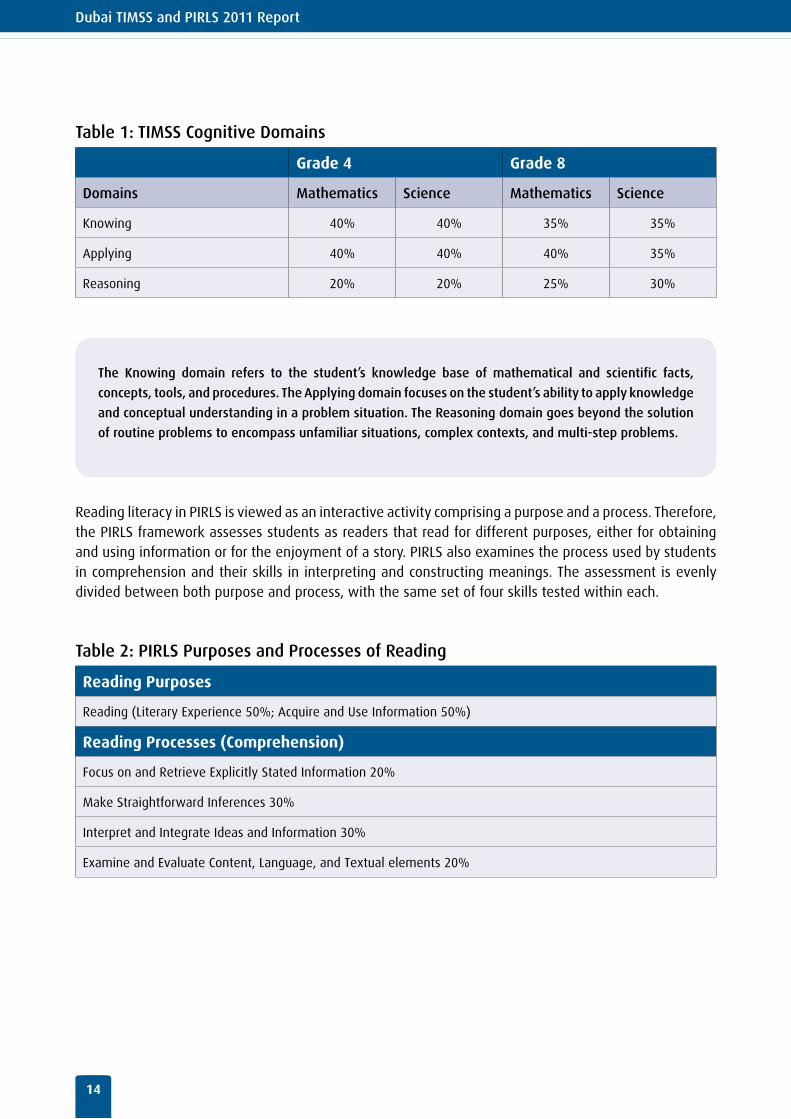
Table 1: TIMSS Cognitive Domains
Grade 4 Grade 8
Domains Mathematics Science Mathematics Science
Knowing 40% 40% 35% 35%
Applying 40% 40% 40% 35%
Reasoning 20% 20% 25% 30%
The Knowing domain refers to the student’s knowledge base of mathematical and scientific facts,
concepts, tools, and procedures. The Applying domain focuses on the student’s ability to apply knowledge
and conceptual understanding in a problem situation. The Reasoning domain goes beyond the solution
of routine problems to encompass unfamiliar situations, complex contexts, and multi-step problems.
Reading literacy in PIRLS is viewed as an interactive activity comprising a purpose and a process. Therefore, the PIRLS framework assesses students as readers that read for different purposes, either for obtaining and using information or for the enjoyment of a story. PIRLS also examines the process used by students in comprehension and their skills in interpreting and constructing meanings. The assessment is evenly divided between both purpose and process, with the same set of four skills tested within each.
Table 2: PIRLS Purposes and Processes of Reading
Reading Purposes
Reading (Literary Experience 50%; Acquire and Use Information 50%)
Reading Processes (Comprehension)
Focus on and Retrieve Explicitly Stated Information 20%
Make Straightforward Inferences 30%
Interpret and Integrate Ideas and Information 30%
Examine and Evaluate Content, Language, and Textual elements 20%
15
Learning Contexts
Learning occurs within contexts, where different factors affecting learning are interconnected; TIMSS and PIRLS collect information about the contexts of learning and their impact on student performance. As part of the studies, participating countries additionally provide important information about their national education context, curriculum, and classroom instruction for mathematics, science and reading. In addition to this institutional data, background questionnaires collect data from school leaders, teachers, students and parents.
The background factors measured by TIMSS and PIRLS allow a uniquely comprehensive view of the learning process. The school questionnaire collects information about school resources, leadership, management and background data on its student population as a whole. The teacher questionnaire collects information about teaching practices and teachers’ attitudes and other classroom context details. Student questionnaires collect invaluable background information about students and their learning attitudes. The parent questionnaire offered only in PIRLS, collects information about early learning opportunities, home support for learning and parents’ attitudes towards learning. The joint cycle of TIMSS and PIRLS provided countries with the opportunity to test Grade 4 students in both these tests. This enabled participants such as Dubai to administer the parent questionnaire to all Grade 4 students, resulting in an unparalleled dataset with complete information on the home context for learning for over 6000 Grade 4 students in the Emirate. This type of data, which is usually difficult to quantify as part of regular data collection, is invaluable for policymakers and educators who want to design policy, practice and monitoring, which is based on an intricate understanding of their students’ circumstances.
Information provided by the participating countries along with that collected through the background questionnaires afford more opportunities to learn about the numerous factors that influence learning such as school resources, teaching practices, students’ attitudes and home support for learning. All of this creates a framework for understanding the local education context and the major factors that contribute to developing our education system.
International Benchmarks
The achievement scale in both TIMSS and PIRLS summarises students’ performance in a range of content areas in the three subjects as well as the cognitive processes required in these subjects. The assessments are scaled to an international average of 5001 and a standard deviation of 100. To make the figures more accessible to educators and policymakers, both TIMSS and PIRLS link levels of achievement to particular outcomes. By reporting achievement against four points known as international benchmarks, the assessments provide an understanding of students’ developmental outcomes against an international scale. These benchmarks explain the different levels of knowledge and understanding that students have reached in mathematics, science and reading:
1 Refer to Appendix I for more information on interpreting the scale average in TIMSS and PIRLS.
Dubai TIMSS and PIRLS 2011 Report
16
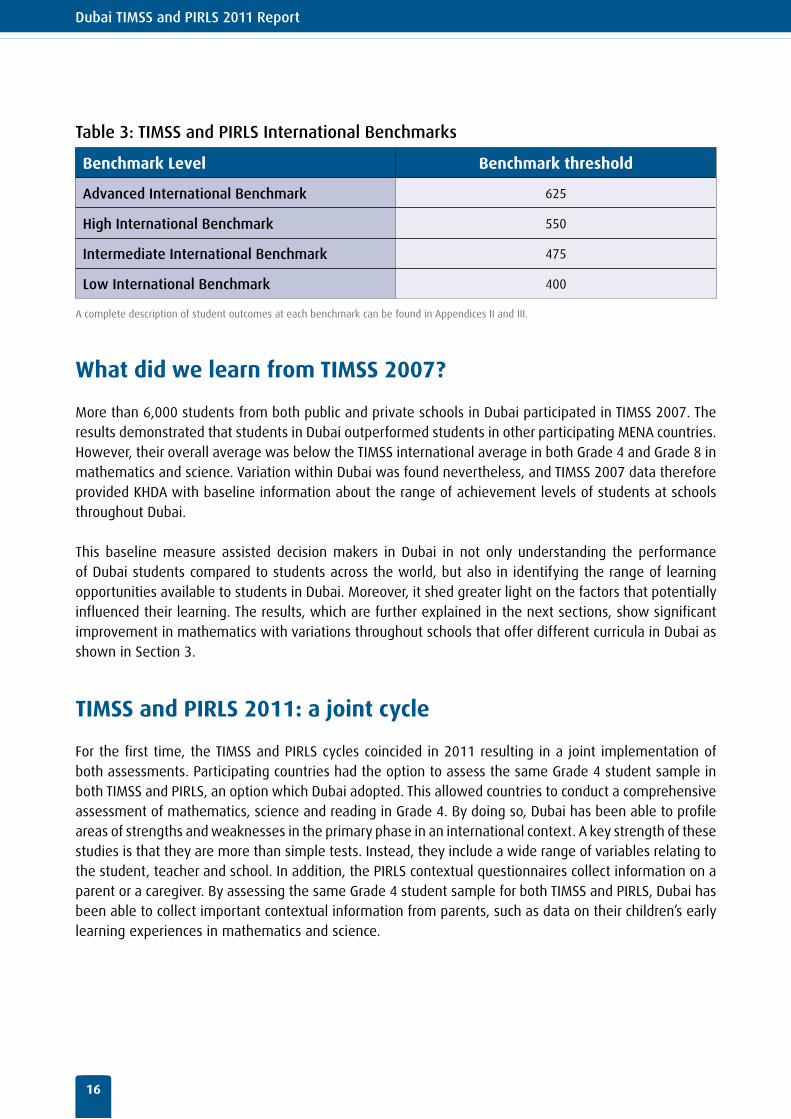
Table 3: TIMSS and PIRLS International Benchmarks
Benchmark Level Benchmark threshold
Advanced International Benchmark 625
High International Benchmark 550
Intermediate International Benchmark 475
Low International Benchmark 400
A complete description of student outcomes at each benchmark can be found in Appendices II and III.
What did we learn from TIMSS 2007?
More than 6,000 students from both public and private schools in Dubai participated in TIMSS 2007. The results demonstrated that students in Dubai outperformed students in other participating MENA countries. However, their overall average was below the TIMSS international average in both Grade 4 and Grade 8 in mathematics and science. Variation within Dubai was found nevertheless, and TIMSS 2007 data therefore provided KHDA with baseline information about the range of achievement levels of students at schools throughout Dubai.
This baseline measure assisted decision makers in Dubai in not only understanding the performance of Dubai students compared to students across the world, but also in identifying the range of learning opportunities available to students in Dubai. Moreover, it shed greater light on the factors that potentially influenced their learning. The results, which are further explained in the next sections, show significant improvement in mathematics with variations throughout schools that offer different curricula in Dubai as shown in Section 3.
TIMSS and PIRLS 2011: a joint cycle
For the first time, the TIMSS and PIRLS cycles coincided in 2011 resulting in a joint implementation of both assessments. Participating countries had the option to assess the same Grade 4 student sample in both TIMSS and PIRLS, an option which Dubai adopted. This allowed countries to conduct a comprehensive assessment of mathematics, science and reading in Grade 4. By doing so, Dubai has been able to profile areas of strengths and weaknesses in the primary phase in an international context. A key strength of these studies is that they are more than simple tests. Instead, they include a wide range of variables relating to the student, teacher and school. In addition, the PIRLS contextual questionnaires collect information on a parent or a caregiver. By assessing the same Grade 4 student sample for both TIMSS and PIRLS, Dubai has been able to collect important contextual information from parents, such as data on their children’s early learning experiences in mathematics and science.
17
Dubai‘s participation in TIMSS and PIRLS 2011
Although, most countries sampled only a number of their schools for the assessment, Dubai was in the unique position of having tested all of its eligible2 schools. The only schools that were excluded were schools that had a language of instruction other than Arabic or English. By testing all schools in this cycle, TIMSS and PIRLS 2011 can be considered a census of all eligible schools in Dubai. This is an important step for Dubai, as students’ results in TIMSS and PIRLS can complement educators’ and policymakers’ understanding of the state of knowledge amongst our students. Studying these important datasets alongside information collected through school inspections will assist KHDA in educational planning, and in providing schools with the support they need.
Students who sat for TIMSS and PIRLS 2011 were from both public and private schools in Dubai. In addition to the Ministry of Education (MoE) public schools in Dubai (referred to as ‘Public-MoE’ for the purposes of this report), a wide range of other curricula can be found amongst participating private schools. These included private schools that offer the Ministry of Education curriculum (Private-MoE), UK, US, Indian, IB, Philippine and Pakistani.
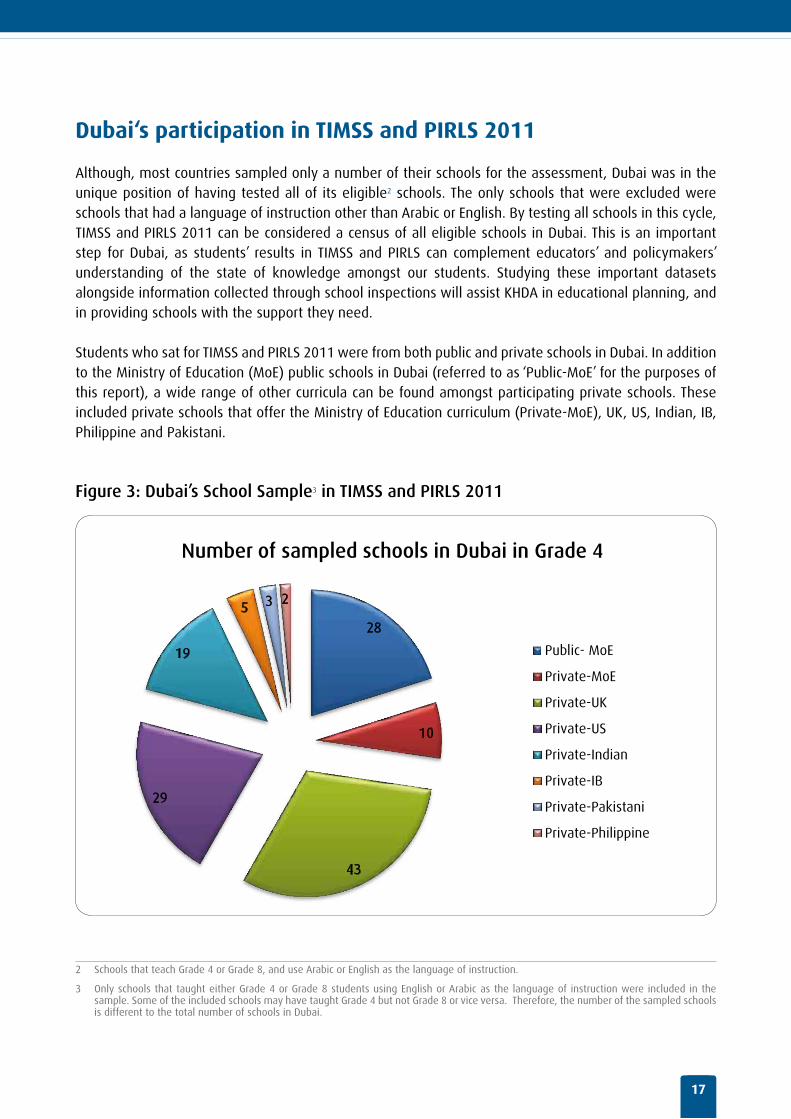
Figure 3: Dubai’s School Sample3 in TIMSS and PIRLS 2011
28
10
43
29
19
5 3 2
Number of sampled schools in Dubai in Grade 4
Public- MoE
Private-MoE
Private-UK
Private-US
Private-Indian
Private-IB
Private-Pakistani
Private-Philippine
2 Schools that teach Grade 4 or Grade 8, and use Arabic or English as the language of instruction.
3 Only schools that taught either Grade 4 or Grade 8 students using English or Arabic as the language of instruction were included in the sample. Some of the included schools may have taught Grade 4 but not Grade 8 or vice versa. Therefore, the number of the sampled schools is different to the total number of schools in Dubai.
Dubai TIMSS and PIRLS 2011 Report
18
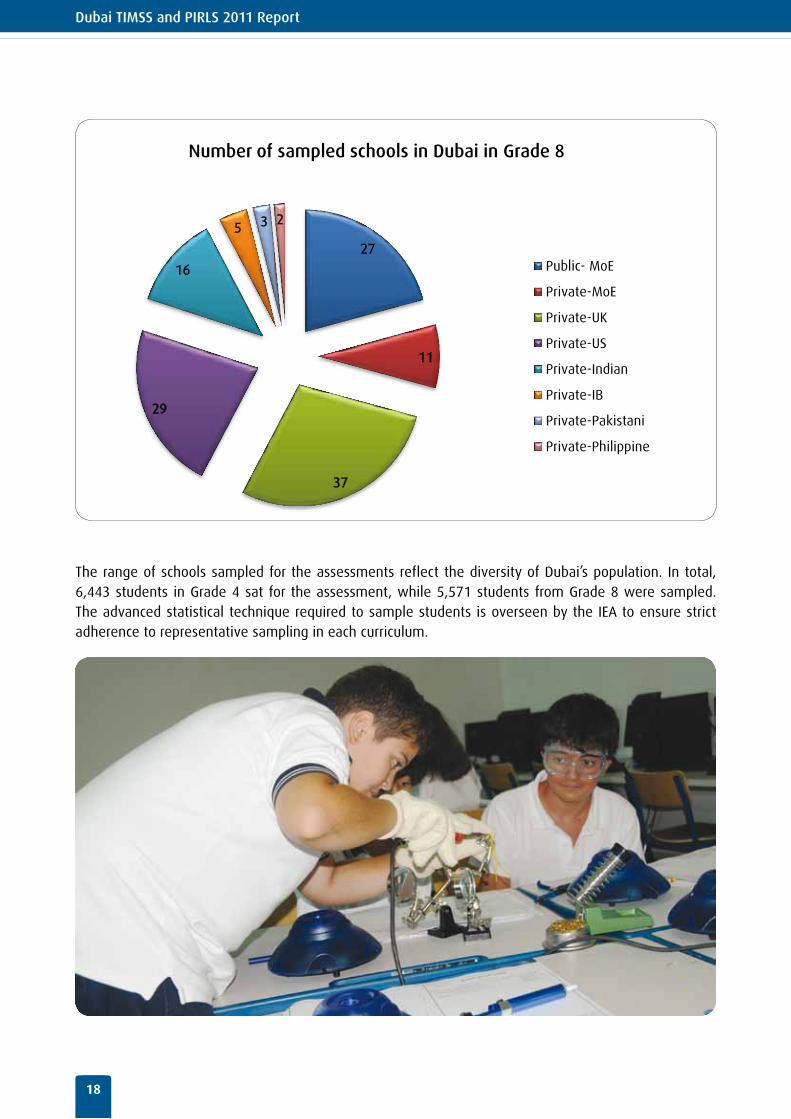
27
11
37
29
16
5 3 2
Number of sampled schools in Dubai in Grade 8
Public- MoE
Private-MoE
Private-UK
Private-US
Private-Indian
Private-IB
Private-Pakistani
Private-Philippine
The range of schools sampled for the assessments reflect the diversity of Dubai’s population. In total, 6,443 students in Grade 4 sat for the assessment, while 5,571 students from Grade 8 were sampled. The advanced statistical technique required to sample students is overseen by the IEA to ensure strict adherence to representative sampling in each curriculum.

19
2Dubai’s Performancein TIMSS and PIRLS 20112
Dubai TIMSS and PIRLS 2011 Report
22
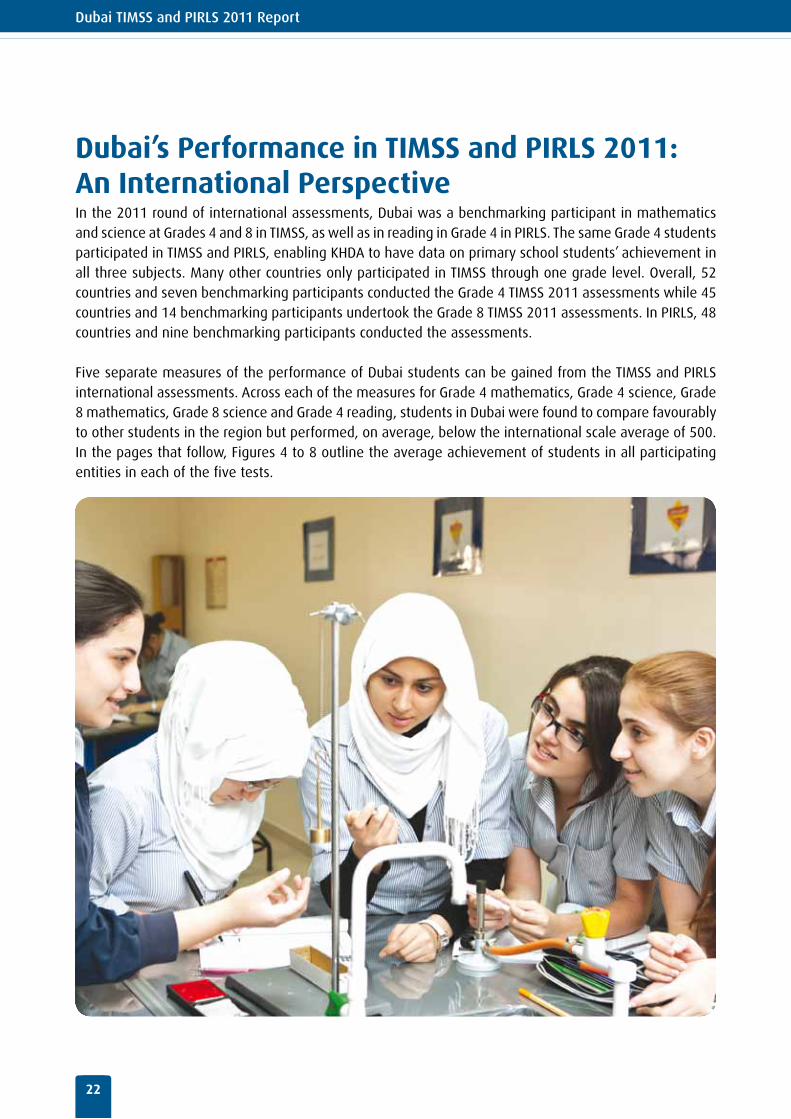
Dubai’s Performance in TIMSS and PIRLS 2011: An International Perspective In the 2011 round of international assessments, Dubai was a benchmarking participant in mathematics and science at Grades 4 and 8 in TIMSS, as well as in reading in Grade 4 in PIRLS. The same Grade 4 students participated in TIMSS and PIRLS, enabling KHDA to have data on primary school students’ achievement in all three subjects. Many other countries only participated in TIMSS through one grade level. Overall, 52 countries and seven benchmarking participants conducted the Grade 4 TIMSS 2011 assessments while 45 countries and 14 benchmarking participants undertook the Grade 8 TIMSS 2011 assessments. In PIRLS, 48 countries and nine benchmarking participants conducted the assessments.
Five separate measures of the performance of Dubai students can be gained from the TIMSS and PIRLS international assessments. Across each of the measures for Grade 4 mathematics, Grade 4 science, Grade 8 mathematics, Grade 8 science and Grade 4 reading, students in Dubai were found to compare favourably to other students in the region but performed, on average, below the international scale average of 500. In the pages that follow, Figures 4 to 8 outline the average achievement of students in all participating entities in each of the five tests.

23
Figure 4: International Achievement in Mathematics4 - Grade 4
( ) Standard errors appear in parentheses. Because of rounding some results may appear inconsistent.
Country average lower than TIMSS international average
Country average higher than TIMSS international average
95% Confidence Interval for Average (±2SE)
Percentiles of Performance 5th 25th 75th 95th
Country average significantly similar to Dubai's average
100 300 500400200 600 800700
Country Mathematics Achievement Distribution
Singapore 606 (3.2)Korea, Rep. of 605 (1.9)Hong Kong SAR 602 (3.4)Chinese Taipei 591 (2.0)Japan 585 (1.7)Northern Ireland 562 (2.9)Belgium (Flemish) 549 (1.9)Finland 545 (2.3)England 542 (3.5)Russian Federation 542 (3.7)United States 541 (1.8)Netherlands 540 (1.7)Denmark 537 (2.6)Lithuania 534 (2.4)Portugal 532 (3.4)Germany 528 (2.2)Ireland 527 (2.6)Serbia 516 (3.0)Australia 516 (2.9)Hungary 515 (3.4)Slovenia 513 (2.2)Czech Republic 511 (2.4)Austria 508 (2.6)Italy 508 (2.6)Slovak Republic 507 (3.8)Sweden 504 (2.0)Kazakhstan 501 (4.5)TIMSS Scale Centerpoint 500
Malta 496 (1.3)Norway 495 (2.8)Croatia 490 (1.9)New Zealand 486 (2.6)Spain 482 (2.9)Romania 482 (5.8)Poland 481 (2.2)Turkey 469 (4.7)Dubai4, UAE 468 (1.6)Azerbaijan 463 (5.8)Chile 462 (2.3)Thailand 458 (4.8)Armenia 452 (3.5)Georgia 450 (3.7)Bahrain 436 (3.3)United Arab Emirates 434 (2.0)Iran 431 (3.5)Qatar 413 (3.5)Saudi Arabia 410 (5.3)Oman 385 (2.9)Tunisia 359 (3.9)Kuwait 342 (3.4)Morocco 335 (4.0)Yemen 248 (6.0)
AverageScale Score
In TIMSS Grade 4 mathematics, the average score of Dubai’s students is not statistically different to that of Turkey and Azerbaijan and is above that of Chile and Thailand. It exceeds that of MENA countries Bahrain, Qatar, Saudi Arabia, Oman, Tunisia, Kuwait and Morocco by a statistically significant margin.
4 Dubai participated in TIMSS and PIRLS as a benchmarking city. It was included in this figure only for the purpose of comparing its performance with other countries.
Dubai TIMSS and PIRLS 2011 Report
24
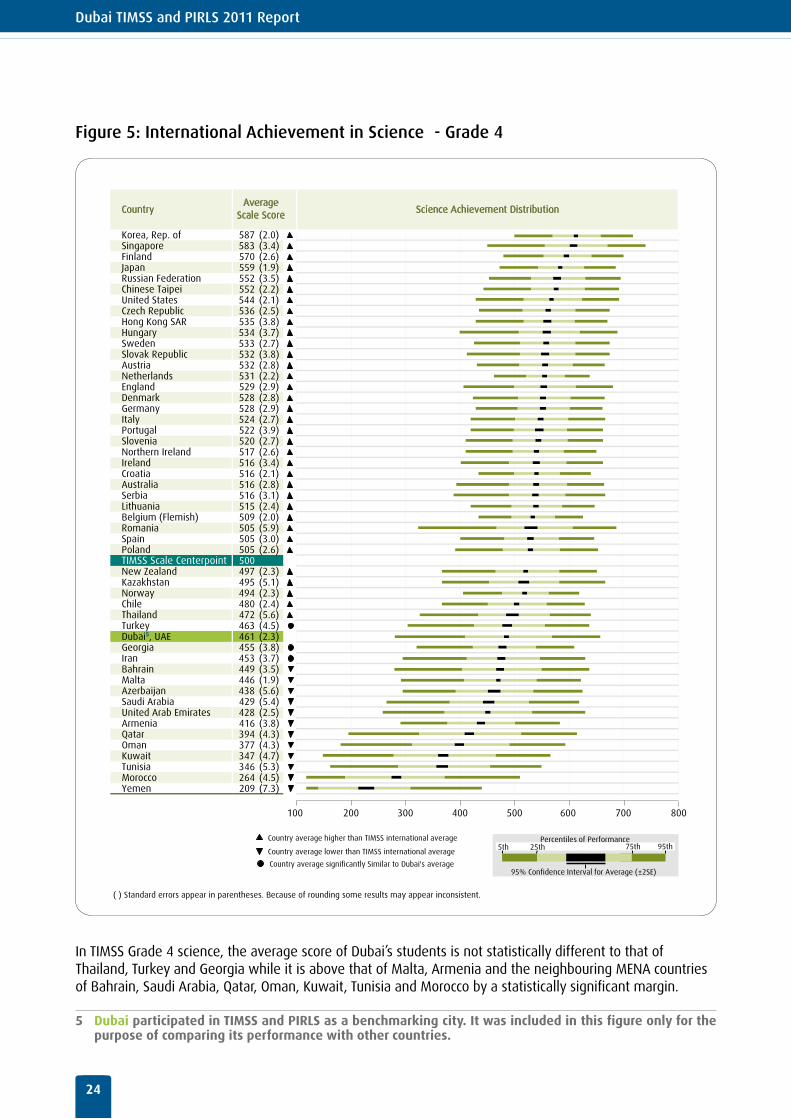
Figure 5: International Achievement in Science5 - Grade 4
Country average lower than TIMSS international average
Country average higher than TIMSS international average
95% Confidence Interval for Average (±2SE)
Percentiles of Performance 5th 25th 75th 95th
Country average significantly Similar to Dubai's average
Country Science Achievement Distribution
Korea, Rep. of 587 (2.0)Singapore 583 (3.4)Finland 570 (2.6)Japan 559 (1.9)Russian Federation 552 (3.5)Chinese Taipei 552 (2.2)United States 544 (2.1)Czech Republic 536 (2.5)Hong Kong SAR 535 (3.8)Hungary 534 (3.7)Sweden 533 (2.7)Slovak Republic 532 (3.8)Austria 532 (2.8)Netherlands 531 (2.2)England 529 (2.9)Denmark 528 (2.8)Germany 528 (2.9)Italy 524 (2.7)Portugal 522 (3.9)Slovenia 520 (2.7)Northern Ireland 517 (2.6)Ireland 516 (3.4)Croatia 516 (2.1)Australia 516 (2.8)Serbia 516 (3.1)Lithuania 515 (2.4)Belgium (Flemish) 509 (2.0)Romania 505 (5.9)Spain 505 (3.0)Poland 505 (2.6)
500 New Zealand 497 (2.3)Kazakhstan 495 (5.1)Norway 494 (2.3)Chile 480 (2.4)Thailand 472 (5.6)Turkey 463 (4.5)Dubai5, UAE 461 (2.3)Georgia 455 (3.8)Iran 453 (3.7)Bahrain 449 (3.5)Malta 446 (1.9)Azerbaijan 438 (5.6)Saudi Arabia 429 (5.4)United Arab Emirates 428 (2.5)Armenia 416 (3.8)Qatar 394 (4.3)Oman 377 (4.3)Kuwait 347 (4.7)Tunisia 346 (5.3)Morocco 264 (4.5)Yemen 209 (7.3)
AverageScale Score
100 200 300 400 500 600 700 800
TIMSS Scale Centerpoint
( ) Standard errors appear in parentheses. Because of rounding some results may appear inconsistent.
In TIMSS Grade 4 science, the average score of Dubai’s students is not statistically different to that of Thailand, Turkey and Georgia while it is above that of Malta, Armenia and the neighbouring MENA countries of Bahrain, Saudi Arabia, Qatar, Oman, Kuwait, Tunisia and Morocco by a statistically significant margin.
5 Dubai participated in TIMSS and PIRLS as a benchmarking city. It was included in this figure only for the purpose of comparing its performance with other countries.
25
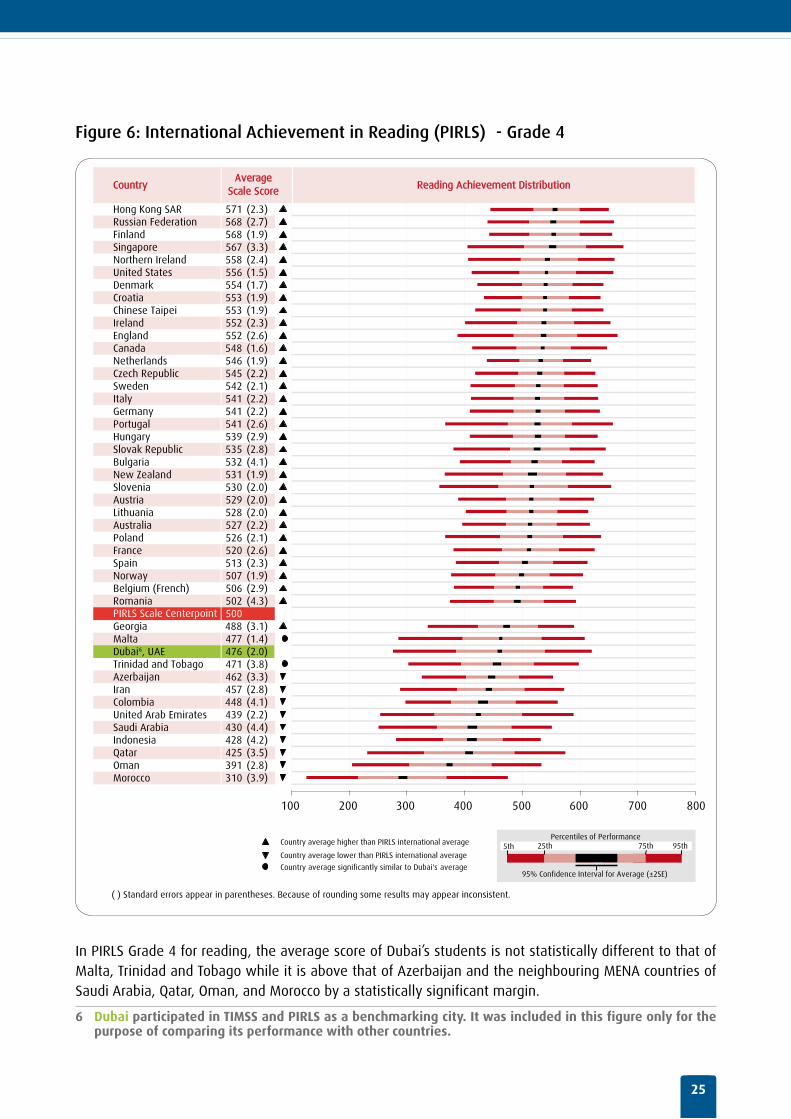
Figure 6: International Achievement in Reading (PIRLS)6 - Grade 4
Country Reading Achievement Distribution
Hong Kong SAR 571 (2.3)Russian Federation 568 (2.7)Finland 568 (1.9)Singapore 567 (3.3)Northern Ireland 558 (2.4)United States 556 (1.5)Denmark 554 (1.7)Croatia 553 (1.9)Chinese Taipei 553 (1.9)Ireland 552 (2.3)England 552 (2.6)Canada 548 (1.6)Netherlands 546 (1.9)Czech Republic 545 (2.2)Sweden 542 (2.1)Italy 541 (2.2)Germany 541 (2.2)Portugal 541 (2.6)Hungary 539 (2.9)Slovak Republic 535 (2.8)Bulgaria 532 (4.1)New Zealand 531 (1.9)Slovenia 530 (2.0)Austria 529 (2.0)Lithuania 528 (2.0)Australia 527 (2.2)Poland 526 (2.1)France 520 (2.6)Spain 513 (2.3)Norway 507 (1.9)Belgium (French) 506 (2.9)Romania 502 (4.3)
500 Georgia 488 (3.1)Malta 477 (1.4)Dubai6, UAE 476 (2.0)Trinidad and Tobago 471 (3.8)Azerbaijan 462 (3.3)Iran 457 (2.8)Colombia 448 (4.1)United Arab Emirates 439 (2.2)Saudi Arabia 430 (4.4)Indonesia 428 (4.2)Qatar 425 (3.5)Oman 391 (2.8)Morocco 310 (3.9)
( ) Standard errors appear in parentheses. Because of rounding some results may appear inconsistent.
AverageScale Score
100 200 300 400 500 600 700 800
Country average lower than PIRLS international average
Country average higher than PIRLS international average
95% Confidence Interval for Average (±2SE)
Percentiles of Performance 5th 25th 75th 95th
Country average significantly similar to Dubai's average
PIRLS Scale Centerpoint
In PIRLS Grade 4 for reading, the average score of Dubai’s students is not statistically different to that of Malta, Trinidad and Tobago while it is above that of Azerbaijan and the neighbouring MENA countries of Saudi Arabia, Qatar, Oman, and Morocco by a statistically significant margin.
6 Dubai participated in TIMSS and PIRLS as a benchmarking city. It was included in this figure only for the purpose of comparing its performance with other countries.
Dubai TIMSS and PIRLS 2011 Report
26
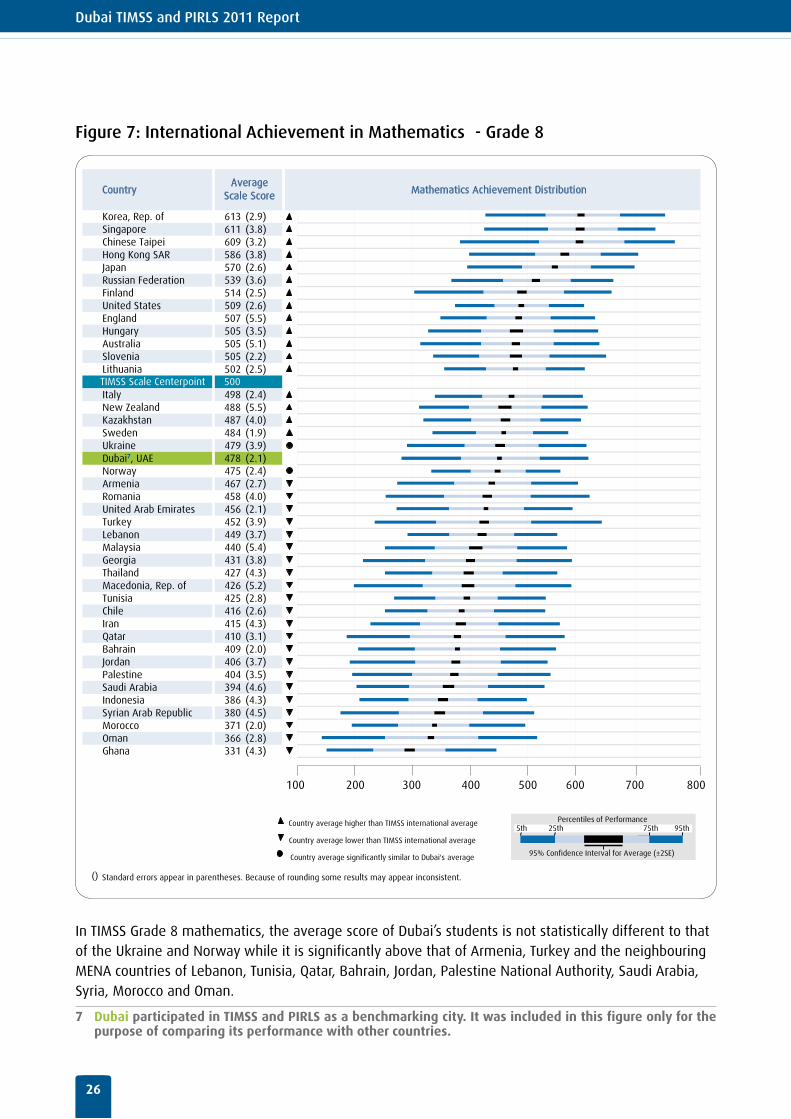
Figure 7: International Achievement in Mathematics7 - Grade 8
TIMSS Scale Centerpoint
Country Mathematics Achievement Distribution
Korea, Rep. ofSingaporeChinese TaipeiHong Kong SARJapanRussian FederationFinlandUnited StatesEnglandHungaryAustraliaSloveniaLithuania
ItalyNew ZealandKazakhstanSwedenUkraineDubai7, UAENorwayArmeniaRomaniaUnited Arab EmiratesTurkeyLebanonMalaysiaGeorgiaThailandMacedonia, Rep. ofTunisiaChileIranQatarBahrainJordanPalestineSaudi ArabiaIndonesiaSyrian Arab RepublicMoroccoOmanGhana
() Standard errors appear in parentheses. Because of rounding some results may appear inconsistent.
AverageScale Score
100 200 300 400 500 600 700 800
Country average lower than TIMSS international average
Country average higher than TIMSS international average
95% Confidence Interval for Average (±2SE)
Percentiles of Performance
5th 25th 75th 95th
Country average significantly similar to Dubai's average
613 (2.9)611 (3.8)609 (3.2)586 (3.8)570 (2.6)539 (3.6)514 (2.5)509 (2.6)507 (5.5)505 (3.5)505 (5.1)505 (2.2)502 (2.5)
498 (2.4)488 (5.5)487 (4.0)484 (1.9)479 (3.9)478 (2.1)475 (2.4)467 (2.7)458 (4.0)456 (2.1)452 (3.9)449 (3.7)440 (5.4)431 (3.8)427 (4.3)426 (5.2)425 (2.8)416 (2.6)415 (4.3)410 (3.1)409 (2.0)406 (3.7)404 (3.5)394 (4.6)386 (4.3)380 (4.5)371 (2.0)366 (2.8)331 (4.3)
500
In TIMSS Grade 8 mathematics, the average score of Dubai’s students is not statistically different to that of the Ukraine and Norway while it is significantly above that of Armenia, Turkey and the neighbouring MENA countries of Lebanon, Tunisia, Qatar, Bahrain, Jordan, Palestine National Authority, Saudi Arabia, Syria, Morocco and Oman.
7 Dubai participated in TIMSS and PIRLS as a benchmarking city. It was included in this figure only for the purpose of comparing its performance with other countries.
27
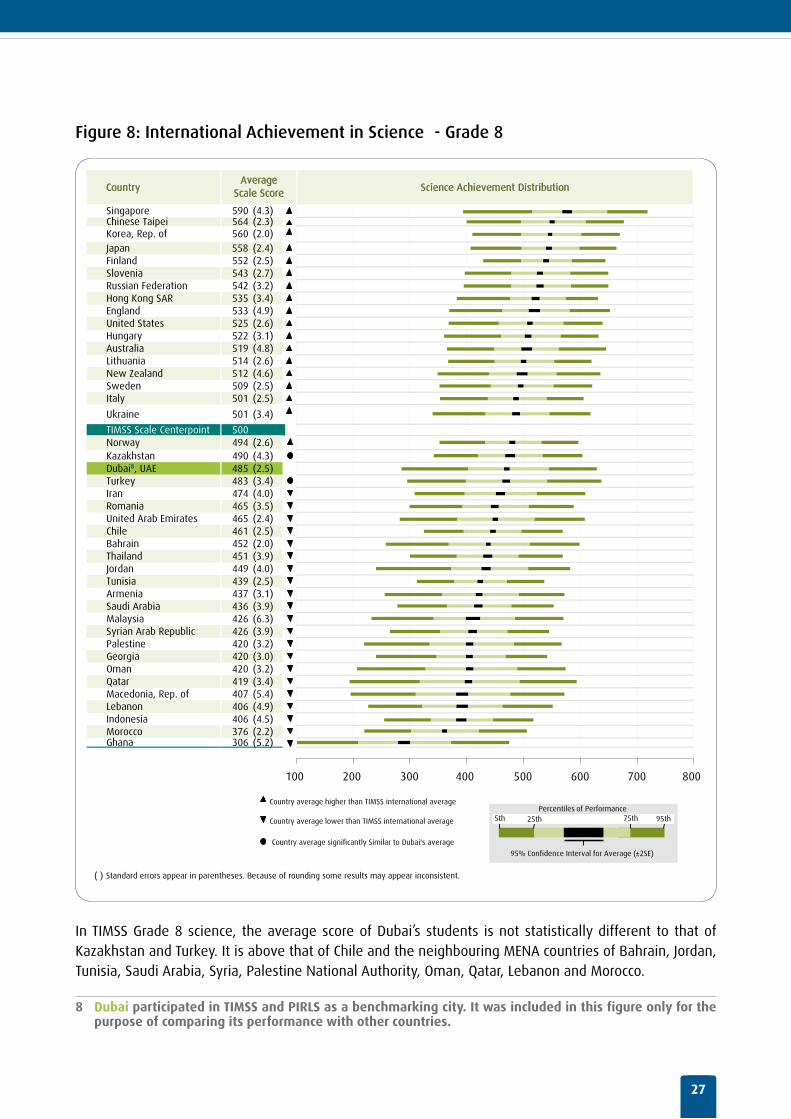
Figure 8: International Achievement in Science8 - Grade 8
Country Science Achievement Distribution
Singapore 590 (4.3)Chinese Taipei 564 (2.3)Korea, Rep. of 560 (2.0)Japan 558 (2.4)Finland 552 (2.5)Slovenia 543 (2.7)Russian Federation 542 (3.2)Hong Kong SAR 535 (3.4)England 533 (4.9)United States 525 (2.6)Hungary 522 (3.1)Australia 519 (4.8)Lithuania 514 (2.6)New Zealand 512 (4.6)Sweden 509 (2.5)Italy 501 (2.5)
Ukraine 501 (3.4)
TIMSS Scale Centerpoint 500 Norway 494 (2.6)Kazakhstan 490 (4.3)Dubai8, UAE 485 (2.5)Turkey 483 (3.4)Iran 474 (4.0)Romania 465 (3.5)United Arab Emirates 465 (2.4)Chile 461 (2.5)Bahrain 452 (2.0)Thailand 451 (3.9)Jordan 449 (4.0)Tunisia 439 (2.5)Armenia 437 (3.1)Saudi Arabia 436 (3.9)Malaysia 426 (6.3)Syrian Arab Republic 426 (3.9)Palestine 420 (3.2)Georgia 420 (3.0)Oman 420 (3.2)Qatar 419 (3.4)Macedonia, Rep. of 407 (5.4)Lebanon 406 (4.9)Indonesia 406 (4.5)Morocco 376 (2.2)Ghana 306 (5.2)
( ) Standard errors appear in parentheses. Because of rounding some results may appear inconsistent.
AverageScale Score
100 200 300 400 500 600 700 800
95% Confidence Interval for Average (±2SE)
5th 25th 75th 95th Country average lower than TIMSS international average
Country average higher than TIMSS international average
Country average significantly Similar to Dubai's average
Percentiles of Performance
In TIMSS Grade 8 science, the average score of Dubai’s students is not statistically different to that of Kazakhstan and Turkey. It is above that of Chile and the neighbouring MENA countries of Bahrain, Jordan, Tunisia, Saudi Arabia, Syria, Palestine National Authority, Oman, Qatar, Lebanon and Morocco.
8 Dubai participated in TIMSS and PIRLS as a benchmarking city. It was included in this figure only for the purpose of comparing its performance with other countries.
Dubai TIMSS and PIRLS 2011 Report
28
Content Domains
In Dubai in Grade 4 mathematics, students performed significantly better overall in the Number content domain and significantly weaker in Geometric Shapes and Measures. No statistical difference was found for Data Display compared to the overall Dubai score. Their older counterparts in Grade 8 were found to have somewhat similar results in this domain. Students had statistically lower achievement levels on average in Geometry along with Data and Chance while significantly higher performance was found in algebra. No significant difference was found in the performance of students in the Number domain. Across all countries and benchmarking participants, difficulty in the Grade 8 content domains varied, with Algebra most difficult, followed by Geometry, Number, and Data and Chance. It is therefore interesting that students in Dubai on average, were found to be comparatively more proficient in Algebra in contrast to the global trend.
In Grade 4 science, achievement in the Life Science content domain was found to be statistically weaker than the overall score, while the performance in Earth Sciences was relatively stronger. However, this was not found in Grade 8 where no statistically significant difference was found between student achievement in Chemistry, Biology or Earth Science. Only a slight but statistically significant relative weakness was identified in Physics. This suggests that Grade 8 students’ knowledge in science, on average, is equivalent across content domains.
Cognitive domains
In Grade 4 mathematics, Dubai students were found to have a small but statistically significant strength in the Knowing content domain relative to mathematics overall. They also had a similarly small but statistically significant weakness in the Reasoning domain with no difference associated in the Applying domain. In Grade 8 mathematics, students performed stronger in the Knowing subscale with 11 points more on average but relatively weaker in both the Applying and Reasoning domains.
In Science on the other hand, Dubai students were found to have performed stronger in the Knowing cognitive domain and relatively weaker in both the Applying and Reasoning domains at the Grade 4 level. Older students in Grade 8 displayed similar patterns, with Knowing once again significantly higher than average Science performance and Reasoning relatively lower.
Across other countries, the majority of participants performed relatively better in the Knowing cognitive domain on average. Indeed, the reform journey of many education systems has followed a pathway along these cognitive domains where students are supported to develop their knowledge into application and then reasoning.
29
Reading Purposes and Processes in PIRLS
PIRLS assesses two overarching purposes for reading: reading for literary experience, and reading to acquire and use information. For the purpose of this report these are referred to as ‘literary reading’ and ‘informational reading’. There is considerable diversity among countries with relative strengths and weaknesses in either Literary or Informational reading. In Dubai, students were found to have a statistically significant relative strength in informational reading with an average score of 488 in this subscale compared to 466 for Literary reading. While the content domains in PIRLS refers to the purposes of reading, the cognitive domains in PIRLS addresses the processes of reading comprehension. The first process of reading in PIRLS is the process of Retrieval and Straightforward Inferences in contrast to the second of Interpreting, Integrating and Evaluating. Higher performing countries tended to perform higher in the integrating process. In Dubai, no statistically significant difference overall was found between the two Reading process scores.
Trends in Student Achievement
As its name suggests, TIMSS emerged as a means of measuring the progress of an education system and its students. Today it continues to be used as such, with trend measures designed to gauge the progress made by schools in teaching Grade 4 or Grade 8 students over a number of years.
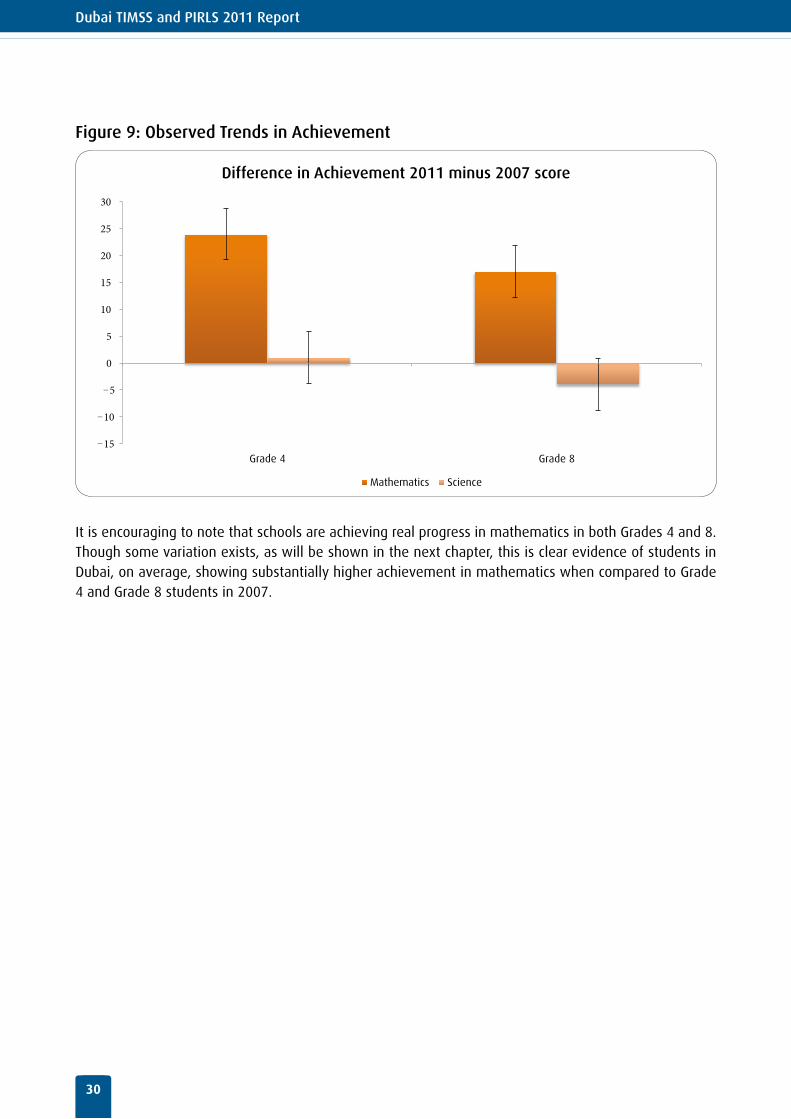
At the Emirate level, Figure 9 demonstrates the difference in scores between 2007 and 2011 in Mathematics and Science at each grade level. The charts compare average student performance in 2011 to that of student in the same grade, four years ago in Dubai.
As can be seen by the figure below, there appears to be no significant change in the Science score in Dubai, when comparing both Grade 4 and Grade 8 students to students who were in the same respective grades four years ago. Although the observed average in 2011 seems to be lower than that of 2007, the standard error shows that this difference is not statistically different. This is not the case in mathematics, where the observed difference is found to be statistically significant. In other words, there appears to be a positive trend in mathematics at both Grade 4 and Grade 8. However, there does not appear to be a change in Science scores where the difference between 2007 and 2011 for Grade 4 and Grade 8 are not statistically different.
Dubai TIMSS and PIRLS 2011 Report
30
Figure 9: Observed Trends in Achievement
-15
-10
-5
0
5
10
15
20
25
30
Grade 4 Grade 8
Mathematics Science
Difference in Achievement 2011 minus 2007 score
It is encouraging to note that schools are achieving real progress in mathematics in both Grades 4 and 8. Though some variation exists, as will be shown in the next chapter, this is clear evidence of students in Dubai, on average, showing substantially higher achievement in mathematics when compared to Grade 4 and Grade 8 students in 2007.

31
33Student Performance Across Curricula Types in Dubai
Dubai TIMSS and PIRLS 2011 Report
34
Student Performance Across Curricula Types in DubaiThe Dubai schooling landscape is a reflection of the diversity of the Emirate’s population. As a result, Dubai is characterised as having one of the most privatised education systems in the world whereby over 80% of students attend private schools. Students in Dubai follow one of 139 curricula on offer at schools in Dubai. Data from international assessments provide an international benchmarking of school curricula and enables KHDA to identify the different learning levels exhibited by students in the various types of schools in Dubai.
Further analysis of student scores reveals substantial variation in all domains across Dubai. This section highlights the differential achievement patterns of different students in Mathematics, Science and Reading at the Grade 4 level. The next section highlights the same aspects found in Mathematics and Science at the Grade 8 level.
Achievement at Grade 410
Mathematics
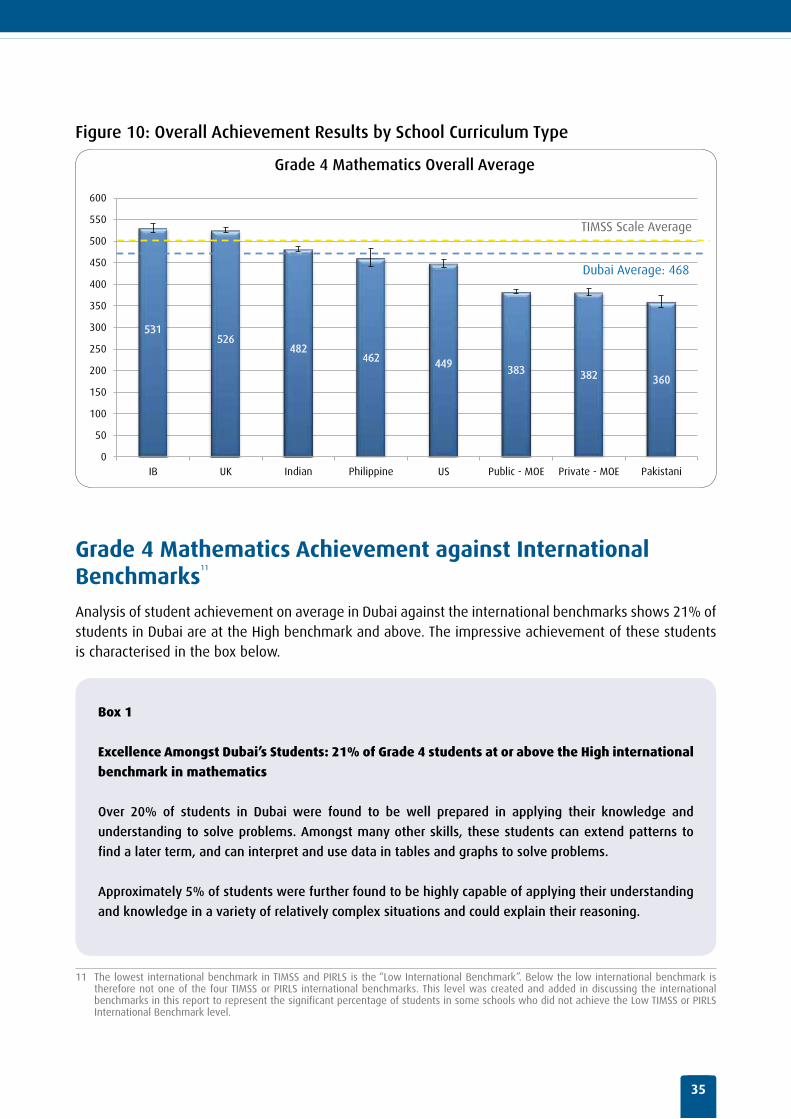
The overall mathematics average of 468 for Grade 4 students in Dubai was found to be the highest in the region. Student achievement varies significantly for students attending different types of schools in Dubai. Students attending UK and IB schools achieved the highest scores on average, at approximately 30 points above the international average. Students in Indian curriculum schools scored better than those in the MoE, US, Pakistani, and Philippine curricula schools with an average score that was slightly below the international average. Students learning in US curriculum schools achieved higher scores than those in MoE, Pakistani, and Philippine curricula schools, but their performance level was lower than that of students in Indian, UK, and IB curricula schools. In both Public-MoE and Private-MoE curriculum schools, students’ scores were similar at approximately 118 points below the international average. Students in Pakistani schools performed well below compared to those learning in all other curricula with an average of 360 points.
9 As explained in the Section 1, not all students from the 13 types of school curricula existing in Dubai participated in TIMSS and PIRLS 2011.
10 This section discusses performance in Grade 4 according to TIMSS and PIRLS international benchmarks, and performance in TIMSS and PIRLS content and cognitive domains. Refer to Appendices II and III for the descriptions of the international benchmarks, and to Section 1 for more information about the content and the cognitive domains.
35
Figure 10: Overall Achievement Results by School Curriculum Type
531 526
482 462 449
383 382 360
0
50
100
150
200
250
300
350
400
450
500
550
600
IB UK Indian Philippine US Public - MOE Private - MOE Pakistani
Grade 4 Mathematics Overall Average
Dubai Average: 468
TIMSS Scale Average
Grade 4 Mathematics Achievement against International Benchmarks
11
Analysis of student achievement on average in Dubai against the international benchmarks shows 21% of students in Dubai are at the High benchmark and above. The impressive achievement of these students is characterised in the box below.
Box 1
Excellence Amongst Dubai’s Students: 21% of Grade 4 students at or above the High international
benchmark in mathematics
Over 20% of students in Dubai were found to be well prepared in applying their knowledge and
understanding to solve problems. Amongst many other skills, these students can extend patterns to
find a later term, and can interpret and use data in tables and graphs to solve problems.
Approximately 5% of students were further found to be highly capable of applying their understanding
and knowledge in a variety of relatively complex situations and could explain their reasoning.
11 The lowest international benchmark in TIMSS and PIRLS is the “Low International Benchmark”. Below the low international benchmark is therefore not one of the four TIMSS or PIRLS international benchmarks. This level was created and added in discussing the international benchmarks in this report to represent the significant percentage of students in some schools who did not achieve the Low TIMSS or PIRLS International Benchmark level.

Dubai TIMSS and PIRLS 2011 Report
36
Figure 11: Grade 4 Mathematics – Achievement Results against International Benchmarks by School Curriculum Type
70
58
58
31
16
17
7
5
22
25
28
29
45
27
19
16
7
15
12
25
28
34
34
38
1
2
2
12
10
19
29
32
3
1
3
11
9
0% 10% 20% 30% 40% 50% 60% 70% 80% 90% 100%
Pakistani
Private - MOE
Public - MOE
US
Philippine
Indian
UK
IB
Grade 4 Mathematics - International Benchmarks
Below Low International Benchmark Low International Benchmark Intermediate International Benchmark High International Benchmark Advanced International Benchmark
The highest proportion of students achieving the Advanced and High benchmark levels was found amongst students at schools that offer the IB curriculum and at schools that offer UK curriculum. At least 11% of students at UK curriculum schools and 9% of students at IB curriculum schools achieved at the Advanced international benchmark level. This is a level at which students can undertake complex analyses, draw mathematical conclusions and justify their reasoning.
The level of achievement of the majority of students studying in US curriculum schools was at the Low benchmark level or below. As many as 58% of students at schools teaching the Public-MoE and Privat-MoE curriculum and 70% of students studying in Pakistani curriculum schools displayed achievement levels below the Low international benchmark. This is a critically low level at which students can only perform basic tasks.
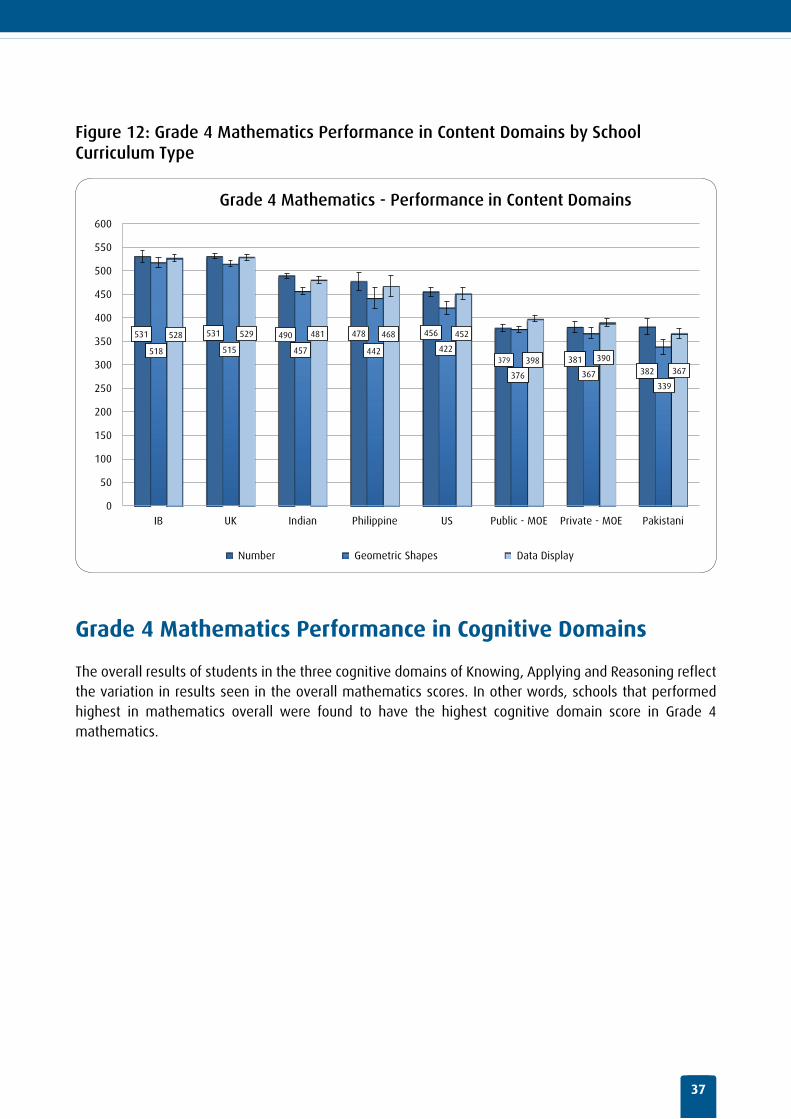
Grade 4 Mathematics Performance in Content Domains
TIMSS Grade 4 mathematics includes three content domains: Number, Geometric Shapes and Measures, and Data Display. The highest results of students across all schools of various types of curricula were in Number and Data Display domains, where students’ scores were largely similar. However, the Geometric Shapes and Measures domain presented the greatest challenge for almost all students across Dubai. The best performance of students in this content domain was found in UK and IB curricula schools. The scores of students in all content domains were consistent with the overall Grade 4 mathematics scores.
37
Figure 12: Grade 4 Mathematics Performance in Content Domains by School Curriculum Type
531 531 490 478 456
379 381 382
518 515 457 442 422
376 367 339
528 529 481 468 452
398 390
367
0
50
100
150
200
250
300
350
400
450
500
550
600
IB UK Indian Philippine US Public - MOE Private - MOE Pakistani
Grade 4 Mathematics - Performance in Content Domains
Number Geometric Shapes Data Display
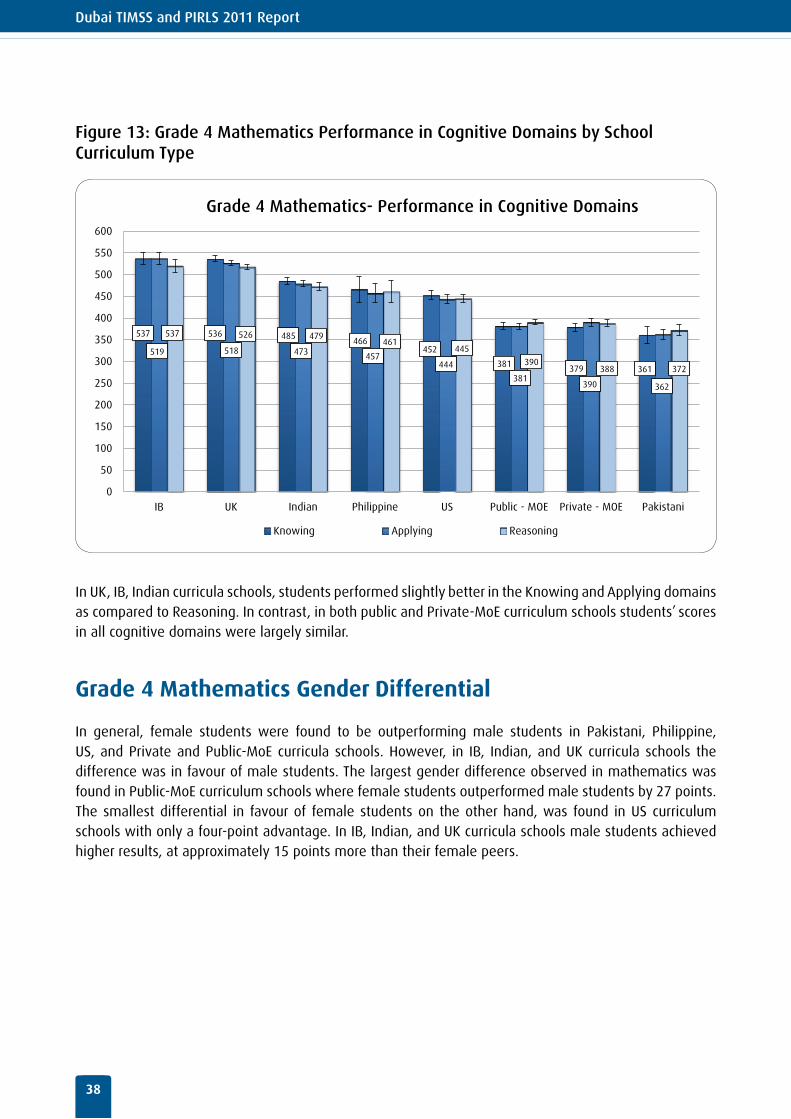
Grade 4 Mathematics Performance in Cognitive Domains
The overall results of students in the three cognitive domains of Knowing, Applying and Reasoning reflect the variation in results seen in the overall mathematics scores. In other words, schools that performed highest in mathematics overall were found to have the highest cognitive domain score in Grade 4 mathematics.
Dubai TIMSS and PIRLS 2011 Report
38
Figure 13: Grade 4 Mathematics Performance in Cognitive Domains by School Curriculum Type
537 536 485 466
452
381 379 361
537 526 479
457 444
381 390 362
519 518 473 461
445
390 388 372
0
50
100
150
200
250
300
350
400
450
500
550
600
IB UK Indian Philippine US Public - MOE Private - MOE Pakistani
Grade 4 Mathematics- Performance in Cognitive Domains
Knowing Applying Reasoning
In UK, IB, Indian curricula schools, students performed slightly better in the Knowing and Applying domains as compared to Reasoning. In contrast, in both public and Private-MoE curriculum schools students’ scores in all cognitive domains were largely similar.
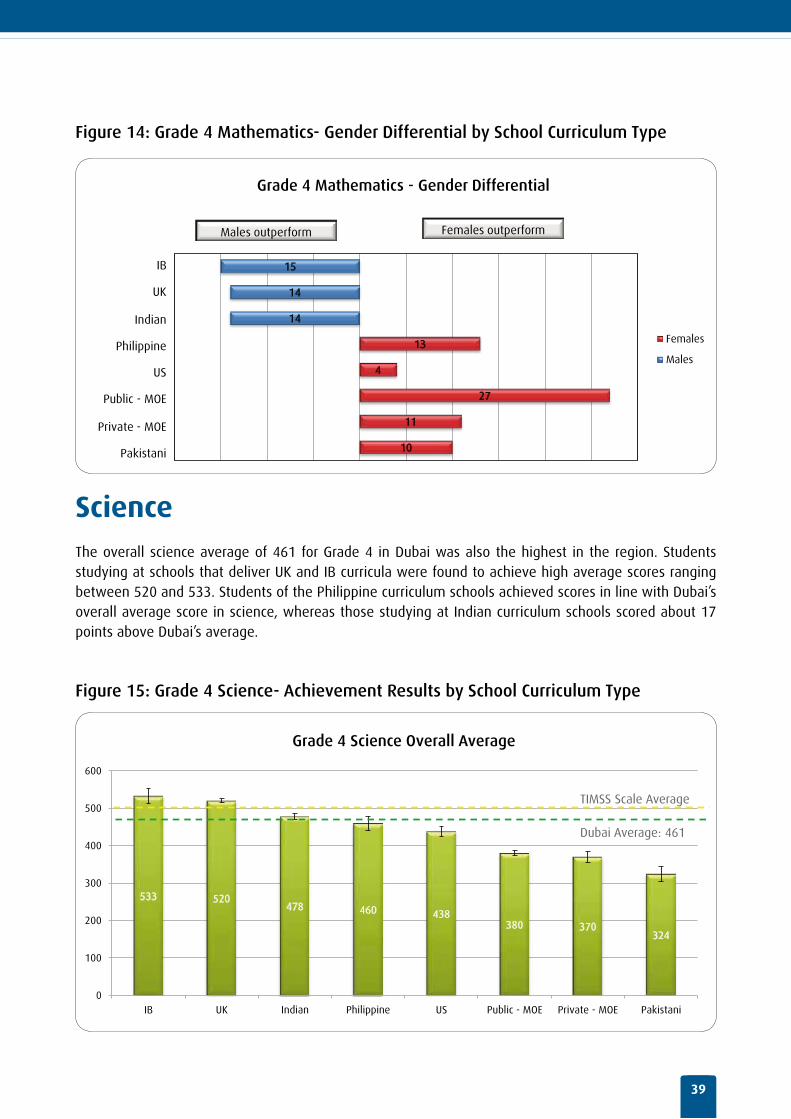
Grade 4 Mathematics Gender Differential
In general, female students were found to be outperforming male students in Pakistani, Philippine, US, and Private and Public-MoE curricula schools. However, in IB, Indian, and UK curricula schools the difference was in favour of male students. The largest gender difference observed in mathematics was found in Public-MoE curriculum schools where female students outperformed male students by 27 points. The smallest differential in favour of female students on the other hand, was found in US curriculum schools with only a four-point advantage. In IB, Indian, and UK curricula schools male students achieved higher results, at approximately 15 points more than their female peers.
39
Figure 14: Grade 4 Mathematics- Gender Differential by School Curriculum Type
10
11
27
4
13
14
14
15
Grade 4 Mathematics - Gender Differential
Females
Males
IB
UK
Indian
Philippine
US
Public - MOE
Private - MOE
Pakistani
Females outperform Males outperform
ScienceThe overall science average of 461 for Grade 4 in Dubai was also the highest in the region. Students studying at schools that deliver UK and IB curricula were found to achieve high average scores ranging between 520 and 533. Students of the Philippine curriculum schools achieved scores in line with Dubai’s overall average score in science, whereas those studying at Indian curriculum schools scored about 17 points above Dubai’s average.
Figure 15: Grade 4 Science- Achievement Results by School Curriculum Type
533 520 478 460 438
380 370 324
0
100
200
300
400
500
600
IB UK Indian Philippine US Public - MOE Private - MOE Pakistani
Grade 4 Science Overall Average
TIMSS Scale Average
Dubai Average: 461
Dubai TIMSS and PIRLS 2011 Report
40
Students in US curriculum schools were significantly underperforming in science as compared to their counterparts in some other schools, particularly with students at UK, IB, and Indian schools. Students attending Public and Private-MoE curriculum schools demonstrated low levels of attainment in science that were substantially below international standards. Students in Pakistani curriculum schools achieved the lowest scores, with 176 points below the TIMSS international average.
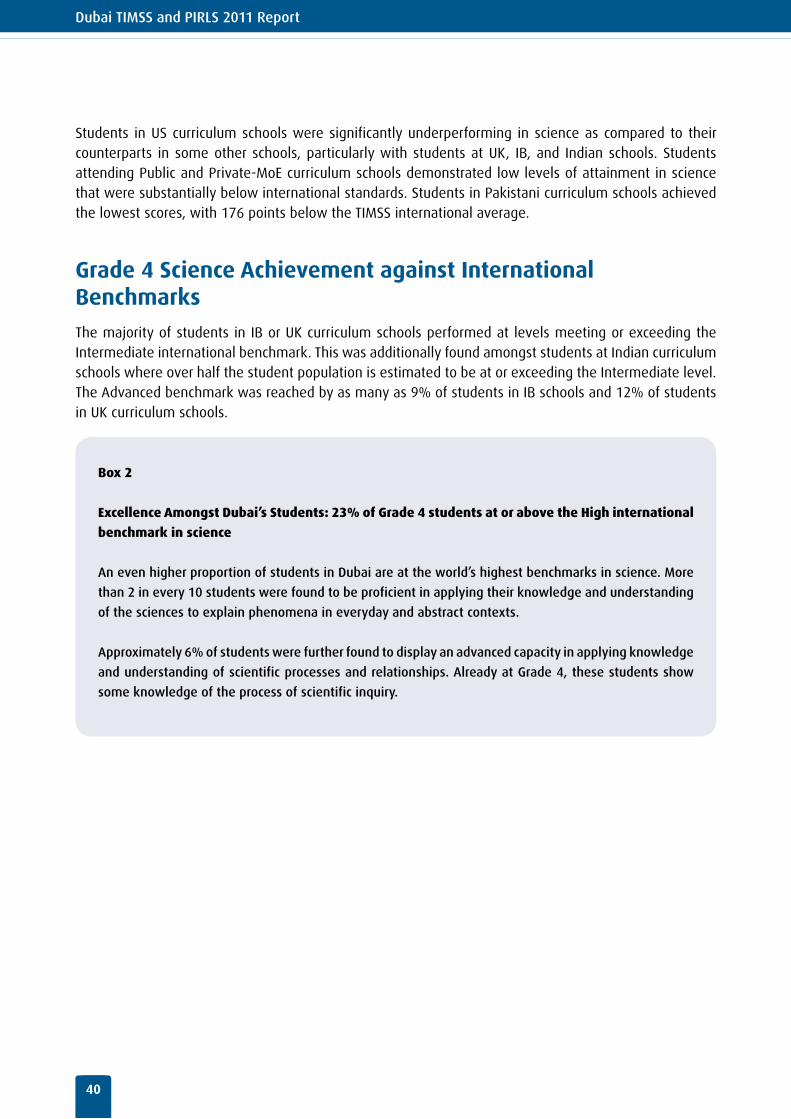
Grade 4 Science Achievement against International Benchmarks
The majority of students in IB or UK curriculum schools performed at levels meeting or exceeding the Intermediate international benchmark. This was additionally found amongst students at Indian curriculum schools where over half the student population is estimated to be at or exceeding the Intermediate level. The Advanced benchmark was reached by as many as 9% of students in IB schools and 12% of students in UK curriculum schools.
Box 2
Excellence Amongst Dubai’s Students: 23% of Grade 4 students at or above the High international
benchmark in science
An even higher proportion of students in Dubai are at the world’s highest benchmarks in science. More
than 2 in every 10 students were found to be proficient in applying their knowledge and understanding
of the sciences to explain phenomena in everyday and abstract contexts.
Approximately 6% of students were further found to display an advanced capacity in applying knowledge
and understanding of scientific processes and relationships. Already at Grade 4, these students show
some knowledge of the process of scientific inquiry.
41
Figure 16: Grade 4 Science – Achievement Results against International Benchmarks by School Curriculum Type
77
60
58
36
20
21
10
6
15
22
24
25
39
26
19
13
7
14
14
23
29
28
31
37
1
3
4
13
10
19
28
35
1
3
2
6
12
9
0% 10% 20% 30% 40% 50% 60% 70% 80% 90% 100%
Pakistani
Private - MOE
Public - MOE
US
Philippine
Indian
UK
IB
Grade 4 Science - International Benchmarks
Below Low International Benchmark Low International Benchmark
Intermediate International Benchmark High International Benchmark
Advanced International Benchmark
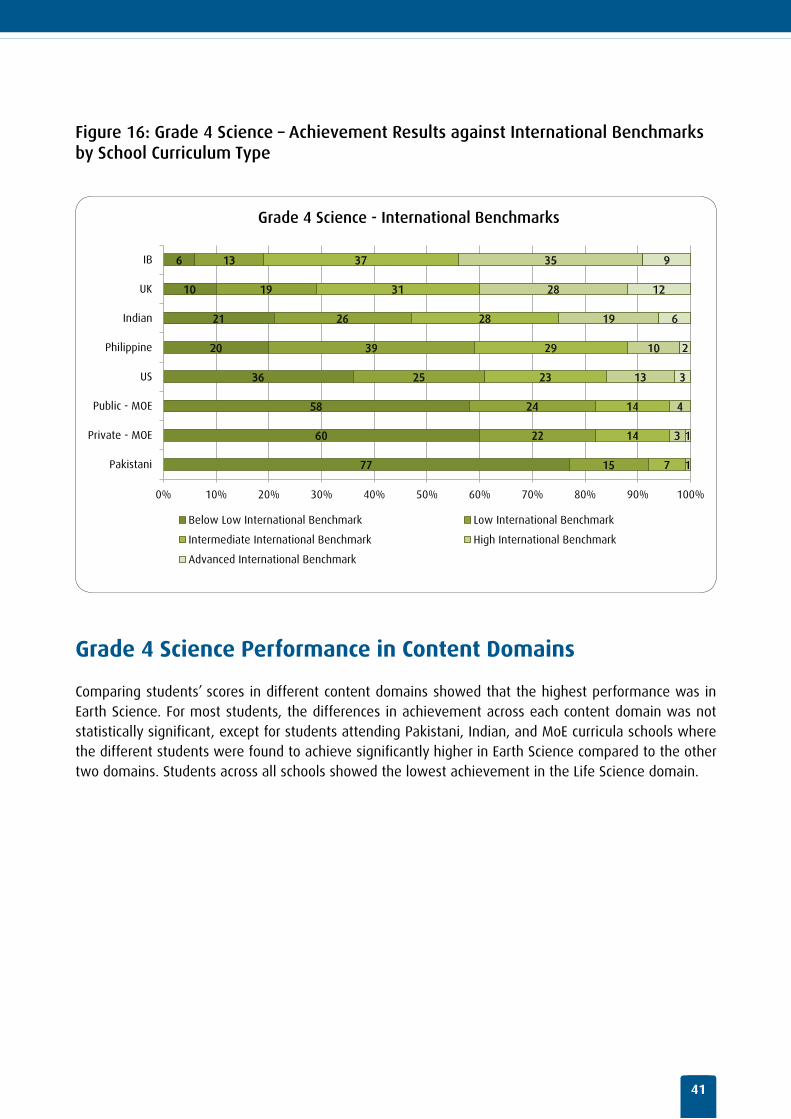
Grade 4 Science Performance in Content Domains
Comparing students’ scores in different content domains showed that the highest performance was in Earth Science. For most students, the differences in achievement across each content domain was not statistically significant, except for students attending Pakistani, Indian, and MoE curricula schools where the different students were found to achieve significantly higher in Earth Science compared to the other two domains. Students across all schools showed the lowest achievement in the Life Science domain.
Dubai TIMSS and PIRLS 2011 Report
42
Figure 17: Grade 4 Science- Performance in Content Domains by School Curriculum Type
535
518
474
454 432
368 354
301
536 521
473
467 440
377 366
305
535
527
491
470 445
390 380
329
0
50
100
150
200
250
300
350
400
450
500
550
600
IB UK Indian Philippine US Public - MOE Private - MOE Pakistani
Grade 4 Science- Performance in Content Domains
Life Science Physical Science Earth Science
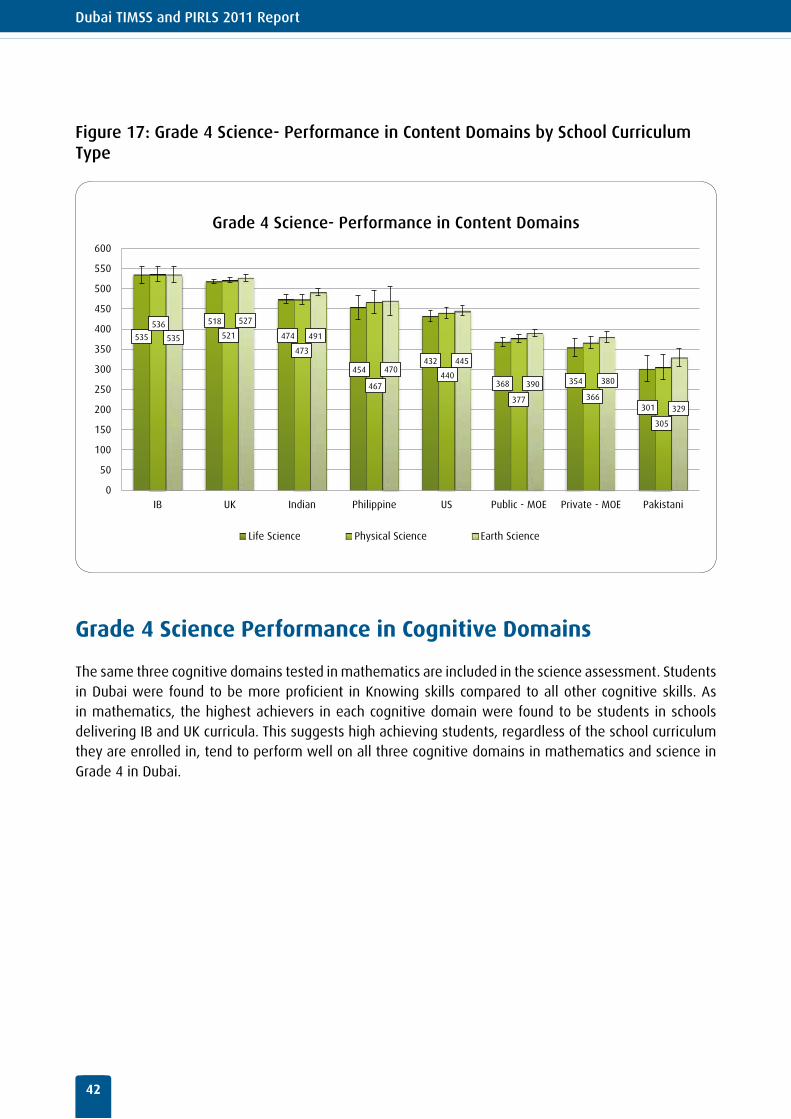
Grade 4 Science Performance in Cognitive Domains
The same three cognitive domains tested in mathematics are included in the science assessment. Students in Dubai were found to be more proficient in Knowing skills compared to all other cognitive skills. As in mathematics, the highest achievers in each cognitive domain were found to be students in schools delivering IB and UK curricula. This suggests high achieving students, regardless of the school curriculum they are enrolled in, tend to perform well on all three cognitive domains in mathematics and science in Grade 4 in Dubai.
43
Figure 18: Grade 4 Science- Performance in Cognitive Domains by School Curriculum Type
543 526 491
470 444
376 366
312
531 514 468
454 431
373 360
303
531 513 468
454 434
378 370
316
0
50
100
150
200
250
300
350
400
450
500
550
600
IB UK Indian Philippine US Public - MOE Private - MOE Pakistani
Grade 4 Science- Performance in Cognitive Domains
Knowing Applying Reasoning
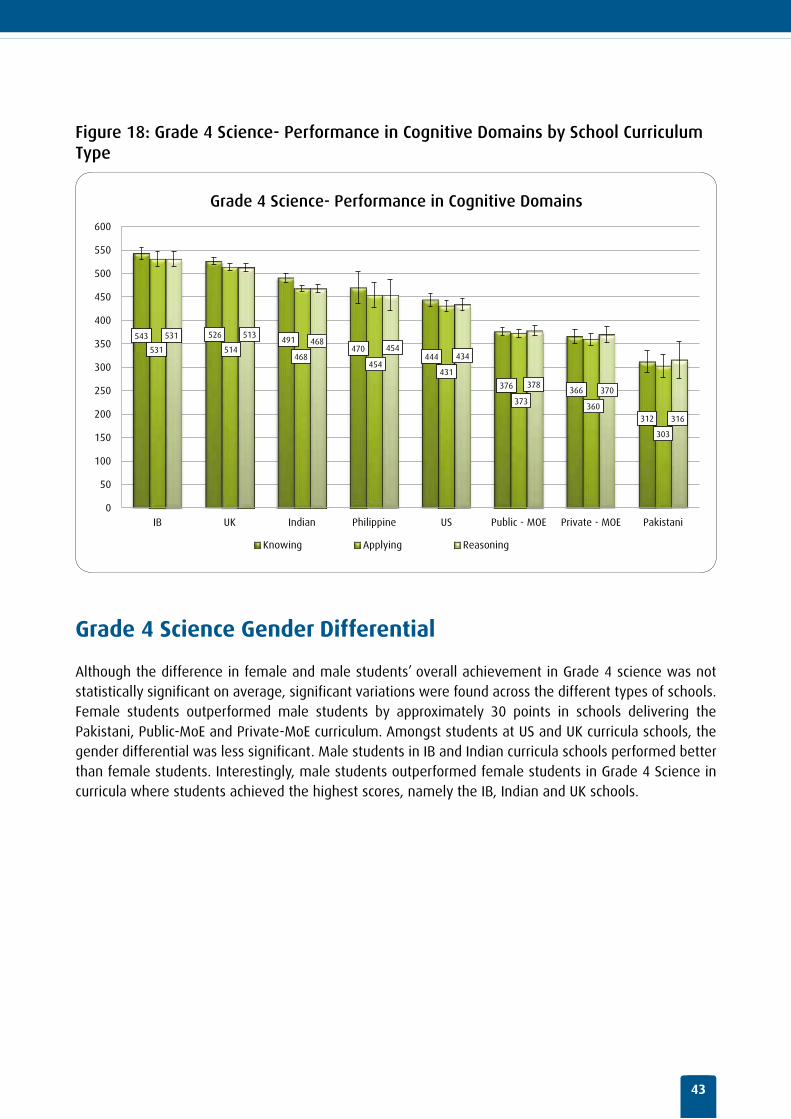
Grade 4 Science Gender Differential
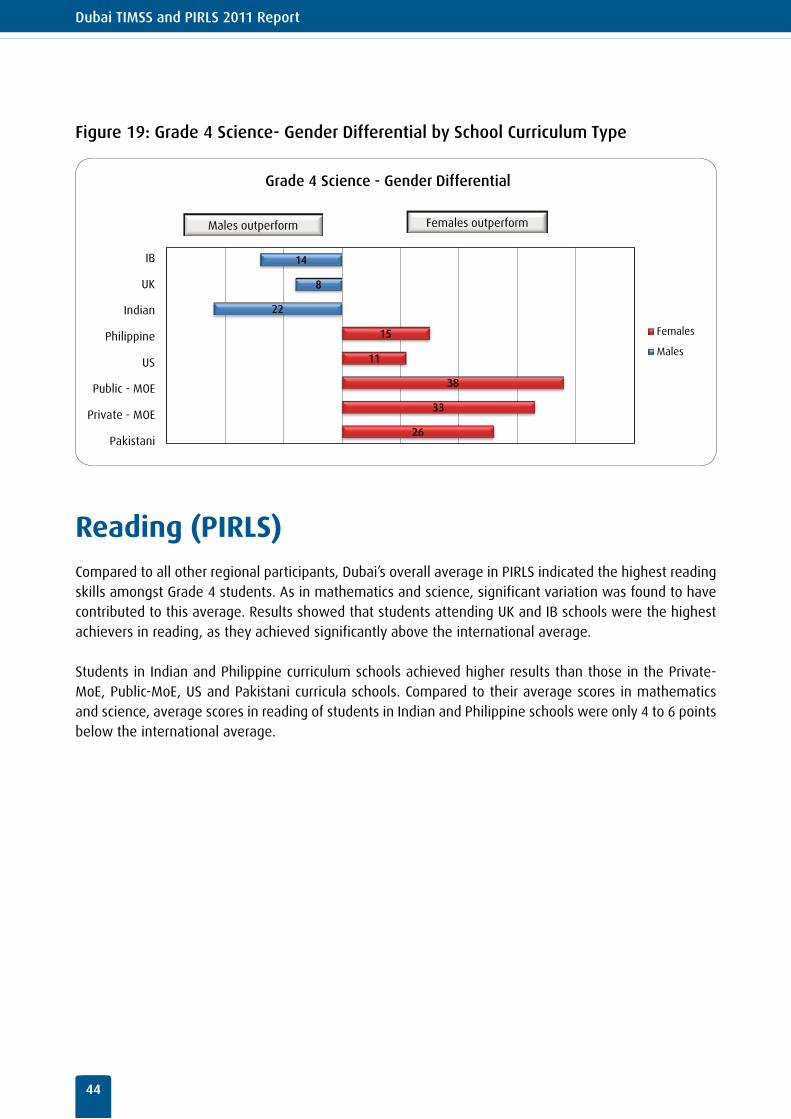
Although the difference in female and male students’ overall achievement in Grade 4 science was not statistically significant on average, significant variations were found across the different types of schools. Female students outperformed male students by approximately 30 points in schools delivering the Pakistani, Public-MoE and Private-MoE curriculum. Amongst students at US and UK curricula schools, the gender differential was less significant. Male students in IB and Indian curricula schools performed better than female students. Interestingly, male students outperformed female students in Grade 4 Science in curricula where students achieved the highest scores, namely the IB, Indian and UK schools.
Dubai TIMSS and PIRLS 2011 Report
44
Figure 19: Grade 4 Science- Gender Differential by School Curriculum Type
26
33
38
11
15
22
8
14
Grade 4 Science - Gender Differential
Females
Males
IB
UK
Indian
Philippine
US
Public - MOE
Private - MOE
Pakistani
Females outperform Males outperform
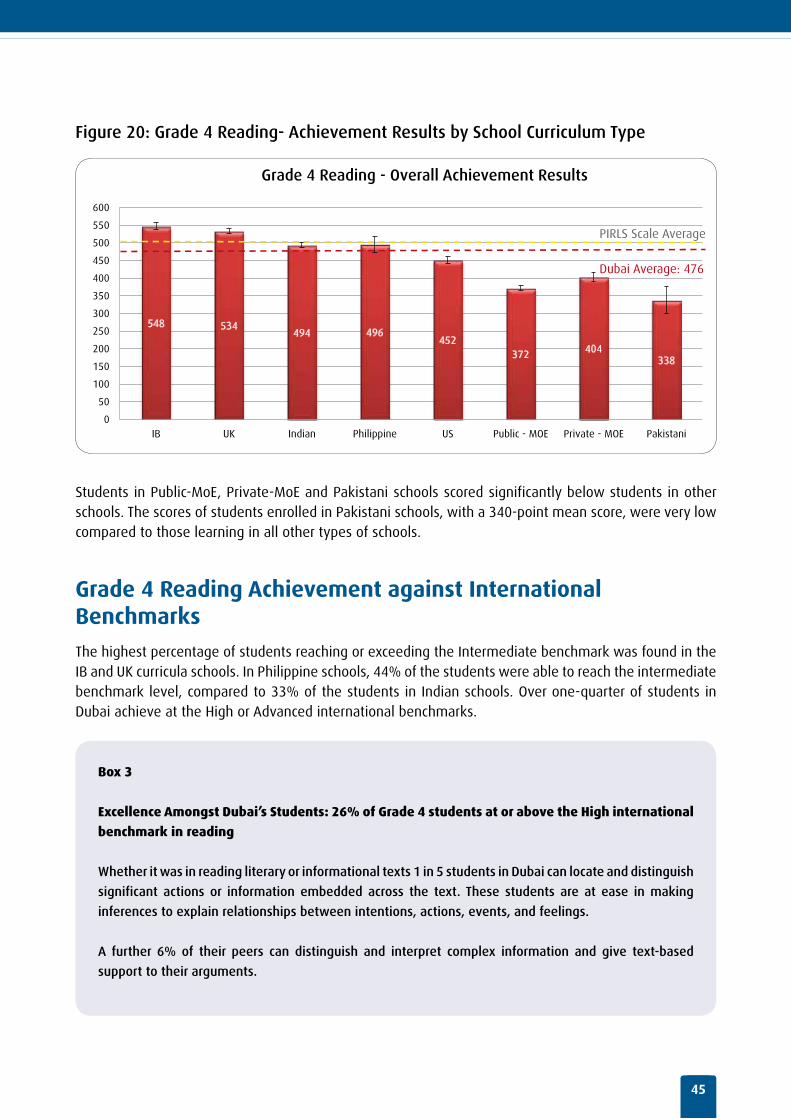
Reading (PIRLS)Compared to all other regional participants, Dubai’s overall average in PIRLS indicated the highest reading skills amongst Grade 4 students. As in mathematics and science, significant variation was found to have contributed to this average. Results showed that students attending UK and IB schools were the highest achievers in reading, as they achieved significantly above the international average.
Students in Indian and Philippine curriculum schools achieved higher results than those in the Private-MoE, Public-MoE, US and Pakistani curricula schools. Compared to their average scores in mathematics and science, average scores in reading of students in Indian and Philippine schools were only 4 to 6 points below the international average.
45
Figure 20: Grade 4 Reading- Achievement Results by School Curriculum Type
548 534 494 496
452 372 404
338
0
50
100
150
200
250
300
350
400
450
500
550
600
IB UK Indian Philippine US Public - MOE Private - MOE Pakistani
Grade 4 Reading - Overall Achievement Results
PIRLS Scale Average
Dubai Average: 476
Students in Public-MoE, Private-MoE and Pakistani schools scored significantly below students in other schools. The scores of students enrolled in Pakistani schools, with a 340-point mean score, were very low compared to those learning in all other types of schools.
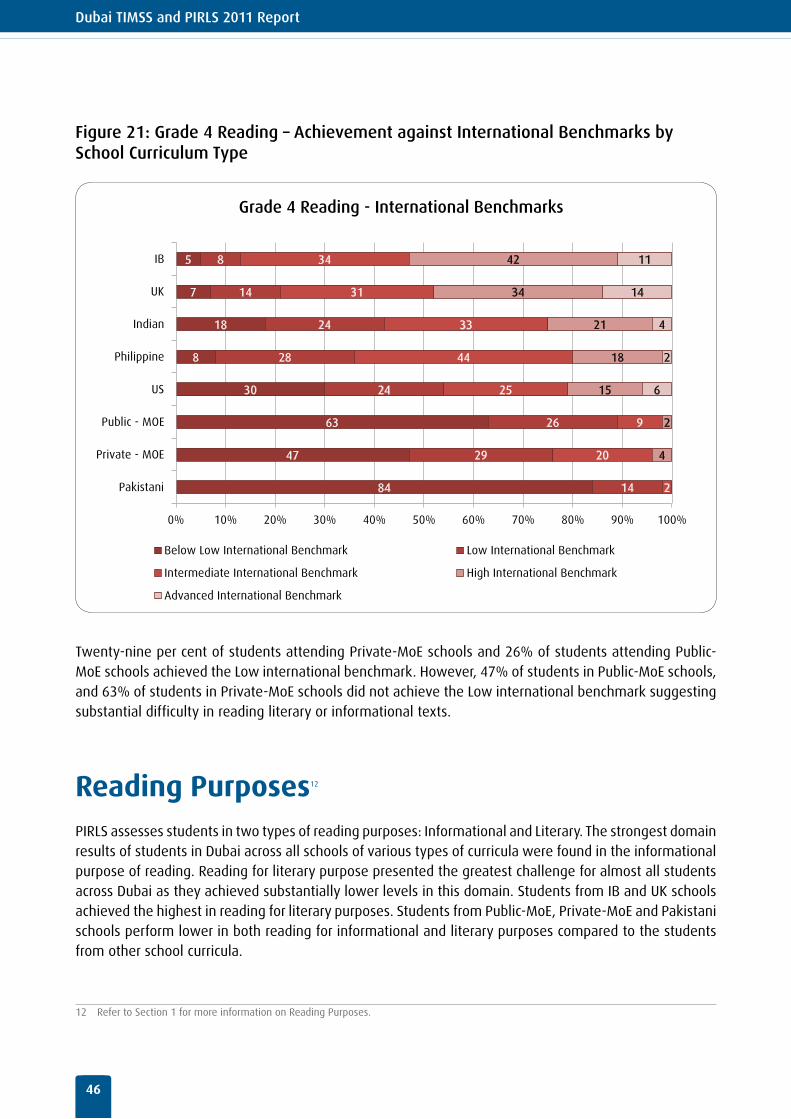
Grade 4 Reading Achievement against International Benchmarks
The highest percentage of students reaching or exceeding the Intermediate benchmark was found in the IB and UK curricula schools. In Philippine schools, 44% of the students were able to reach the intermediate benchmark level, compared to 33% of the students in Indian schools. Over one-quarter of students in Dubai achieve at the High or Advanced international benchmarks.
Box 3
Excellence Amongst Dubai’s Students: 26% of Grade 4 students at or above the High international
benchmark in reading
Whether it was in reading literary or informational texts 1 in 5 students in Dubai can locate and distinguish
significant actions or information embedded across the text. These students are at ease in making
inferences to explain relationships between intentions, actions, events, and feelings.
A further 6% of their peers can distinguish and interpret complex information and give text-based
support to their arguments.
Dubai TIMSS and PIRLS 2011 Report
46
Figure 21: Grade 4 Reading – Achievement against International Benchmarks by School Curriculum Type
84
47
63
30
8
18
7
5
14
29
26
24
28
24
14
8
2
20
9
25
44
33
31
34
4
2
15
18
21
34
42
6
2
4
14
11
0% 10% 20% 30% 40% 50% 60% 70% 80% 90% 100%
Pakistani
Private - MOE
Public - MOE
US
Philippine
Indian
UK
IB
Grade 4 Reading - International Benchmarks
Below Low International Benchmark Low International Benchmark
Intermediate International Benchmark High International Benchmark
Advanced International Benchmark
Twenty-nine per cent of students attending Private-MoE schools and 26% of students attending Public-MoE schools achieved the Low international benchmark. However, 47% of students in Public-MoE schools, and 63% of students in Private-MoE schools did not achieve the Low international benchmark suggesting substantial difficulty in reading literary or informational texts.
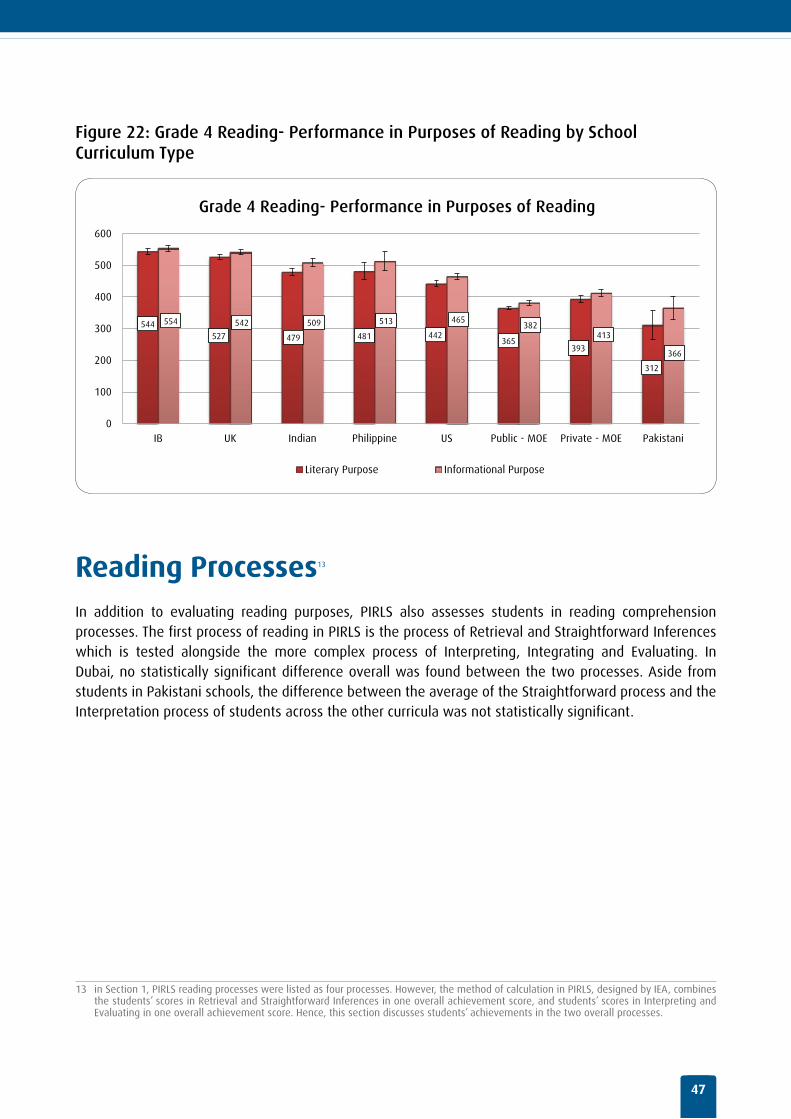
Reading Purposes12
PIRLS assesses students in two types of reading purposes: Informational and Literary. The strongest domain results of students in Dubai across all schools of various types of curricula were found in the informational purpose of reading. Reading for literary purpose presented the greatest challenge for almost all students across Dubai as they achieved substantially lower levels in this domain. Students from IB and UK schools achieved the highest in reading for literary purposes. Students from Public-MoE, Private-MoE and Pakistani schools perform lower in both reading for informational and literary purposes compared to the students from other school curricula.
12 Refer to Section 1 for more information on Reading Purposes.
47
Figure 22: Grade 4 Reading- Performance in Purposes of Reading by School Curriculum Type
544 527 479 481 442
365 393
312
554 542 509 513 465 382
413
366
0
100
200
300
400
500
600
IB UK Indian Philippine US Public - MOE Private - MOE Pakistani
Grade 4 Reading- Performance in Purposes of Reading
Literary Purpose Informational Purpose
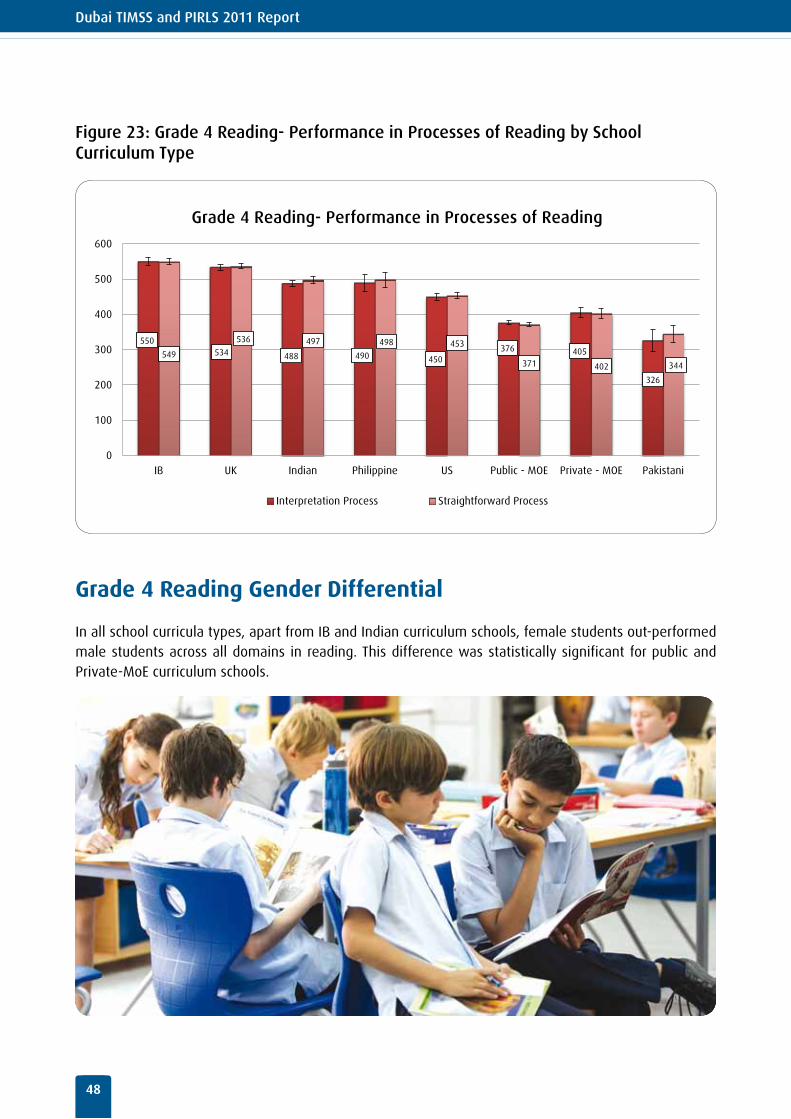
Reading Processes13
In addition to evaluating reading purposes, PIRLS also assesses students in reading comprehension processes. The first process of reading in PIRLS is the process of Retrieval and Straightforward Inferences which is tested alongside the more complex process of Interpreting, Integrating and Evaluating. In Dubai, no statistically significant difference overall was found between the two processes. Aside from students in Pakistani schools, the difference between the average of the Straightforward process and the Interpretation process of students across the other curricula was not statistically significant.
13 in Section 1, PIRLS reading processes were listed as four processes. However, the method of calculation in PIRLS, designed by IEA, combines the students’ scores in Retrieval and Straightforward Inferences in one overall achievement score, and students’ scores in Interpreting and Evaluating in one overall achievement score. Hence, this section discusses students’ achievements in the two overall processes.
Dubai TIMSS and PIRLS 2011 Report
48
Figure 23: Grade 4 Reading- Performance in Processes of Reading by School Curriculum Type
550 534 488 490 450
376 405
326
549
536 497 498 453
371 402 344
0
100
200
300
400
500
600
IB UK Indian Philippine US Public - MOE Private - MOE Pakistani
Grade 4 Reading- Performance in Processes of Reading
Interpretation Process Straightforward Process
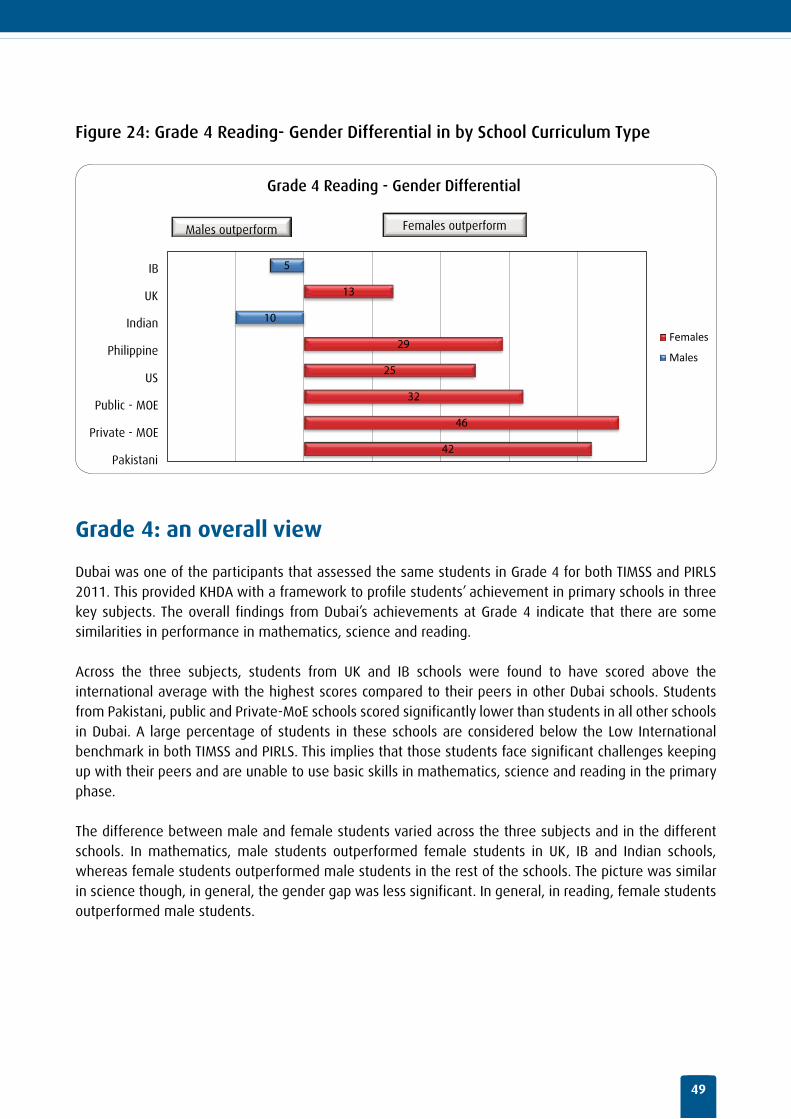
Grade 4 Reading Gender Differential
In all school curricula types, apart from IB and Indian curriculum schools, female students out-performed male students across all domains in reading. This difference was statistically significant for public and Private-MoE curriculum schools.
49
Figure 24: Grade 4 Reading- Gender Differential in by School Curriculum Type
42
46
32
25
29
13
10
5
Grade 4 Reading - Gender Differential
Females
Males
IB
UK
Indian
Philippine
US
Public - MOE
Private - MOE
Pakistani
Females outperform Males outperform
Grade 4: an overall view
Dubai was one of the participants that assessed the same students in Grade 4 for both TIMSS and PIRLS 2011. This provided KHDA with a framework to profile students’ achievement in primary schools in three key subjects. The overall findings from Dubai’s achievements at Grade 4 indicate that there are some similarities in performance in mathematics, science and reading.
Across the three subjects, students from UK and IB schools were found to have scored above the international average with the highest scores compared to their peers in other Dubai schools. Students from Pakistani, public and Private-MoE schools scored significantly lower than students in all other schools in Dubai. A large percentage of students in these schools are considered below the Low International benchmark in both TIMSS and PIRLS. This implies that those students face significant challenges keeping up with their peers and are unable to use basic skills in mathematics, science and reading in the primary phase.
The difference between male and female students varied across the three subjects and in the different schools. In mathematics, male students outperformed female students in UK, IB and Indian schools, whereas female students outperformed male students in the rest of the schools. The picture was similar in science though, in general, the gender gap was less significant. In general, in reading, female students outperformed male students.
Dubai TIMSS and PIRLS 2011 Report
50
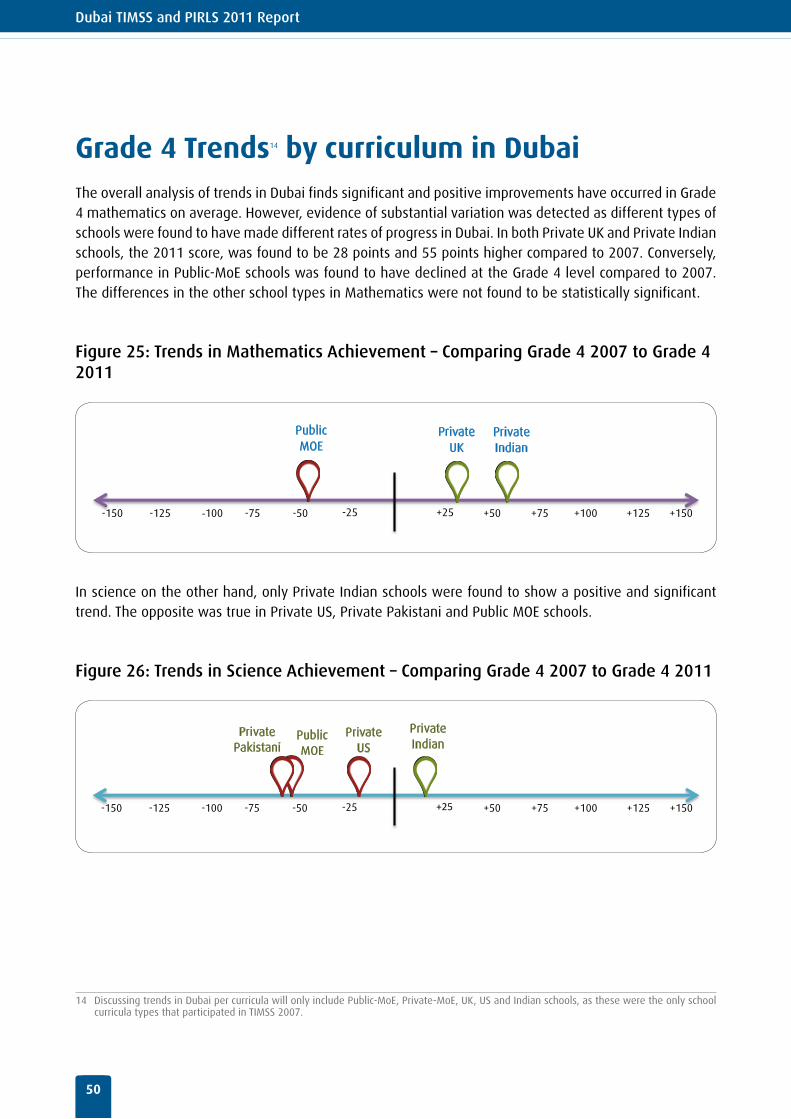
Grade 4 Trends14 by curriculum in DubaiThe overall analysis of trends in Dubai finds significant and positive improvements have occurred in Grade 4 mathematics on average. However, evidence of substantial variation was detected as different types of schools were found to have made different rates of progress in Dubai. In both Private UK and Private Indian schools, the 2011 score, was found to be 28 points and 55 points higher compared to 2007. Conversely, performance in Public-MoE schools was found to have declined at the Grade 4 level compared to 2007. The differences in the other school types in Mathematics were not found to be statistically significant.
Figure 25: Trends in Mathematics Achievement – Comparing Grade 4 2007 to Grade 4 2011
-25 -50 -75 -100 -125 -150 +25 +50 +75 +100 +125 +150
Private Indian
Private UK
Public MOE
In science on the other hand, only Private Indian schools were found to show a positive and significant trend. The opposite was true in Private US, Private Pakistani and Public MOE schools.
Figure 26: Trends in Science Achievement – Comparing Grade 4 2007 to Grade 4 2011
-25 -50 -75 -100 -125 -150 +25 +50 +75 +100 +125 +150
Private Indian
Private Pakistani
Public MOE
Private US
14 Discussing trends in Dubai per curricula will only include Public-MoE, Private-MoE, UK, US and Indian schools, as these were the only school curricula types that participated in TIMSS 2007.
51
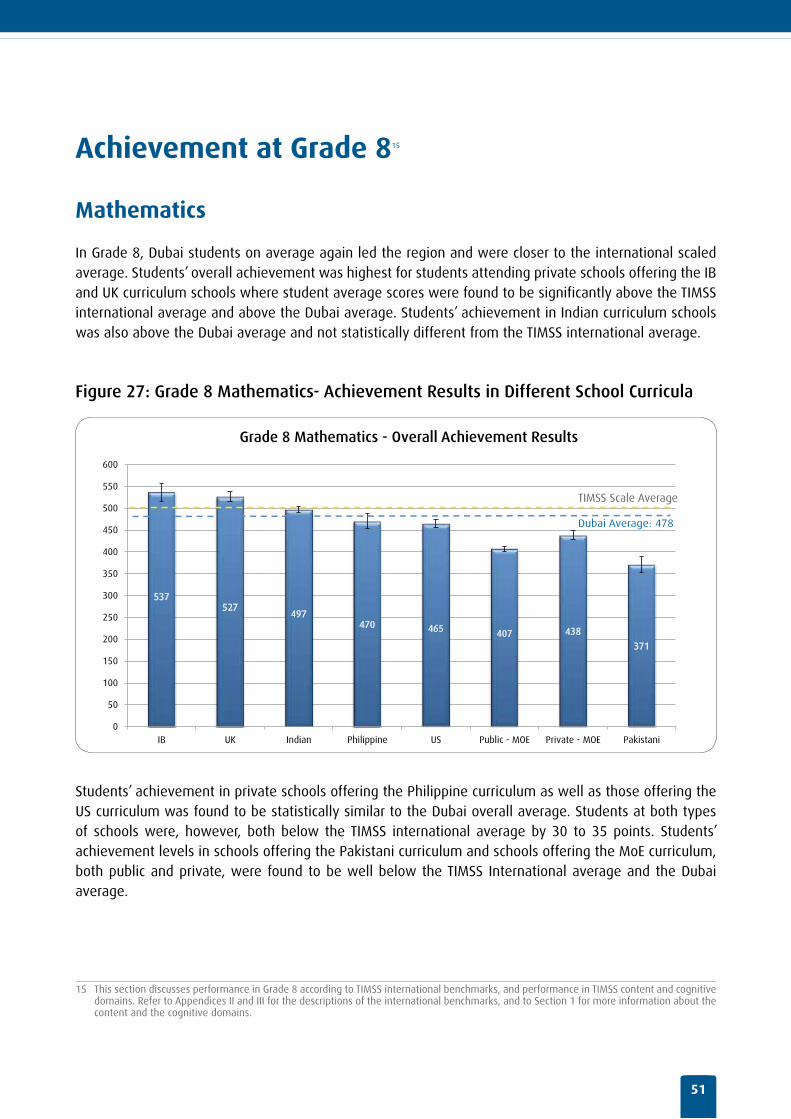
Achievement at Grade 815
Mathematics
In Grade 8, Dubai students on average again led the region and were closer to the international scaled average. Students’ overall achievement was highest for students attending private schools offering the IB and UK curriculum schools where student average scores were found to be significantly above the TIMSS international average and above the Dubai average. Students’ achievement in Indian curriculum schools was also above the Dubai average and not statistically different from the TIMSS international average.
Figure 27: Grade 8 Mathematics- Achievement Results in Different School Curricula
537 527
497 470 465 407 438
371
0
50
100
150
200
250
300
350
400
450
500
550
600
IB UK Indian Philippine US Public - MOE Private - MOE Pakistani
Grade 8 Mathematics - Overall Achievement Results
TIMSS Scale Average
Dubai Average: 478
Students’ achievement in private schools offering the Philippine curriculum as well as those offering the US curriculum was found to be statistically similar to the Dubai overall average. Students at both types of schools were, however, both below the TIMSS international average by 30 to 35 points. Students’ achievement levels in schools offering the Pakistani curriculum and schools offering the MoE curriculum, both public and private, were found to be well below the TIMSS International average and the Dubai average.
15 This section discusses performance in Grade 8 according to TIMSS international benchmarks, and performance in TIMSS content and cognitive domains. Refer to Appendices II and III for the descriptions of the international benchmarks, and to Section 1 for more information about the content and the cognitive domains.
Dubai TIMSS and PIRLS 2011 Report
52
Grade 8 Mathematics Achievement against International Benchmarks
Approximately 23% of students in Dubai were found to match the highest achievement benchmarks in the world, attaining at or above the High achievement benchmark.
Box 4
Excellence Amongst Dubai’s Students: 23% of Grade 8 students at or above the High international
benchmark in mathematics
Over 23% of students in Dubai were found to be well prepared applying their understanding and
knowledge in a variety of relatively complex situations. These students were distinguished by their
ability to solve problems involving different types of numbers and operations and analyse data in a
variety of graphs.
Approximately 5% of students were additionally capable of reasoning with information, drawing
conclusions, making generalisations and successfully solving linear equations. At this level, they can
also solve multi-step problems involving equations, formulas, and functions and geometric figures.
53
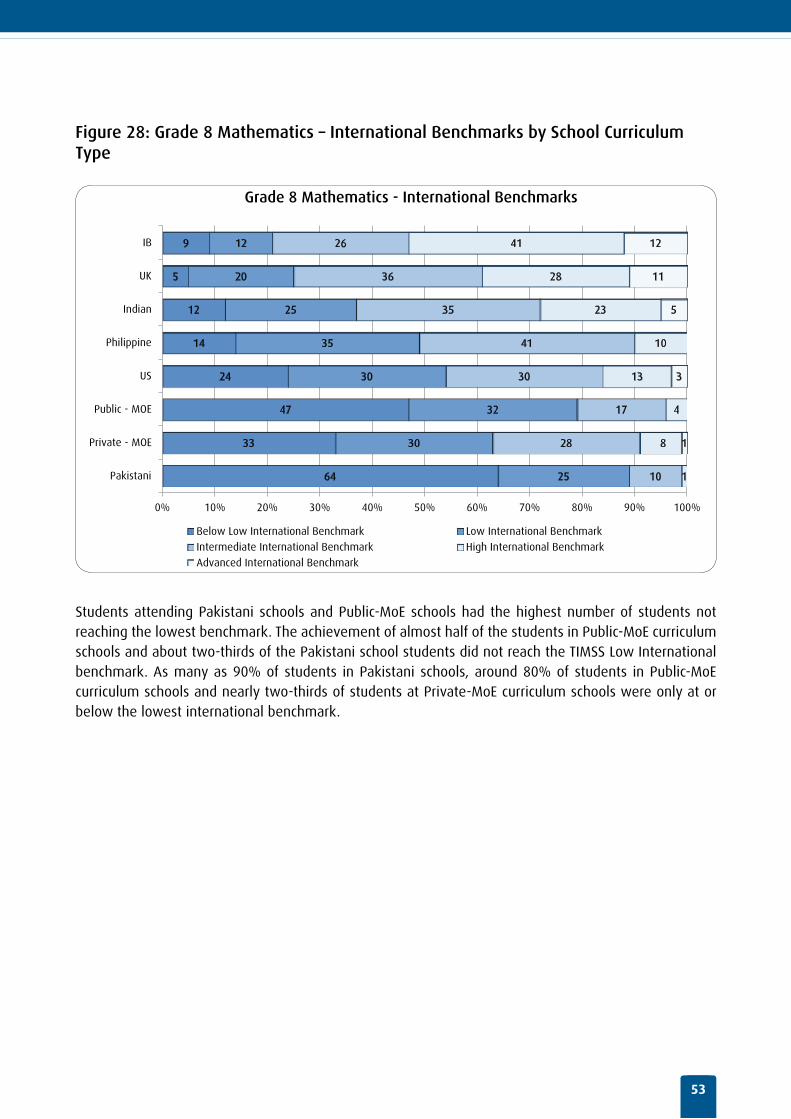
Figure 28: Grade 8 Mathematics – International Benchmarks by School Curriculum Type
64
33
47
24
14
12
5
9
25
30
32
30
35
25
20
12
10
28
17
30
41
35
36
26
1
8
4
13
10
23
28
41
1
3
5
11
12
0% 10% 20% 30% 40% 50% 60% 70% 80% 90% 100%
Pakistani
Private - MOE
Public - MOE
US
Philippine
Indian
UK
IB
Grade 8 Mathematics - International Benchmarks
Below Low International Benchmark Low International Benchmark
Intermediate International Benchmark High International Benchmark
Advanced International Benchmark
Students attending Pakistani schools and Public-MoE schools had the highest number of students not reaching the lowest benchmark. The achievement of almost half of the students in Public-MoE curriculum schools and about two-thirds of the Pakistani school students did not reach the TIMSS Low International benchmark. As many as 90% of students in Pakistani schools, around 80% of students in Public-MoE curriculum schools and nearly two-thirds of students at Private-MoE curriculum schools were only at or below the lowest international benchmark.
Dubai TIMSS and PIRLS 2011 Report
54
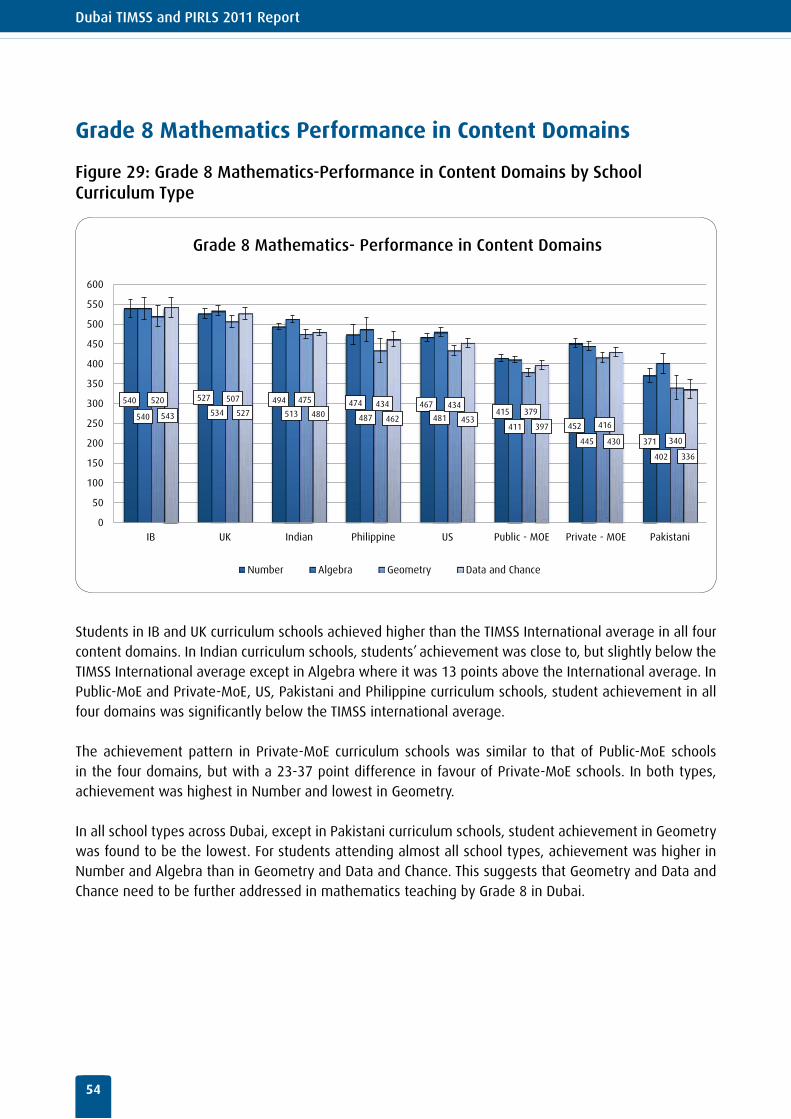
Grade 8 Mathematics Performance in Content Domains
Figure 29: Grade 8 Mathematics-Performance in Content Domains by School Curriculum Type
540 527 494 474 467 415
452
371
540 534 513 487 481 411
445
402
520 507 475 434 434 379
416
340
543 527 480 462 453 397
430
336
0
50
100
150
200
250
300
350
400
450
500
550
600
IB UK Indian Philippine US Public - MOE Private - MOE Pakistani
Grade 8 Mathematics- Performance in Content Domains
Number Algebra Geometry Data and Chance
Students in IB and UK curriculum schools achieved higher than the TIMSS International average in all four content domains. In Indian curriculum schools, students’ achievement was close to, but slightly below the TIMSS International average except in Algebra where it was 13 points above the International average. In Public-MoE and Private-MoE, US, Pakistani and Philippine curriculum schools, student achievement in all four domains was significantly below the TIMSS international average.
The achievement pattern in Private-MoE curriculum schools was similar to that of Public-MoE schools in the four domains, but with a 23-37 point difference in favour of Private-MoE schools. In both types, achievement was highest in Number and lowest in Geometry.
In all school types across Dubai, except in Pakistani curriculum schools, student achievement in Geometry was found to be the lowest. For students attending almost all school types, achievement was higher in Number and Algebra than in Geometry and Data and Chance. This suggests that Geometry and Data and Chance need to be further addressed in mathematics teaching by Grade 8 in Dubai.
55
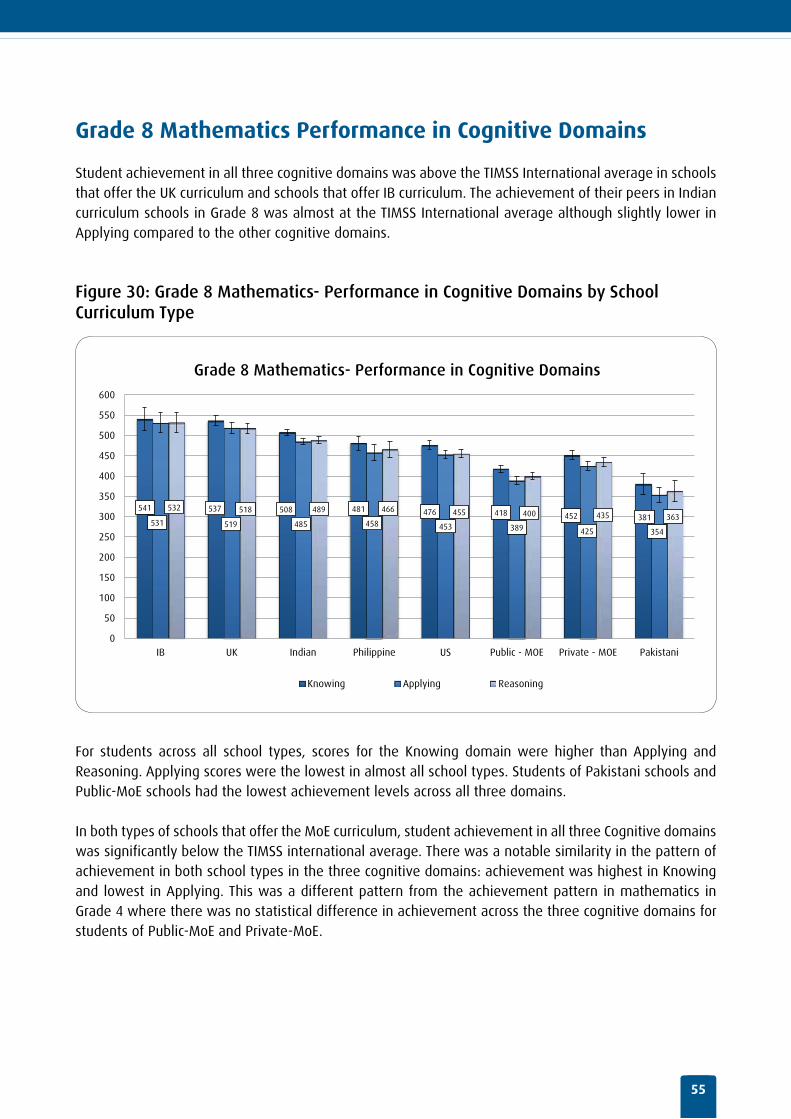
Grade 8 Mathematics Performance in Cognitive Domains
Student achievement in all three cognitive domains was above the TIMSS International average in schools that offer the UK curriculum and schools that offer IB curriculum. The achievement of their peers in Indian curriculum schools in Grade 8 was almost at the TIMSS International average although slightly lower in Applying compared to the other cognitive domains.
Figure 30: Grade 8 Mathematics- Performance in Cognitive Domains by School Curriculum Type
541 537 508 481 476 418 452 381 531 519 485 458 453 389 425 354
532 518 489 466 455 400 435 363
0
50
100
150
200
250
300
350
400
450
500
550
600
IB UK Indian Philippine US Public - MOE Private - MOE Pakistani
Grade 8 Mathematics- Performance in Cognitive Domains
Knowing Applying Reasoning
For students across all school types, scores for the Knowing domain were higher than Applying and Reasoning. Applying scores were the lowest in almost all school types. Students of Pakistani schools and Public-MoE schools had the lowest achievement levels across all three domains.
In both types of schools that offer the MoE curriculum, student achievement in all three Cognitive domains was significantly below the TIMSS international average. There was a notable similarity in the pattern of achievement in both school types in the three cognitive domains: achievement was highest in Knowing and lowest in Applying. This was a different pattern from the achievement pattern in mathematics in Grade 4 where there was no statistical difference in achievement across the three cognitive domains for students of Public-MoE and Private-MoE.
Dubai TIMSS and PIRLS 2011 Report
56
A statistically-significant difference of around 35 points was consistently found in favour of students at Private-MoE schools compared to their peers in Public-MoE across all 3 cognitive domains. This is consistent with the difference in the mathematics overall average student achievement where Private-MoE curriculum school achievement average was 31 points higher than in Public-MoE schools.
Grade 8 Mathematics Gender Differential
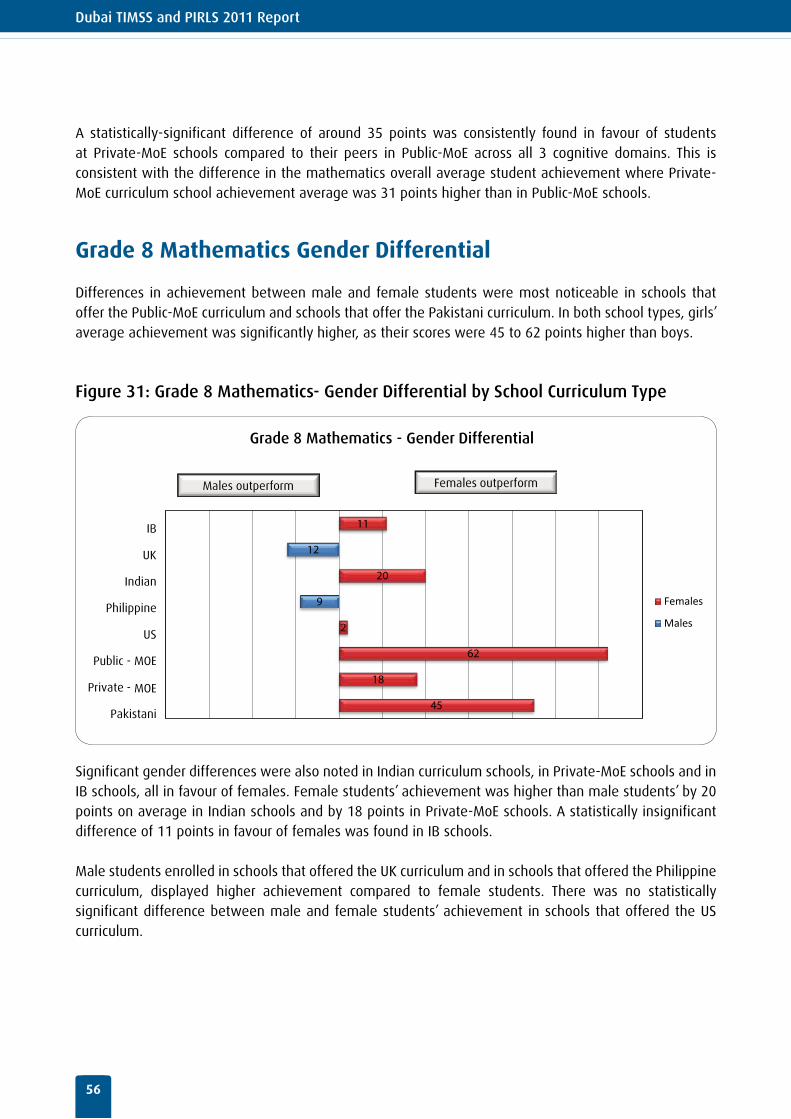
Differences in achievement between male and female students were most noticeable in schools that offer the Public-MoE curriculum and schools that offer the Pakistani curriculum. In both school types, girls’ average achievement was significantly higher, as their scores were 45 to 62 points higher than boys.
Figure 31: Grade 8 Mathematics- Gender Differential by School Curriculum Type
45
18
62
2
20
11
9
12
Grade 8 Mathematics - Gender Differential
Females
Males
IB
UK
Indian
Philippine
US
Public - MOE
MOE
Private - MOE
Pakistani
Females outperform Males outperform
Significant gender differences were also noted in Indian curriculum schools, in Private-MoE schools and in IB schools, all in favour of females. Female students’ achievement was higher than male students’ by 20 points on average in Indian schools and by 18 points in Private-MoE schools. A statistically insignificant difference of 11 points in favour of females was found in IB schools.
Male students enrolled in schools that offered the UK curriculum and in schools that offered the Philippine curriculum, displayed higher achievement compared to female students. There was no statistically significant difference between male and female students’ achievement in schools that offered the US curriculum.
57
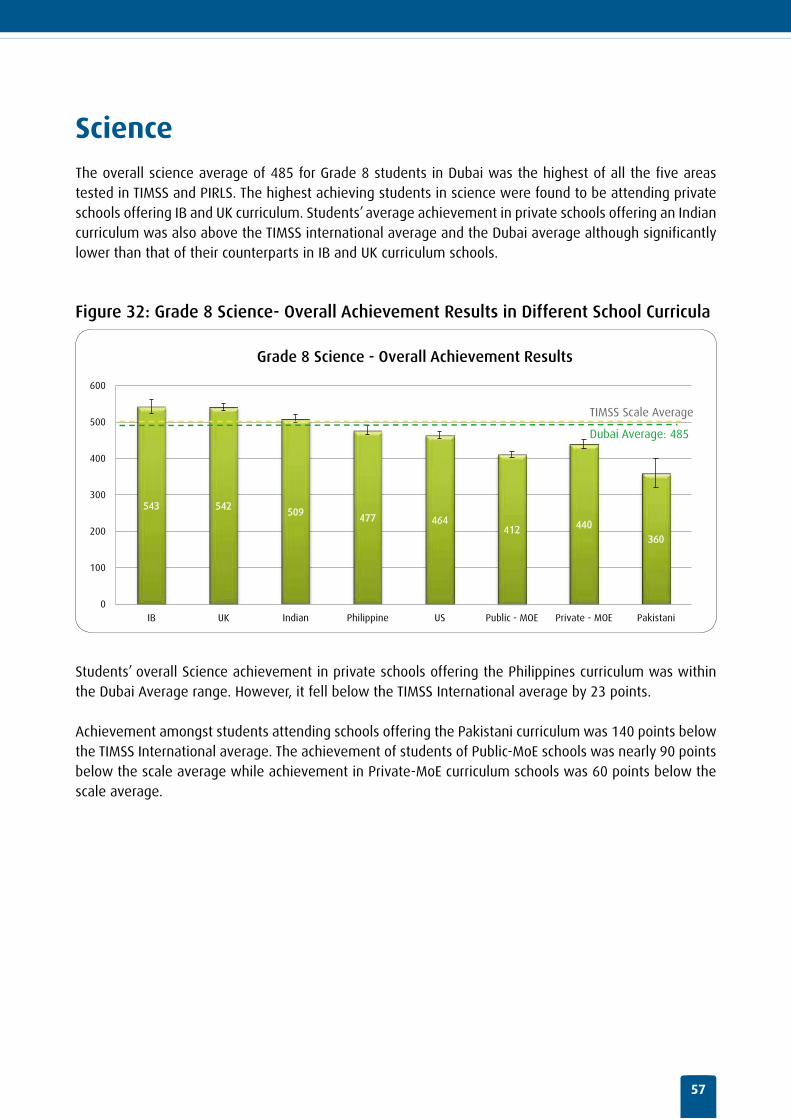
ScienceThe overall science average of 485 for Grade 8 students in Dubai was the highest of all the five areas tested in TIMSS and PIRLS. The highest achieving students in science were found to be attending private schools offering IB and UK curriculum. Students’ average achievement in private schools offering an Indian curriculum was also above the TIMSS international average and the Dubai average although significantly lower than that of their counterparts in IB and UK curriculum schools.
Figure 32: Grade 8 Science- Overall Achievement Results in Different School Curricula
543 542 509
477 464 412 440
360
0
100
200
300
400
500
600
IB UK Indian Philippine US Public - MOE Private - MOE Pakistani
Grade 8 Science - Overall Achievement Results
TIMSS Scale Average
Dubai Average: 485
Students’ overall Science achievement in private schools offering the Philippines curriculum was within the Dubai Average range. However, it fell below the TIMSS International average by 23 points.
Achievement amongst students attending schools offering the Pakistani curriculum was 140 points below the TIMSS International average. The achievement of students of Public-MoE schools was nearly 90 points below the scale average while achievement in Private-MoE curriculum schools was 60 points below the scale average.
Dubai TIMSS and PIRLS 2011 Report
58
Grade 8 Science Achievement against International Benchmarks
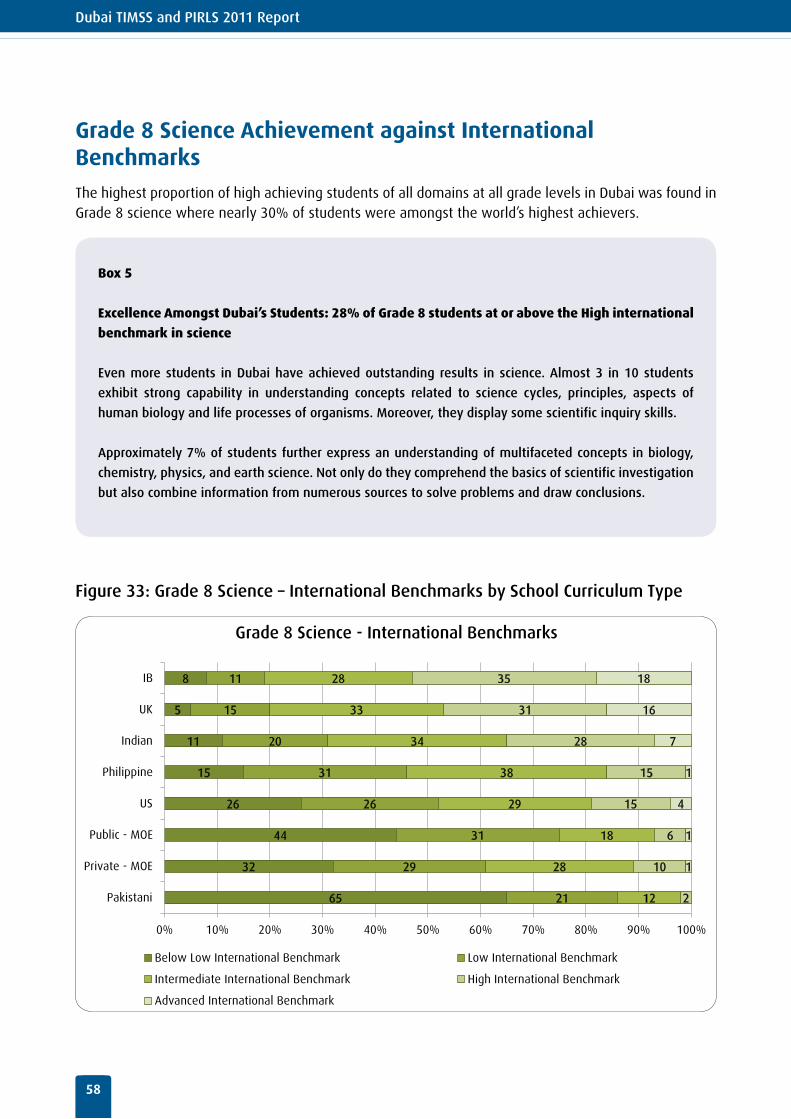
The highest proportion of high achieving students of all domains at all grade levels in Dubai was found in Grade 8 science where nearly 30% of students were amongst the world’s highest achievers.
Box 5
Excellence Amongst Dubai’s Students: 28% of Grade 8 students at or above the High international
benchmark in science
Even more students in Dubai have achieved outstanding results in science. Almost 3 in 10 students
exhibit strong capability in understanding concepts related to science cycles, principles, aspects of
human biology and life processes of organisms. Moreover, they display some scientific inquiry skills.
Approximately 7% of students further express an understanding of multifaceted concepts in biology,
chemistry, physics, and earth science. Not only do they comprehend the basics of scientific investigation
but also combine information from numerous sources to solve problems and draw conclusions.
Figure 33: Grade 8 Science – International Benchmarks by School Curriculum Type
65
32
44
26
15
11
5
8
21
29
31
26
31
20
15
11
12
28
18
29
38
34
33
28
2
10
6
15
15
28
31
35
1
1
4
1
7
16
18
0% 10% 20% 30% 40% 50% 60% 70% 80% 90% 100%
Pakistani
Private - MOE
Public - MOE
US
Philippine
Indian
UK
IB
Grade 8 Science - International Benchmarks
Below Low International Benchmark Low International Benchmark
Intermediate International Benchmark High International Benchmark
Advanced International Benchmark
59
The highest proportion of students achieving below the lowest TIMSS benchmark was found amongst those attending Pakistani schools and Public-MoE curriculum. Nearly two-thirds of students at Pakistani schools and 44% of Public-MoE curriculum schools did not reach the lowest TIMSS benchmark. The achievement of nearly 86% of students in Pakistani schools and three-quarters of students in Public-MoE curriculum schools placed them in the lowest international benchmark or below.
Over half of the students in US curriculum schools scored at or below the TIMSS Low benchmark. A quarter of students in US curriculum schools did not reach the lowest category benchmark.
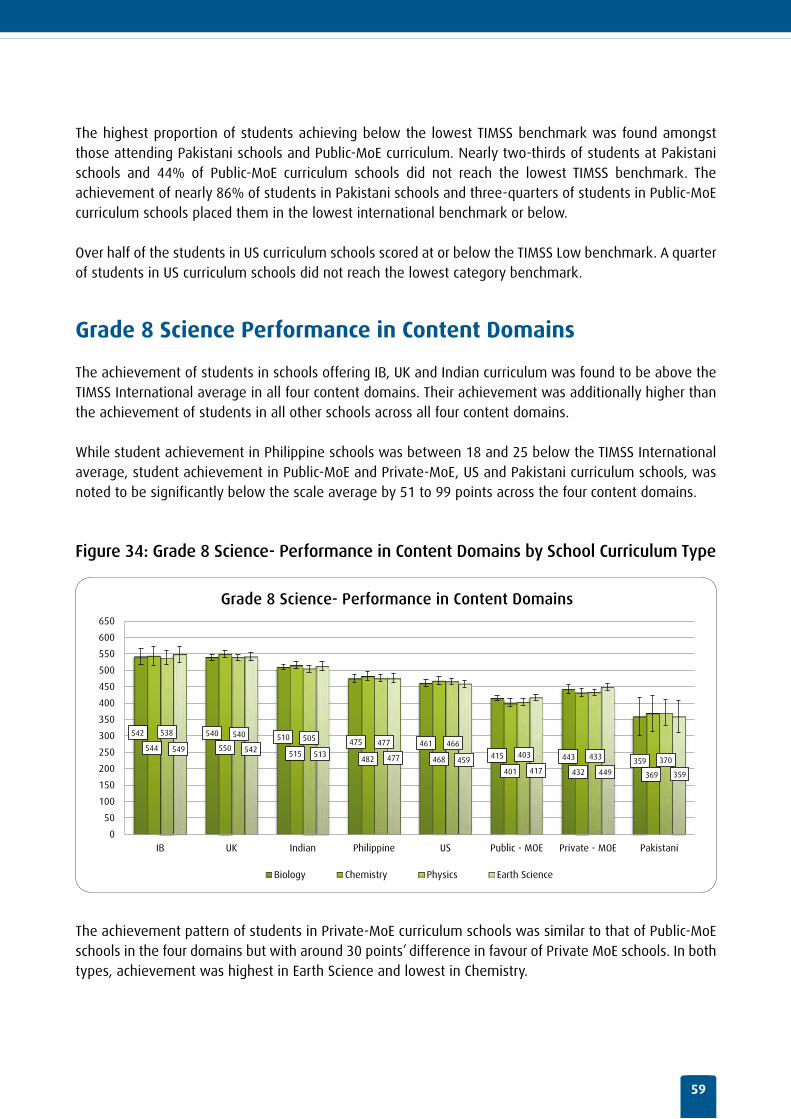
Grade 8 Science Performance in Content Domains
The achievement of students in schools offering IB, UK and Indian curriculum was found to be above the TIMSS International average in all four content domains. Their achievement was additionally higher than the achievement of students in all other schools across all four content domains.
While student achievement in Philippine schools was between 18 and 25 below the TIMSS International average, student achievement in Public-MoE and Private-MoE, US and Pakistani curriculum schools, was noted to be significantly below the scale average by 51 to 99 points across the four content domains.
Figure 34: Grade 8 Science- Performance in Content Domains by School Curriculum Type
542 540 510 475 461
415 443 359
544 550 515
482 468
401 432 369
538 540 505 477 466 403 433 370
549 542 513 477 459
417 449 359
0
50
100
150
200
250
300
350
400
450
500
550
600
650
IB UK Indian Philippine US Public - MOE Private - MOE Pakistani
Grade 8 Science- Performance in Content Domains
Biology Chemistry Physics Earth Science
The achievement pattern of students in Private-MoE curriculum schools was similar to that of Public-MoE schools in the four domains but with around 30 points’ difference in favour of Private MoE schools. In both types, achievement was highest in Earth Science and lowest in Chemistry.
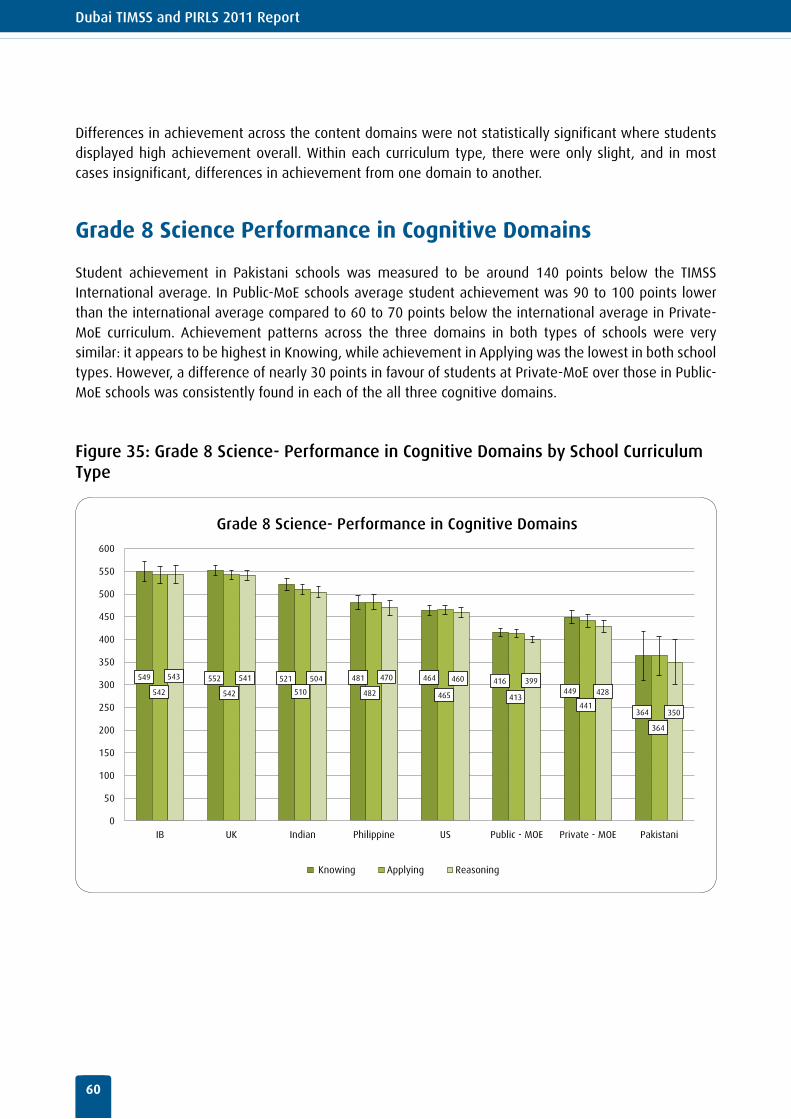
Dubai TIMSS and PIRLS 2011 Report
60
Differences in achievement across the content domains were not statistically significant where students displayed high achievement overall. Within each curriculum type, there were only slight, and in most cases insignificant, differences in achievement from one domain to another.
Grade 8 Science Performance in Cognitive Domains
Student achievement in Pakistani schools was measured to be around 140 points below the TIMSS International average. In Public-MoE schools average student achievement was 90 to 100 points lower than the international average compared to 60 to 70 points below the international average in Private-MoE curriculum. Achievement patterns across the three domains in both types of schools were very similar: it appears to be highest in Knowing, while achievement in Applying was the lowest in both school types. However, a difference of nearly 30 points in favour of students at Private-MoE over those in Public-MoE schools was consistently found in each of the all three cognitive domains.
Figure 35: Grade 8 Science- Performance in Cognitive Domains by School Curriculum Type
549 552 521 481 464 416 449
364
542 542 510 482 465 413 441
364
543 541 504 470 460 399 428
350
0
50
100
150
200
250
300
350
400
450
500
550
600
IB UK Indian Philippine US Public - MOE Private - MOE Pakistani
Grade 8 Science- Performance in Cognitive Domains
Knowing Applying Reasoning
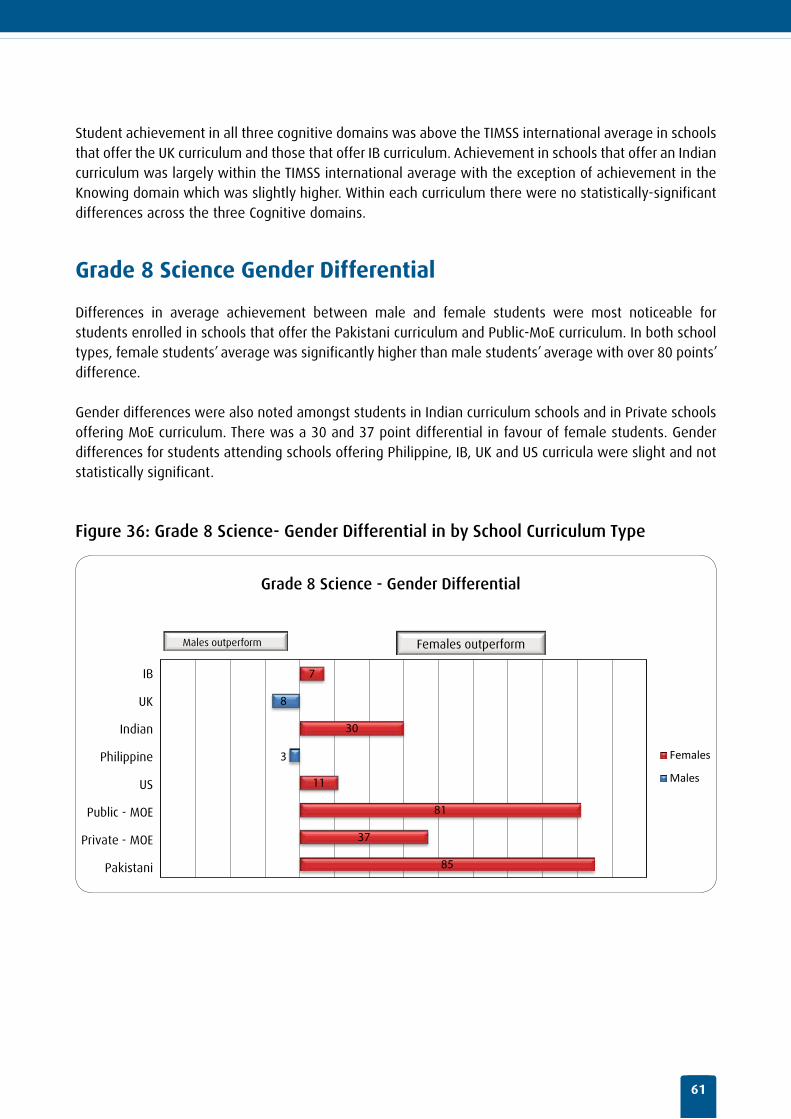
61
Student achievement in all three cognitive domains was above the TIMSS international average in schools that offer the UK curriculum and those that offer IB curriculum. Achievement in schools that offer an Indian curriculum was largely within the TIMSS international average with the exception of achievement in the Knowing domain which was slightly higher. Within each curriculum there were no statistically-significant differences across the three Cognitive domains.
Grade 8 Science Gender Differential
Differences in average achievement between male and female students were most noticeable for students enrolled in schools that offer the Pakistani curriculum and Public-MoE curriculum. In both school types, female students’ average was significantly higher than male students’ average with over 80 points’ difference.
Gender differences were also noted amongst students in Indian curriculum schools and in Private schools offering MoE curriculum. There was a 30 and 37 point differential in favour of female students. Gender differences for students attending schools offering Philippine, IB, UK and US curricula were slight and not statistically significant.
Figure 36: Grade 8 Science- Gender Differential in by School Curriculum Type
85
37
81
11
30
7
8
3
Grade 8 Science - Gender Differential
Females
Males
IB
UK
Indian
Philippine
US
Public - MOE
Private - MOE
Pakistani
Females outperform Males outperform
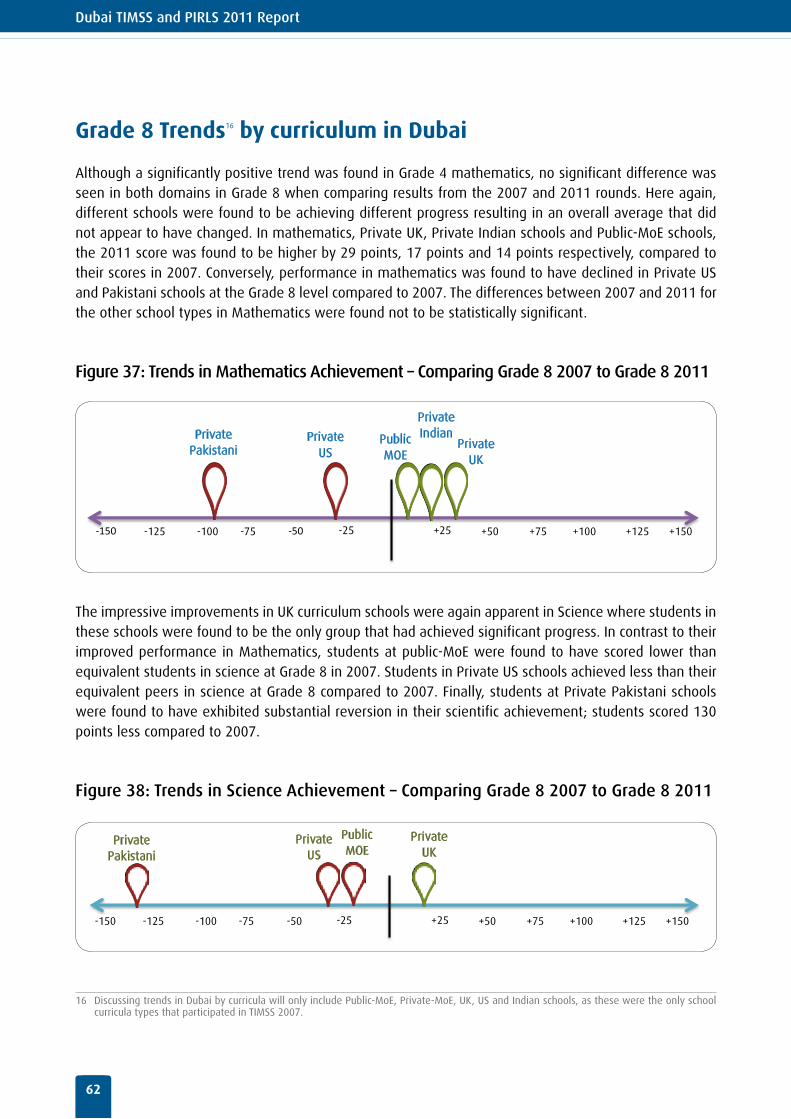
Dubai TIMSS and PIRLS 2011 Report
62
Grade 8 Trends16 by curriculum in Dubai
Although a significantly positive trend was found in Grade 4 mathematics, no significant difference was seen in both domains in Grade 8 when comparing results from the 2007 and 2011 rounds. Here again, different schools were found to be achieving different progress resulting in an overall average that did not appear to have changed. In mathematics, Private UK, Private Indian schools and Public-MoE schools, the 2011 score was found to be higher by 29 points, 17 points and 14 points respectively, compared to their scores in 2007. Conversely, performance in mathematics was found to have declined in Private US and Pakistani schools at the Grade 8 level compared to 2007. The differences between 2007 and 2011 for the other school types in Mathematics were found not to be statistically significant.
Figure 37: Trends in Mathematics Achievement – Comparing Grade 8 2007 to Grade 8 2011
-25 -50 -75 -100 -125 -150 +25 +50 +75 +100 +125 +150
Private Pakistani
Private US
Private Indian
Private UK
Public MOE
The impressive improvements in UK curriculum schools were again apparent in Science where students in these schools were found to be the only group that had achieved significant progress. In contrast to their improved performance in Mathematics, students at public-MoE were found to have scored lower than equivalent students in science at Grade 8 in 2007. Students in Private US schools achieved less than their equivalent peers in science at Grade 8 compared to 2007. Finally, students at Private Pakistani schools were found to have exhibited substantial reversion in their scientific achievement; students scored 130 points less compared to 2007.
Figure 38: Trends in Science Achievement – Comparing Grade 8 2007 to Grade 8 2011
-25 -50 -75 -100 -125 -150 +25 +50 +75 +100 +125 +150
Private UK
Private Pakistani
Private US
Public MOE
16 Discussing trends in Dubai by curricula will only include Public-MoE, Private-MoE, UK, US and Indian schools, as these were the only school curricula types that participated in TIMSS 2007.
63
44The Performanceof Emirati Studentsin TIMSS and PIRLS 2011
Dubai TIMSS and PIRLS 2011 Report
66
Emirati Students in Dubai’s SchoolsThe knowledge and skills of Emirati students is an utmost priority for KHDA as is their school experience at any type of school they attend in Dubai. Over time, an increasing proportion of Emirati students has been enrolling in private schools. Through school inspections of these schools, along with individual research studies, KHDA has been collecting data about the quality of education received by Emirati students in private schools in Dubai, in addition to the factors associated with their education. Over 2200 Emirati students were tested in Grade 4 in addition to approximately the same number in Grade 8, setting up TIMSS and PIRLS 2011 to be the largest ever globally comparable study of Emirati student performance in Dubai.
This section aims to describe the overall performance of Emirati students and their different levels of achievement across the different curricula. Although the Emirati students who sat for TIMSS and PIRLS 2011 were enrolled in almost all types of schools, the Emirati student population is concentrated in a few types of curricula, namely Ministry of Education schools (both public and private), US and UK curriculum schools. This section focusses on Emiratis attending these types of schools, a group which represents 89% of all Emirati students in Grades 4 and 93% of all Emiratis in Grade 8 who participated in TIMSS and PIRLS.
Grade 4 Knowledge and Skills
Table 4 below compares the achievement of Emirati students in Grade 4 to that of their expatriate peers in the three main school curricula where the Emirati student population is concentrated. It is worth noting that these curricula display differences in their overall averages. Within this group, expatriate and Emirati students combined at Private UK schools score the highest on average, followed by all students in Private US then their peers in Private and Public MOE schools.
The comparative results of Emirati students mirror those of their expatriate colleagues in all types of schools. In other words, Emirati students in Private UK schools achieved substantially higher than those in both types of MoE schools. The lowest student achievement average for Emiratis was found in Private-MoE curriculum schools in Mathematics and Science while Emirati students in Public-MoE schools had the lowest average achievement in reading as measured by PIRLS.
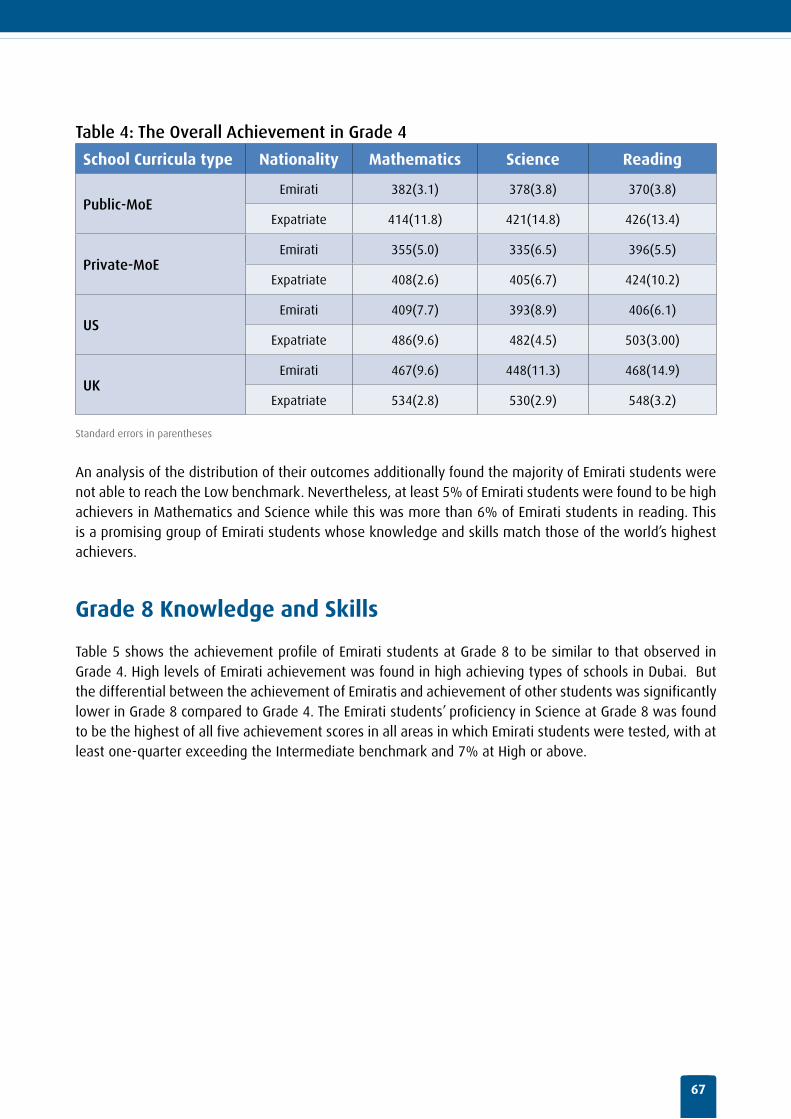
67
Table 4: The Overall Achievement in Grade 4
School Curricula type Nationality Mathematics Science Reading
Public-MoEEmirati 382(3.1) 378(3.8) 370(3.8)
Expatriate 414(11.8) 421(14.8) 426(13.4)
Private-MoEEmirati 355(5.0) 335(6.5) 396(5.5)
Expatriate 408(2.6) 405(6.7) 424(10.2)
USEmirati 409(7.7) 393(8.9) 406(6.1)
Expatriate 486(9.6) 482(4.5) 503(3.00)
UKEmirati 467(9.6) 448(11.3) 468(14.9)
Expatriate 534(2.8) 530(2.9) 548(3.2)
Standard errors in parentheses
An analysis of the distribution of their outcomes additionally found the majority of Emirati students were not able to reach the Low benchmark. Nevertheless, at least 5% of Emirati students were found to be high achievers in Mathematics and Science while this was more than 6% of Emirati students in reading. This is a promising group of Emirati students whose knowledge and skills match those of the world’s highest achievers.
Grade 8 Knowledge and Skills
Table 5 shows the achievement profile of Emirati students at Grade 8 to be similar to that observed in Grade 4. High levels of Emirati achievement was found in high achieving types of schools in Dubai. But the differential between the achievement of Emiratis and achievement of other students was significantly lower in Grade 8 compared to Grade 4. The Emirati students’ proficiency in Science at Grade 8 was found to be the highest of all five achievement scores in all areas in which Emirati students were tested, with at least one-quarter exceeding the Intermediate benchmark and 7% at High or above.
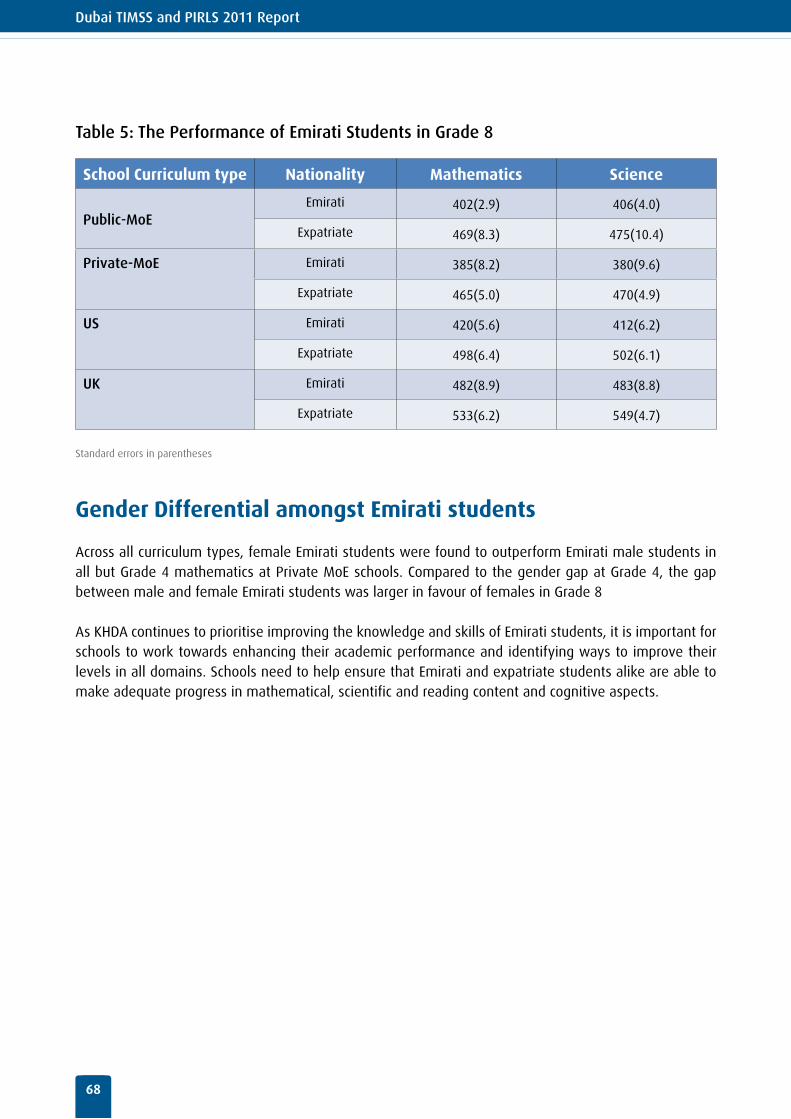
Dubai TIMSS and PIRLS 2011 Report
68
Table 5: The Performance of Emirati Students in Grade 8
School Curriculum type Nationality Mathematics Science
Public-MoEEmirati 402(2.9) 406(4.0)
Expatriate 469(8.3) 475(10.4)
Private-MoE Emirati 385(8.2) 380(9.6)
Expatriate 465(5.0) 470(4.9)
US Emirati 420(5.6) 412(6.2)
Expatriate 498(6.4) 502(6.1)
UK Emirati 482(8.9) 483(8.8)
Expatriate 533(6.2) 549(4.7)
Standard errors in parentheses
Gender Differential amongst Emirati students
Across all curriculum types, female Emirati students were found to outperform Emirati male students in all but Grade 4 mathematics at Private MoE schools. Compared to the gender gap at Grade 4, the gap between male and female Emirati students was larger in favour of females in Grade 8
As KHDA continues to prioritise improving the knowledge and skills of Emirati students, it is important for schools to work towards enhancing their academic performance and identifying ways to improve their levels in all domains. Schools need to help ensure that Emirati and expatriate students alike are able to make adequate progress in mathematical, scientific and reading content and cognitive aspects.
69
55Dubai Schools’ Inspectionsand TIMSS and PIRLS 2011
Dubai TIMSS and PIRLS 2011 Report
72
Dubai Schools’17 Inspections and TIMSS and PIRLS 2011 International assessments form one of the many sources of information KHDA collects and analyses on student performance and the quality of education received by students in Dubai. In the 2007-08 academic year, a representative sample of students from Dubai’s public and private schools sat the TIMSS 2007 assessment for the first time. In the following academic year, 2008-09, all of Dubai’s schools were inspected by the Dubai’s Schools Inspection Bureau (DSIB). Since that date, private schools in Dubai have been annually inspected against predetermined quality indicators communicated to schools in the annual inspection handbook.
Inspectors evaluate seven quality key indicators to determine judgements using a four-point scale. The four levels on the scale correspond to one of four ratings: Unsatisfactory, Acceptable, Good and Outstanding.
Judging students’ attainment
The inspection handbook makes specific reference to international assessments and international standards. Assessments results from international tests such TIMSS and PIRLS are a useful guide, indicating to inspectors student achievement in a school against international standards.
Inspectors are experienced educators, whose judgments are not determined by a single data point. As important as TIMSS and PIRLS are, they form one of the many pieces of information available to the inspector when judging student attainment.
Although a perfect correlation is not to be expected, given that schools do much more than prepare students for mathematics and science, TIMSS results appear to be closely aligned to inspectors’ ratings of school quality.
17 This section presents the findings of students in private schools only.
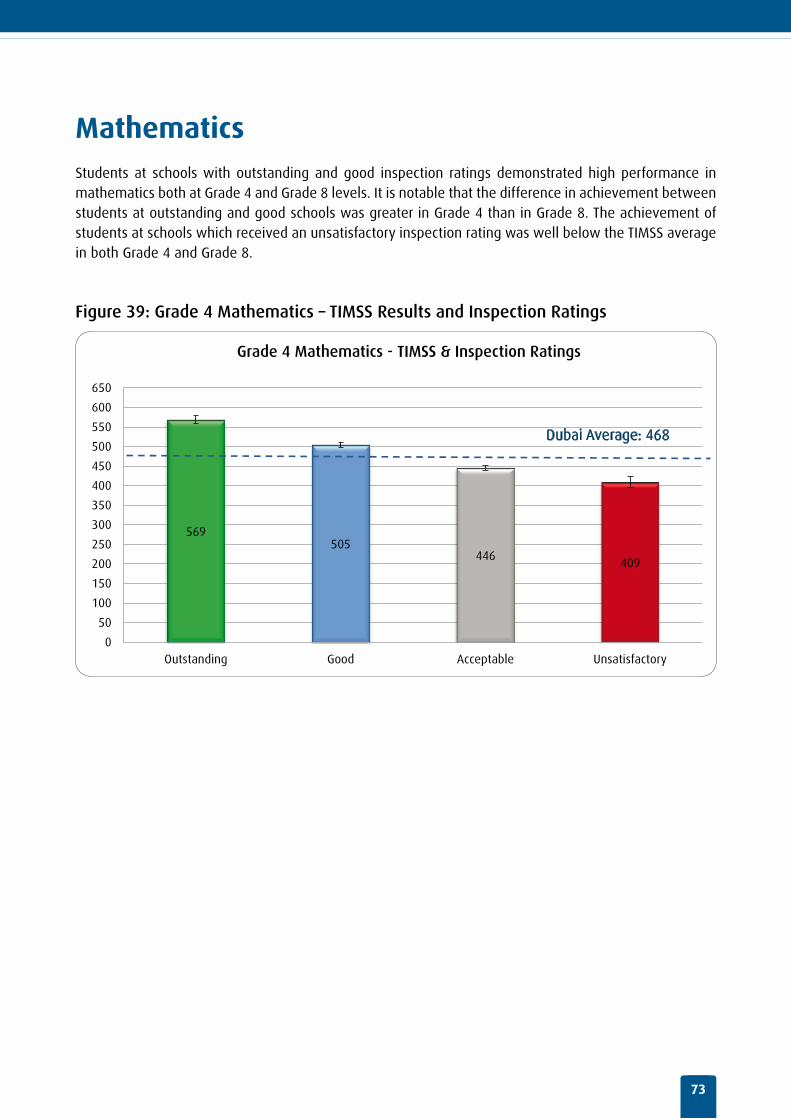
73
Mathematics Students at schools with outstanding and good inspection ratings demonstrated high performance in mathematics both at Grade 4 and Grade 8 levels. It is notable that the difference in achievement between students at outstanding and good schools was greater in Grade 4 than in Grade 8. The achievement of students at schools which received an unsatisfactory inspection rating was well below the TIMSS average in both Grade 4 and Grade 8.
Figure 39: Grade 4 Mathematics – TIMSS Results and Inspection Ratings
569 505
446 409
0
50
100
150
200
250
300
350
400
450
500
550
600
650
Outstanding Good Acceptable Unsatisfactory
Grade 4 Mathematics - TIMSS & Inspection Ratings
Dubai Average: 468
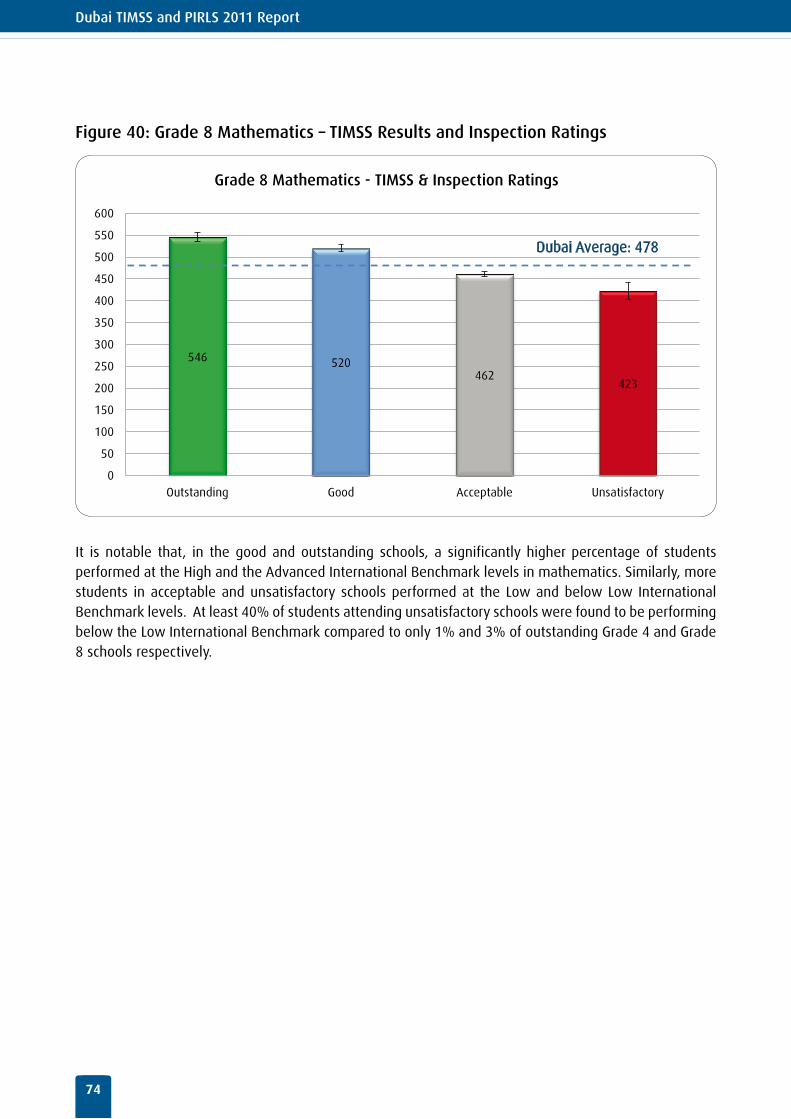
Dubai TIMSS and PIRLS 2011 Report
74
Figure 40: Grade 8 Mathematics – TIMSS Results and Inspection Ratings
546 520 462
423
0
50
100
150
200
250
300
350
400
450
500
550
600
Outstanding Good Acceptable Unsatisfactory
Grade 8 Mathematics - TIMSS & Inspection Ratings
Dubai Average: 478
It is notable that, in the good and outstanding schools, a significantly higher percentage of students performed at the High and the Advanced International Benchmark levels in mathematics. Similarly, more students in acceptable and unsatisfactory schools performed at the Low and below Low International Benchmark levels. At least 40% of students attending unsatisfactory schools were found to be performing below the Low International Benchmark compared to only 1% and 3% of outstanding Grade 4 and Grade 8 schools respectively.
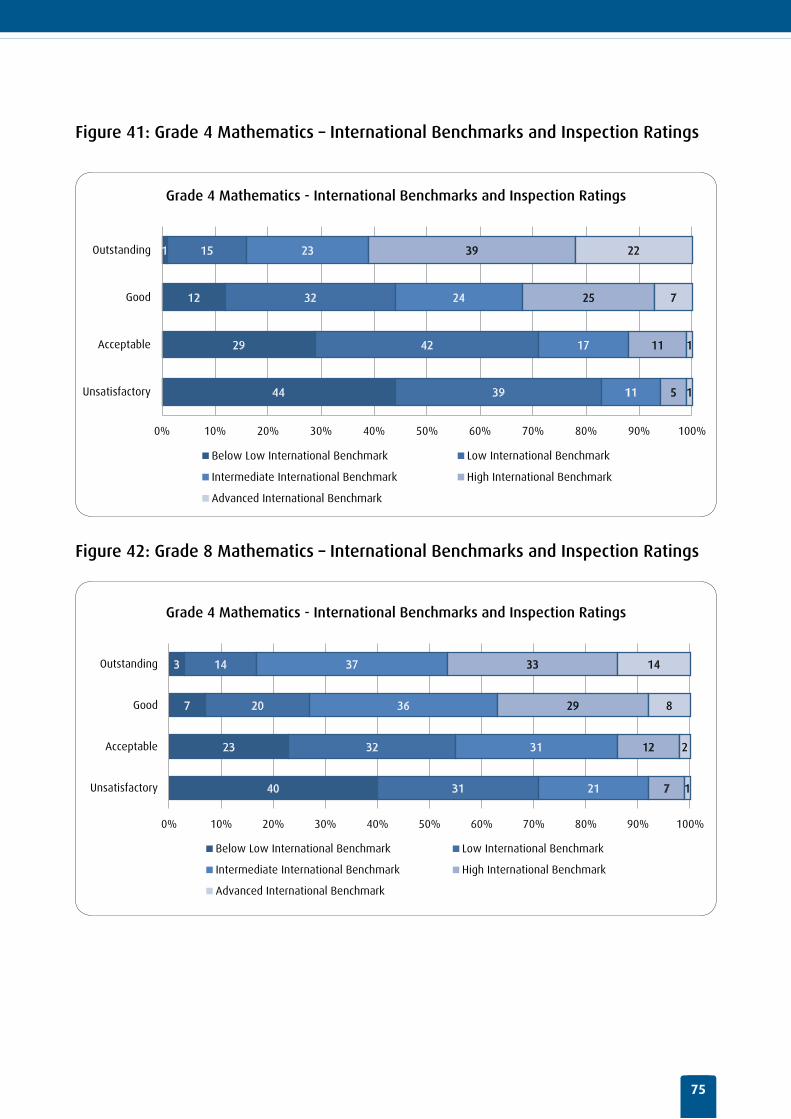
75
Figure 41: Grade 4 Mathematics – International Benchmarks and Inspection Ratings
44
29
12
1
39
42
32
15
11
17
24
23
5
11
25
39
1
1
7
22
0% 10% 20% 30% 40% 50% 60% 70% 80% 90% 100%
Unsatisfactory
Acceptable
Good
Outstanding
Grade 4 Mathematics - International Benchmarks and Inspection Ratings
Below Low International Benchmark Low International Benchmark
Intermediate International Benchmark High International Benchmark
Advanced International Benchmark
Figure 42: Grade 8 Mathematics – International Benchmarks and Inspection Ratings
40
23
7
3
31
32
20
14
21
31
36
37
7
12
29
33
1
2
8
14
0% 10% 20% 30% 40% 50% 60% 70% 80% 90% 100%
Unsatisfactory
Acceptable
Good
Outstanding
Grade 4 Mathematics - International Benchmarks and Inspection Ratings
Below Low International Benchmark Low International Benchmark
Intermediate International Benchmark High International Benchmark
Advanced International Benchmark
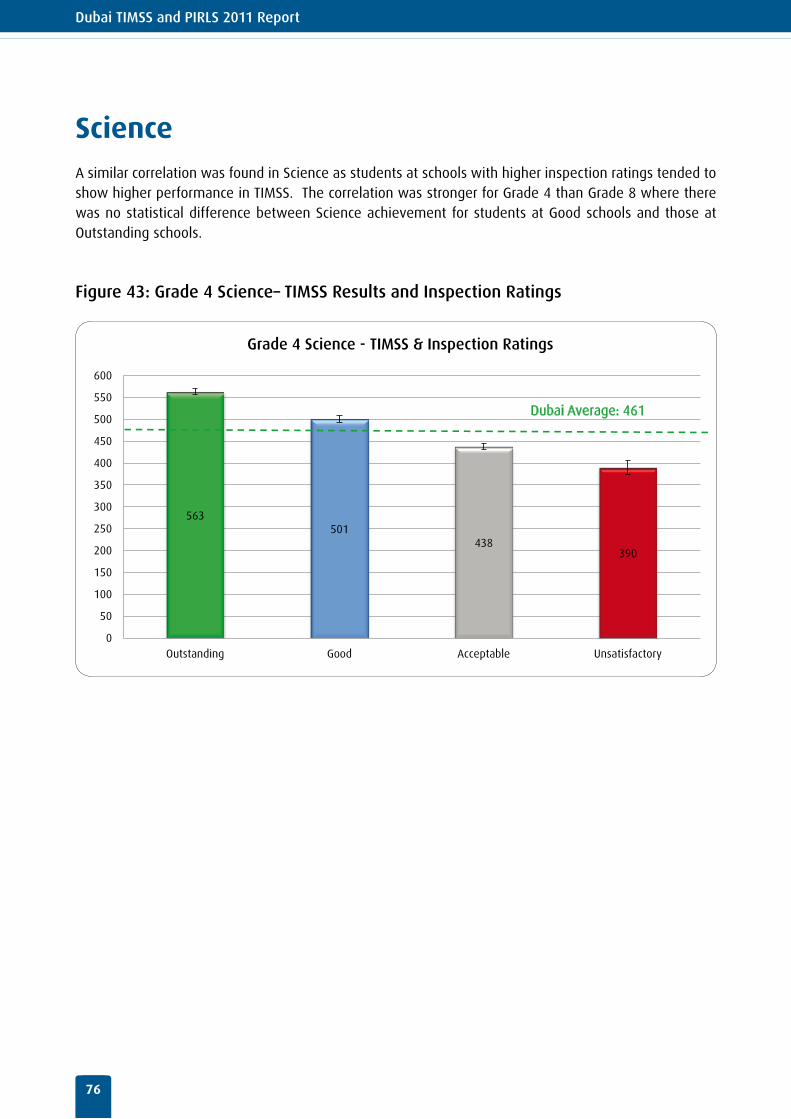
Dubai TIMSS and PIRLS 2011 Report
76
Science A similar correlation was found in Science as students at schools with higher inspection ratings tended to show higher performance in TIMSS. The correlation was stronger for Grade 4 than Grade 8 where there was no statistical difference between Science achievement for students at Good schools and those at Outstanding schools.
Figure 43: Grade 4 Science– TIMSS Results and Inspection Ratings
563 501
438 390
0
50
100
150
200
250
300
350
400
450
500
550
600
Outstanding Good Acceptable Unsatisfactory
Grade 4 Science - TIMSS & Inspection Ratings
Dubai Average: 461
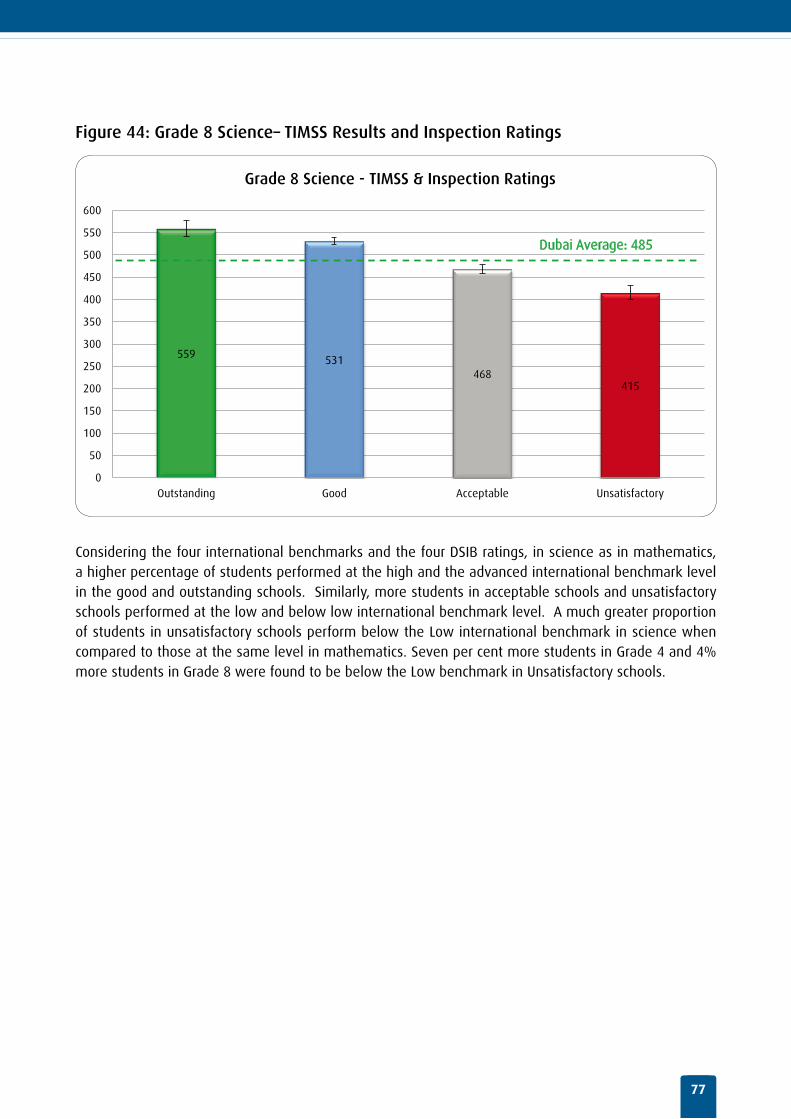
77
Figure 44: Grade 8 Science– TIMSS Results and Inspection Ratings
559 531 468
415
0
50
100
150
200
250
300
350
400
450
500
550
600
Outstanding Good Acceptable Unsatisfactory
Grade 8 Science - TIMSS & Inspection Ratings
Dubai Average: 485
Considering the four international benchmarks and the four DSIB ratings, in science as in mathematics, a higher percentage of students performed at the high and the advanced international benchmark level in the good and outstanding schools. Similarly, more students in acceptable schools and unsatisfactory schools performed at the low and below low international benchmark level. A much greater proportion of students in unsatisfactory schools perform below the Low international benchmark in science when compared to those at the same level in mathematics. Seven per cent more students in Grade 4 and 4% more students in Grade 8 were found to be below the Low benchmark in Unsatisfactory schools.
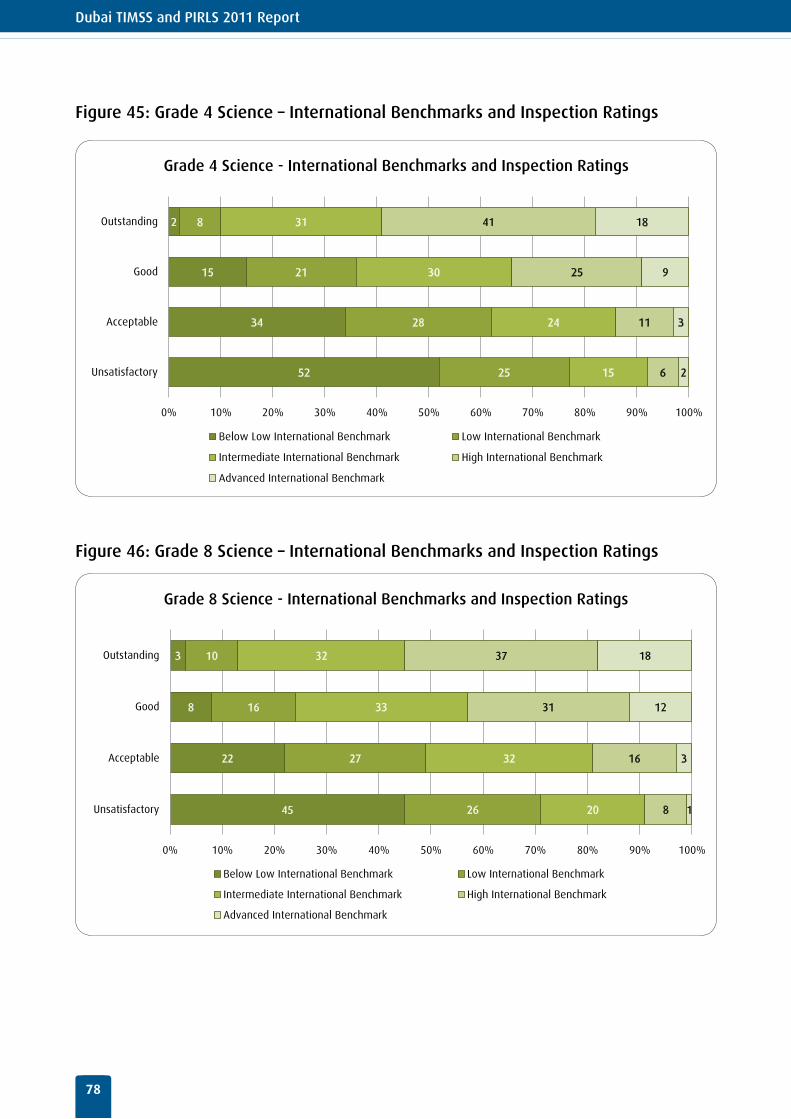
Dubai TIMSS and PIRLS 2011 Report
78
Figure 45: Grade 4 Science – International Benchmarks and Inspection Ratings
52
34
15
2
25
28
21
8
15
24
30
31
6
11
25
41
2
3
9
18
0% 10% 20% 30% 40% 50% 60% 70% 80% 90% 100%
Unsatisfactory
Acceptable
Good
Outstanding
Grade 4 Science - International Benchmarks and Inspection Ratings
Below Low International Benchmark Low International Benchmark
Intermediate International Benchmark High International Benchmark
Advanced International Benchmark
Figure 46: Grade 8 Science – International Benchmarks and Inspection Ratings
45
22
8
3
26
27
16
10
20
32
33
32
8
16
31
37
1
3
12
18
0% 10% 20% 30% 40% 50% 60% 70% 80% 90% 100%
Unsatisfactory
Acceptable
Good
Outstanding
Grade 8 Science - International Benchmarks and Inspection Ratings
Below Low International Benchmark Low International Benchmark
Intermediate International Benchmark High International Benchmark
Advanced International Benchmark
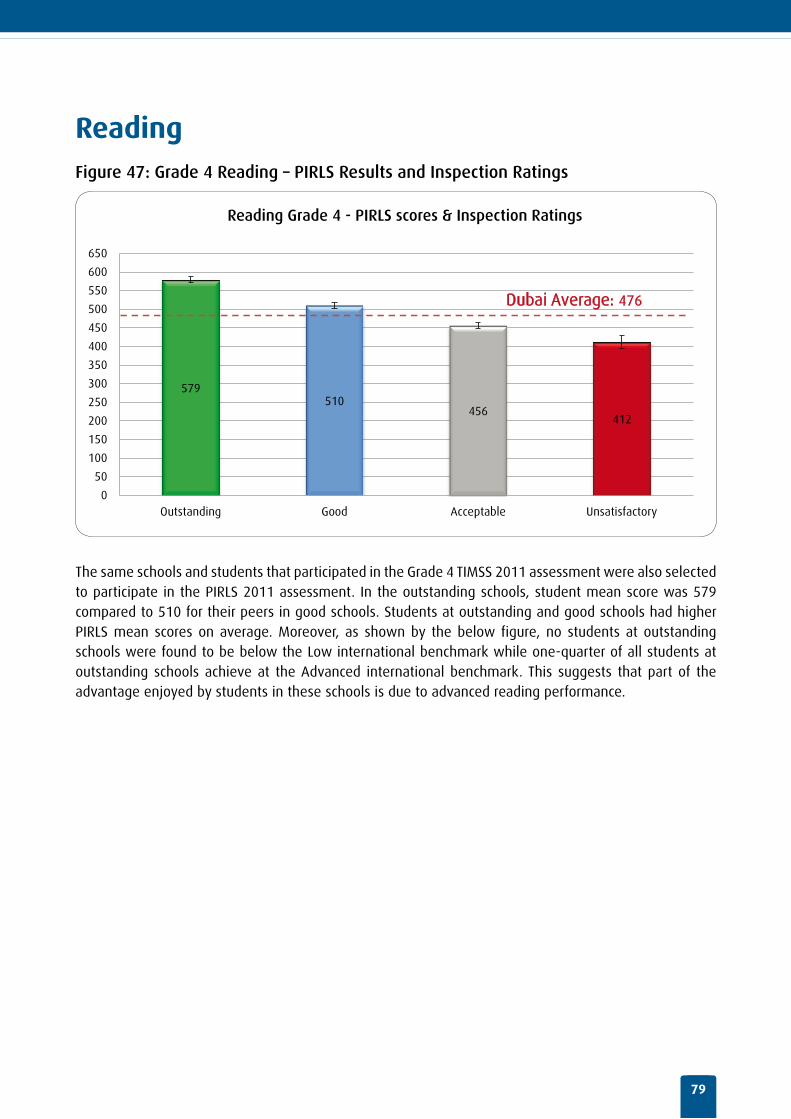
79
ReadingFigure 47: Grade 4 Reading – PIRLS Results and Inspection Ratings
579 510
456 412
0
50
100
150
200
250
300
350
400
450
500
550
600
650
Outstanding Good Acceptable Unsatisfactory
Reading Grade 4 - PIRLS scores & Inspection Ratings
Dubai Average: 476
The same schools and students that participated in the Grade 4 TIMSS 2011 assessment were also selected to participate in the PIRLS 2011 assessment. In the outstanding schools, student mean score was 579 compared to 510 for their peers in good schools. Students at outstanding and good schools had higher PIRLS mean scores on average. Moreover, as shown by the below figure, no students at outstanding schools were found to be below the Low international benchmark while one-quarter of all students at outstanding schools achieve at the Advanced international benchmark. This suggests that part of the advantage enjoyed by students in these schools is due to advanced reading performance.
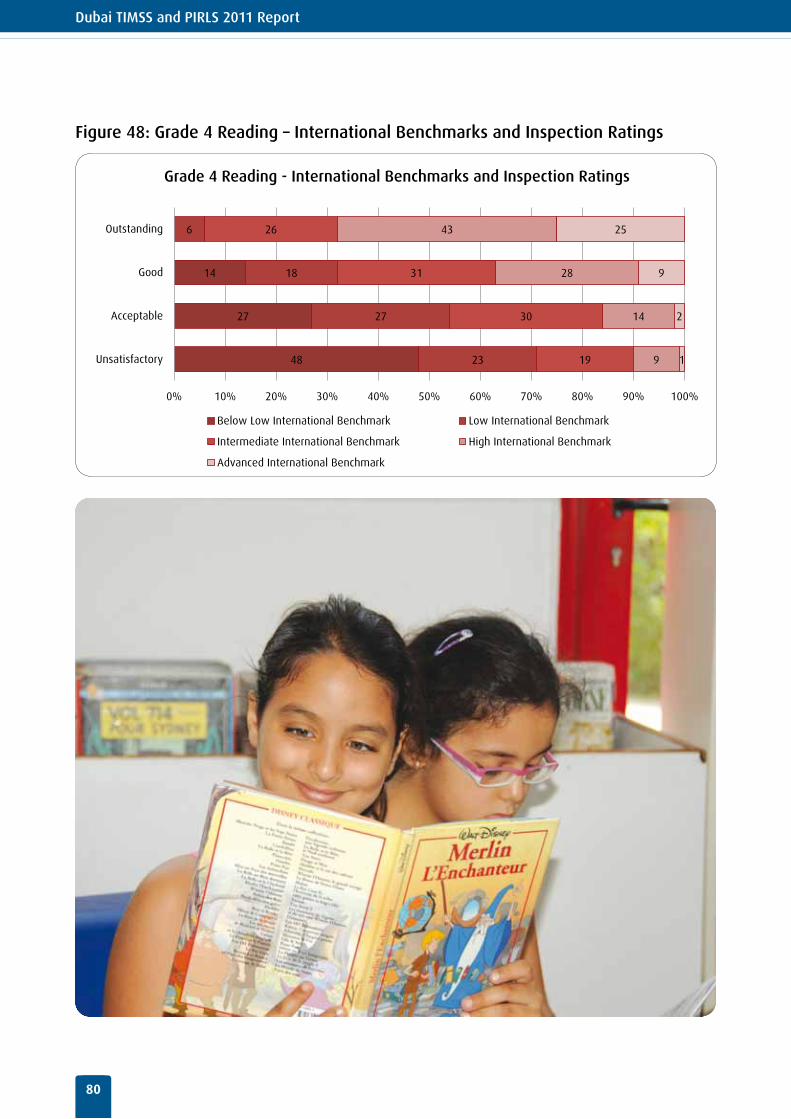
Dubai TIMSS and PIRLS 2011 Report
80
Figure 48: Grade 4 Reading – International Benchmarks and Inspection Ratings
48
27
14
23
27
18
6
19
30
31
26
9
14
28
43
1
2
9
25
0% 10% 20% 30% 40% 50% 60% 70% 80% 90% 100%
Unsatisfactory
Acceptable
Good
Outstanding
Grade 4 Reading - International Benchmarks and Inspection Ratings
Below Low International Benchmark Low International Benchmark
Intermediate International Benchmark High International Benchmark
Advanced International Benchmark
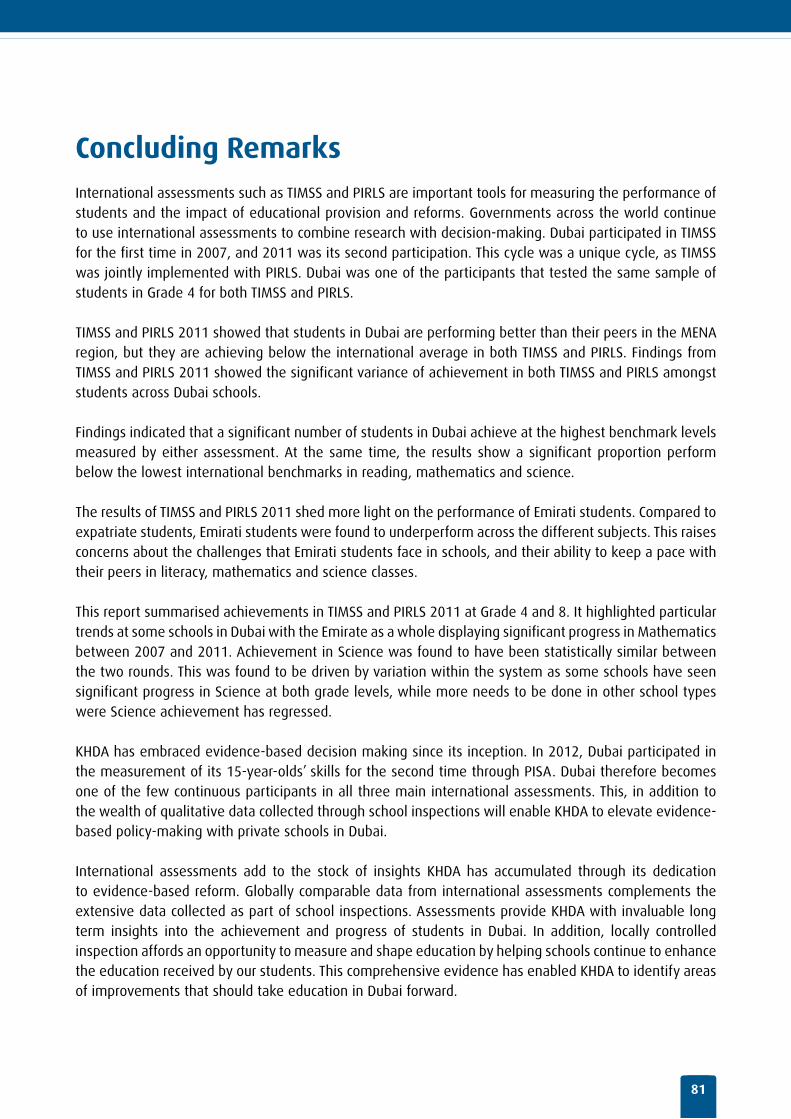
81
Concluding RemarksInternational assessments such as TIMSS and PIRLS are important tools for measuring the performance of students and the impact of educational provision and reforms. Governments across the world continue to use international assessments to combine research with decision-making. Dubai participated in TIMSS for the first time in 2007, and 2011 was its second participation. This cycle was a unique cycle, as TIMSS was jointly implemented with PIRLS. Dubai was one of the participants that tested the same sample of students in Grade 4 for both TIMSS and PIRLS.
TIMSS and PIRLS 2011 showed that students in Dubai are performing better than their peers in the MENA region, but they are achieving below the international average in both TIMSS and PIRLS. Findings from TIMSS and PIRLS 2011 showed the significant variance of achievement in both TIMSS and PIRLS amongst students across Dubai schools.
Findings indicated that a significant number of students in Dubai achieve at the highest benchmark levels measured by either assessment. At the same time, the results show a significant proportion perform below the lowest international benchmarks in reading, mathematics and science.
The results of TIMSS and PIRLS 2011 shed more light on the performance of Emirati students. Compared to expatriate students, Emirati students were found to underperform across the different subjects. This raises concerns about the challenges that Emirati students face in schools, and their ability to keep a pace with their peers in literacy, mathematics and science classes.
This report summarised achievements in TIMSS and PIRLS 2011 at Grade 4 and 8. It highlighted particular trends at some schools in Dubai with the Emirate as a whole displaying significant progress in Mathematics between 2007 and 2011. Achievement in Science was found to have been statistically similar between the two rounds. This was found to be driven by variation within the system as some schools have seen significant progress in Science at both grade levels, while more needs to be done in other school types were Science achievement has regressed.
KHDA has embraced evidence-based decision making since its inception. In 2012, Dubai participated in the measurement of its 15-year-olds’ skills for the second time through PISA. Dubai therefore becomes one of the few continuous participants in all three main international assessments. This, in addition to the wealth of qualitative data collected through school inspections will enable KHDA to elevate evidence-based policy-making with private schools in Dubai.
International assessments add to the stock of insights KHDA has accumulated through its dedication to evidence-based reform. Globally comparable data from international assessments complements the extensive data collected as part of school inspections. Assessments provide KHDA with invaluable long term insights into the achievement and progress of students in Dubai. In addition, locally controlled inspection affords an opportunity to measure and shape education by helping schools continue to enhance the education received by our students. This comprehensive evidence has enabled KHDA to identify areas of improvements that should take education in Dubai forward.
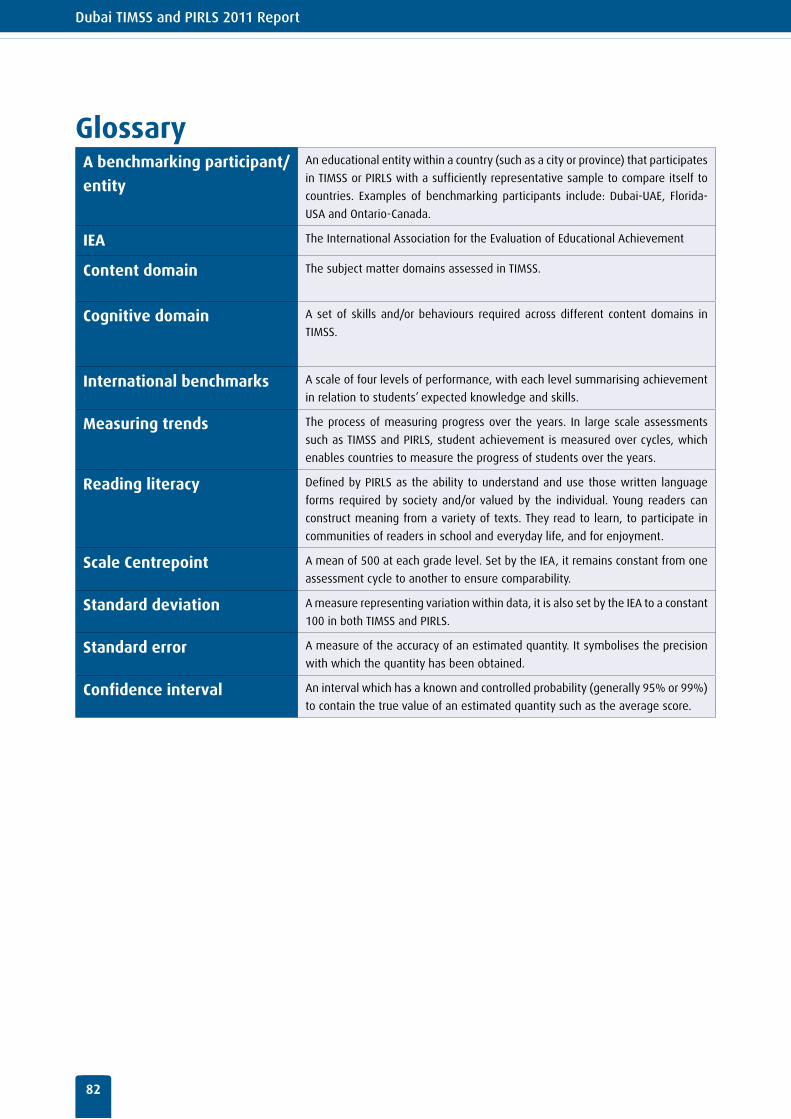
Dubai TIMSS and PIRLS 2011 Report
82
GlossaryA benchmarking participant/
entity
An educational entity within a country (such as a city or province) that participates
in TIMSS or PIRLS with a sufficiently representative sample to compare itself to
countries. Examples of benchmarking participants include: Dubai-UAE, Florida-
USA and Ontario-Canada.
IEA The International Association for the Evaluation of Educational Achievement
Content domain The subject matter domains assessed in TIMSS.
Cognitive domain A set of skills and/or behaviours required across different content domains in
TIMSS.
International benchmarks A scale of four levels of performance, with each level summarising achievement
in relation to students’ expected knowledge and skills.
Measuring trends The process of measuring progress over the years. In large scale assessments
such as TIMSS and PIRLS, student achievement is measured over cycles, which
enables countries to measure the progress of students over the years.
Reading literacy Defined by PIRLS as the ability to understand and use those written language
forms required by society and/or valued by the individual. Young readers can
construct meaning from a variety of texts. They read to learn, to participate in
communities of readers in school and everyday life, and for enjoyment.
Scale Centrepoint A mean of 500 at each grade level. Set by the IEA, it remains constant from one
assessment cycle to another to ensure comparability.
Standard deviation A measure representing variation within data, it is also set by the IEA to a constant
100 in both TIMSS and PIRLS.
Standard error A measure of the accuracy of an estimated quantity. It symbolises the precision
with which the quantity has been obtained.
Confidence interval An interval which has a known and controlled probability (generally 95% or 99%)
to contain the true value of an estimated quantity such as the average score.
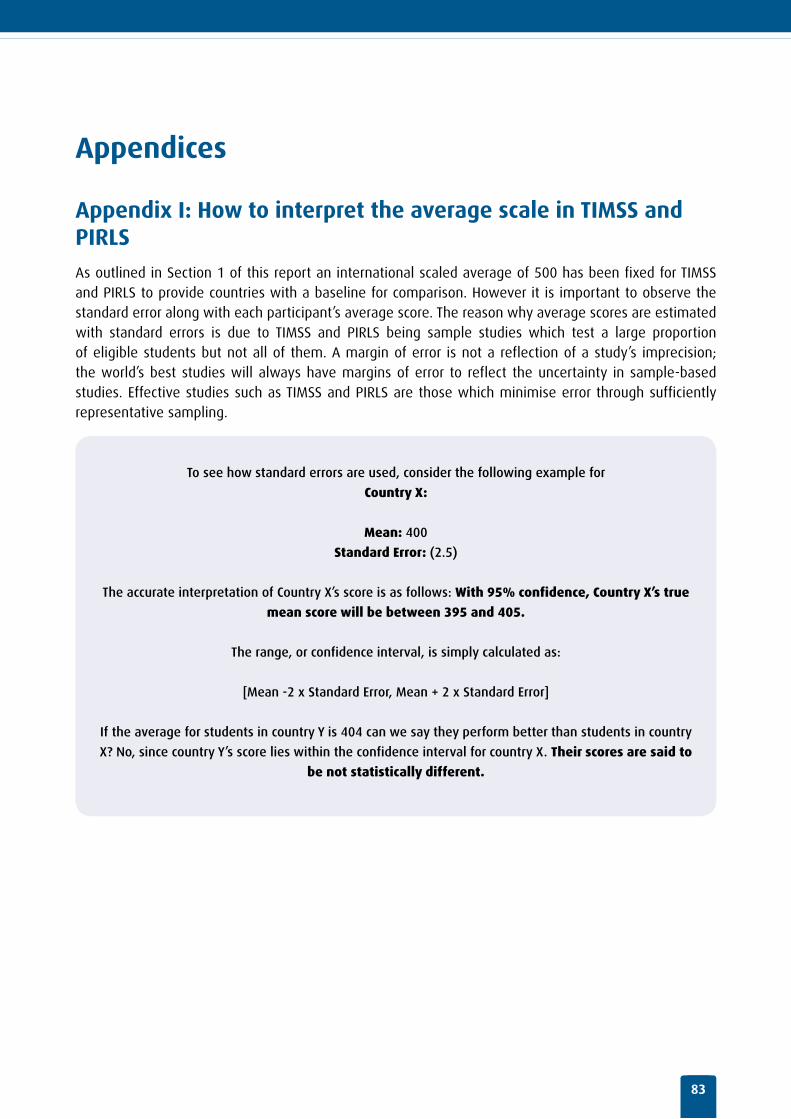
83
Appendices
Appendix I: How to interpret the average scale in TIMSS and PIRLS
As outlined in Section 1 of this report an international scaled average of 500 has been fixed for TIMSS and PIRLS to provide countries with a baseline for comparison. However it is important to observe the standard error along with each participant’s average score. The reason why average scores are estimated with standard errors is due to TIMSS and PIRLS being sample studies which test a large proportion of eligible students but not all of them. A margin of error is not a reflection of a study’s imprecision; the world’s best studies will always have margins of error to reflect the uncertainty in sample-based studies. Effective studies such as TIMSS and PIRLS are those which minimise error through sufficiently representative sampling.
To see how standard errors are used, consider the following example for
Country X:
Mean: 400
Standard Error: (2.5)
The accurate interpretation of Country X’s score is as follows: With 95% confidence, Country X’s true
mean score will be between 395 and 405.
The range, or confidence interval, is simply calculated as:
[Mean -2 x Standard Error, Mean + 2 x Standard Error]
If the average for students in country Y is 404 can we say they perform better than students in country
X? No, since country Y’s score lies within the confidence interval for country X. Their scores are said to
be not statistically different.

Dubai TIMSS and PIRLS 2011 Report
84
Accurately interpreting differences in averages:
Similar to average scores, the difference between two averages will also contain statistical error.
In order to identify whether the difference between two groups is significant, we compare the confidence interval to the value of zero. If the confidence interval is above zero then it can be said that the difference is statistically significant with 95% confidence.
Appendix II: TIMSS International BenchmarkGrade 4- Mathematics
Advanced International Benchmark- 625
Students can apply their understanding and knowledge in a variety of relatively complex situations and explain
their reasoning. They can solve a variety of multi-step word problems involving whole numbers including pro-
portions. Students at this level show an increasing understanding of fractions and decimals. Students can apply
geometric knowledge of a range of two- and three-dimensional shapes in a variety of situations. They can
draw a conclusion from data in a table and justify their conclusion.
High International Benchmark- 550
Students can apply their knowledge and understanding to solve problems. Students can solve word problems
involving operations with whole numbers. They can use division in a variety of problem situations. They can
use their understanding of place value to solve problems. Students can extend patterns to find a later specified
term. Students demonstrate understanding of line symmetry and geometric properties. Students can interpret
and use data in tables and graphs to solve problems. They can use information in pictographs and tally charts
to complete bar graphs.
Intermediate International Benchmark- 475
Students can apply basic mathematical knowledge in straightforward situations. Students at this level demon-
strate an understanding of whole numbers and some understanding of fractions. Students can visualize three-
dimensional shapes from two-dimensional representations. They can interpret bar graphs, pictographs, and
tables to solve simple problems.
Low International Benchmark-400
Students have some basic mathematical knowledge. Students can add and subtract whole numbers. They have
some recognition of parallel and perpendicular lines, familiar geometric shapes, and coordinate maps. They can
read and complete simple bar graphs and tables.
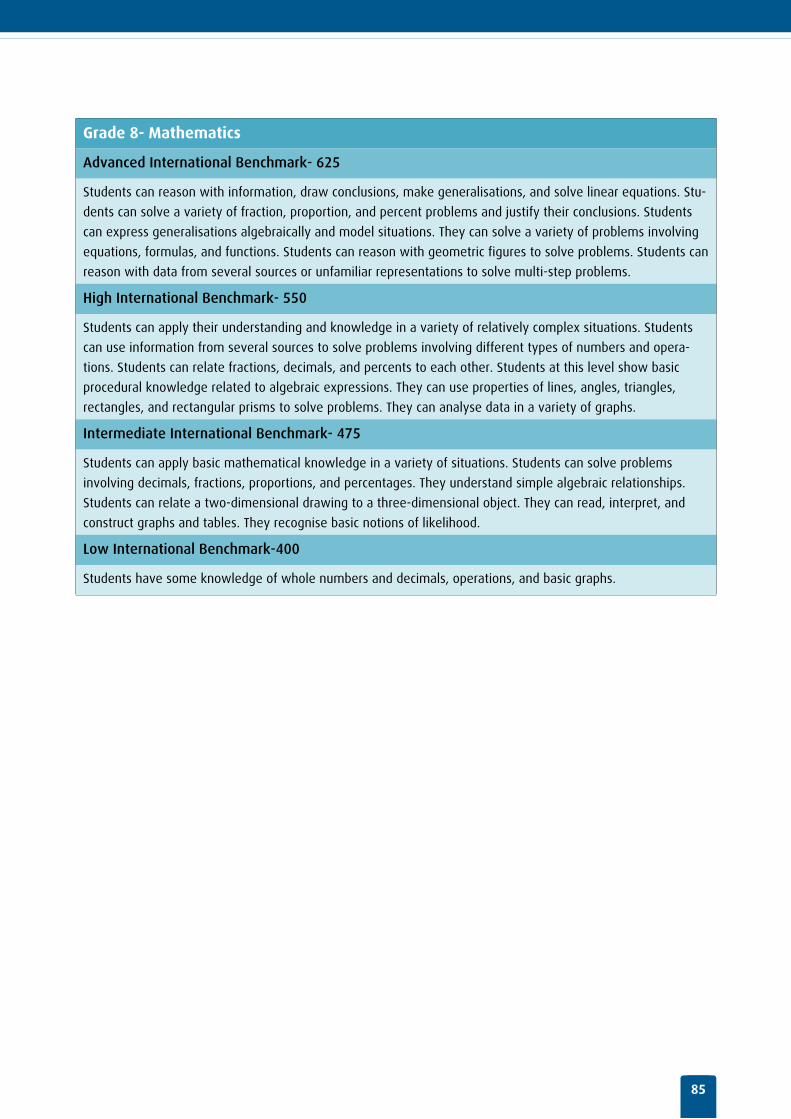
85
Grade 8- Mathematics
Advanced International Benchmark- 625
Students can reason with information, draw conclusions, make generalisations, and solve linear equations. Stu-
dents can solve a variety of fraction, proportion, and percent problems and justify their conclusions. Students
can express generalisations algebraically and model situations. They can solve a variety of problems involving
equations, formulas, and functions. Students can reason with geometric figures to solve problems. Students can
reason with data from several sources or unfamiliar representations to solve multi-step problems.
High International Benchmark- 550
Students can apply their understanding and knowledge in a variety of relatively complex situations. Students
can use information from several sources to solve problems involving different types of numbers and opera-
tions. Students can relate fractions, decimals, and percents to each other. Students at this level show basic
procedural knowledge related to algebraic expressions. They can use properties of lines, angles, triangles,
rectangles, and rectangular prisms to solve problems. They can analyse data in a variety of graphs.
Intermediate International Benchmark- 475
Students can apply basic mathematical knowledge in a variety of situations. Students can solve problems
involving decimals, fractions, proportions, and percentages. They understand simple algebraic relationships.
Students can relate a two-dimensional drawing to a three-dimensional object. They can read, interpret, and
construct graphs and tables. They recognise basic notions of likelihood.
Low International Benchmark-400
Students have some knowledge of whole numbers and decimals, operations, and basic graphs.
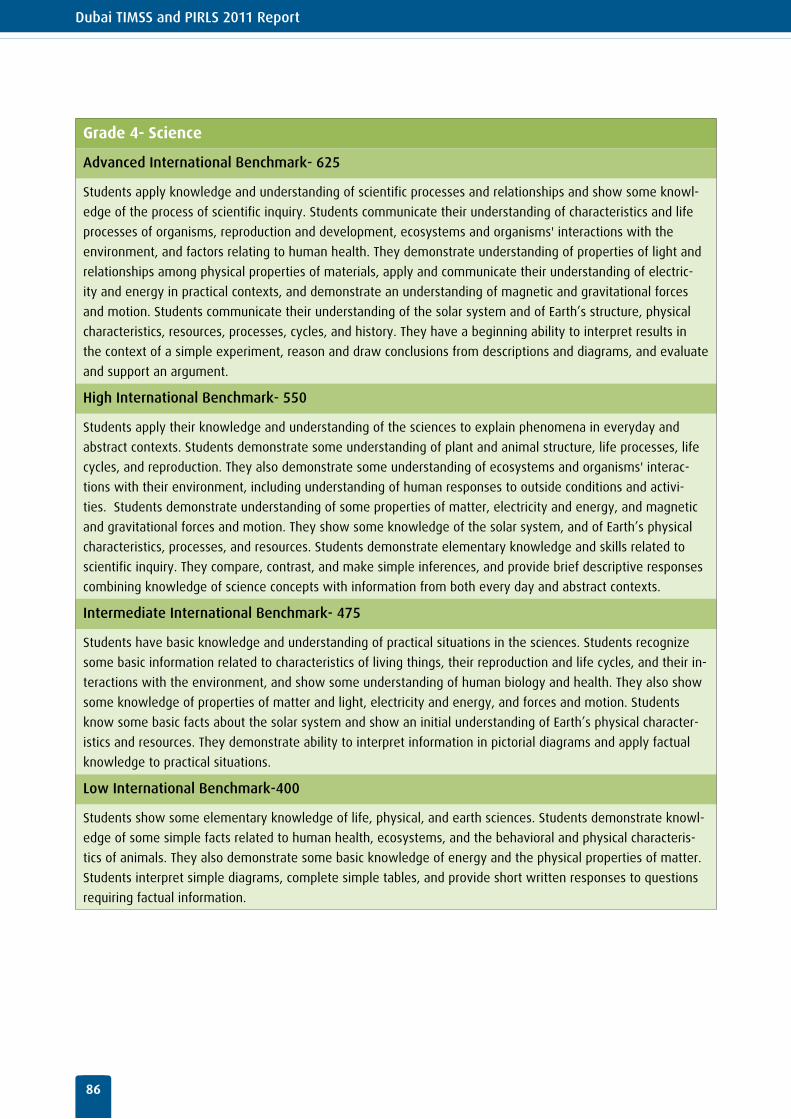
Dubai TIMSS and PIRLS 2011 Report
86
Grade 4- Science
Advanced International Benchmark- 625
Students apply knowledge and understanding of scientific processes and relationships and show some knowl-
edge of the process of scientific inquiry. Students communicate their understanding of characteristics and life
processes of organisms, reproduction and development, ecosystems and organisms' interactions with the
environment, and factors relating to human health. They demonstrate understanding of properties of light and
relationships among physical properties of materials, apply and communicate their understanding of electric-
ity and energy in practical contexts, and demonstrate an understanding of magnetic and gravitational forces
and motion. Students communicate their understanding of the solar system and of Earth’s structure, physical
characteristics, resources, processes, cycles, and history. They have a beginning ability to interpret results in
the context of a simple experiment, reason and draw conclusions from descriptions and diagrams, and evaluate
and support an argument.
High International Benchmark- 550
Students apply their knowledge and understanding of the sciences to explain phenomena in everyday and
abstract contexts. Students demonstrate some understanding of plant and animal structure, life processes, life
cycles, and reproduction. They also demonstrate some understanding of ecosystems and organisms' interac-
tions with their environment, including understanding of human responses to outside conditions and activi-
ties. Students demonstrate understanding of some properties of matter, electricity and energy, and magnetic
and gravitational forces and motion. They show some knowledge of the solar system, and of Earth’s physical
characteristics, processes, and resources. Students demonstrate elementary knowledge and skills related to
scientific inquiry. They compare, contrast, and make simple inferences, and provide brief descriptive responses
combining knowledge of science concepts with information from both every day and abstract contexts.
Intermediate International Benchmark- 475
Students have basic knowledge and understanding of practical situations in the sciences. Students recognize
some basic information related to characteristics of living things, their reproduction and life cycles, and their in-
teractions with the environment, and show some understanding of human biology and health. They also show
some knowledge of properties of matter and light, electricity and energy, and forces and motion. Students
know some basic facts about the solar system and show an initial understanding of Earth’s physical character-
istics and resources. They demonstrate ability to interpret information in pictorial diagrams and apply factual
knowledge to practical situations.
Low International Benchmark-400
Students show some elementary knowledge of life, physical, and earth sciences. Students demonstrate knowl-
edge of some simple facts related to human health, ecosystems, and the behavioral and physical characteris-
tics of animals. They also demonstrate some basic knowledge of energy and the physical properties of matter.
Students interpret simple diagrams, complete simple tables, and provide short written responses to questions
requiring factual information.
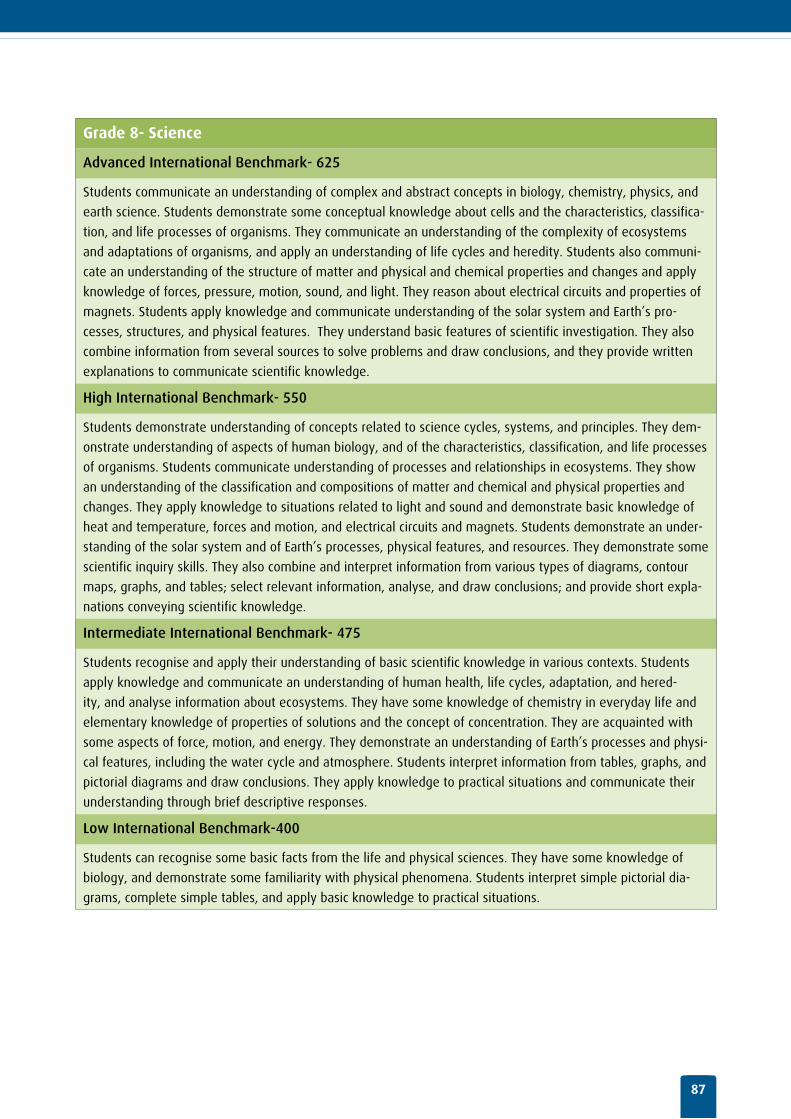
87
Grade 8- Science
Advanced International Benchmark- 625
Students communicate an understanding of complex and abstract concepts in biology, chemistry, physics, and
earth science. Students demonstrate some conceptual knowledge about cells and the characteristics, classifica-
tion, and life processes of organisms. They communicate an understanding of the complexity of ecosystems
and adaptations of organisms, and apply an understanding of life cycles and heredity. Students also communi-
cate an understanding of the structure of matter and physical and chemical properties and changes and apply
knowledge of forces, pressure, motion, sound, and light. They reason about electrical circuits and properties of
magnets. Students apply knowledge and communicate understanding of the solar system and Earth’s pro-
cesses, structures, and physical features. They understand basic features of scientific investigation. They also
combine information from several sources to solve problems and draw conclusions, and they provide written
explanations to communicate scientific knowledge.
High International Benchmark- 550
Students demonstrate understanding of concepts related to science cycles, systems, and principles. They dem-
onstrate understanding of aspects of human biology, and of the characteristics, classification, and life processes
of organisms. Students communicate understanding of processes and relationships in ecosystems. They show
an understanding of the classification and compositions of matter and chemical and physical properties and
changes. They apply knowledge to situations related to light and sound and demonstrate basic knowledge of
heat and temperature, forces and motion, and electrical circuits and magnets. Students demonstrate an under-
standing of the solar system and of Earth’s processes, physical features, and resources. They demonstrate some
scientific inquiry skills. They also combine and interpret information from various types of diagrams, contour
maps, graphs, and tables; select relevant information, analyse, and draw conclusions; and provide short expla-
nations conveying scientific knowledge.
Intermediate International Benchmark- 475
Students recognise and apply their understanding of basic scientific knowledge in various contexts. Students
apply knowledge and communicate an understanding of human health, life cycles, adaptation, and hered-
ity, and analyse information about ecosystems. They have some knowledge of chemistry in everyday life and
elementary knowledge of properties of solutions and the concept of concentration. They are acquainted with
some aspects of force, motion, and energy. They demonstrate an understanding of Earth’s processes and physi-
cal features, including the water cycle and atmosphere. Students interpret information from tables, graphs, and
pictorial diagrams and draw conclusions. They apply knowledge to practical situations and communicate their
understanding through brief descriptive responses.
Low International Benchmark-400
Students can recognise some basic facts from the life and physical sciences. They have some knowledge of
biology, and demonstrate some familiarity with physical phenomena. Students interpret simple pictorial dia-
grams, complete simple tables, and apply basic knowledge to practical situations.
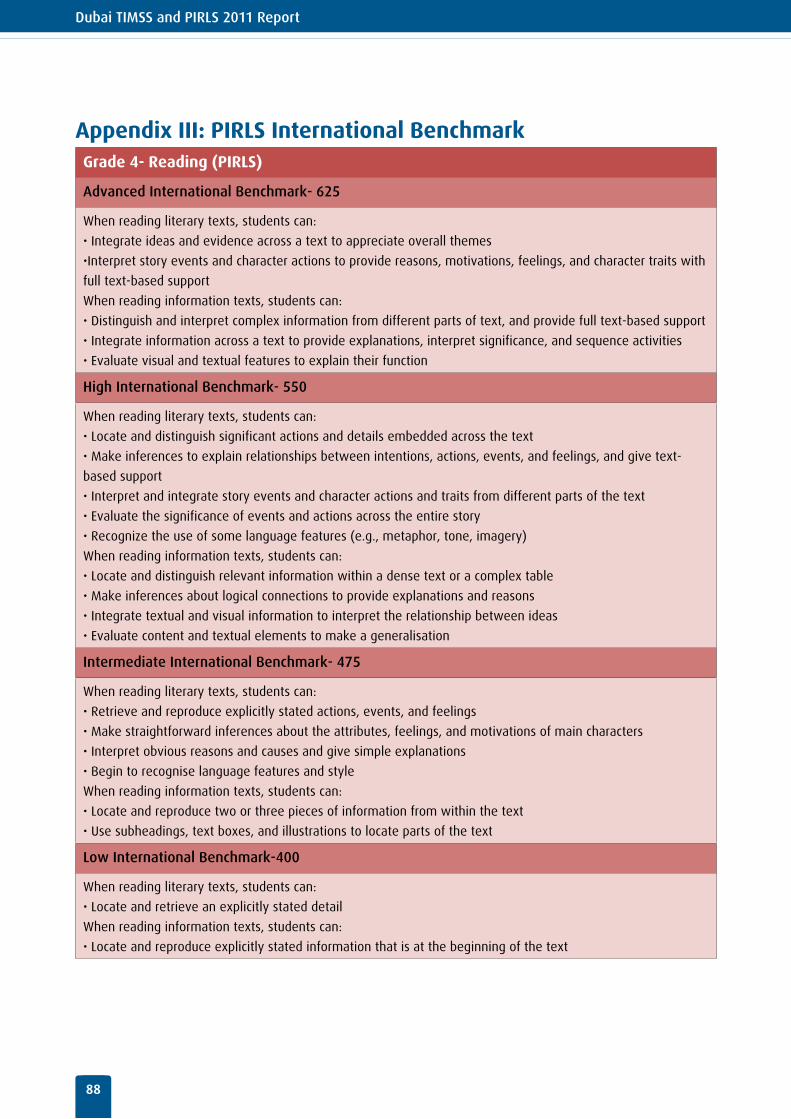
Dubai TIMSS and PIRLS 2011 Report
88
Appendix III: PIRLS International BenchmarkGrade 4- Reading (PIRLS)
Advanced International Benchmark- 625
When reading literary texts, students can:
• Integrate ideas and evidence across a text to appreciate overall themes
•Interpret story events and character actions to provide reasons, motivations, feelings, and character traits with
full text-based support
When reading information texts, students can:
• Distinguish and interpret complex information from different parts of text, and provide full text-based support
• Integrate information across a text to provide explanations, interpret significance, and sequence activities
• Evaluate visual and textual features to explain their function
High International Benchmark- 550
When reading literary texts, students can:
• Locate and distinguish significant actions and details embedded across the text
• Make inferences to explain relationships between intentions, actions, events, and feelings, and give text-
based support
• Interpret and integrate story events and character actions and traits from different parts of the text
• Evaluate the significance of events and actions across the entire story
• Recognize the use of some language features (e.g., metaphor, tone, imagery)
When reading information texts, students can:
• Locate and distinguish relevant information within a dense text or a complex table
• Make inferences about logical connections to provide explanations and reasons
• Integrate textual and visual information to interpret the relationship between ideas
• Evaluate content and textual elements to make a generalisation
Intermediate International Benchmark- 475
When reading literary texts, students can:
• Retrieve and reproduce explicitly stated actions, events, and feelings
• Make straightforward inferences about the attributes, feelings, and motivations of main characters
• Interpret obvious reasons and causes and give simple explanations
• Begin to recognise language features and style
When reading information texts, students can:
• Locate and reproduce two or three pieces of information from within the text
• Use subheadings, text boxes, and illustrations to locate parts of the text
Low International Benchmark-400
When reading literary texts, students can:
• Locate and retrieve an explicitly stated detail
When reading information texts, students can:
• Locate and reproduce explicitly stated information that is at the beginning of the text