
Dual Maximum VAV Box Controls -...
44
Dual Maximum VAV Box Controls Steven T. Taylor, PE FASHRAE Taylor Engineering LLC staylor@taylor‐engineering.com ASHRAE Golden Gate Chapter November 13, 2014
-
Upload
truongduong -
Category
Documents
-
view
226 -
download
0
Transcript of Dual Maximum VAV Box Controls -...
Dual Maximum VAV Box Controls
Steven T. Taylor, PE FASHRAETaylor Engineering LLCstaylor@taylor‐engineering.com
ASHRAE Golden Gate ChapterNovember 13, 2014
Agenda
VAV Box basics• Sizing VAV Boxes• How low can you go?
VAV Box control logic• Conventional VAV box control logic• “Dual Maximum” control logic• Non-complying dual maximum control logic• Determining setpoints
How well does “Dual Maximum” logic work?• ASHRAE RP-1515 Results
VAV Box Sizing
Oversized box• Less pressure drop• Less noise• Higher box min → more reheat, higher fan energy• Cost more
Undersized box• Higher pressure drop• More noise• Lower box min → less reheat, lower fan energy

VAV Box Sizing: LCC Analysis
Compared ∆TP from 0.3” to 0.8” Low rise office building Sensitivity Analysis
• Climate• Loads• operating schedules• Utility rates• Load calc’ (aggressive, conservative)• 8 bit versus 10 bit A/D converter• SAT (50°F-60°F), SAT reset, SP reset
RESULT: Size VAV Boxes for ~0.5” ∆TP
VPSPTP
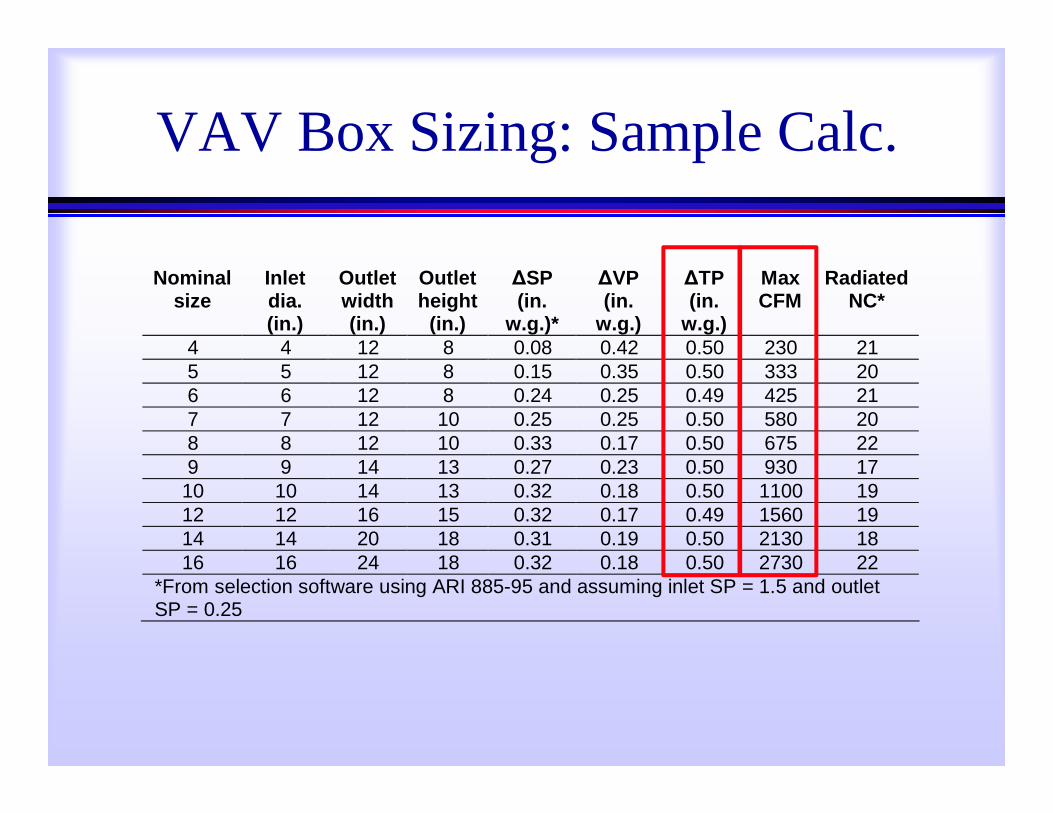
VAV Box Sizing: Sample Calc.
Nominal size
Inlet dia. (in.)
Outlet width (in.)
Outlet height
(in.)
∆SP(in.
w.g.)*
∆VP (in.
w.g.)
∆TP(in.
w.g.)
Max CFM
Radiated NC*
4 4 12 8 0.08 0.42 0.50 230 21 5 5 12 8 0.15 0.35 0.50 333 20 6 6 12 8 0.24 0.25 0.49 425 21 7 7 12 10 0.25 0.25 0.50 580 20 8 8 12 10 0.33 0.17 0.50 675 22 9 9 14 13 0.27 0.23 0.50 930 17 10 10 14 13 0.32 0.18 0.50 1100 19 12 12 16 15 0.32 0.17 0.49 1560 19 14 14 20 18 0.31 0.19 0.50 2130 18 16 16 24 18 0.32 0.18 0.50 2730 22
*From selection software using ARI 885-95 and assuming inlet SP = 1.5 and outlet SP = 0.25

What is the lowest minimum?
• Function of–DDC Controller: What’s the lowest
controllable velocity pressure (VP) signal?• DDC velocity pressure transducer accuracy• A/D converter resolution (bits)
–VAV Box: • Amplification factor, F • Inlet size, D
4
2
minminDFPMCFM
FVPFPM min
min 4005
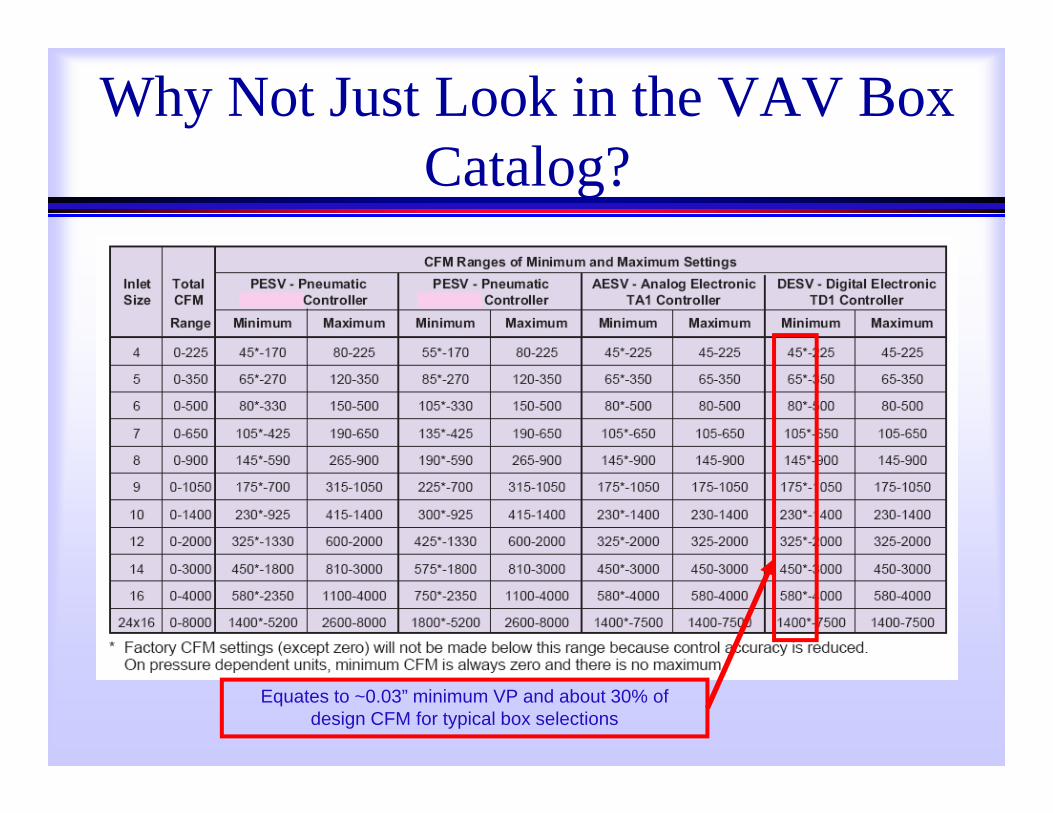
Why Not Just Look in the VAV Box Catalog?
Equates to ~0.03” minimum VP and about 30% of design CFM for typical box selections
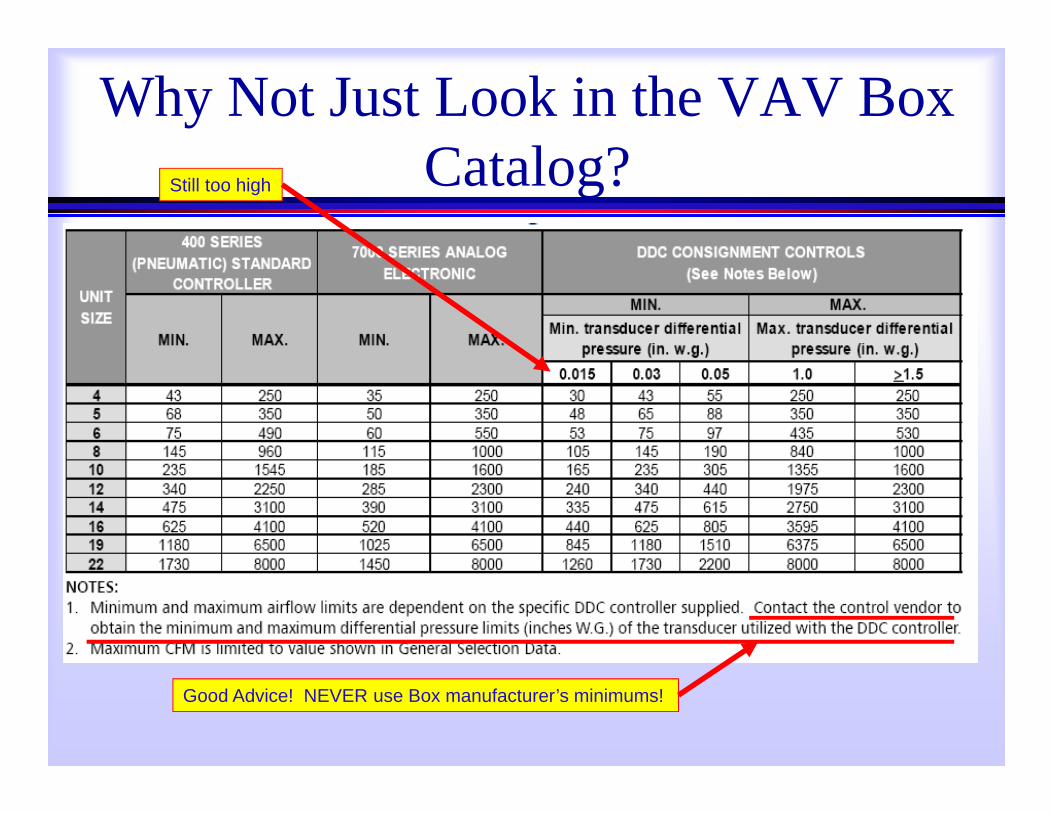
Why Not Just Look in the VAV Box Catalog?Still too high
Good Advice! NEVER use Box manufacturer’s minimums!
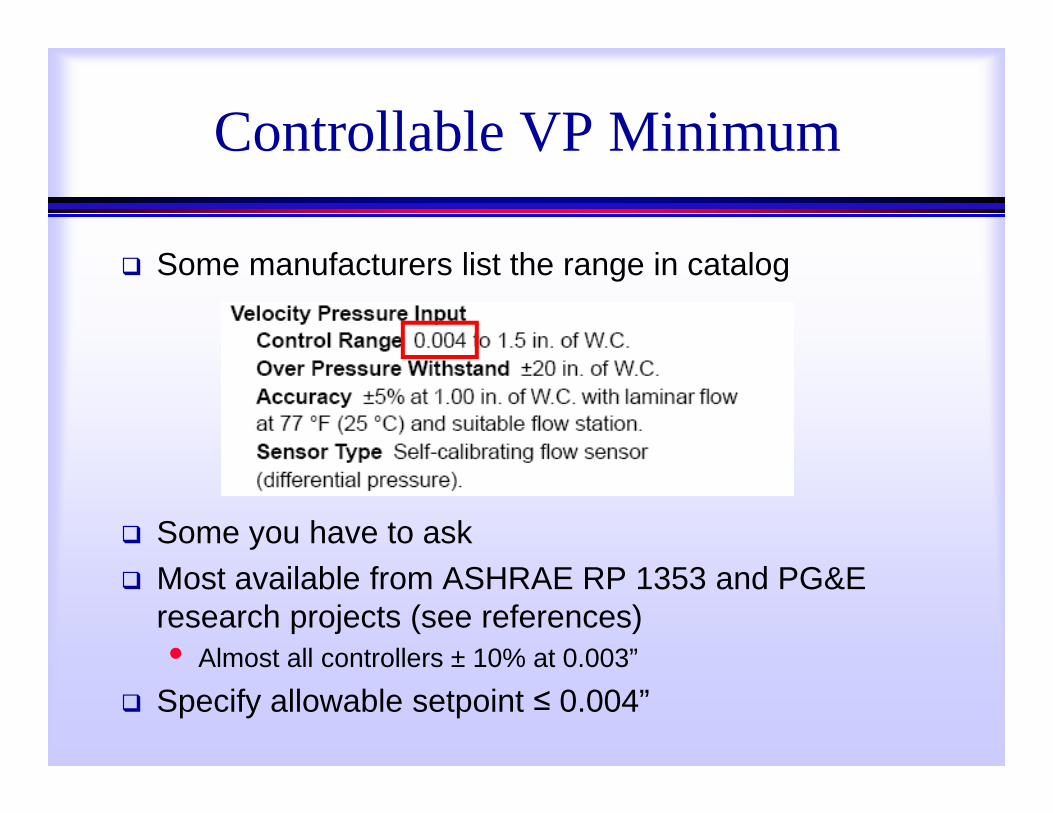
Controllable VP Minimum
Some manufacturers list the range in catalog
Some you have to ask Most available from ASHRAE RP 1353 and PG&E
research projects (see references)• Almost all controllers ± 10% at 0.003”
Specify allowable setpoint ≤ 0.004”
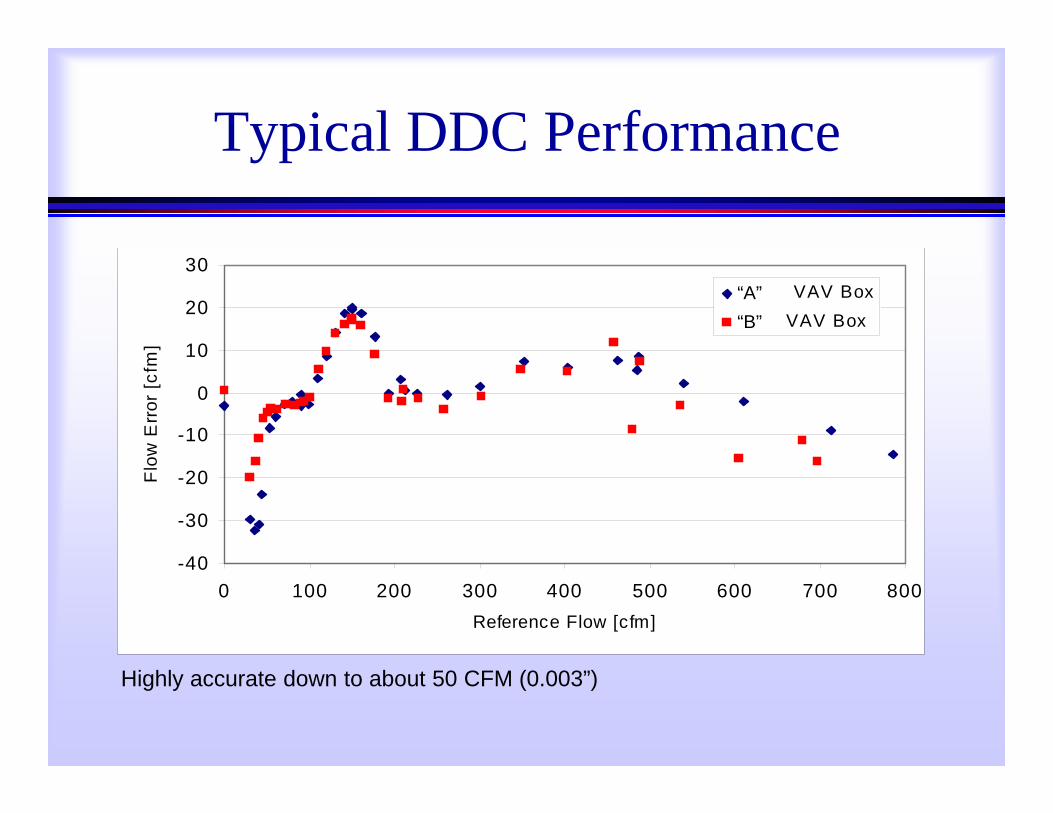
Typical DDC Performance
Highly accurate down to about 50 CFM (0.003”)
-40
-30
-20
-10
0
10
20
30
0 100 200 300 400 500 600 700 800Reference Flow [cfm]
Flo
w E
rror
[cfm
]
Nailor VAV BoxTitus VAV Box“A”“B”
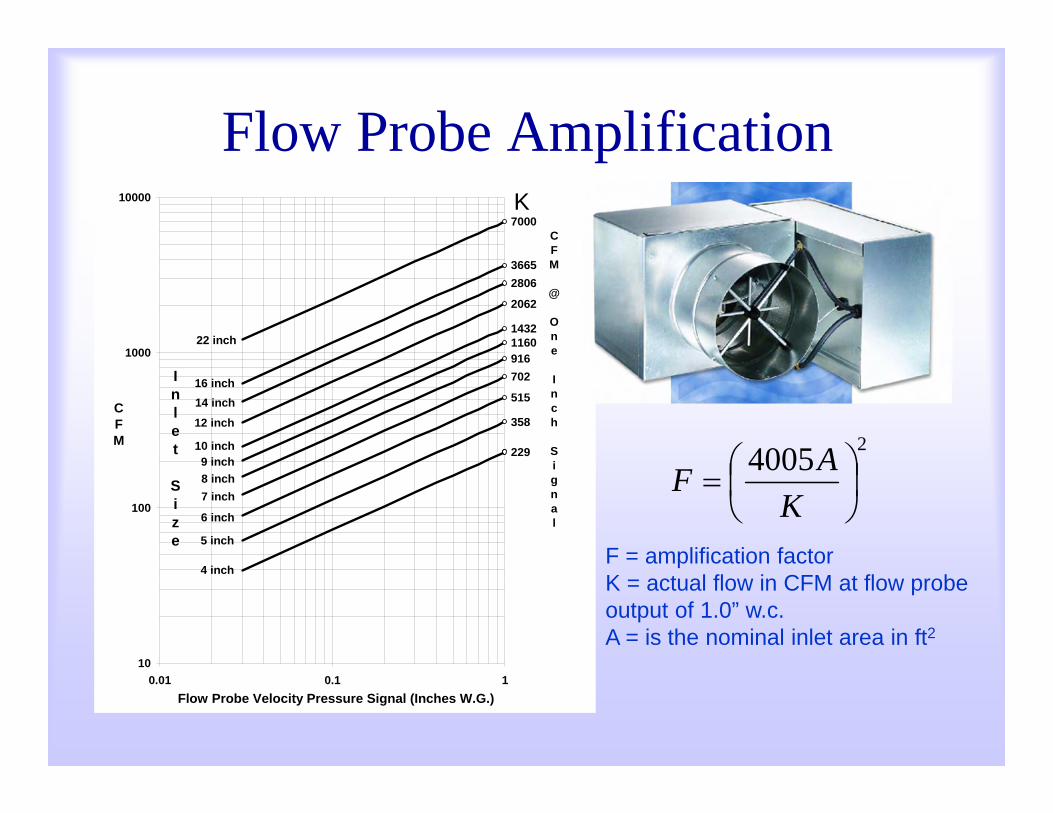
Flow Probe Amplification
229
358
515
70291611601432
2062
3665
7000
2806
4 inch
5 inch
6 inch
7 inch8 inch9 inch
10 inch
12 inch
14 inch16 inch
22 inch
10
100
1000
10000
0.01 0.1 1Flow Probe Velocity Pressure Signal (Inches W.G.)
CFM
CFM
@ One Inch Signal
Inlet Size
24005
KAF
F = amplification factorK = actual flow in CFM at flow probeoutput of 1.0” w.c.A = is the nominal inlet area in ft2
K
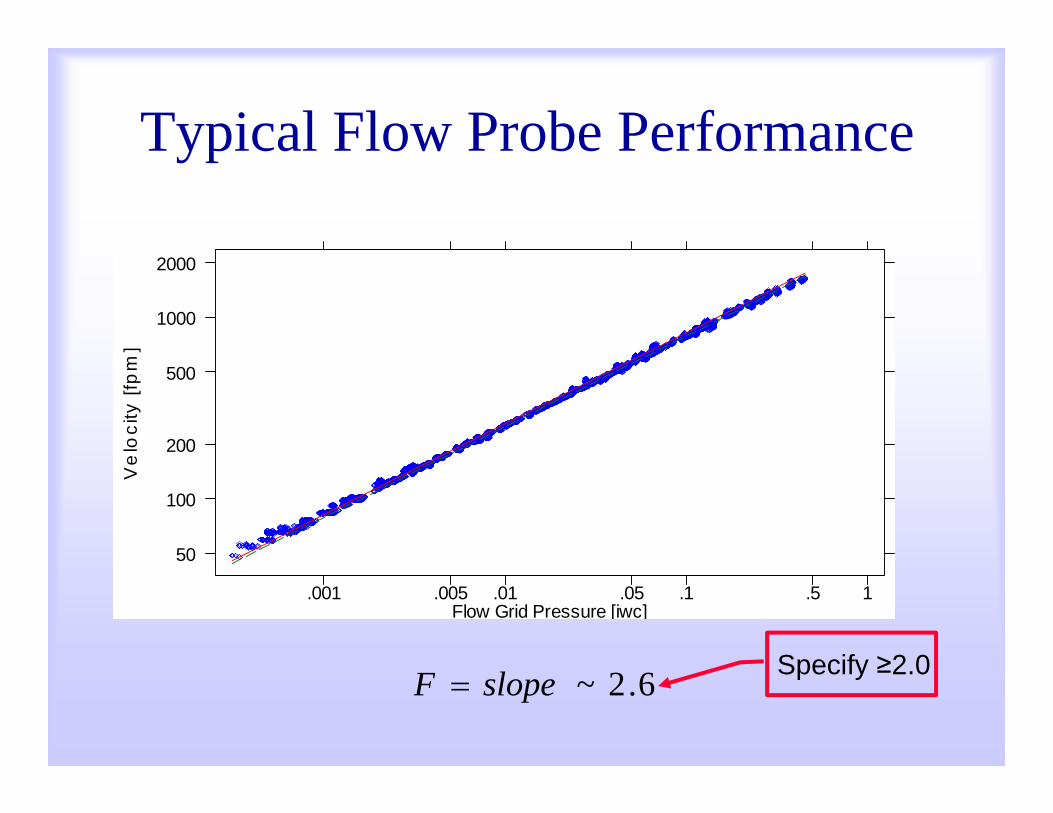
Typical Flow Probe PerformanceV
elo
city
[fp
m]
Flow Grid Pressure [iwc]1.5.1.05.01.005.001
50
100
200
500
1000
2000
6.2~slopeF Specify ≥2.0
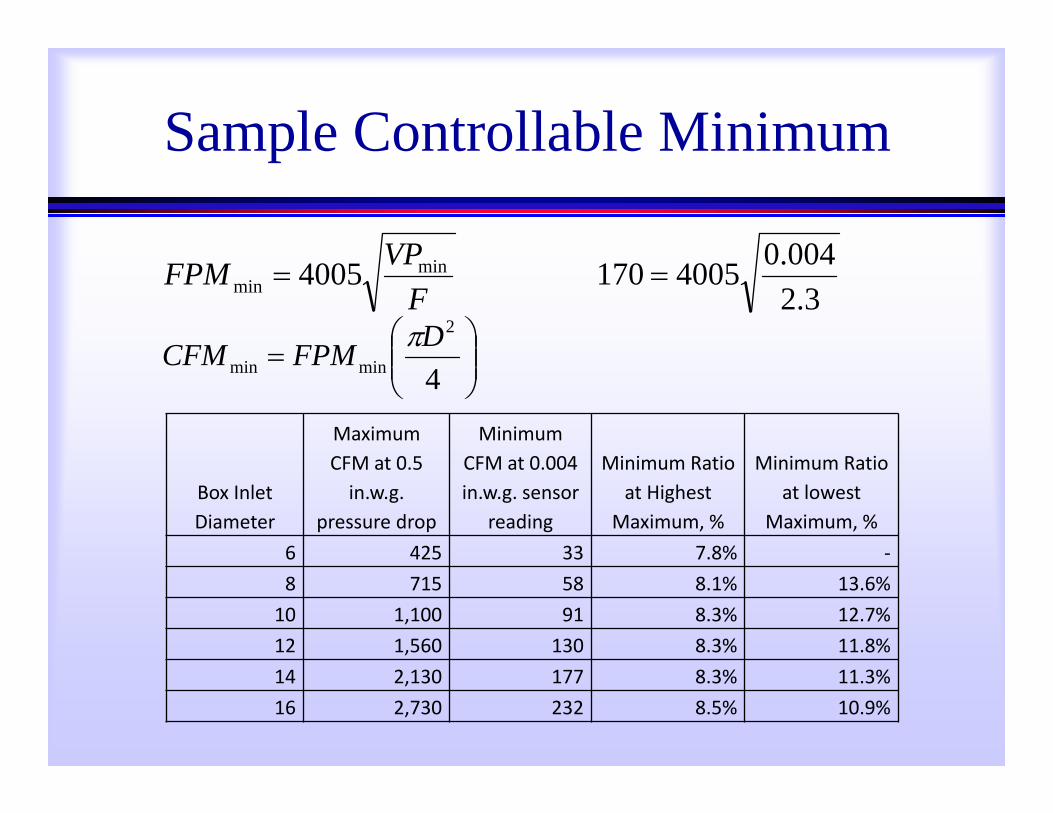
Sample Controllable Minimum
FVPFPM min
min 40053.2
004.04005170
Box Inlet Diameter
Maximum CFM at 0.5 in.w.g.
pressure drop
Minimum CFM at 0.004 in.w.g. sensor
reading
Minimum Ratio at Highest
Maximum, %
Minimum Ratio at lowest
Maximum, %6 425 33 7.8% ‐8 715 58 8.1% 13.6%10 1,100 91 8.3% 12.7%12 1,560 130 8.3% 11.8%14 2,130 177 8.3% 11.3%16 2,730 232 8.5% 10.9%
4
2
minminDFPMCFM
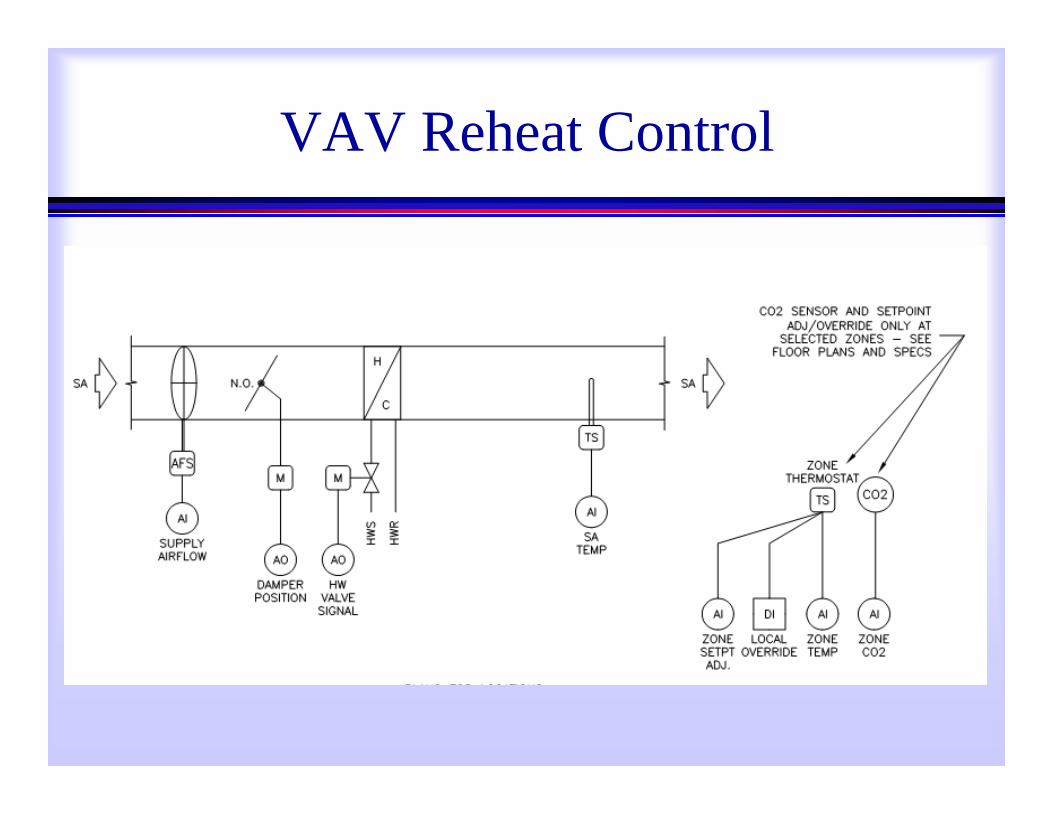
VAV Reheat Control
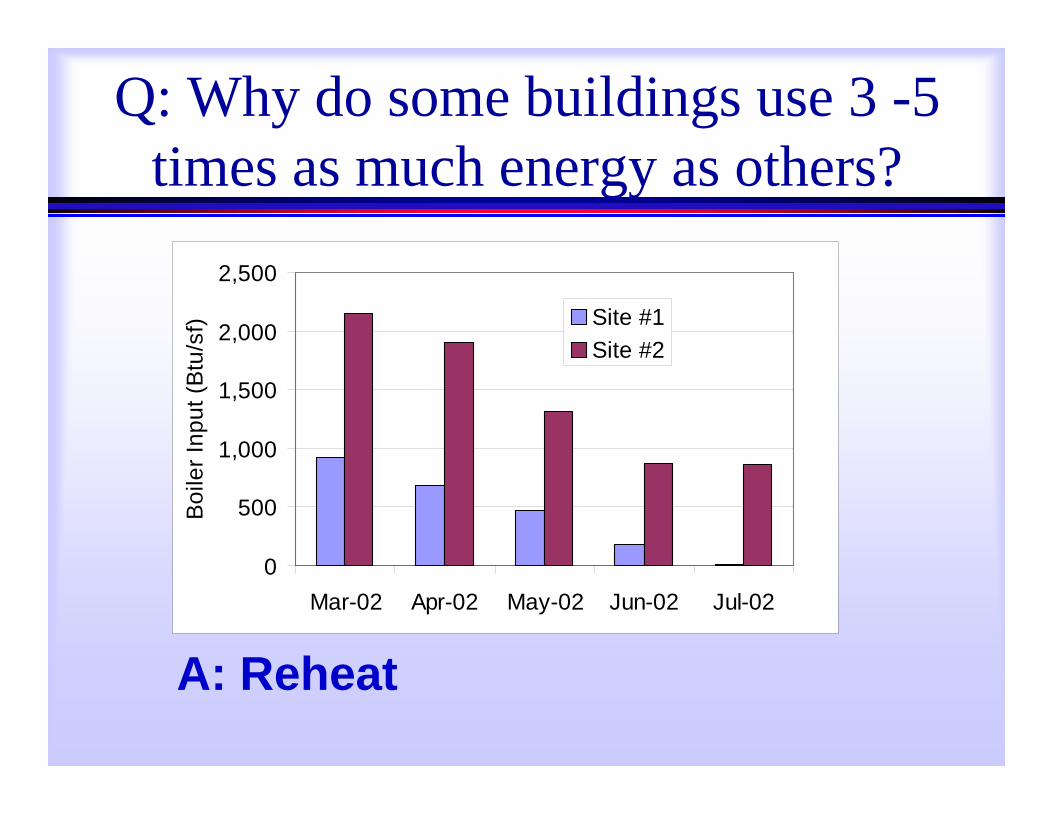
Q: Why do some buildings use 3 -5 times as much energy as others?
0
500
1,000
1,500
2,000
2,500
Mar-02 Apr-02 May-02 Jun-02 Jul-02
Boi
ler I
nput
(Btu
/sf) Site #1
Site #2
A: Reheat
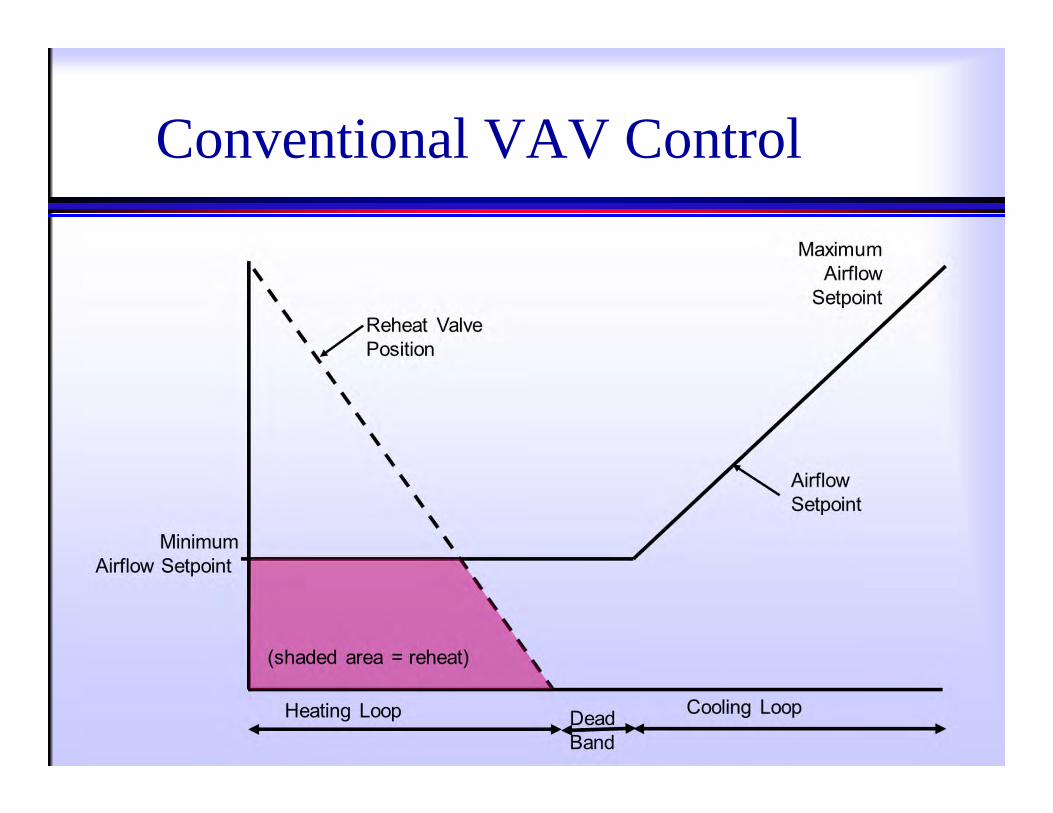
Conventional VAV Control
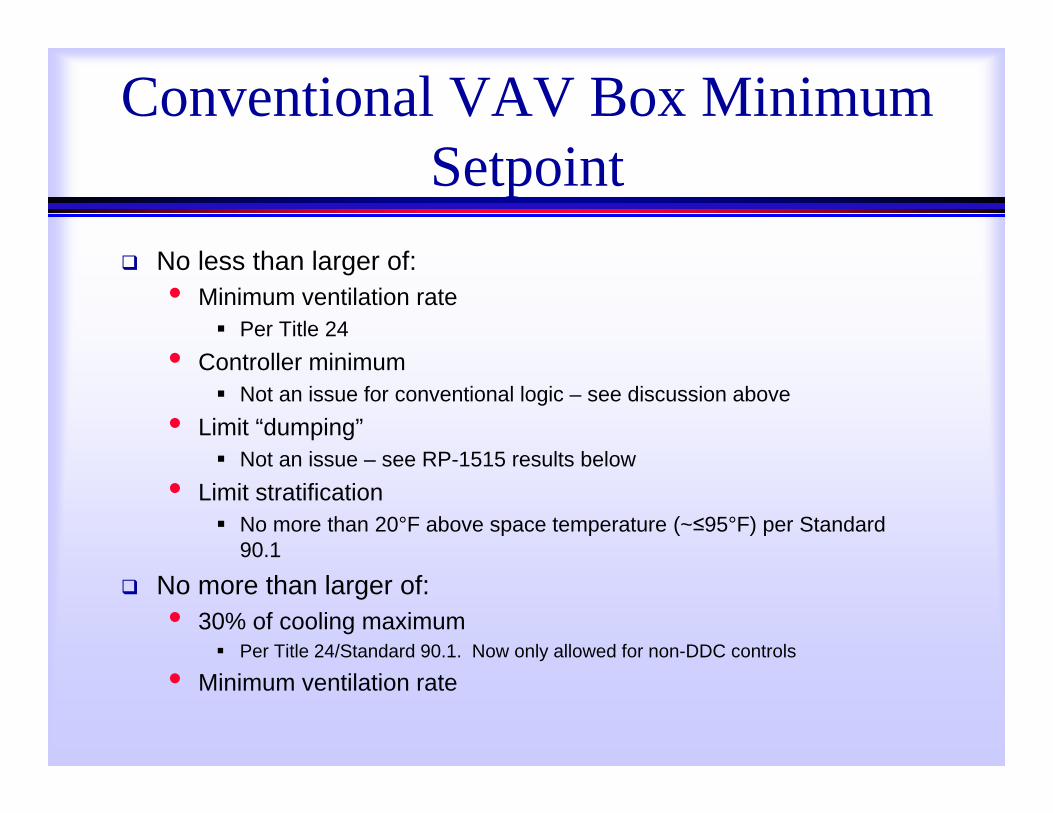
Conventional VAV Box Minimum Setpoint
No less than larger of:• Minimum ventilation rate
Per Title 24• Controller minimum
Not an issue for conventional logic – see discussion above• Limit “dumping”
Not an issue – see RP-1515 results below• Limit stratification
No more than 20°F above space temperature (~≤95°F) per Standard 90.1
No more than larger of:• 30% of cooling maximum
Per Title 24/Standard 90.1. Now only allowed for non-DDC controls
• Minimum ventilation rate

Title 24 VAV Control Requirementfor zones with DDC

Dual Maximum Controlper Title 24 and Standard 90.1 for DDC

Dual Maximum Logic in Action
Start heating, increase DAT setpoint
At 50% Heat, start increasing airflow
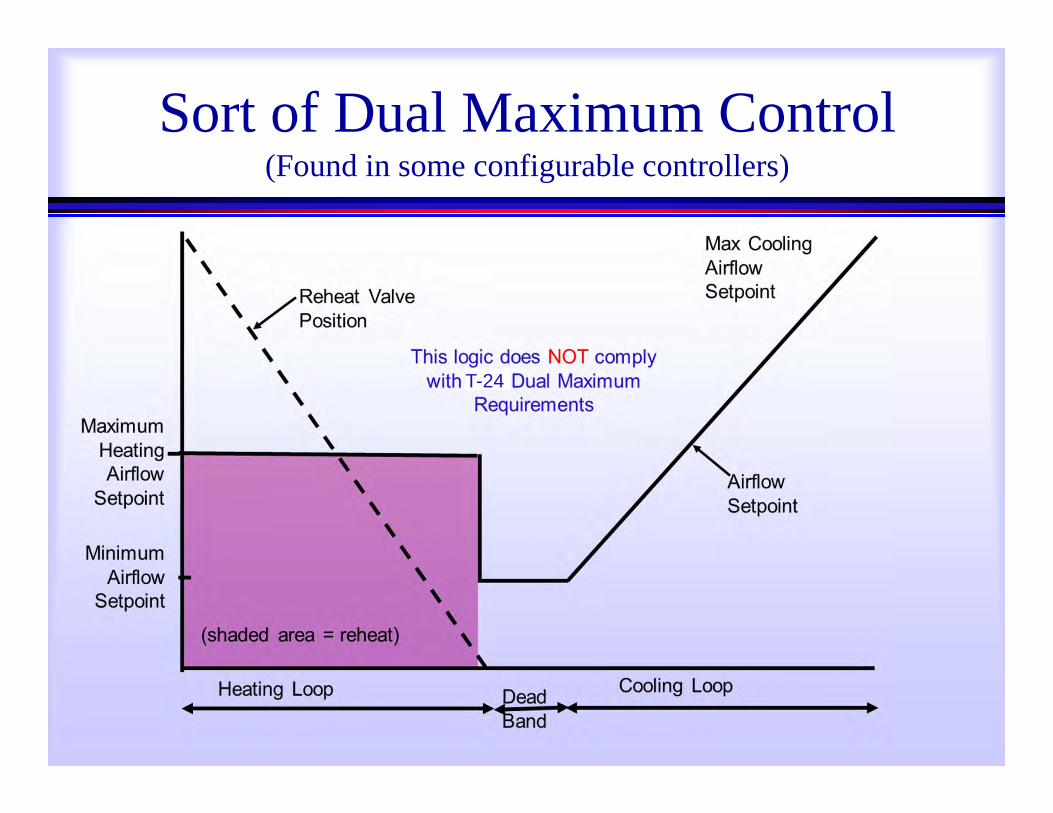
Sort of Dual Maximum Control (Found in some configurable controllers)
T-24
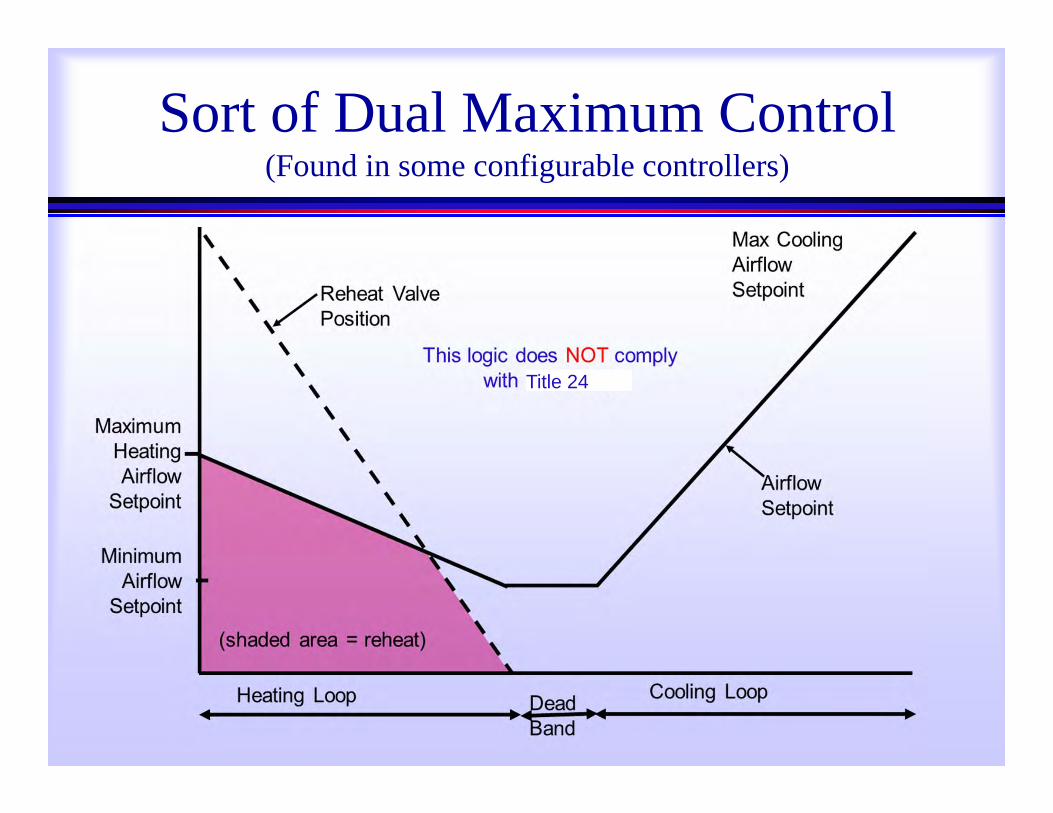
Sort of Dual Maximum Control (Found in some configurable controllers)
Title 24

VAV Box Dual Maximum Control Setpoints per Title 24 and Standard 90.1
Minimum: 1. No less than larger of:
Minimum ventilation rate for the zone Controller minimum
2. No more than 20% of cooling maximum
Heating Maximum:1. No less than larger of:
Minimum Limit stratification - ≤20°F SAT above space temperature (≤~90°F to 95°F)
2. No more than 50% of cooling maximum Always use Option 1 above
• Do not use code maximum just because it’s legal!• Avoid using %-of-cooling-maximum setpoints – boxes are
usually oversized!
COOL MIN HEATVR‐101 12 1035 135 260VR‐102 10 810 90 230VR‐103 6 210 50 50
MARK INLET SIZE
DESIGN CFM
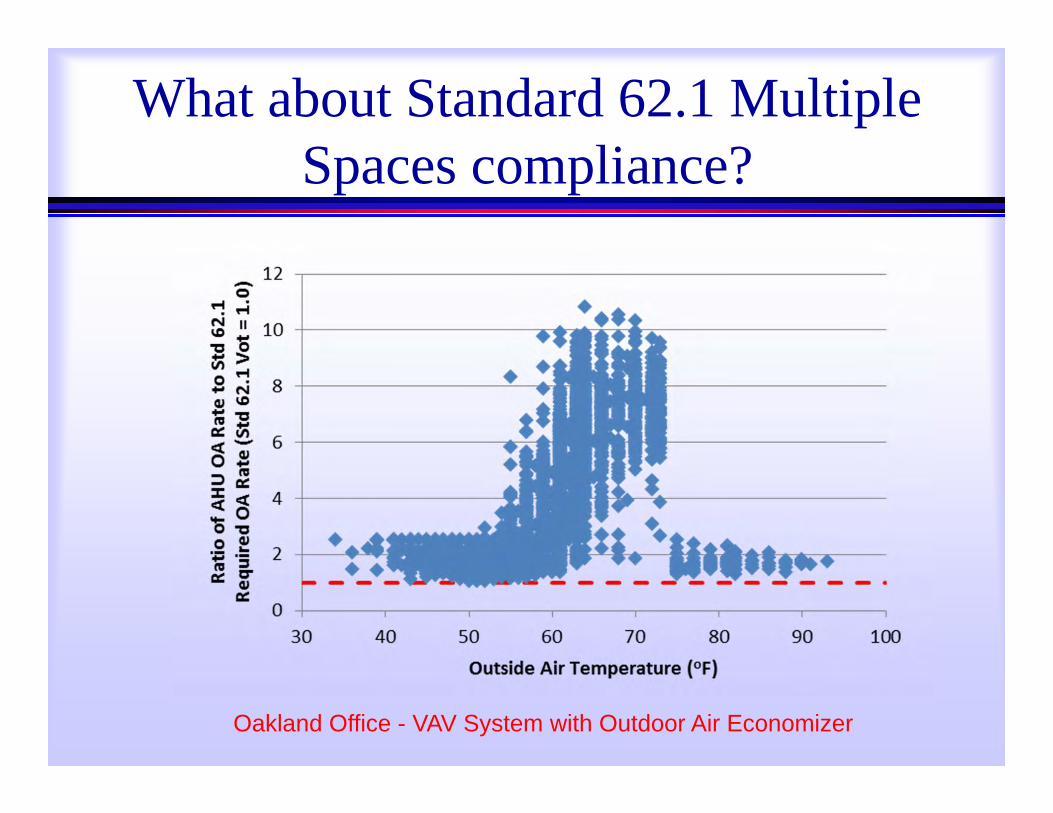
What about Standard 62.1 Multiple Spaces compliance?
Oakland Office - VAV System with Outdoor Air Economizer
How Well Does “Dual Max” Logic Actually Work?
RP-1515 results…
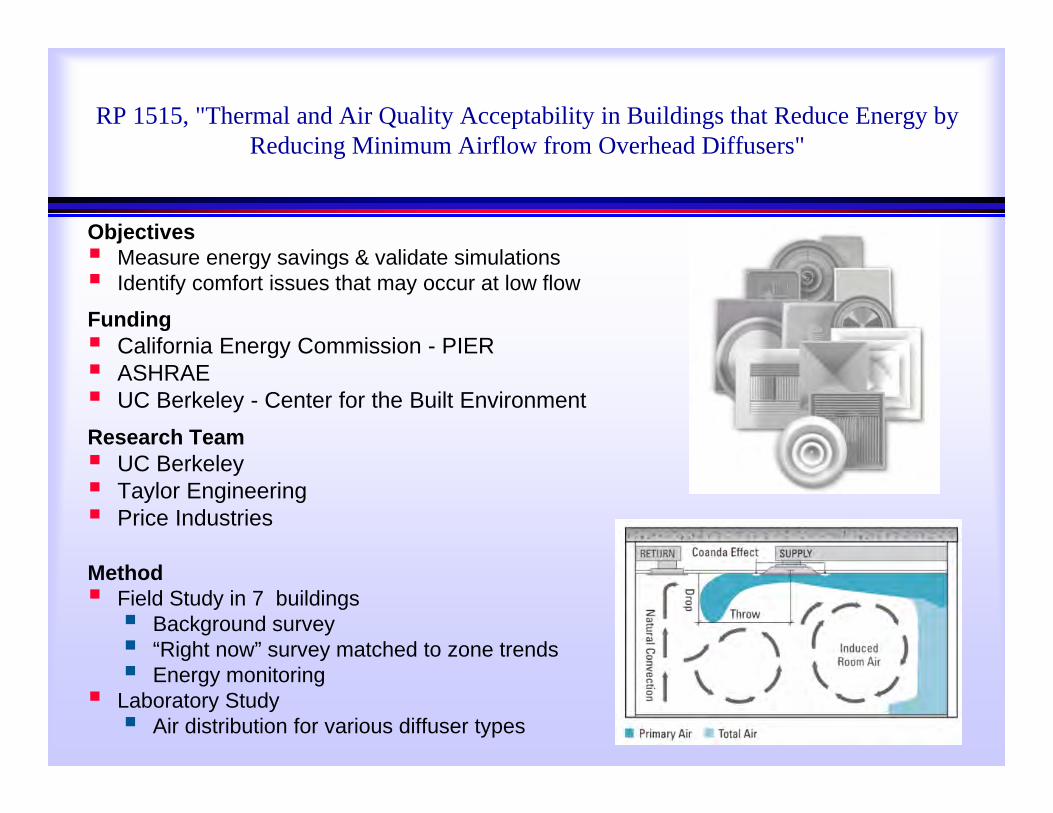
RP 1515, "Thermal and Air Quality Acceptability in Buildings that Reduce Energy by Reducing Minimum Airflow from Overhead Diffusers"
Objectives Measure energy savings & validate simulations Identify comfort issues that may occur at low flow
Funding California Energy Commission - PIER ASHRAE UC Berkeley - Center for the Built EnvironmentResearch Team UC Berkeley Taylor Engineering Price Industries
Method Field Study in 7 buildings Background survey “Right now” survey matched to zone trends Energy monitoring
Laboratory Study Air distribution for various diffuser types
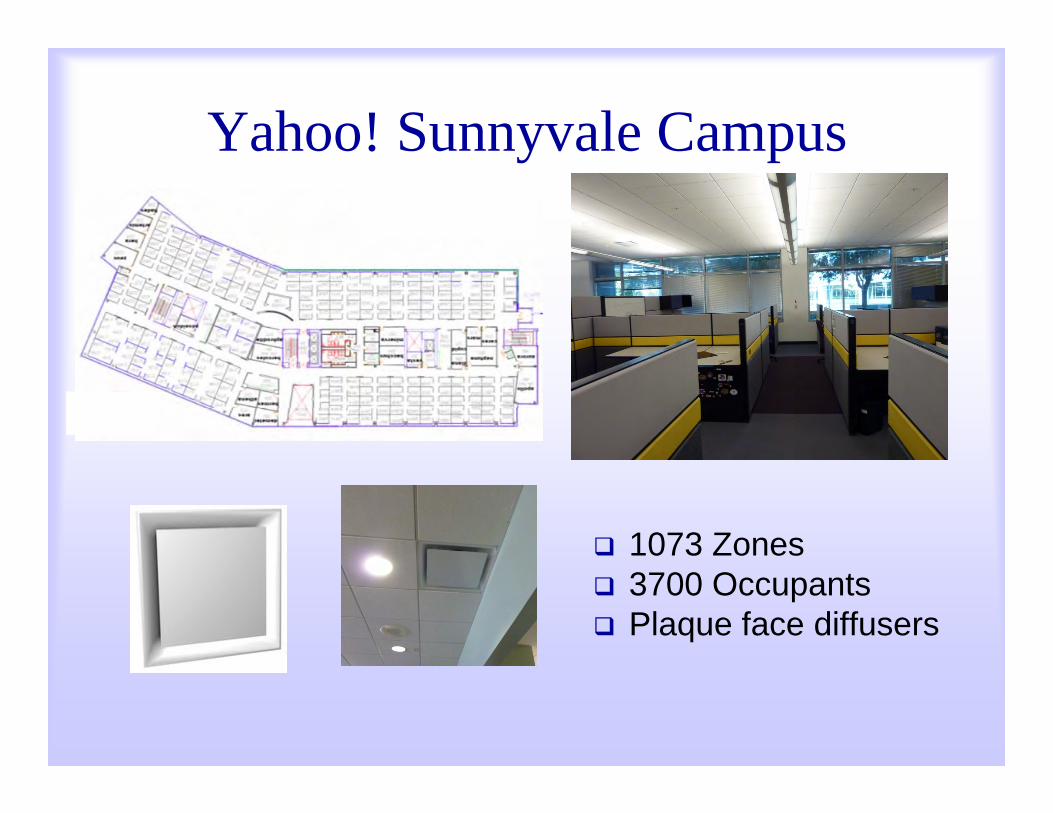
Yahoo! Sunnyvale Campus
1073 Zones 3700 Occupants Plaque face diffusers
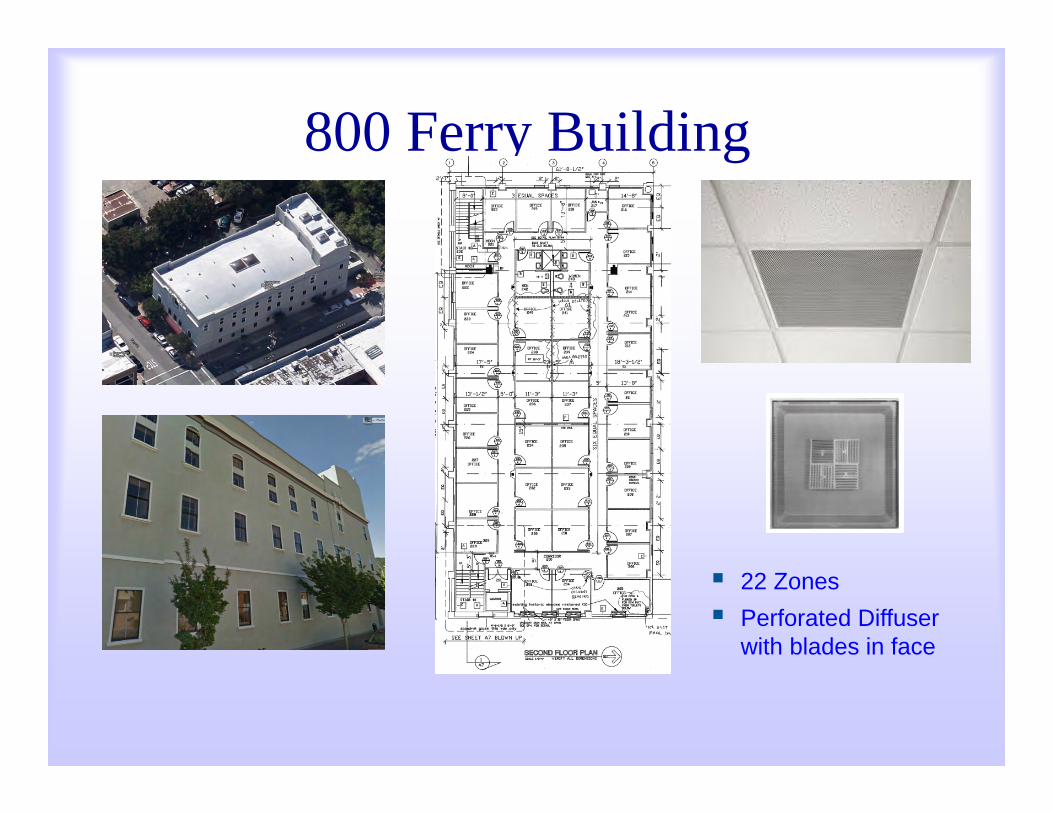
800 Ferry Building
22 Zones Perforated Diffuser
with blades in face
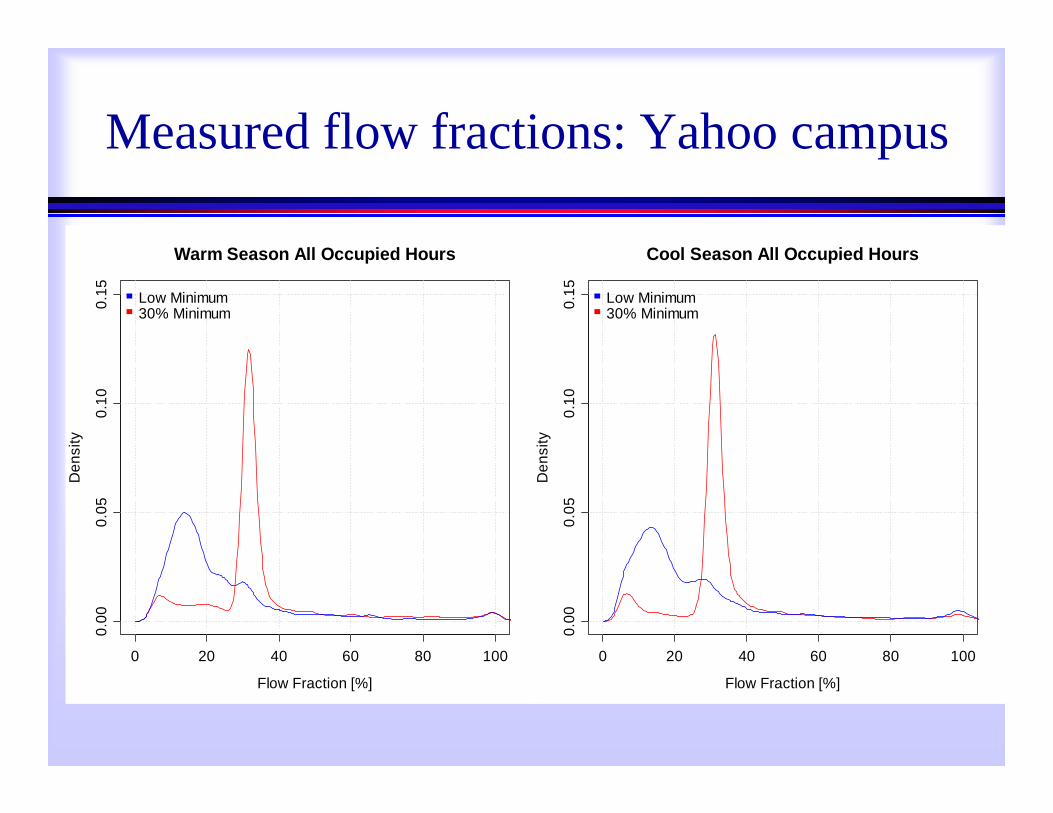
Measured flow fractions: Yahoo campus
0 20 40 60 80 100
0.00
0.05
0.10
0.15
Warm Season All Occupied Hours
Flow Fraction [%]
Den
sity
Low Minimum30% Minimum
0 20 40 60 80 100
0.00
0.05
0.10
0.15
Cool Season All Occupied Hours
Flow Fraction [%]
Den
sity
Low Minimum30% Minimum
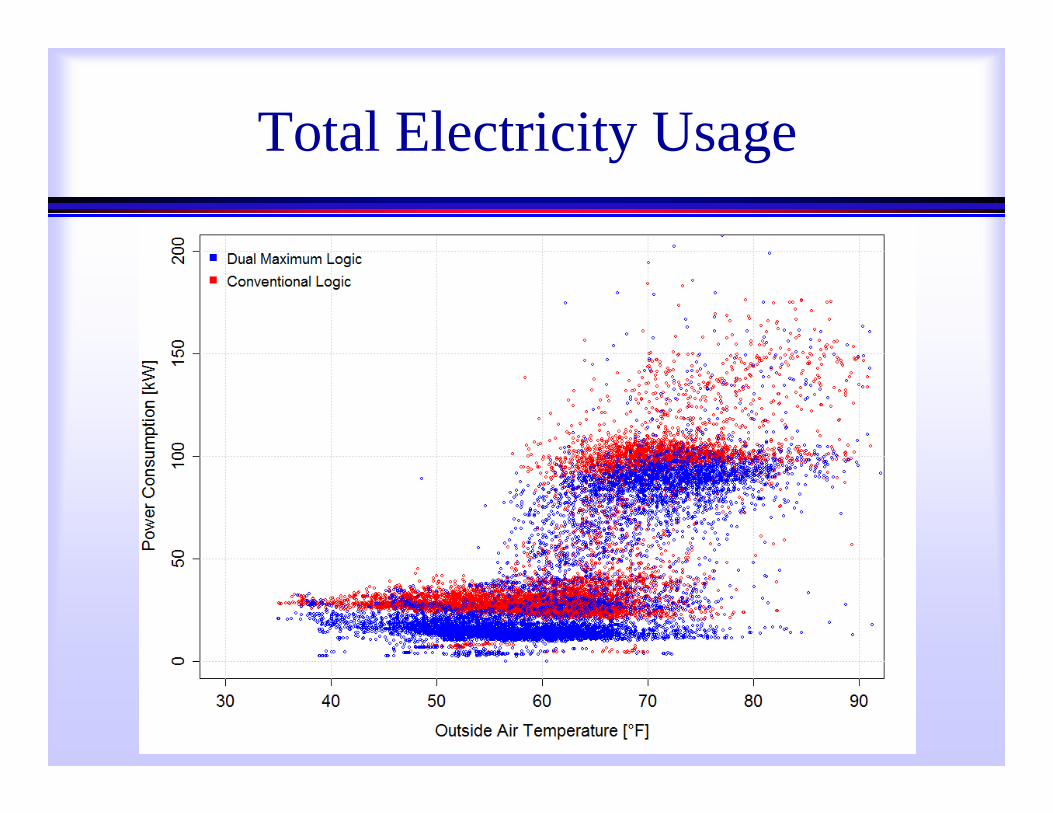
Total Electricity Usage
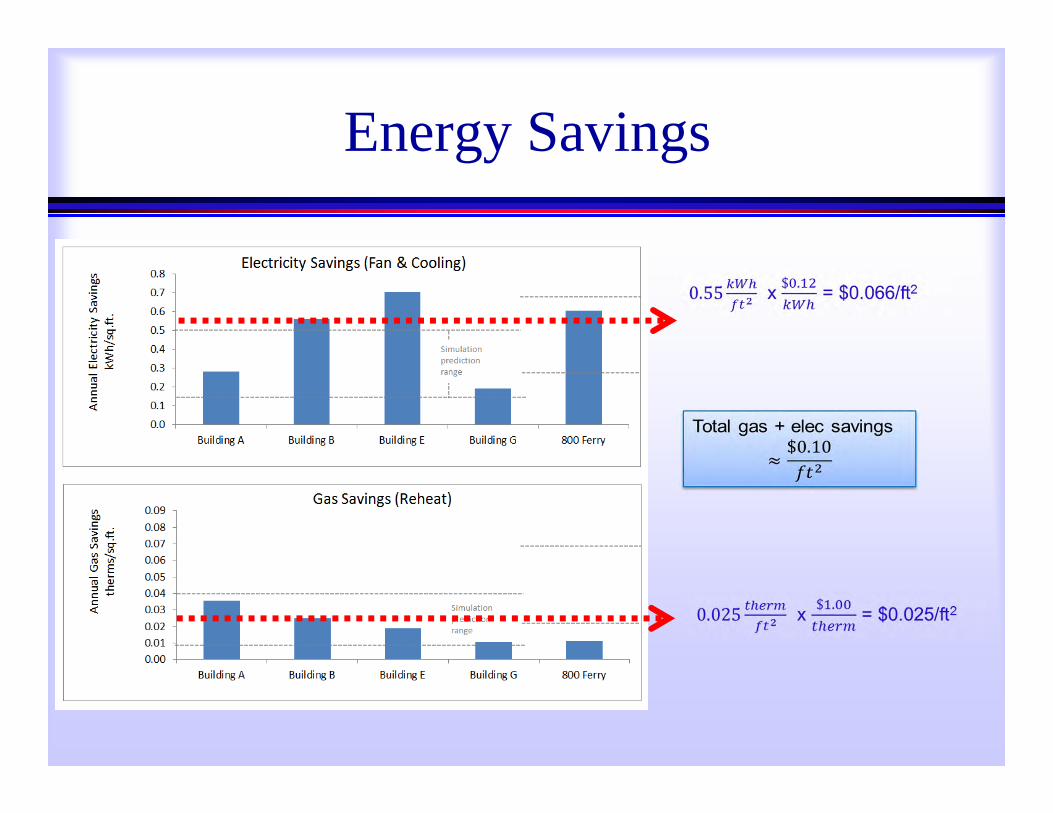
Energy Savings
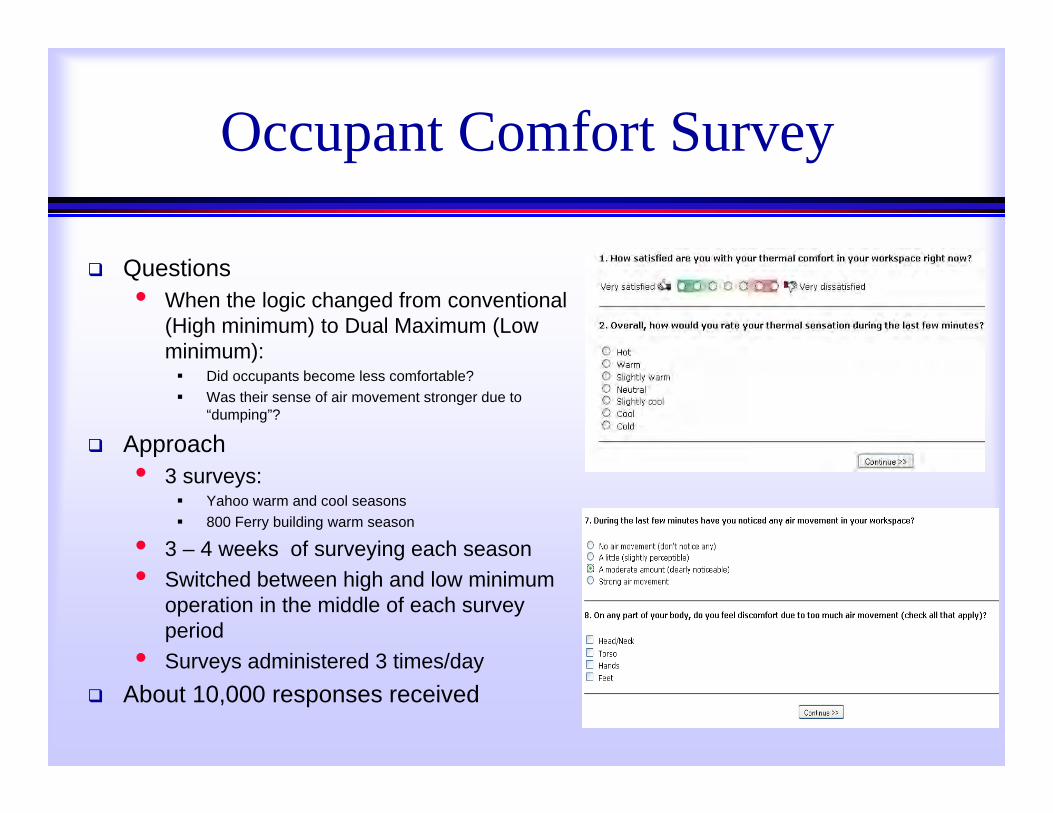
Occupant Comfort Survey
Questions• When the logic changed from conventional
(High minimum) to Dual Maximum (Low minimum): Did occupants become less comfortable? Was their sense of air movement stronger due to
“dumping”?
Approach• 3 surveys:
Yahoo warm and cool seasons 800 Ferry building warm season
• 3 – 4 weeks of surveying each season• Switched between high and low minimum
operation in the middle of each survey period
• Surveys administered 3 times/day About 10,000 responses received
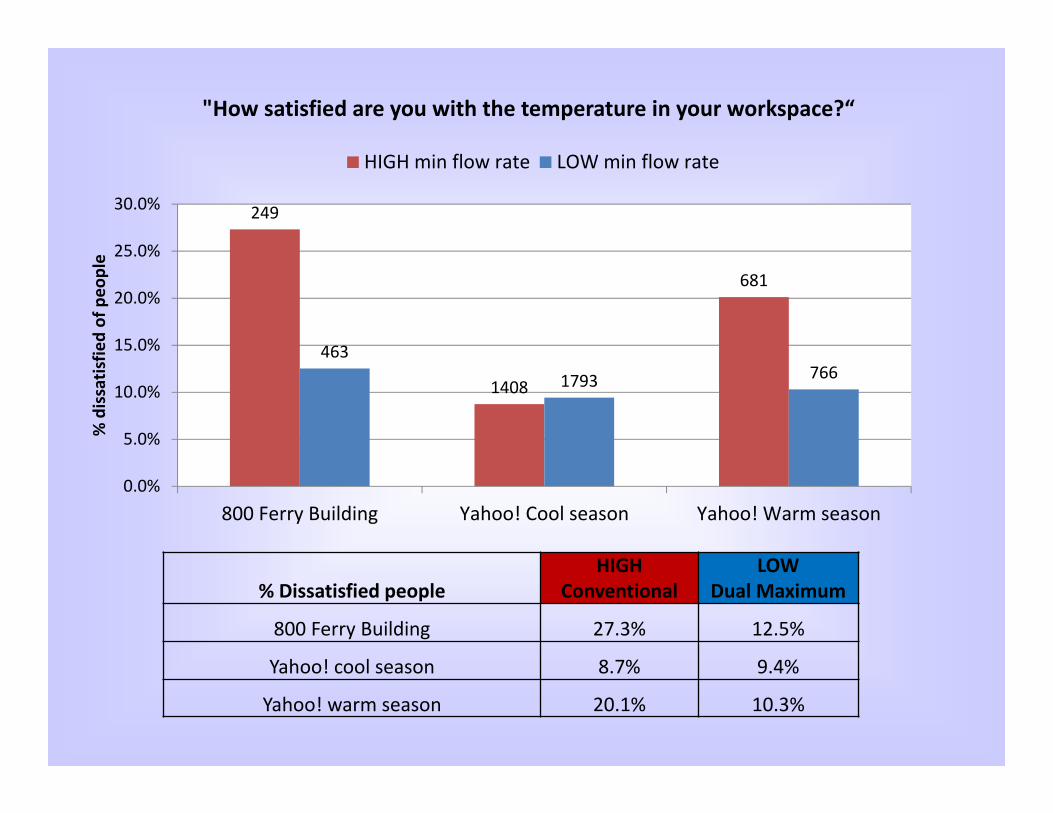
% Dissatisfied peopleHIGH
ConventionalLOW
Dual Maximum
800 Ferry Building 27.3% 12.5%
Yahoo! cool season 8.7% 9.4%
Yahoo! warm season 20.1% 10.3%
249
1408
681
463
1793 766
0.0%
5.0%
10.0%
15.0%
20.0%
25.0%
30.0%
800 Ferry Building Yahoo! Cool season Yahoo! Warm season
% dissatisfie
d of peo
ple
"How satisfied are you with the temperature in your workspace?“
HIGH min flow rate LOW min flow rate

Thermal sensation distribution (Yahoo! warm season)
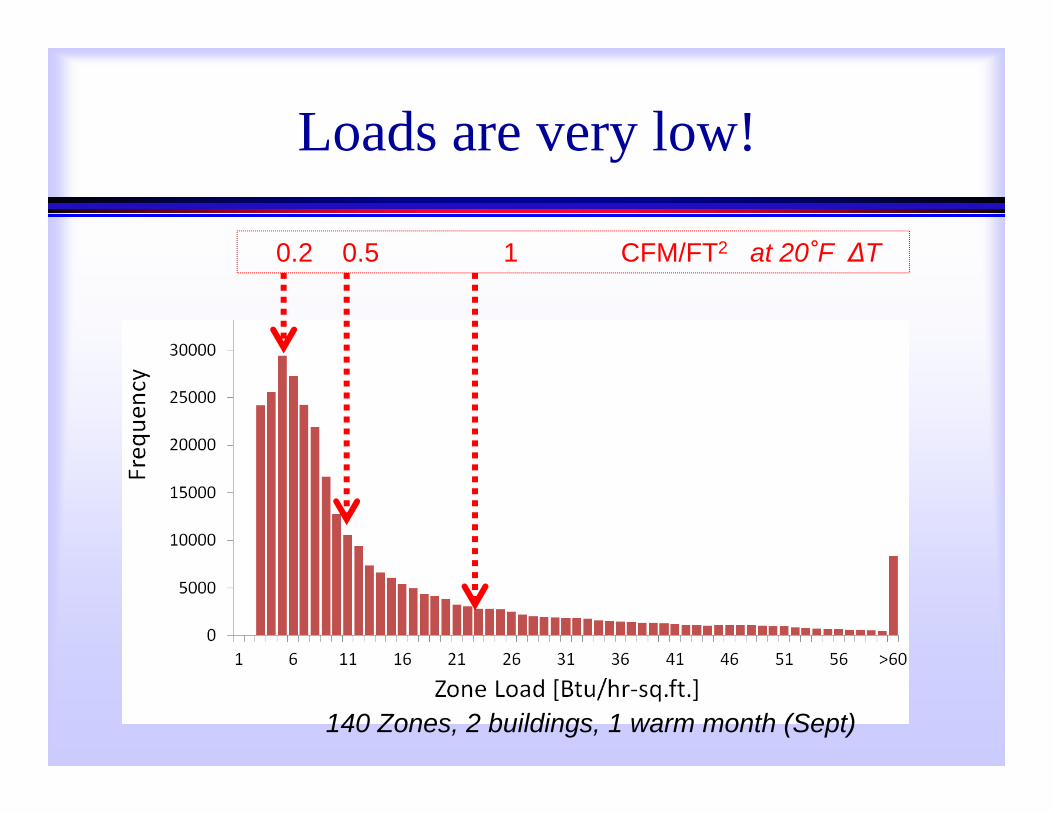
Loads are very low!
0.2 0.5 1 CFM/FT2 at 20˚F ∆T
140 Zones, 2 buildings, 1 warm month (Sept)
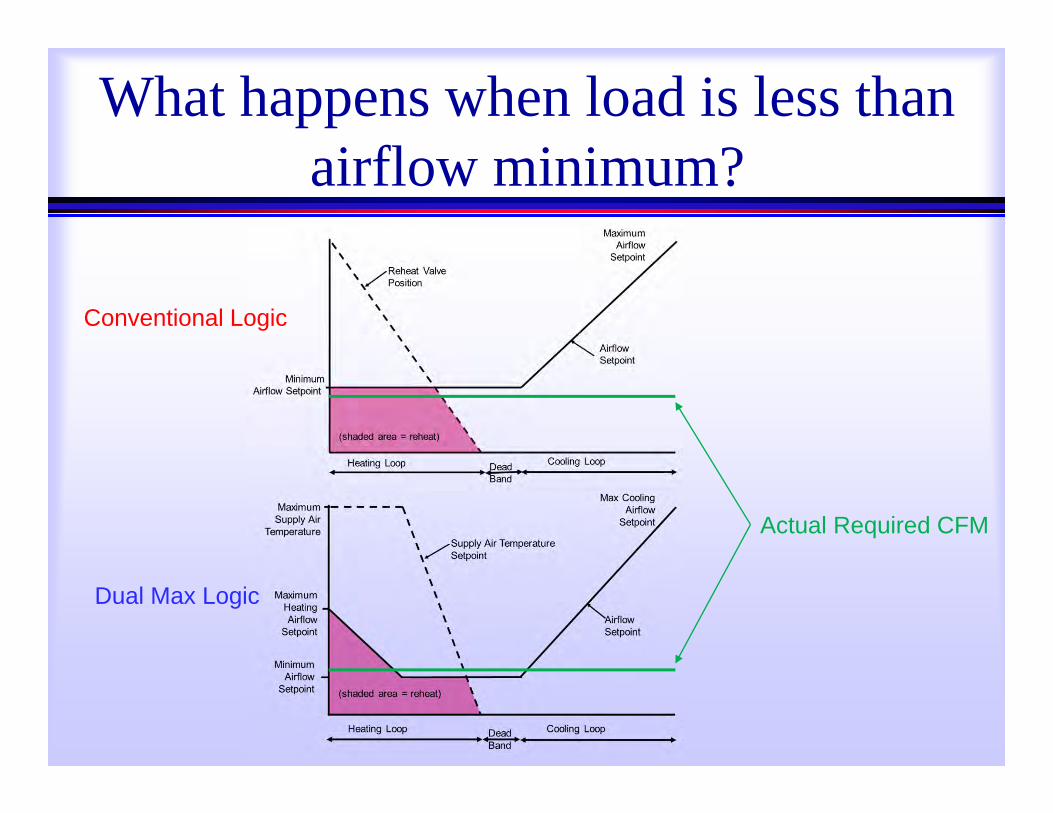
What happens when load is less than airflow minimum?
Actual Required CFM
Conventional Logic
Dual Max Logic

Air temperature(800 Ferry building)
09/
22
09/
23
09/
26
09/
27
09/
28
09/
29
09/
30
10/
03
10/
04
10/
05
10/
06
10/
07
10/
10
10/
11
10/
12
10/
13
10/
14
10/
17
10/
18
10/
19
10/
20
60
65
70
75
80
85
Dates
zone
tem
pera
ture
[F]
1.4 2 1.8 1.5 1.6 1.5 1.4 1.8 1.6 1.5 2 0.89 1.6 1.5 1.1 1.9 1.1 1.4 1.3 1.2 2.172 72 71 71 72 71 71 71 70 71 71 72 73 74 74 73 74 74 75 75 7314 27 23 35 45 36 35 41 47 34 65 23 30 51 45 64 25 37 67 27 48
sdMean
N
HIGH minimum flow rateLOW minimum flow rate
High flow: average Tair = 71.2ºF Low flow: average Tair = 73.3ºF
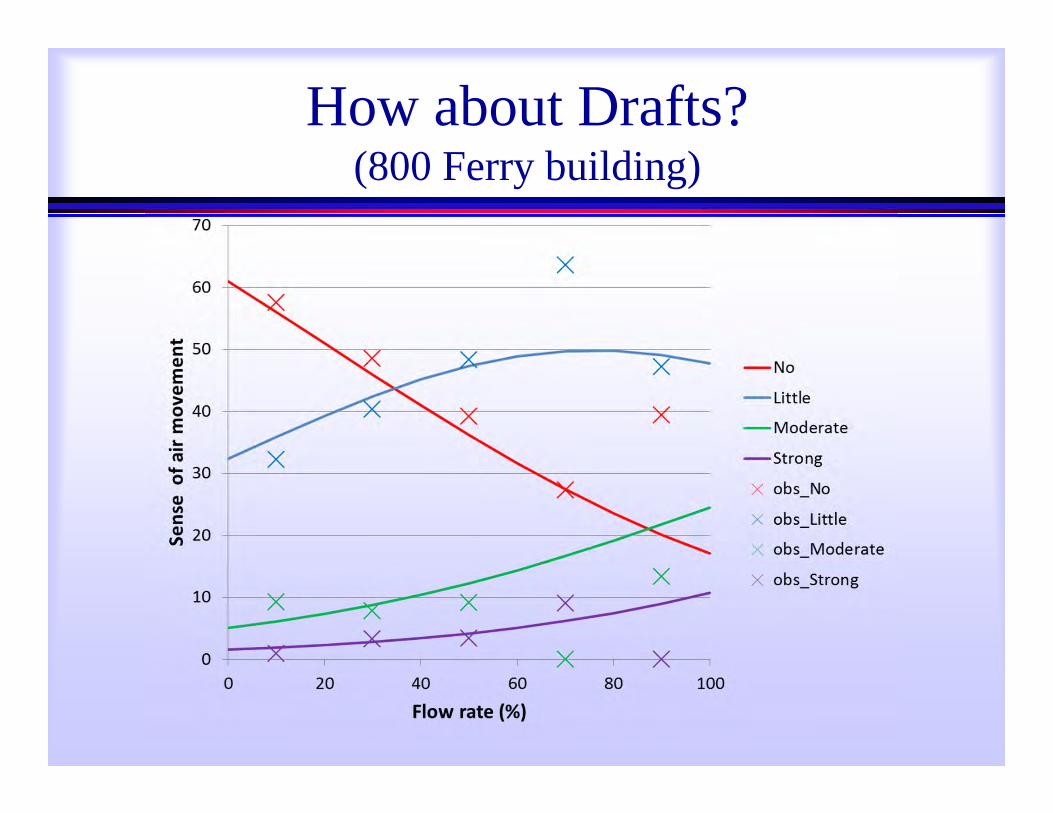
How about Drafts?(800 Ferry building)
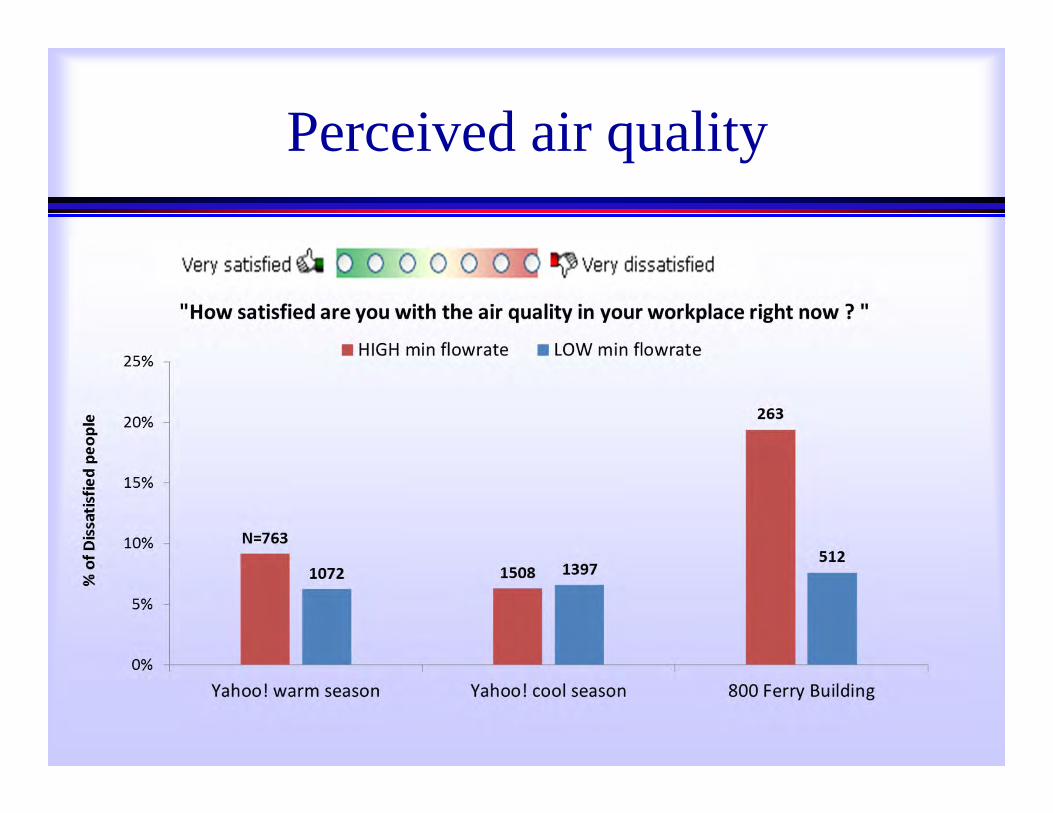
Perceived air quality
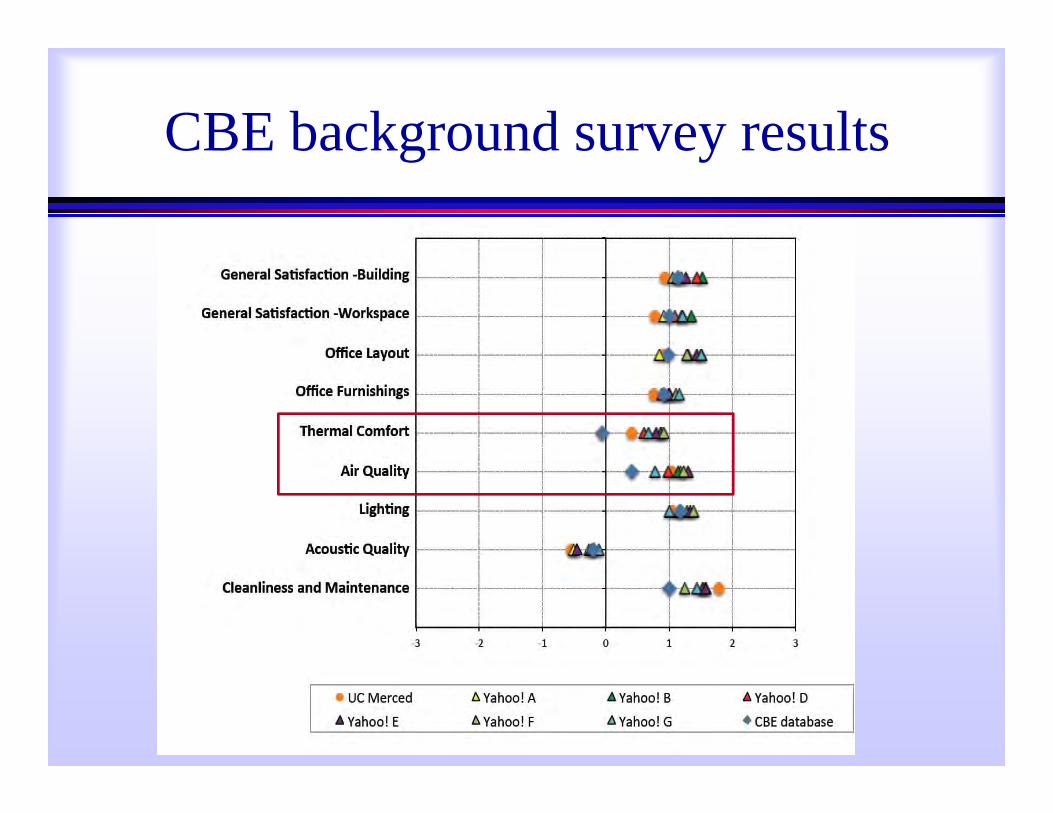
CBE background survey results
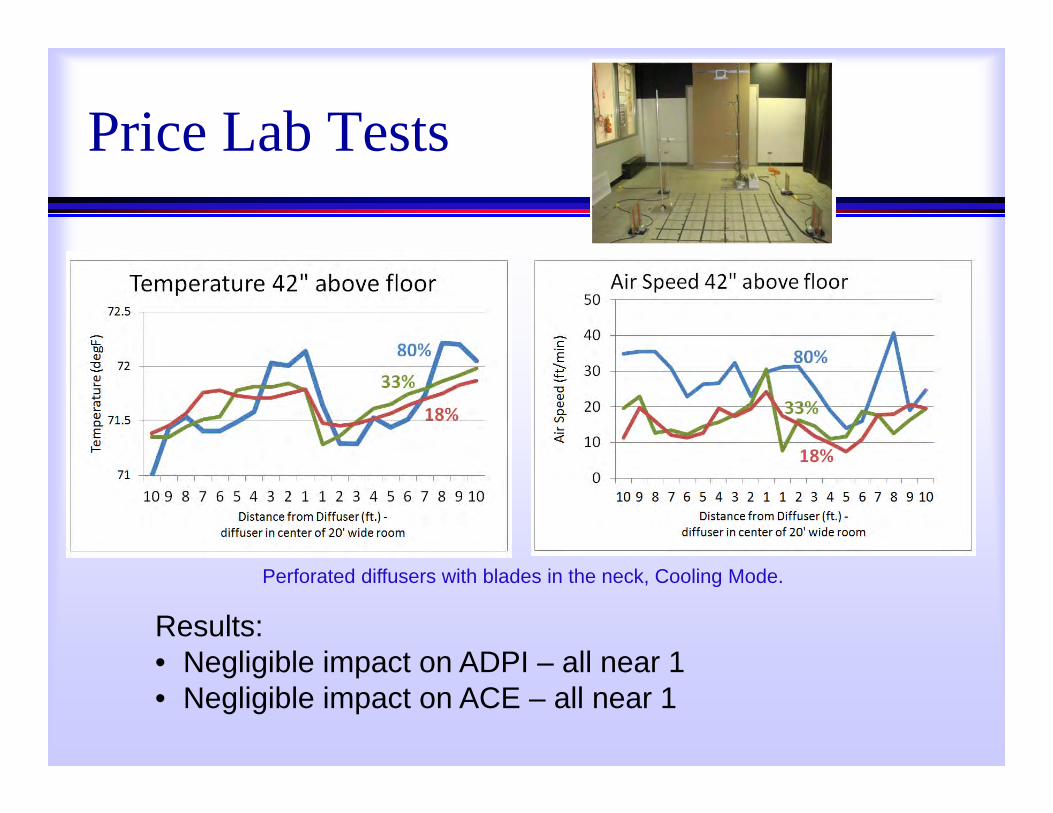
Price Lab Tests
Perforated diffusers with blades in the neck, Cooling Mode.
Results:• Negligible impact on ADPI – all near 1• Negligible impact on ACE – all near 1
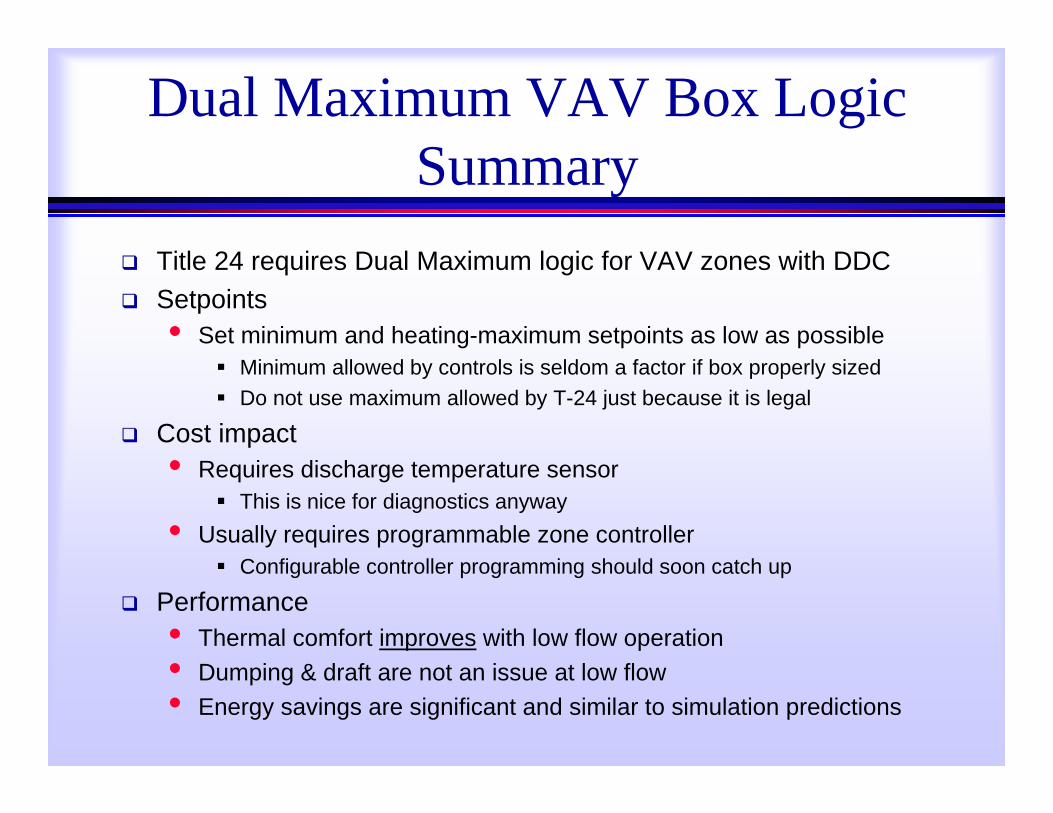
Dual Maximum VAV Box Logic Summary
Title 24 requires Dual Maximum logic for VAV zones with DDC Setpoints
• Set minimum and heating-maximum setpoints as low as possible Minimum allowed by controls is seldom a factor if box properly sized Do not use maximum allowed by T-24 just because it is legal
Cost impact• Requires discharge temperature sensor
This is nice for diagnostics anyway• Usually requires programmable zone controller
Configurable controller programming should soon catch up
Performance• Thermal comfort improves with low flow operation• Dumping & draft are not an issue at low flow• Energy savings are significant and similar to simulation predictions
Bibliography
Taylor S., Stein J.; “Sizing VAV Boxes”, ASHRAE Journal, March 2004
Dickerhoff D., Stein J.; “Stability and Accuracy of VAV Terminal Units at Low Flow”, PG&E 0514, http://www.etcc-ca.com/reports/stability-and-accuracy-vav-terminal-units-low-flow
Lui R., Wen J.; Stability and Accuracy of VAV Box Control at Low Flows”, ASHRAE 1353-RP
Taylor S. “Dual Maximum VAV Box Logic”, ASHRAE Journal, December 2012