Du pont 4q16_slides_final
40
0 DuPont Fourth-Quarter and Full-Year 2016 Earnings CONFERENCE CALL JANUARY 24, 2017
-
Upload
dupontinv -
Category
Investor Relations
-
view
3.564 -
download
0
Transcript of Du pont 4q16_slides_final

0
DuPont Fourth-Quarter and Full-Year 2016 Earnings
CONFERENCE CALL
JANUARY 24, 2017
1
Regulation G
This document includes information that does not conform to U.S. generally accepted accounting principles (GAAP) and are considered non-GAAP
measures. These measures include the company’s consolidated results and earnings per share on an operating earnings basis, which excludes
significant items and non-operating pension and other postretirement employee benefit costs (operating earnings and operating EPS), total segment
pre-tax operating earnings, operating costs and corporate expenses on an operating earnings basis. Management uses these measures internally for
planning, forecasting and evaluating the performance of the Company’s segments, including allocating resources and evaluating incentive
compensation. Management believes that these non-GAAP measurements are meaningful to investors as they provide insight with respect to
ongoing operating results of the company and provide a more useful comparison of year-over-year results. From a liquidity perspective, management
uses free cash flow which is defined as cash provided/used by operating activities less purchases of property, plant and equipment. Free cash flow is
useful to investors and management to evaluate the company’s cash flow and financial performance, and is an integral financial measure used in the
company’s financial planning process. These non-GAAP measurements supplement our GAAP disclosures and should not be viewed as an
alternative to GAAP measures of performance. This data should be read in conjunction with previously published company reports on Forms 10-K,
10-Q, and 8-K. These reports, along with reconciliations of non-GAAP measures to GAAP are available on the Investor Center of www.dupont.com
under Filings and Reports – Reconciliations and Other Data. Reconciliations of non-GAAP measures to GAAP are also included with this
presentation.
Forward-Looking Statements
This communication contains “forward-looking statements” within the meaning of the federal securities laws, including Section 27A of the Securities
Act of 1933, as amended, and Section 21E of the Securities Exchange Act of 1934, as amended. In this context, forward-looking statements often
address expected future business and financial performance and financial condition, and often contain words such as “expect,” “anticipate,” “intend,”
“plan,” “believe,” “seek,” “see,” “will,” “would,” “target,” similar expressions, and variations or negatives of these words.
Forward-looking statements by their nature address matters that are, to different degrees, uncertain, such as statements about the consummation of
the proposed transaction and the anticipated benefits thereof. Forward-looking statements are not guarantees of future performance and are based on
certain assumptions and expectations of future events which may not be realized. Forward-looking statements also involve risks and uncertainties,
many of which are beyond the company’s control. Some of the important factors that could cause the company’s actual results to differ materially from
those projected in any such forward-looking statements are: fluctuations in energy and raw material prices; failure to develop and market new
products and optimally manage product life cycles; ability to respond to market acceptance, rules, regulations and policies affecting products based
on biotechnology and, in general, for products for the agriculture industry; outcome of significant litigation and environmental matters, including
realization of associated indemnification assets, if any; failure to appropriately manage process safety and product stewardship issues; changes in
laws and regulations or political conditions; global economic and capital markets conditions, such as inflation, interest and currency exchange rates;
business or supply disruptions; security threats, such as acts of sabotage, terrorism or war, natural disasters and weather events and patterns which
could affect demand as well as availability of products for the agriculture industry; ability to protect and enforce the company’s intellectual property
rights; successful integration of acquired businesses and separation of underperforming or non-strategic assets or businesses; and risks related to the
agreement entered on December 11, 2015, with The Dow Chemical Company pursuant to which the companies have agreed to effect an all-stock
merger of equals, including the completion of the proposed transaction on anticipated terms and timing, the ability to fully and timely realize the
2
expected benefits of the proposed transaction and risks related to the intended business separations contemplated to occur after the completion of the
proposed transaction. Important risk factors relating to the proposed transaction and intended business separations include, but are not limited to, (i)
the completion of the proposed transaction on anticipated terms and timing, including obtaining regulatory approvals, anticipated tax treatment,
unforeseen liabilities, future capital expenditures, revenues, expenses, earnings, synergies, economic performance, indebtedness, financial condition,
losses, future prospects, business and management strategies for the management, expansion and growth of the new combined company’s
operations and other conditions to the completion of the merger, (ii) the various approvals, authorizations and declarations of non-objection from
certain regulatory and governmental authorities may not be obtained, on a timely basis or otherwise, including that these regulatory or governmental
agencies may impose conditions on the granting of such approvals, including requiring the respective Dow and DuPont businesses to divest certain
assets if necessary in order to obtain certain regulatory approvals or otherwise limiting the ability of the combined company to integrate parts of the
DuPont and Dow businesses, (iii) the ability of Dow and DuPont to integrate the business successfully and to achieve anticipated synergies, risks and
costs and pursuit and/or implementation of the potential separations, including anticipated timing, any changes to the configuration of businesses
included in the potential separation if implemented, (iv) the intended separation of the agriculture, material science and specialty products businesses
of the combined company post-mergers in one or more tax efficient transactions on anticipated terms and timing, including a number of conditions
which could delay, prevent or otherwise adversely affect the proposed transactions, including possible issues or delays in obtaining required
regulatory approvals or clearances, disruptions in the financial markets or other potential barriers, (v) continued availability of capital and financing and
rating agency actions, (vi) potential business uncertainty, including changes to existing business relationships, during the pendency of the merger that
could affect DuPont’s financial performance, and (vii) certain restrictions during the pendency of the merger that may impact DuPont’s ability to pursue
certain business opportunities or strategic transactions. These risks, as well as other risks associated with the proposed merger, are more fully
discussed in the joint proxy statement of Dow and DuPont and the prospectus of DowDuPont included in the definitive registration statement on Form
S-4 (File No. 333-209869), (as amended, the Registration Statement). While the list of factors presented here is, and the list of factors presented in
the Registration Statement are, considered representative, no such list should be considered to be a complete statement of all potential risks and
uncertainties. Unlisted factors may present significant additional obstacles to the realization of forward-looking statements. Consequences of material
differences in results as compared with those anticipated in the forward-looking statements could include, among other things, business disruption,
operational problems, financial loss, legal liability to third parties and similar risks, any of which could have a material adverse effect on DuPont’s
consolidated financial condition, results of operations, credit rating or liquidity. The company undertakes no duty to publicly revise or update any
forward-looking statements whether as a result of future developments, new information or otherwise, should circumstances change, except as
otherwise required by securities and other applicable laws.
Developing Markets
Total developing markets is comprised of Developing Asia, Developing Europe, Middle East & Africa, and Latin America. A detailed list of all
developing countries is available on the Earnings News Release link on the Investor Center website at www.dupont.com.
3
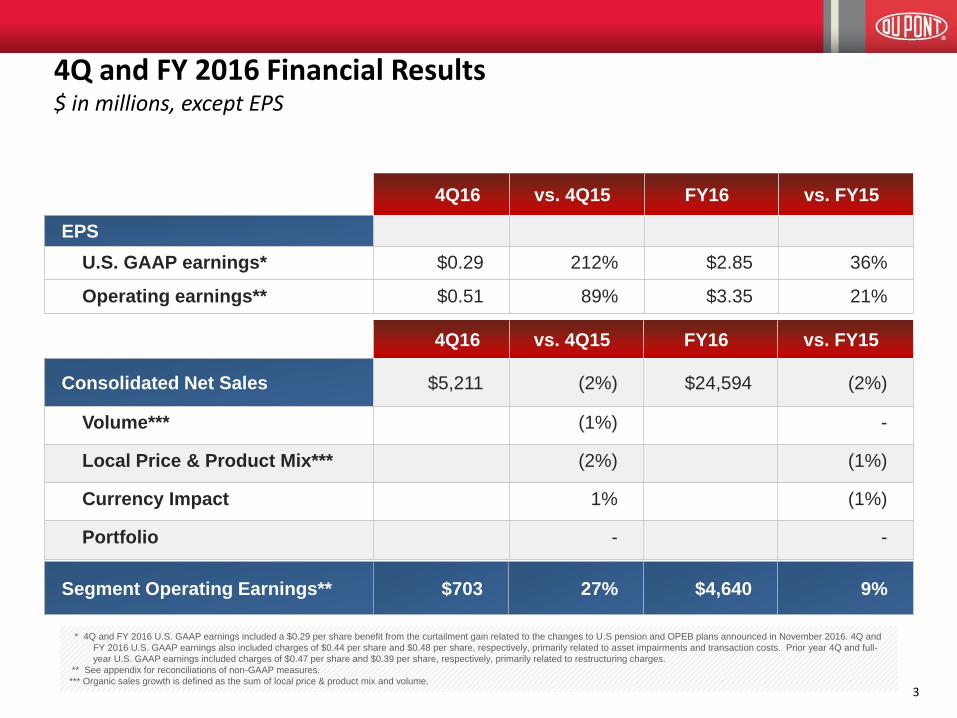
4Q and FY 2016 Financial Results $ in millions, except EPS
* 4Q and FY 2016 U.S. GAAP earnings included a $0.29 per share benefit from the curtailment gain related to the changes to U.S pension and OPEB plans announced in November 2016. 4Q and
FY 2016 U.S. GAAP earnings also included charges of $0.44 per share and $0.48 per share, respectively, primarily related to asset impairments and transaction costs. Prior year 4Q and full-
year U.S. GAAP earnings included charges of $0.47 per share and $0.39 per share, respectively, primarily related to restructuring charges.
** See appendix for reconciliations of non-GAAP measures.
*** Organic sales growth is defined as the sum of local price & product mix and volume.
4Q16 vs. 4Q15 FY16 vs. FY15
EPS
U.S. GAAP earnings* $0.29 212% $2.85 36%
Operating earnings** $0.51 89% $3.35 21%
4Q16 vs. 4Q15 FY16 vs. FY15
Consolidated Net Sales $5,211 (2%) $24,594 (2%)
Volume*** (1%) -
Local Price & Product Mix*** (2%) (1%)
Currency Impact 1% (1%)
Portfolio - -
Segment Operating Earnings** $703 27% $4,640 9%
4 4
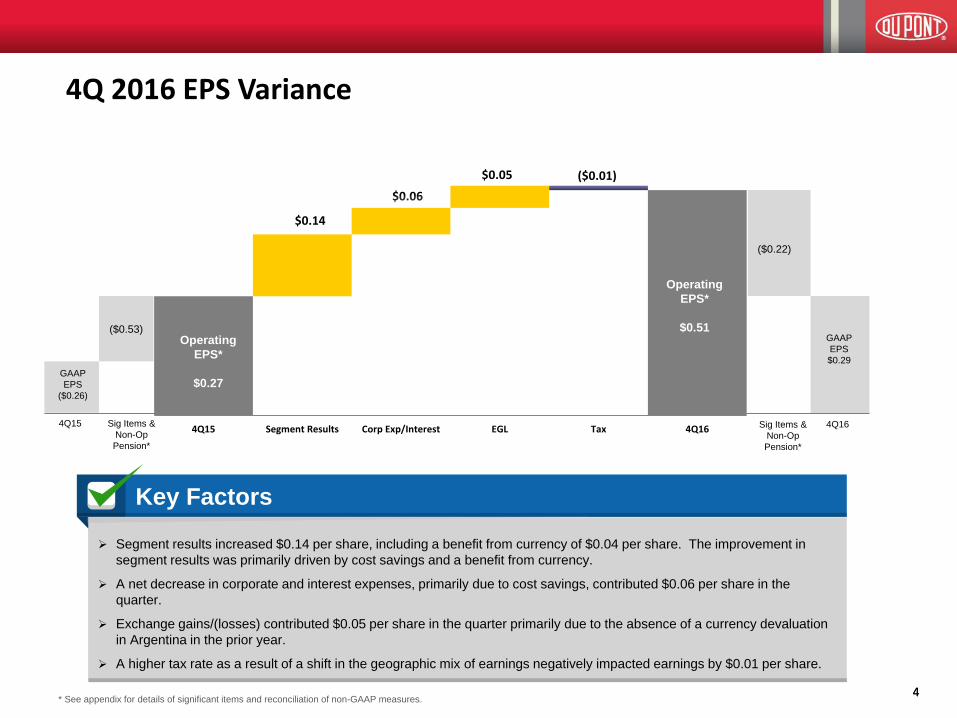
4Q 2016 EPS Variance
$0.14
$0.05
$0.06
($0.01)
4Q15 Segment Results Corp Exp/Interest EGL Tax 4Q16
($0.53)
GAAP
EPS
($0.26)
4Q15 Sig Items &
Non-Op
Pension*
($0.22)
GAAP
EPS
$0.29
4Q16 Sig Items &
Non-Op
Pension*
Operating
EPS*
$0.27
Operating
EPS*
$0.51
Segment results increased $0.14 per share, including a benefit from currency of $0.04 per share. The improvement in
segment results was primarily driven by cost savings and a benefit from currency.
A net decrease in corporate and interest expenses, primarily due to cost savings, contributed $0.06 per share in the
quarter.
Exchange gains/(losses) contributed $0.05 per share in the quarter primarily due to the absence of a currency devaluation
in Argentina in the prior year.
A higher tax rate as a result of a shift in the geographic mix of earnings negatively impacted earnings by $0.01 per share.
Key Factors
* See appendix for details of significant items and reconciliation of non-GAAP measures.
5 5 *See appendix for details of significant items and reconciliation of non-GAAP measures
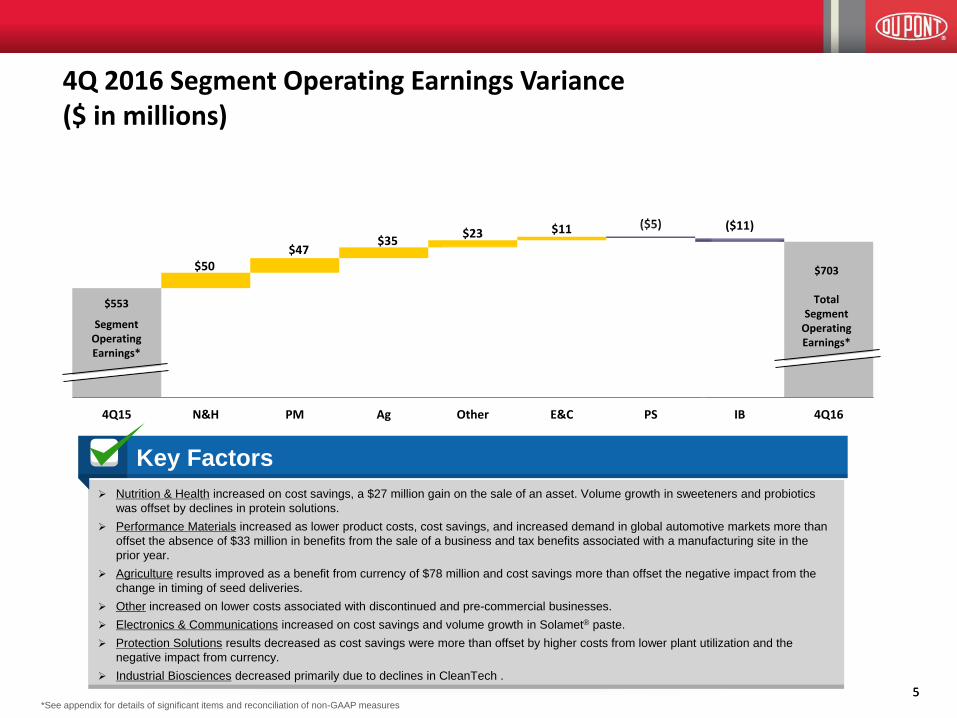
Nutrition & Health increased on cost savings, a $27 million gain on the sale of an asset. Volume growth in sweeteners and probiotics
was offset by declines in protein solutions.
Performance Materials increased as lower product costs, cost savings, and increased demand in global automotive markets more than
offset the absence of $33 million in benefits from the sale of a business and tax benefits associated with a manufacturing site in the
prior year.
Agriculture results improved as a benefit from currency of $78 million and cost savings more than offset the negative impact from the
change in timing of seed deliveries.
Other increased on lower costs associated with discontinued and pre-commercial businesses.
Electronics & Communications increased on cost savings and volume growth in Solamet® paste.
Protection Solutions results decreased as cost savings were more than offset by higher costs from lower plant utilization and the
negative impact from currency.
Industrial Biosciences decreased primarily due to declines in CleanTech .
Key Factors
$50 $47
$35 $23 $11 ($5) ($11)
4Q15 N&H PM Ag Other E&C PS IB 4Q16
$553
Segment Operating Earnings*
$703
Total Segment
Operating Earnings*
4Q 2016 Segment Operating Earnings Variance ($ in millions)
6 6
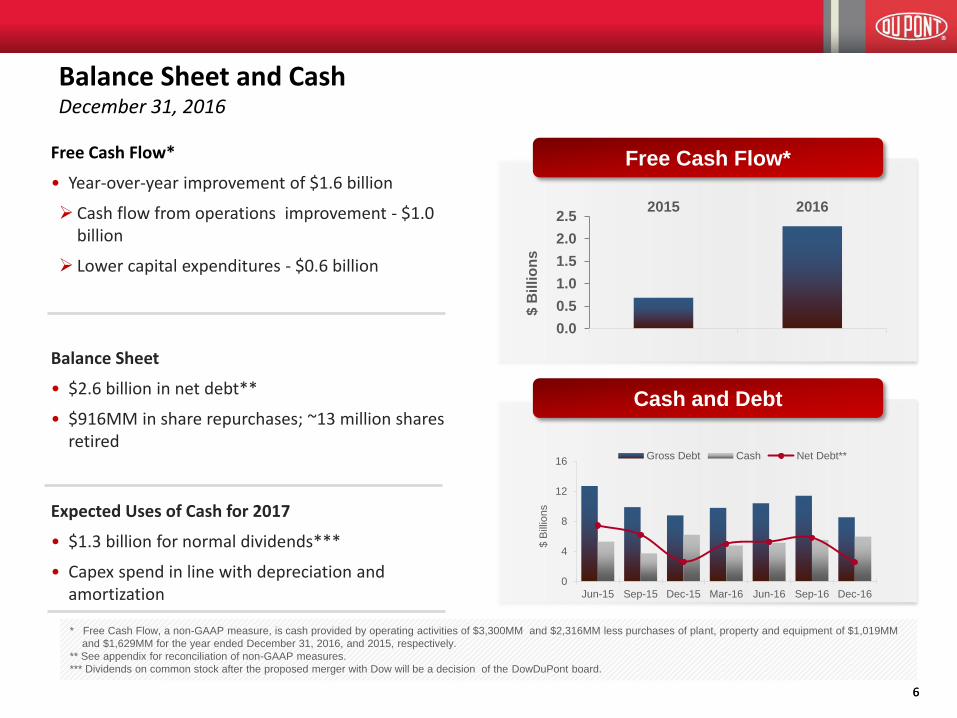
Balance Sheet and Cash December 31, 2016
Free Cash Flow*
• Year-over-year improvement of $1.6 billion
Cash flow from operations improvement - $1.0 billion
Lower capital expenditures - $0.6 billion
Balance Sheet
• $2.6 billion in net debt**
• $916MM in share repurchases; ~13 million shares retired
Expected Uses of Cash for 2017
• $1.3 billion for normal dividends***
• Capex spend in line with depreciation and amortization
0.0
0.5
1.0
1.5
2.0
2.52015 2016
$ B
illi
on
s
0
4
8
12
16
Jun-15 Sep-15 Dec-15 Mar-16 Jun-16 Sep-16 Dec-16
$ B
illio
ns
Gross Debt Cash Net Debt**
Free Cash Flow*
Cash and Debt
* Free Cash Flow, a non-GAAP measure, is cash provided by operating activities of $3,300MM and $2,316MM less purchases of plant, property and equipment of $1,019MM
and $1,629MM for the year ended December 31, 2016, and 2015, respectively.
** See appendix for reconciliation of non-GAAP measures.
*** Dividends on common stock after the proposed merger with Dow will be a decision of the DowDuPont board.
2013 Highlights
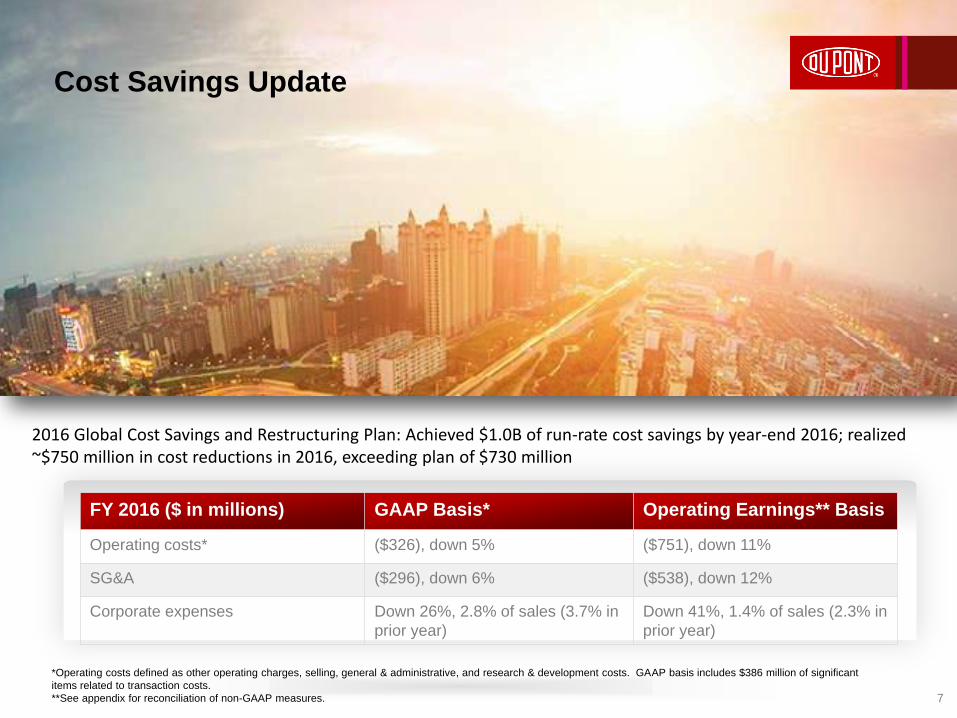
Cost Savings Update
2016 Global Cost Savings and Restructuring Plan: Achieved $1.0B of run-rate cost savings by year-end 2016; realized ~$750 million in cost reductions in 2016, exceeding plan of $730 million
FY 2016 ($ in millions) GAAP Basis* Operating Earnings** Basis
Operating costs* ($326), down 5% ($751), down 11%
SG&A ($296), down 6% ($538), down 12%
Corporate expenses Down 26%, 2.8% of sales (3.7% in
prior year)
Down 41%, 1.4% of sales (2.3% in
prior year)
*Operating costs defined as other operating charges, selling, general & administrative, and research & development costs. GAAP basis includes $386 million of significant
items related to transaction costs.
**See appendix for reconciliation of non-GAAP measures. 7
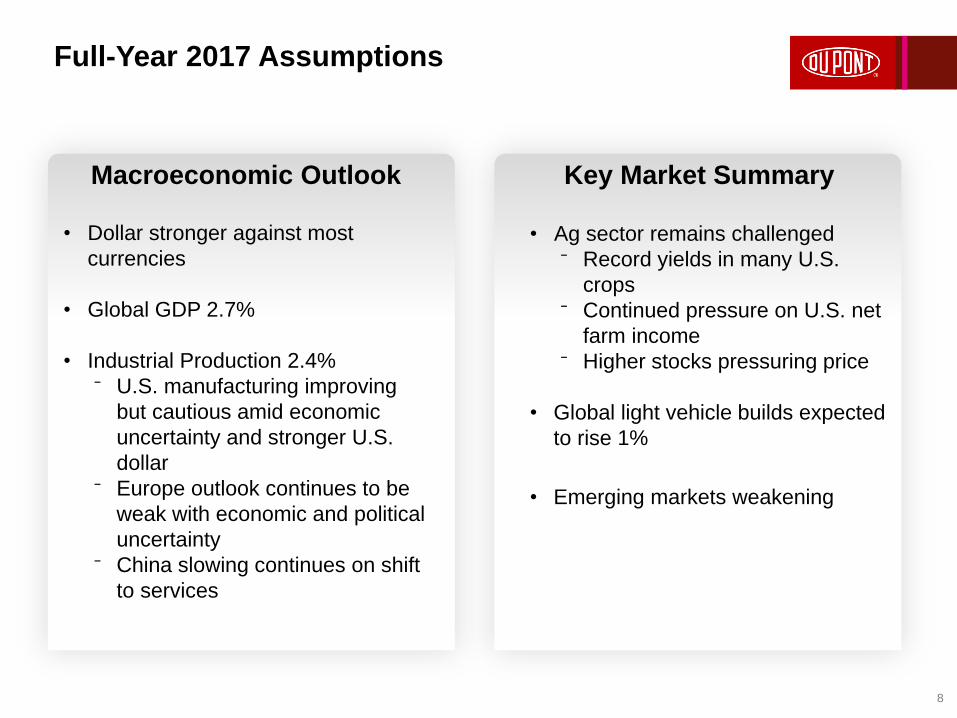
Full-Year 2017 Assumptions
8
Key Market Summary Macroeconomic Outlook
• Ag sector remains challenged
⁻ Record yields in many U.S.
crops
⁻ Continued pressure on U.S. net
farm income
⁻ Higher stocks pressuring price
• Global light vehicle builds expected
to rise 1%
• Emerging markets weakening
• Dollar stronger against most
currencies
• Global GDP 2.7%
• Industrial Production 2.4%
⁻ U.S. manufacturing improving
but cautious amid economic
uncertainty and stronger U.S.
dollar
⁻ Europe outlook continues to be
weak with economic and political
uncertainty
⁻ China slowing continues on shift
to services
9
First-Quarter 2017 Expectations and Outlook
* See appendix for reconciliation of Non-GAAP measures
• Net sales about even with prior year as the impact of the timing of seed shipments driven by the southern U.S. route-to-market change in Agriculture and strength in global automotive markets will be partially offset by the expected reduction in planted corn acres in the U.S.
• U.S. GAAP EPS down 18 percent versus prior year
– Transaction costs for merger with Dow of ~$0.15 per share – Non-operating pension expense of ~$0.07 per share – Prior year net benefit from significant items of $0.18 per share
• Operating EPS* growth of about 8 percent versus prior year – Currency about $0.01 headwind in the quarter
• Base tax rate ~22-23 percent – Unfavorable versus prior year due to anticipated geographic mix of earnings
• FY 2017 capital expenditures in line with depreciation & amortization
10 10
Nutrition & Health
4Q14 4Q15 4Q16
0%
6%
12%
18%
30
60
90
120
150
Marg
in
$ in
Millio
ns
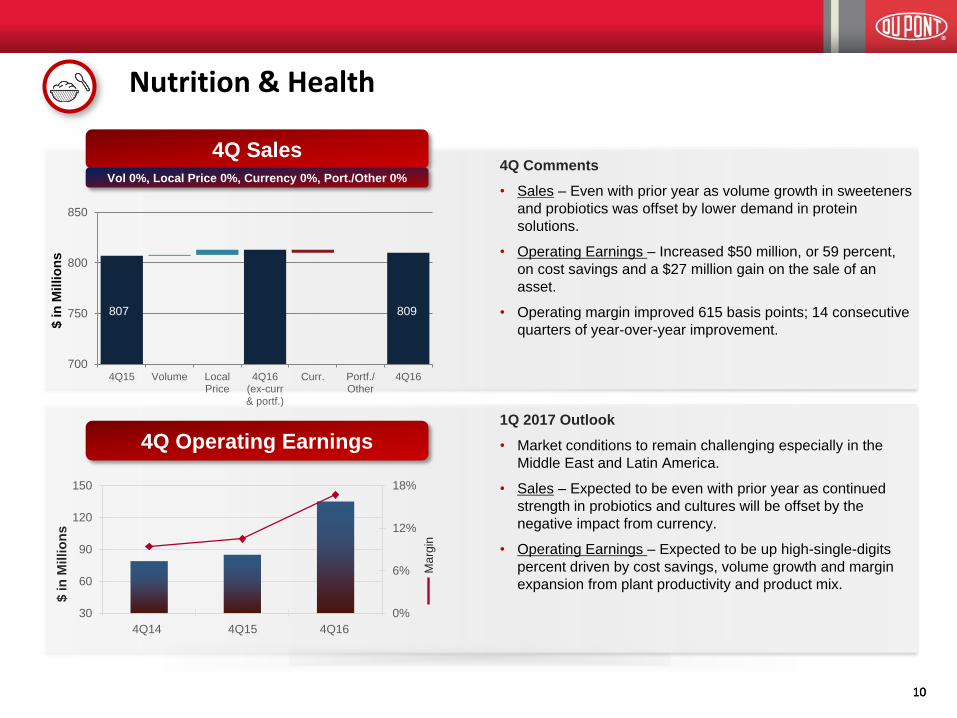
4Q Comments
• Sales – Even with prior year as volume growth in sweeteners
and probiotics was offset by lower demand in protein
solutions.
• Operating Earnings – Increased $50 million, or 59 percent,
on cost savings and a $27 million gain on the sale of an
asset.
• Operating margin improved 615 basis points; 14 consecutive
quarters of year-over-year improvement.
1Q 2017 Outlook
• Market conditions to remain challenging especially in the
Middle East and Latin America.
• Sales – Expected to be even with prior year as continued
strength in probiotics and cultures will be offset by the
negative impact from currency.
• Operating Earnings – Expected to be up high-single-digits
percent driven by cost savings, volume growth and margin
expansion from plant productivity and product mix.
4Q Operating Earnings
4Q Sales Vol 0%, Local Price 0%, Currency 0%, Port./Other 0%
700
750
800
850
4Q15 Volume LocalPrice
4Q16(ex-curr& portf.)
Curr. Portf./Other
4Q16
$ in
Millio
ns
807 809
11 11
Performance Materials
4Q14 4Q15 4Q16
0%
6%
12%
18%
24%
30%
0
80
160
240
320
400
Marg
in
$ in
Millio
ns
4Q Operating Earnings
4Q Sales
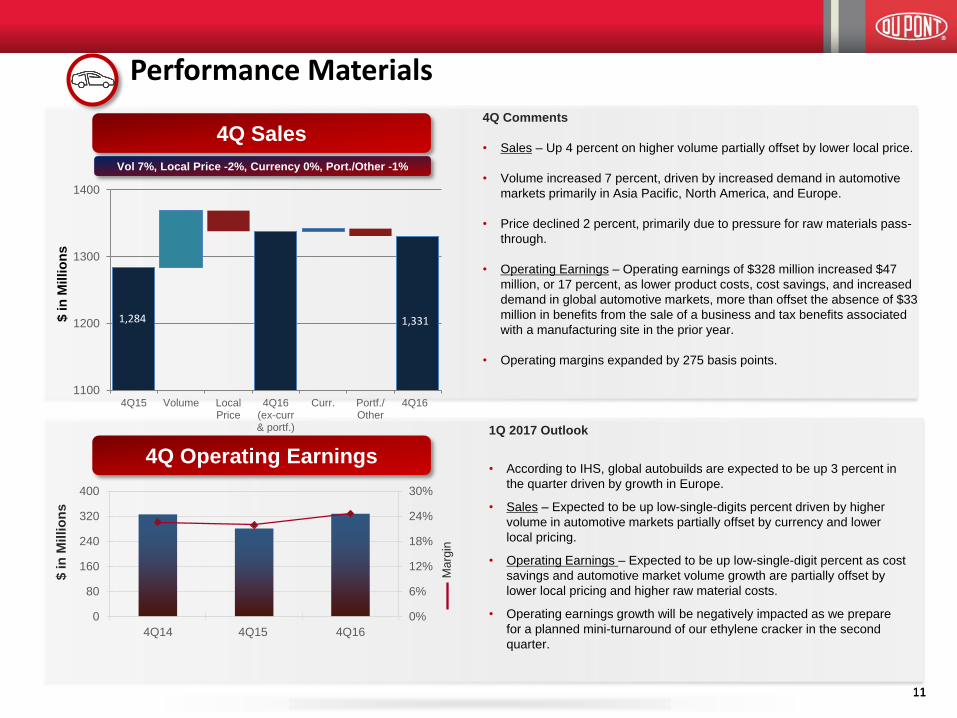
Vol 7%, Local Price -2%, Currency 0%, Port./Other -1%
$ in
Millio
ns
1,284
1100
1200
1300
1400
4Q15 Volume LocalPrice
4Q16(ex-curr& portf.)
Curr. Portf./Other
4Q16
1,331
4Q Comments
• Sales – Up 4 percent on higher volume partially offset by lower local price.
• Volume increased 7 percent, driven by increased demand in automotive
markets primarily in Asia Pacific, North America, and Europe.
• Price declined 2 percent, primarily due to pressure for raw materials pass-
through.
• Operating Earnings – Operating earnings of $328 million increased $47
million, or 17 percent, as lower product costs, cost savings, and increased
demand in global automotive markets, more than offset the absence of $33
million in benefits from the sale of a business and tax benefits associated
with a manufacturing site in the prior year.
• Operating margins expanded by 275 basis points.
1Q 2017 Outlook
• According to IHS, global autobuilds are expected to be up 3 percent in
the quarter driven by growth in Europe.
• Sales – Expected to be up low-single-digits percent driven by higher
volume in automotive markets partially offset by currency and lower
local pricing.
• Operating Earnings – Expected to be up low-single-digit percent as cost
savings and automotive market volume growth are partially offset by
lower local pricing and higher raw material costs.
• Operating earnings growth will be negatively impacted as we prepare
for a planned mini-turnaround of our ethylene cracker in the second
quarter.
12 12
Agriculture Pioneer, Crop Protection
4Q14 4Q15 4Q16
-20.0%
-10.0%
0.0%
10.0%
-100
-50
0
50
100
150
Marg
in
$ in
Millio
ns
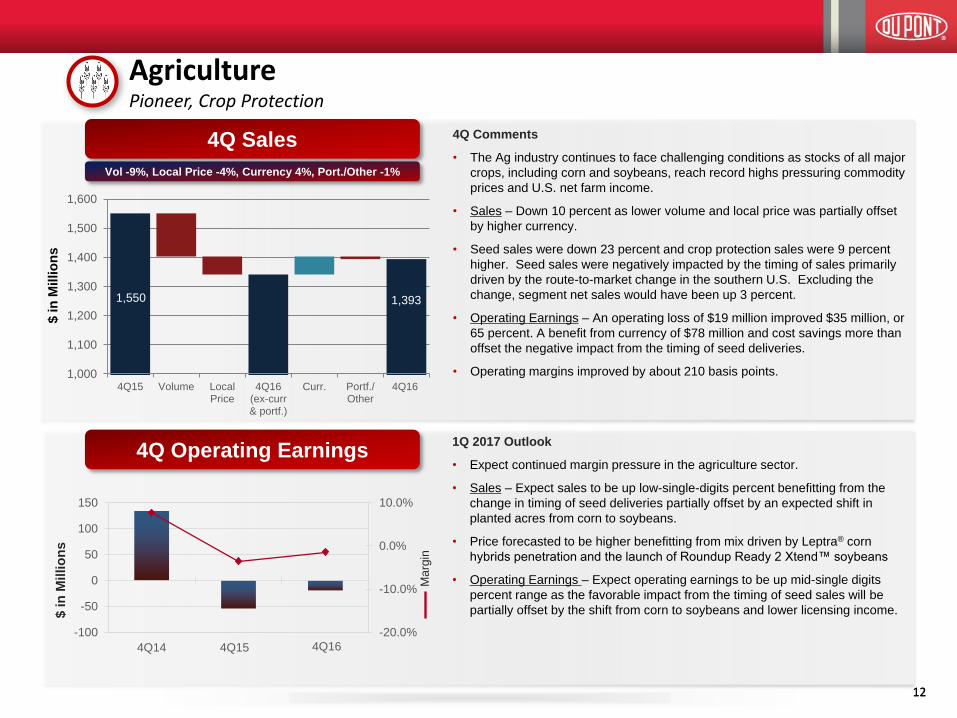
1Q 2017 Outlook
• Expect continued margin pressure in the agriculture sector.
• Sales – Expect sales to be up low-single-digits percent benefitting from the
change in timing of seed deliveries partially offset by an expected shift in
planted acres from corn to soybeans.
• Price forecasted to be higher benefitting from mix driven by Leptra® corn
hybrids penetration and the launch of Roundup Ready 2 Xtend™ soybeans
• Operating Earnings – Expect operating earnings to be up mid-single digits
percent range as the favorable impact from the timing of seed sales will be
partially offset by the shift from corn to soybeans and lower licensing income.
4Q Comments
• The Ag industry continues to face challenging conditions as stocks of all major
crops, including corn and soybeans, reach record highs pressuring commodity
prices and U.S. net farm income.
• Sales – Down 10 percent as lower volume and local price was partially offset
by higher currency.
• Seed sales were down 23 percent and crop protection sales were 9 percent
higher. Seed sales were negatively impacted by the timing of sales primarily
driven by the route-to-market change in the southern U.S. Excluding the
change, segment net sales would have been up 3 percent.
• Operating Earnings – An operating loss of $19 million improved $35 million, or
65 percent. A benefit from currency of $78 million and cost savings more than
offset the negative impact from the timing of seed deliveries.
• Operating margins improved by about 210 basis points.
4Q Operating Earnings
4Q Sales
Vol -9%, Local Price -4%, Currency 4%, Port./Other -1%
1,000
1,100
1,200
1,300
1,400
1,500
1,600
4Q15 Volume LocalPrice
4Q16(ex-curr& portf.)
Curr. Portf./Other
4Q16
1,550
$ in
Millio
ns
1,393
13 13
Electronics & Communications
4Q14 4Q15 4Q16
0%
5%
10%
15%
20%
25%
0
30
60
90
120
Marg
in
$ in
Millio
ns
4Q Comments
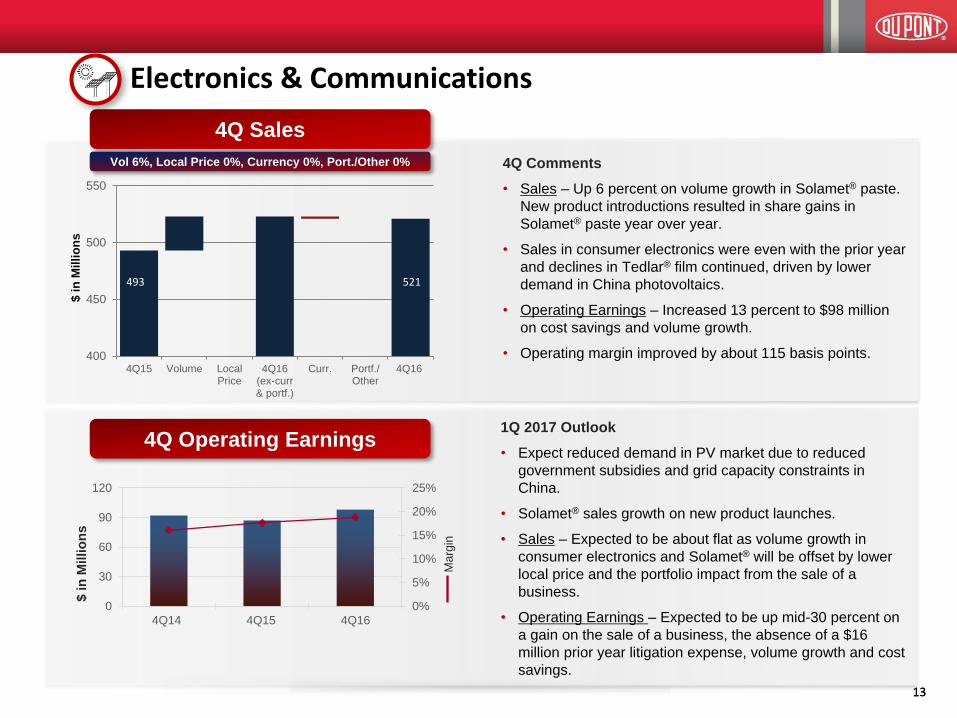
• Sales – Up 6 percent on volume growth in Solamet® paste.
New product introductions resulted in share gains in
Solamet® paste year over year.
• Sales in consumer electronics were even with the prior year
and declines in Tedlar® film continued, driven by lower
demand in China photovoltaics.
• Operating Earnings – Increased 13 percent to $98 million
on cost savings and volume growth.
• Operating margin improved by about 115 basis points.
1Q 2017 Outlook
• Expect reduced demand in PV market due to reduced
government subsidies and grid capacity constraints in
China.
• Solamet® sales growth on new product launches.
• Sales – Expected to be about flat as volume growth in
consumer electronics and Solamet® will be offset by lower
local price and the portfolio impact from the sale of a
business.
• Operating Earnings – Expected to be up mid-30 percent on
a gain on the sale of a business, the absence of a $16
million prior year litigation expense, volume growth and cost
savings.
4Q Operating Earnings
4Q Sales
Vol 6%, Local Price 0%, Currency 0%, Port./Other 0%
400
450
500
550
4Q15 Volume LocalPrice
4Q16(ex-curr& portf.)
Curr. Portf./Other
4Q16
$ i
n M
illi
on
s
493 521
14 14
Protection Solutions
4Q14 4Q15 4Q16 0%
5%
10%
15%
20%
25%
0
50
100
150
200
Marg
in
$ in
Millio
ns
4Q Operating Earnings
4Q Sales
Vol 0%, Local Price 0%, Currency 0%, Port./Other 0%
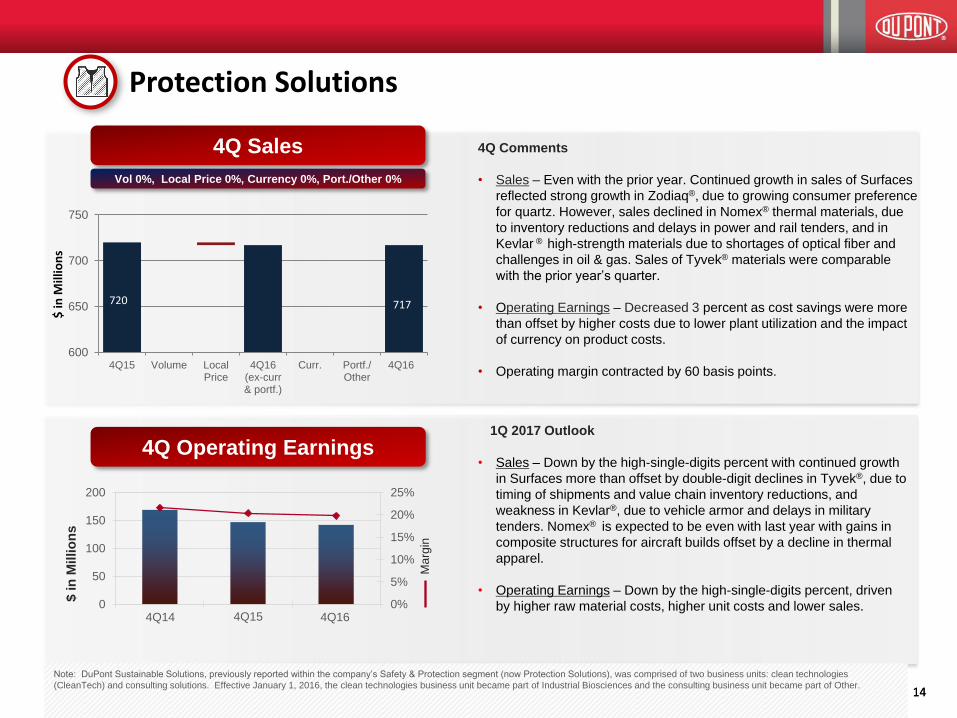
Note: DuPont Sustainable Solutions, previously reported within the company’s Safety & Protection segment (now Protection Solutions), was comprised of two business units: clean technologies
(CleanTech) and consulting solutions. Effective January 1, 2016, the clean technologies business unit became part of Industrial Biosciences and the consulting business unit became part of Other.
600
650
700
750
4Q15 Volume LocalPrice
4Q16(ex-curr& portf.)
Curr. Portf./Other
4Q16
720 717
$ in
Mill
ion
s
4Q Comments
• Sales – Even with the prior year. Continued growth in sales of Surfaces
reflected strong growth in Zodiaq®, due to growing consumer preference
for quartz. However, sales declined in Nomex® thermal materials, due
to inventory reductions and delays in power and rail tenders, and in
Kevlar ® high-strength materials due to shortages of optical fiber and
challenges in oil & gas. Sales of Tyvek® materials were comparable
with the prior year’s quarter.
• Operating Earnings – Decreased 3 percent as cost savings were more
than offset by higher costs due to lower plant utilization and the impact
of currency on product costs.
• Operating margin contracted by 60 basis points.
1Q 2017 Outlook
• Sales – Down by the high-single-digits percent with continued growth
in Surfaces more than offset by double-digit declines in Tyvek®, due to
timing of shipments and value chain inventory reductions, and
weakness in Kevlar®, due to vehicle armor and delays in military
tenders. Nomex® is expected to be even with last year with gains in
composite structures for aircraft builds offset by a decline in thermal
apparel.
• Operating Earnings – Down by the high-single-digits percent, driven
by higher raw material costs, higher unit costs and lower sales.
15 15
Industrial Biosciences
4Q14 4Q15 4Q16 0.0%
6.0%
12.0%
18.0%
24.0%
0
20
40
60
80
100
Marg
in
$ in
Millio
ns
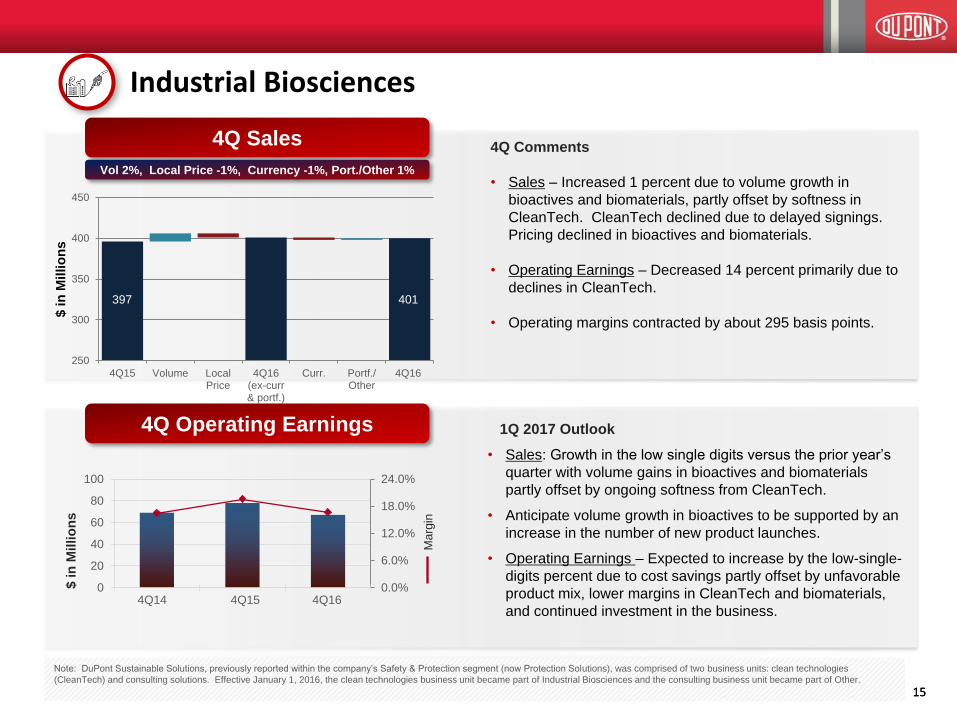
Note: DuPont Sustainable Solutions, previously reported within the company’s Safety & Protection segment (now Protection Solutions), was comprised of two business units: clean technologies
(CleanTech) and consulting solutions. Effective January 1, 2016, the clean technologies business unit became part of Industrial Biosciences and the consulting business unit became part of Other.
4Q Operating Earnings
4Q Sales
Vol 2%, Local Price -1%, Currency -1%, Port./Other 1%
250
300
350
400
450
4Q15 Volume LocalPrice
4Q16(ex-curr& portf.)
Curr. Portf./Other
4Q16
$ in
Millio
ns
397 401
4Q Comments
• Sales – Increased 1 percent due to volume growth in
bioactives and biomaterials, partly offset by softness in
CleanTech. CleanTech declined due to delayed signings.
Pricing declined in bioactives and biomaterials.
• Operating Earnings – Decreased 14 percent primarily due to
declines in CleanTech.
• Operating margins contracted by about 295 basis points.
1Q 2017 Outlook
• Sales: Growth in the low single digits versus the prior year’s
quarter with volume gains in bioactives and biomaterials
partly offset by ongoing softness from CleanTech.
• Anticipate volume growth in bioactives to be supported by an
increase in the number of new product launches.
• Operating Earnings – Expected to increase by the low-single-
digits percent due to cost savings partly offset by unfavorable
product mix, lower margins in CleanTech and biomaterials,
and continued investment in the business.

16
Appendix 1
Fourth Quarter and Full Year 2016 Segment Commentary
This data should be read in conjunction with the Company’s fourth quarter and full year earnings news release
dated January 24, 2017, DuPont’s 4Q 2016 Earnings Conference Call presentation materials and reconciliations of
non-GAAP to GAAP measures included in the presentation materials and posted on the DuPont Investor Center
website at www.dupont.com.
17
Nutrition & Health
In Nutrition & Health, the business continued to deliver strong results with its fourteenth consecutive quarter of margin improvement. Sales of $809 million were even with the prior year. Volume growth in sweeteners and probiotics was offset by lower demand in protein solutions. From a regional perspective, demand for probiotics drove sales growth in Asia Pacific and North America in the quarter. Operating earnings of $135 million increased $50 million, or 59 percent, on cost savings and a $27 million gain on the sale of an asset. Operating margin expanded by 615 basis points year over year. For the full year, sales of $3.3 billion were even with the prior year as 2-percent volume growth in a challenging market was offset by the negative impact of currency. Operating earnings increased $131 million, or 35 percent, on cost savings, volume growth and a $27 million gain on the sale of an asset. Full-year operating margin improved by about 400 basis points. Looking forward to 2017, market conditions are expected to remain challenging, particularly in the Middle East and Latin America. In the first quarter, we expect sales to be about even with prior year as continued volume growth in probiotics and cultures will be offset by the negative currency impact. First-quarter operating earnings are expected to be up high-single-digits percent, benefitting from cost savings, volume growth, and margin expansion from plant productivity and product mix.
Segment Commentary Fourth-Quarter Earnings 2016
18
Performance Materials
Sales of $1.3 billion rose 4 percent over prior year, driven by higher volume. Price declined 2 percent in the quarter, driven by pricing pressures related to raw material pass-through.
Segment volume increased 7 percent due to increased demand in automotive markets with strong volume growth in the Asia Pacific, U.S., and Europe. In the quarter, DuPont polymer volumes outperformed autobuild growth, as reported by IHS.
According to IHS, global automotive demand rose about 6 percent in the fourth quarter with strong growth in the Asia Pacific region, primarily China. IHS is reporting year-over-year growth of 4 percent in 2016.
Operating earnings of $328 million increased 17 percent as lower product costs, cost savings, and increased volume were partially offset by the absence of $33MM in one-time benefits which occurred in the fourth quarter of 2015. The benefits were due to the sale of a business and realization of tax benefits associated with a manufacturing site. Operating margins expanded by about 275 basis points to 25 percent.
Segment Commentary Fourth-Quarter Earnings 2016
19
Performance Materials (continued)
For the full year, sales of $5.3 billion declined 1 percent as 3-percent higher volumes were more than offset by 3-percent lower prices and 1-percent lower currency. Pricing declines were driven by pressures related to raw material pass-through. Operating earnings of $1.3 billion rose 7 percent as cost savings, higher volumes, and lower raw material costs, were partially offset by currency and lower pricing. Segment operating margins rose by about 180 basis points to 25 percent.
For the first quarter, we expect sales and operating earnings to be up in the low-single digits range. First-quarter results will be negatively impacted as we prepare for a mini-turnaround of our ethylene cracker in the second quarter.
IHS is forecasting 1-percent growth in 2017 with 3-percent growth in the first quarter. IHS is forecasting a dramatic decline in China autobuilds and is signaling no growth in 2017 vs. 13-percent growth in 2016. North America is forecasted, by IHS, to decline 1 percent in 2017 due to high dealer inventory.
Segment Commentary Fourth-Quarter Earnings 2016
20
Agriculture
The Ag industry continues to face challenging conditions as stocks of all major crops, including corn and soybeans, reach record highs, pressuring commodity prices and U.S. net farm income. However, globally, demand continues to post record highs, which places the need for innovation at even more of a premium in order to maintain balance in the industry.
Fourth-quarter Agriculture sales were 10 percent lower as 9-percent lower volume and 4-percent lower price was partially offset by 4-percent higher currency. Seed sales declined 23 percent, and crop protection sales increased 9 percent. Seed sales were negatively impacted this quarter by the shift in timing of sales, primarily related to the southern U.S. route-to-market change, which moved approximately $200 million of sales from the fourth quarter of 2016 into the first quarter of 2017. Excluding this change, segment sales would have increased 3 percent.
Higher corn volumes in Latin America were driven by the continued penetration of our Leptra® corn hybrids but were more than offset by the timing of seed sales. Corn sales volume for the summer season in Brazil increased nearly 70 percent on the strength of the Leptra® launch. Crop Protection delivered growth in Asia Pacific, EMEA, and North America driven by our insecticides business.
An operating loss of $19 million resulted in $35 million higher operating earnings than last year, as favorable currency and cost savings were partially offset by lower sales. Operating margins expanded by about 210 basis points.
Segment Commentary Fourth-Quarter Earnings 2016
21
Agriculture (continued) For the full year, sales declined 3 percent driven by 2-percent lower currency and 1-percent lower volume. Full year volume was also negatively impacted by the timing of seed sales in the fourth quarter. Excluding the change in timing of 4Q seed sales, segment sales would have declined by 1 percent. Full-year operating earnings rose 7 percent, driven by cost savings and lower product costs partially offset by lower volume and the negative impact of currency. Operating earnings margins expanded for the year by about 170 basis points.
In North America corn, our newest classes of genetics demonstrated strong harvest performance and products released in the past two years accounted for more than half of our volume. Led by the launch of Leptra®, we grew volume nearly 70 percent in Brazil summer season and enabled a multiple point share gain. In soybeans, our T-series comprised greater than 80 percent of our soybean lineup in North America and we launched our first varieties developed with AYT 4.0, an advanced proprietary soybean breeding approach focused on increasing yield. Within crop protection, Rynaxypyr® insecticide delivered sales growth in Asia Pacific, Europe, and North America and our Zorvec® fungicide launch went better than plan.
Turning to the outlook for 2017, we expect the economic environment in the agriculture sector to remain challenging with commodity prices under pressure resulting from record yields and crop production. As farmers look to relative economics between crop alternatives, we expect them to favor soybeans over corn in North America which is generally unfavorable to our overall earnings. Our order book in North America is tracking with our expectations and is consistent with the expected planted acre shift. In Crop Protection, we expect the industry decline to ease in 2017 but continue to be negatively impacted by high inventory levels, a stronger dollar, and the continued penetration of insect-resistant soybeans.
Segment Commentary Fourth-Quarter Earnings 2016
22
Agriculture (continued) This season we are expanding our launch of Roundup Ready 2 Xtend™ soybeans and anticipate FeXapan®, our over-the-top dicamba application, to be approved in time for Spring planting. We expect continued Leptra® penetration in Brazil as we continue one of the fastest ramp-ups in our history. We are planning a limited commercial introduction of Pioneer® brand Qrome products for the 2017 U.S. growing season. This will allow select growers to benefit from this new technology and will allow customers to see and understand the value of these elite new products in their local geographies. Within digital ag, growers received value from Encirca ServicesSM on more than 2 million paid acres in 2016 and we expect this to approximately double in 2017. Our approach stands apart from competitors in that our nitrogen, fertility, and seeding solutions can deliver measurable profit gains for our customers enabling a premium value offering. For example, in over 120 nitrogen service innovation trials, Encirca® beat the standard grower practice 74% of the time with an average yield increase of six bushels per acre using an average of nine pounds less nitrogen per acre. In Crop Protection, we will launch Vessarya®, expanding our portfolio of fungicides to Asian soybean rust, and continue the highly successful launch of Zorvec®. For the first quarter of 2017, we expect Agriculture segment sales to be up low-single digits percent over 2016 and operating earnings to be up in the mid-single digits percent range as favorable impacts from the timing shifts and pricing are partially offset by the corn-to-soybean shift in North America. Within crop protection, we anticipate our carbamate products, Vydate® and Lannate®, to deliver earnings growth as volume increases and we complete wind down activities at the LaPorte facility. As farm margins continue to tighten, the need for high yields becomes even more imperative and we are confident our portfolio can address this need through our pipeline of new genetics, unique trait combinations and innovative crop protection solutions. In 2016, we executed on significant cost reductions which enabled DuPont Agriculture to perform well in the current conditions and positions us to emerge stronger when markets improve.
Segment Commentary Fourth-Quarter Earnings 2016
23
Electronics & Communications In Electronics & Communications, fourth-quarter sales of $521 million increased 6 percent on volume growth in Solamet® paste. New product introductions resulted in share gains in Solamet® year over year. Sales in consumer electronics were even with the prior year while declines in Tedlar® film continued, driven by lower photovoltaics demand in China. Operating earnings of $98 million increased $11 million, or 13 percent, on cost savings and volume growth. Operating margin expanded by about 115 basis points year over year. For the full year, sales of $2.0 billion were 5 percent lower on weakness in consumer electronics markets. Share gains in Solamet® and higher average metals price were offset by Tedlar® declines. Operating earnings were even with the prior year as cost savings were offset by lower sales and a $16 million litigation expense. Full-year operating margins expanded by about 90 basis points. Looking forward to 2017, we expect continued softness in key markets. Module installations in the photovoltaic market are forecasted to increase mid-single-digits percent, down significantly from prior-year growth rates due to reduced government subsidies and grid capacity constraints in China. We expect to see continue volume improvement in Solamet® on expected new product introductions but with continued competitive pricing pressure. Although we expect some improvement in consumer electronics, we expect fundamentally slower growth rates in this market compared with historical trends. For the first quarter we expect sales to be about flat with prior year as volume growth in consumer electronics and Solamet® will be offset by lower local price and the portfolio impact from the sale of a business. Operating earnings are expected to increase mid-30 percent. A gain on the sale of a business, the absence of a $16 million prior year litigation expense, volume growth and cost savings all are expected to contribute to operating earnings growth.
Segment Commentary Fourth-Quarter Earnings 2016
24
Protection Solutions* Sales of $717 million for Protection Solutions in the fourth quarter were comparable with the prior year. Price, volume, currency and portfolio did not materially impact sales of the segment.
Continued growth in Surfaces -- including double-digit growth in Zodiaq®, which benefited from consumer preference for quartz -- was offset by declines in Nomex® thermal resistant fiber due to inventory reductions in Europe and delays in key power and rail tenders in Asia Pacific; and softness in Kevlar® high strength materials, which was impacted by shortages of optical fiber, challenges in the oil and gas industry and weakness in the North America ballistics market. Sales of Tyvek® material were similar to the prior year with gains in housewrap, which benefited from U.S. housing starts, offset by lower sales in graphics, envelopes, and auto covers in the OEM market.
Operating earnings of $142 million decreased 3 percent for the quarter, or $5 million, reflecting higher costs due to lower plant utilization and the negative impact from currency in product costs, partly offset by cost savings. Operating earnings margin contracted by about 60 basis points.
* DuPont Sustainable Solutions, previously within this segment, was comprised of two business units: Clean Technologies and consulting solutions. On 1/1/2016, the Clean Technologies business unit became part of Industrial Biosciences, and consulting solutions became part of Other. Reclassification of prior-year data has been made to reflect the current-year classification.
Segment Commentary Fourth-Quarter Earnings 2016
25
Protection Solutions* (continued)
Sales of $3.0 billion for 2016 declined 3 percent versus the prior year. The decline in sales resulted from a 2-percent decline in volume and a 1-percent reduction from price/mix. Demand from the oil and gas industry and the military remained soft. Lower sales of Nomex®, Kevlar® and Tyvek® were partly offset by gains in sales from Surfaces.
Operating earnings of $668 million increased 4 percent for the year, reflecting cost savings partly offset by the sales decline. Operating earnings margin expanded by about 150 basis points.
Turning to the first quarter, sales are projected to decline by the high-single digits. Continued growth in Surfaces is expected to be more than offset by declines in Tyvek® and Kevlar®. Tyvek® weakness is associated with timing of shipments in the fourth quarter and inventory reductions, while weakness in Kevlar® is due to vehicle armor and declines in military tenders. Partly because of lower petroleum production activity, sales of Nomex® are expected to be flat despite gains in composite structures for aircraft builds. We anticipate that our operating earnings will decline by the high-single-digits percent, due to higher raw material costs, higher unit rates and lower sales, partly offset by cost savings.
* DuPont Sustainable Solutions, previously within this segment, was comprised of two business units: Clean Technologies and consulting
solutions. On 1/1/2016, the Clean Technologies business unit became part of Industrial Biosciences, and consulting solutions became part of Other. Reclassification of prior-year data has been made to reflect the current-year classification.
Segment Commentary Fourth-Quarter Earnings 2016
26
Industrial Biosciences* Fourth-quarter sales of $401 million for Industrial Biosciences increased 1 percent. Volumes for the segment rose by 2 percent, driven by bioactives and biomaterials, and portfolio added 1 percent; however, local price and currency each subtracted 1 percent. CleanTech licensing volumes declined amid delayed signings in key projects. Growth in bioactives reflected volume gains associated with new product launches and gains in food and grain processing, partly offset by volume declines in animal nutrition. Sales of biomaterials rose due to strong volume growth in apparel, partially offset by pricing headwinds in flooring. Operating earnings of $67 million decreased $11 million, or 14 percent, in the quarter primarily due to declines in CleanTech. Operating margins contracted by about 295 basis points. Full-year sales of $1.5 billion for Industrial Biosciences increased 1 percent. Volumes for the segment rose by 2 percent and portfolio added another 1 percent, while currency subtracted 2 percent. Strong growth in bioactives and biomaterials more than offset lower CleanTech licensing volumes. The strong growth in bioactives reflected volume gains associated with new product launches and gains in home and personal care products, food and grain processing. Sales of biomaterials rose due to volume growth in apparel, partially offset by softness in flooring.
* On 1/1/2016, the Clean Technologies business unit within DuPont Protection Solutions became part of Industrial Biosciences. Reclassification of prior year data has been made to reflect the current year classification.
Segment Commentary Fourth-Quarter Earnings 2016
27
Industrial Biosciences* (continued)
Operating earnings of $270 million increased $27 million or 11 percent for the year. Cost savings and sales gains drove the operating earnings improvement, partly offset by a negative impact from currency. Operating margins expanded by 155 basis points year over year.
Turning to the first quarter, we anticipate sales growing by the low single digits versus the prior year as volume growth and the benefits of new products in bioactives, and volume growth in biomaterials are partly offset by continued softness from CleanTech. We expect first-quarter operating earnings to increase versus the prior year by the low-single-digits percent, reflecting cost savings and sales growth partly offset by unfavorable product mix, lower margins in CleanTech and biomaterials and continued investment in the business.
* On 1/1/2016, the Clean Technologies business unit within DuPont Protection Solutions became part of Industrial Biosciences. Reclassification of
prior year data has been made to reflect the current year classification.
Segment Commentary Fourth-Quarter Earnings 2016
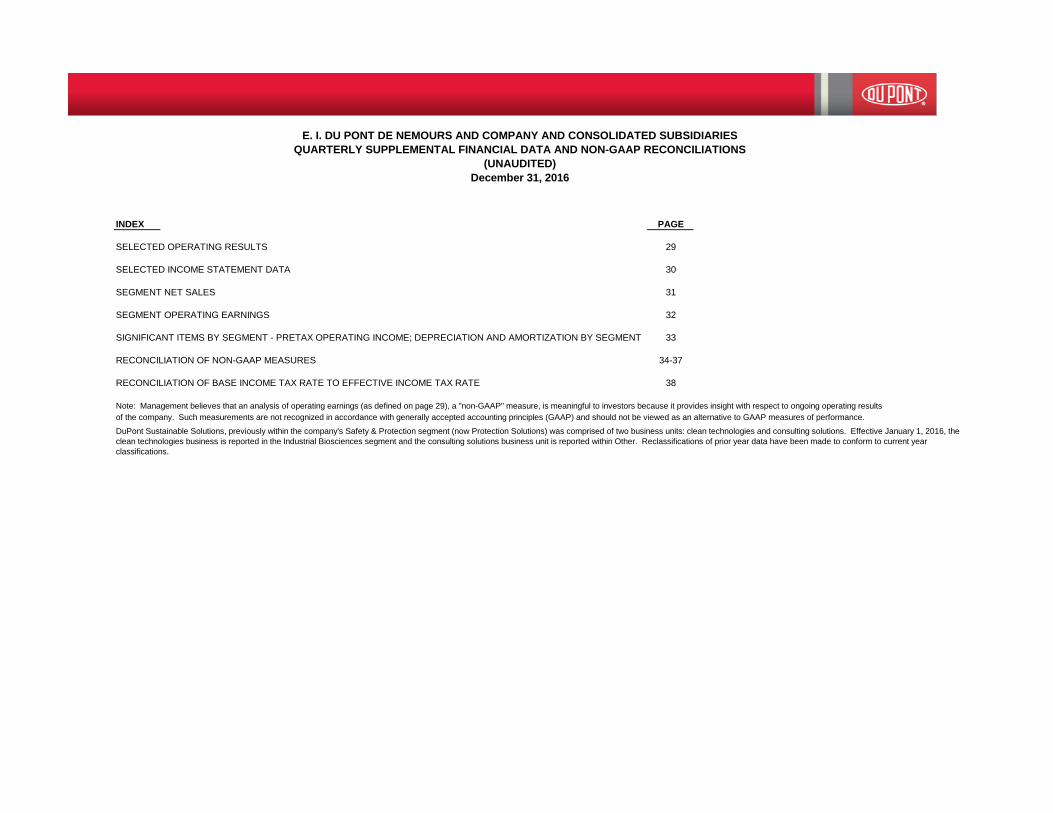
INDEX PAGE
SELECTED OPERATING RESULTS 29
SELECTED INCOME STATEMENT DATA 30
SEGMENT NET SALES 31
SEGMENT OPERATING EARNINGS 32
SIGNIFICANT ITEMS BY SEGMENT - PRETAX OPERATING INCOME; DEPRECIATION AND AMORTIZATION BY SEGMENT 33
RECONCILIATION OF NON-GAAP MEASURES 34-37
RECONCILIATION OF BASE INCOME TAX RATE TO EFFECTIVE INCOME TAX RATE 38
Note: Management believes that an analysis of operating earnings (as defined on page 29), a "non-GAAP" measure, is meaningful to investors because it provides insight with respect to ongoing operating results
of the company. Such measurements are not recognized in accordance with generally accepted accounting principles (GAAP) and should not be viewed as an alternative to GAAP measures of performance.
E. I. DU PONT DE NEMOURS AND COMPANY AND CONSOLIDATED SUBSIDIARIES
QUARTERLY SUPPLEMENTAL FINANCIAL DATA AND NON-GAAP RECONCILIATIONS
(UNAUDITED)
December 31, 2016
DuPont Sustainable Solutions, previously within the company's Safety & Protection segment (now Protection Solutions) was comprised of two business units: clean technologies and consulting solutions. Effective January 1, 2016, the
clean technologies business is reported in the Industrial Biosciences segment and the consulting solutions business unit is reported within Other. Reclassifications of prior year data have been made to conform to current year
classifications.
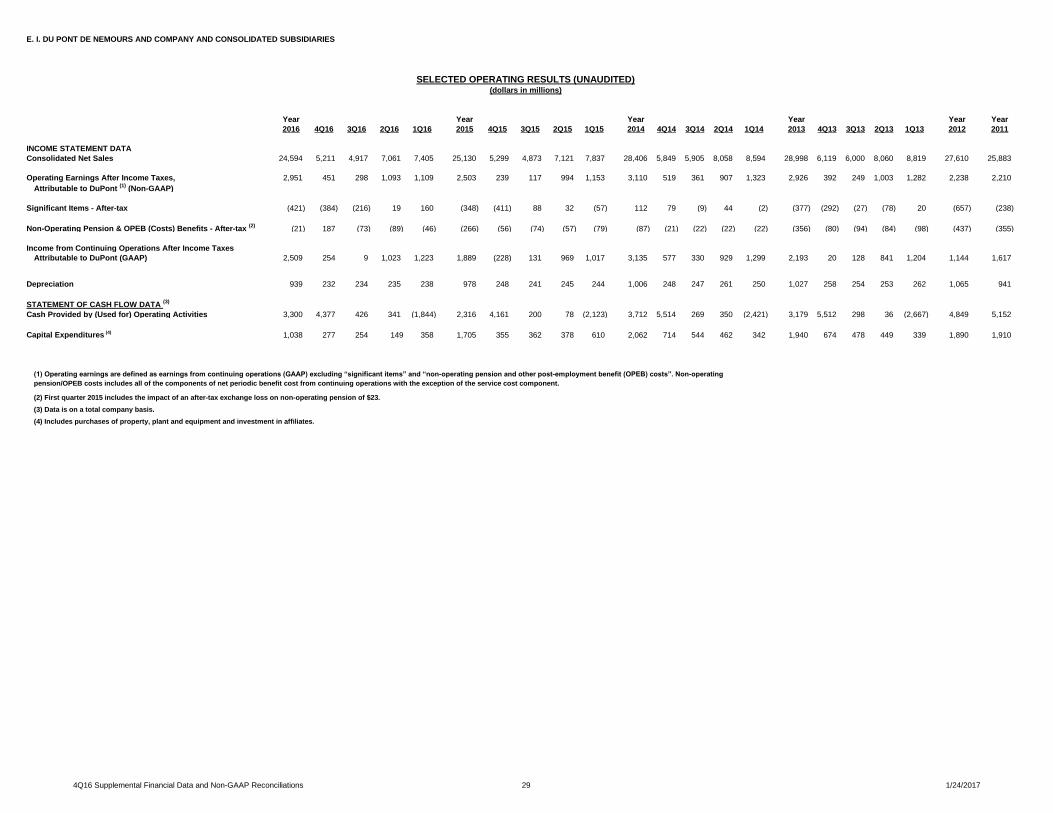
E. I. DU PONT DE NEMOURS AND COMPANY AND CONSOLIDATED SUBSIDIARIES
Year Year Year Year Year Year
2016 4Q16 3Q16 2Q16 1Q16 2015 4Q15 3Q15 2Q15 1Q15 2014 4Q14 3Q14 2Q14 1Q14 2013 4Q13 3Q13 2Q13 1Q13 2012 2011
INCOME STATEMENT DATA
Consolidated Net Sales 24,594 5,211 4,917 7,061 7,405 25,130 5,299 4,873 7,121 7,837 28,406 5,849 5,905 8,058 8,594 28,998 6,119 6,000 8,060 8,819 27,610 25,883
Operating Earnings After Income Taxes, 2,951 451 298 1,093 1,109 2,503 239 117 994 1,153 3,110 519 361 907 1,323 2,926 392 249 1,003 1,282 2,238 2,210
Attributable to DuPont (1)
(Non-GAAP)
Significant Items - After-tax (421) (384) (216) 19 160 (348) (411) 88 32 (57) 112 79 (9) 44 (2) (377) (292) (27) (78) 20 (657) (238)
Non-Operating Pension & OPEB (Costs) Benefits - After-tax (2)
(21) 187 (73) (89) (46) (266) (56) (74) (57) (79) (87) (21) (22) (22) (22) (356) (80) (94) (84) (98) (437) (355)
Income from Continuing Operations After Income Taxes
Attributable to DuPont (GAAP) 2,509 254 9 1,023 1,223 1,889 (228) 131 969 1,017 3,135 577 330 929 1,299 2,193 20 128 841 1,204 1,144 1,617
Depreciation 939 232 234 235 238 978 248 241 245 244 1,006 248 247 261 250 1,027 258 254 253 262 1,065 941
STATEMENT OF CASH FLOW DATA (3)
Cash Provided by (Used for) Operating Activities 3,300 4,377 426 341 (1,844) 2,316 4,161 200 78 (2,123) 3,712 5,514 269 350 (2,421) 3,179 5,512 298 36 (2,667) 4,849 5,152
Capital Expenditures (4)
1,038 277 254 149 358 1,705 355 362 378 610 2,062 714 544 462 342 1,940 674 478 449 339 1,890 1,910
(3) Data is on a total company basis.
(4) Includes purchases of property, plant and equipment and investment in affiliates.
SELECTED OPERATING RESULTS (UNAUDITED)(dollars in millions)
(1) Operating earnings are defined as earnings from continuing operations (GAAP) excluding “significant items” and “non-operating pension and other post-employment benefit (OPEB) costs”. Non-operating
pension/OPEB costs includes all of the components of net periodic benefit cost from continuing operations with the exception of the service cost component.
(2) First quarter 2015 includes the impact of an after-tax exchange loss on non-operating pension of $23.
4Q16 Supplemental Financial Data and Non-GAAP Reconciliations 29 1/24/2017
E. I. DU PONT DE NEMOURS AND COMPANY AND CONSOLIDATED SUBSIDIARIES
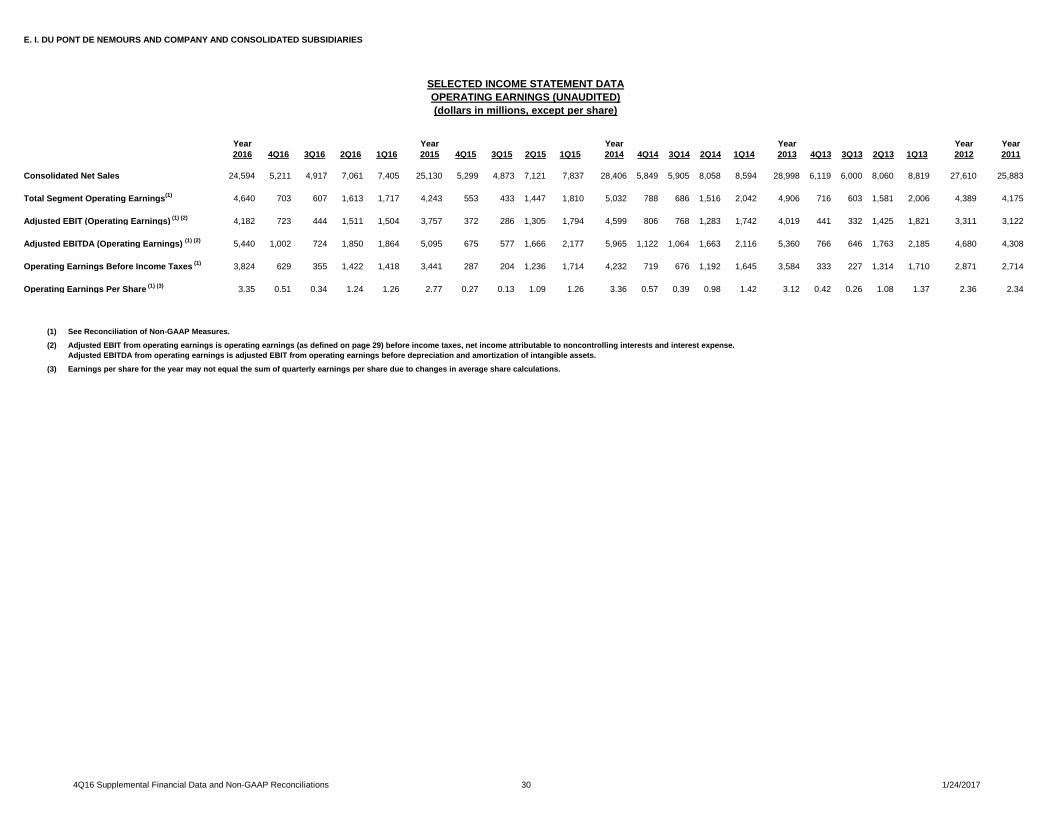
Year Year Year Year Year Year
2016 4Q16 3Q16 2Q16 1Q16 2015 4Q15 3Q15 2Q15 1Q15 2014 4Q14 3Q14 2Q14 1Q14 2013 4Q13 3Q13 2Q13 1Q13 2012 2011
Consolidated Net Sales 24,594 5,211 4,917 7,061 7,405 25,130 5,299 4,873 7,121 7,837 28,406 5,849 5,905 8,058 8,594 28,998 6,119 6,000 8,060 8,819 27,610 25,883
Total Segment Operating Earnings(1)
4,640 703 607 1,613 1,717 4,243 553 433 1,447 1,810 5,032 788 686 1,516 2,042 4,906 716 603 1,581 2,006 4,389 4,175
Adjusted EBIT (Operating Earnings) (1) (2)
4,182 723 444 1,511 1,504 3,757 372 286 1,305 1,794 4,599 806 768 1,283 1,742 4,019 441 332 1,425 1,821 3,311 3,122
Adjusted EBITDA (Operating Earnings) (1) (2)
5,440 1,002 724 1,850 1,864 5,095 675 577 1,666 2,177 5,965 1,122 1,064 1,663 2,116 5,360 766 646 1,763 2,185 4,680 4,308
Operating Earnings Before Income Taxes (1)
3,824 629 355 1,422 1,418 3,441 287 204 1,236 1,714 4,232 719 676 1,192 1,645 3,584 333 227 1,314 1,710 2,871 2,714
Operating Earnings Per Share (1) (3)
3.35 0.51 0.34 1.24 1.26 2.77 0.27 0.13 1.09 1.26 3.36 0.57 0.39 0.98 1.42 3.12 0.42 0.26 1.08 1.37 2.36 2.34
(1) See Reconciliation of Non-GAAP Measures.
(2) Adjusted EBIT from operating earnings is operating earnings (as defined on page 29) before income taxes, net income attributable to noncontrolling interests and interest expense.
Adjusted EBITDA from operating earnings is adjusted EBIT from operating earnings before depreciation and amortization of intangible assets.
(3) Earnings per share for the year may not equal the sum of quarterly earnings per share due to changes in average share calculations.
SELECTED INCOME STATEMENT DATA
OPERATING EARNINGS (UNAUDITED)
(dollars in millions, except per share)
4Q16 Supplemental Financial Data and Non-GAAP Reconciliations 30 1/24/2017
E. I. DU PONT DE NEMOURS AND COMPANY AND CONSOLIDATED SUBSIDIARIES
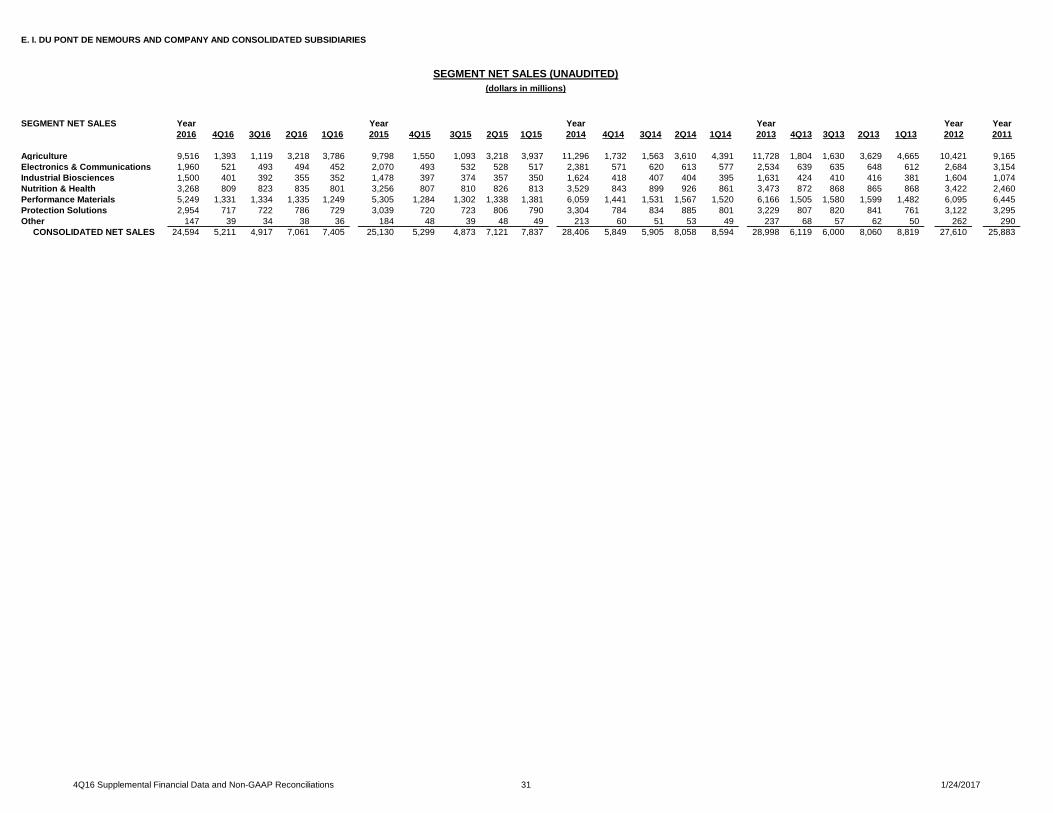
Year Year Year Year Year Year
2016 4Q16 3Q16 2Q16 1Q16 2015 4Q15 3Q15 2Q15 1Q15 2014 4Q14 3Q14 2Q14 1Q14 2013 4Q13 3Q13 2Q13 1Q13 2012 2011
Agriculture 9,516 1,393 1,119 3,218 3,786 9,798 1,550 1,093 3,218 3,937 11,296 1,732 1,563 3,610 4,391 11,728 1,804 1,630 3,629 4,665 10,421 9,165
Electronics & Communications 1,960 521 493 494 452 2,070 493 532 528 517 2,381 571 620 613 577 2,534 639 635 648 612 2,684 3,154
Industrial Biosciences 1,500 401 392 355 352 1,478 397 374 357 350 1,624 418 407 404 395 1,631 424 410 416 381 1,604 1,074
Nutrition & Health 3,268 809 823 835 801 3,256 807 810 826 813 3,529 843 899 926 861 3,473 872 868 865 868 3,422 2,460
Performance Materials 5,249 1,331 1,334 1,335 1,249 5,305 1,284 1,302 1,338 1,381 6,059 1,441 1,531 1,567 1,520 6,166 1,505 1,580 1,599 1,482 6,095 6,445
Protection Solutions 2,954 717 722 786 729 3,039 720 723 806 790 3,304 784 834 885 801 3,229 807 820 841 761 3,122 3,295
Other 147 39 34 38 36 184 48 39 48 49 213 60 51 53 49 237 68 57 62 50 262 290
CONSOLIDATED NET SALES 24,594 5,211 4,917 7,061 7,405 25,130 5,299 4,873 7,121 7,837 28,406 5,849 5,905 8,058 8,594 28,998 6,119 6,000 8,060 8,819 27,610 25,883
SEGMENT NET SALES
SEGMENT NET SALES (UNAUDITED)
(dollars in millions)
4Q16 Supplemental Financial Data and Non-GAAP Reconciliations 31 1/24/2017
E. I. DU PONT DE NEMOURS AND COMPANY AND CONSOLIDATED SUBSIDIARIES
Year Year Year Year Year Year
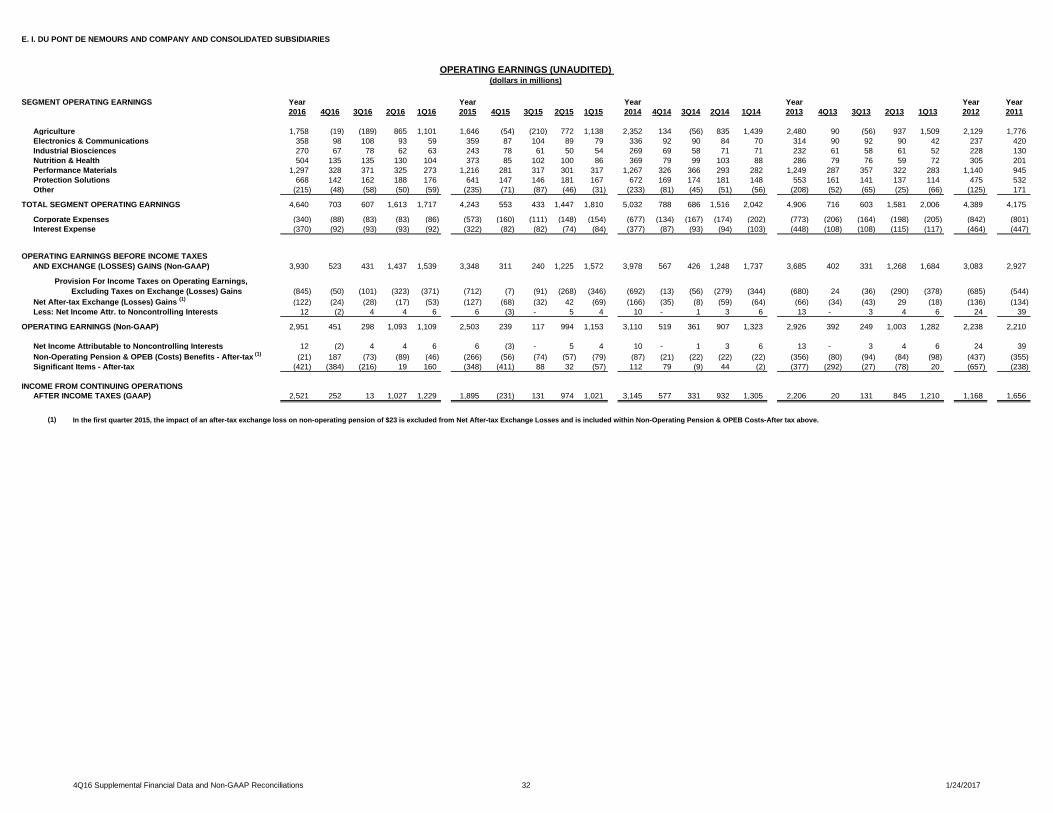
2016 4Q16 3Q16 2Q16 1Q16 2015 4Q15 3Q15 2Q15 1Q15 2014 4Q14 3Q14 2Q14 1Q14 2013 4Q13 3Q13 2Q13 1Q13 2012 2011
Agriculture 1,758 (19) (189) 865 1,101 1,646 (54) (210) 772 1,138 2,352 134 (56) 835 1,439 2,480 90 (56) 937 1,509 2,129 1,776
Electronics & Communications 358 98 108 93 59 359 87 104 89 79 336 92 90 84 70 314 90 92 90 42 237 420
Industrial Biosciences 270 67 78 62 63 243 78 61 50 54 269 69 58 71 71 232 61 58 61 52 228 130
Nutrition & Health 504 135 135 130 104 373 85 102 100 86 369 79 99 103 88 286 79 76 59 72 305 201
Performance Materials 1,297 328 371 325 273 1,216 281 317 301 317 1,267 326 366 293 282 1,249 287 357 322 283 1,140 945
Protection Solutions 668 142 162 188 176 641 147 146 181 167 672 169 174 181 148 553 161 141 137 114 475 532
Other (215) (48) (58) (50) (59) (235) (71) (87) (46) (31) (233) (81) (45) (51) (56) (208) (52) (65) (25) (66) (125) 171
TOTAL SEGMENT OPERATING EARNINGS 4,640 703 607 1,613 1,717 4,243 553 433 1,447 1,810 5,032 788 686 1,516 2,042 4,906 716 603 1,581 2,006 4,389 4,175
Corporate Expenses (340) (88) (83) (83) (86) (573) (160) (111) (148) (154) (677) (134) (167) (174) (202) (773) (206) (164) (198) (205) (842) (801)
Interest Expense (370) (92) (93) (93) (92) (322) (82) (82) (74) (84) (377) (87) (93) (94) (103) (448) (108) (108) (115) (117) (464) (447)
3,930 523 431 1,437 1,539 3,348 311 240 1,225 1,572 3,978 567 426 1,248 1,737 3,685 402 331 1,268 1,684 3,083 2,927
(845) (50) (101) (323) (371) (712) (7) (91) (268) (346) (692) (13) (56) (279) (344) (680) 24 (36) (290) (378) (685) (544)
Net After-tax Exchange (Losses) Gains (1)
(122) (24) (28) (17) (53) (127) (68) (32) 42 (69) (166) (35) (8) (59) (64) (66) (34) (43) 29 (18) (136) (134)
Less: Net Income Attr. to Noncontrolling Interests 12 (2) 4 4 6 6 (3) - 5 4 10 - 1 3 6 13 - 3 4 6 24 39
OPERATING EARNINGS (Non-GAAP) 2,951 451 298 1,093 1,109 2,503 239 117 994 1,153 3,110 519 361 907 1,323 2,926 392 249 1,003 1,282 2,238 2,210
Net Income Attributable to Noncontrolling Interests 12 (2) 4 4 6 6 (3) - 5 4 10 - 1 3 6 13 - 3 4 6 24 39
Non-Operating Pension & OPEB (Costs) Benefits - After-tax (1)
(21) 187 (73) (89) (46) (266) (56) (74) (57) (79) (87) (21) (22) (22) (22) (356) (80) (94) (84) (98) (437) (355)
Significant Items - After-tax (421) (384) (216) 19 160 (348) (411) 88 32 (57) 112 79 (9) 44 (2) (377) (292) (27) (78) 20 (657) (238)
INCOME FROM CONTINUING OPERATIONS
AFTER INCOME TAXES (GAAP) 2,521 252 13 1,027 1,229 1,895 (231) 131 974 1,021 3,145 577 331 932 1,305 2,206 20 131 845 1,210 1,168 1,656
(1)
OPERATING EARNINGS (UNAUDITED) (dollars in millions)
In the first quarter 2015, the impact of an after-tax exchange loss on non-operating pension of $23 is excluded from Net After-tax Exchange Losses and is included within Non-Operating Pension & OPEB Costs-After tax above.
OPERATING EARNINGS BEFORE INCOME TAXES
AND EXCHANGE (LOSSES) GAINS (Non-GAAP)
Provision For Income Taxes on Operating Earnings,
Excluding Taxes on Exchange (Losses) Gains
SEGMENT OPERATING EARNINGS
4Q16 Supplemental Financial Data and Non-GAAP Reconciliations 32 1/24/2017
E. I. DU PONT DE NEMOURS AND COMPANY AND CONSOLIDATED SUBSIDIARIES
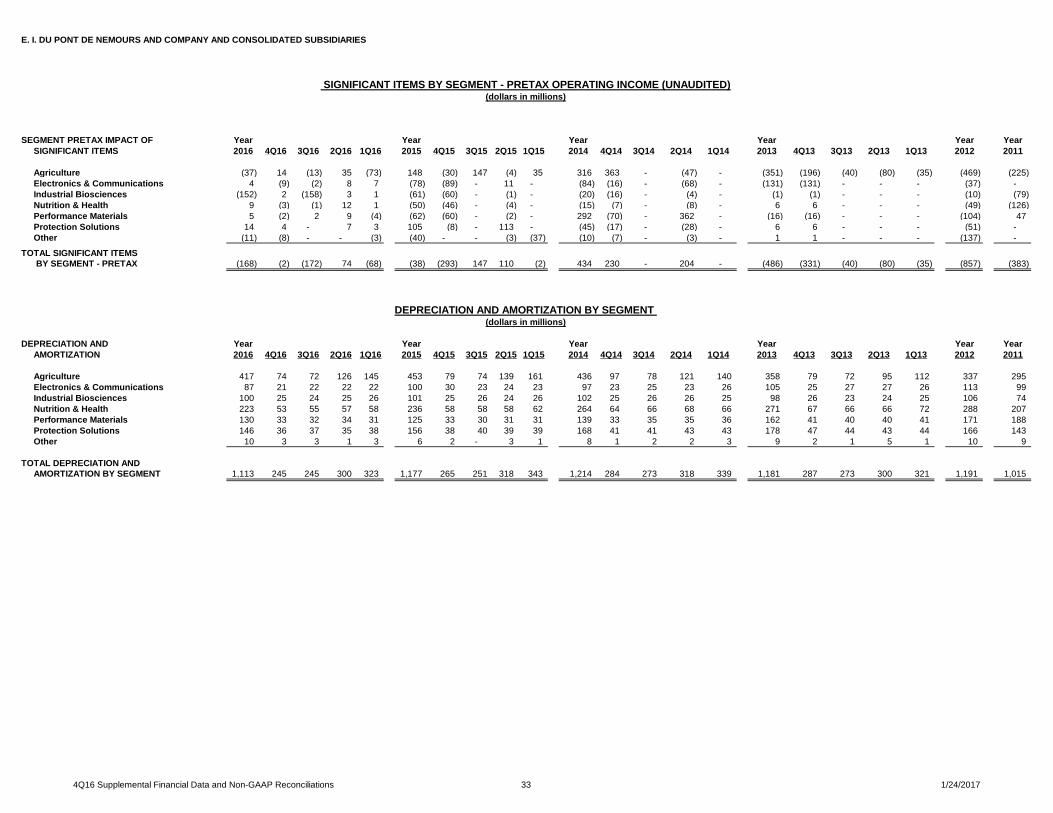
SEGMENT PRETAX IMPACT OF Year Year Year Year Year Year
SIGNIFICANT ITEMS 2016 4Q16 3Q16 2Q16 1Q16 2015 4Q15 3Q15 2Q15 1Q15 2014 4Q14 3Q14 2Q14 1Q14 2013 4Q13 3Q13 2Q13 1Q13 2012 2011
Agriculture (37) 14 (13) 35 (73) 148 (30) 147 (4) 35 316 363 - (47) - (351) (196) (40) (80) (35) (469) (225)
Electronics & Communications 4 (9) (2) 8 7 (78) (89) - 11 - (84) (16) - (68) - (131) (131) - - - (37) -
Industrial Biosciences (152) 2 (158) 3 1 (61) (60) - (1) - (20) (16) - (4) - (1) (1) - - - (10) (79)
Nutrition & Health 9 (3) (1) 12 1 (50) (46) - (4) - (15) (7) - (8) - 6 6 - - - (49) (126)
Performance Materials 5 (2) 2 9 (4) (62) (60) - (2) - 292 (70) - 362 - (16) (16) - - - (104) 47
Protection Solutions 14 4 - 7 3 105 (8) - 113 - (45) (17) - (28) - 6 6 - - - (51) -
Other (11) (8) - - (3) (40) - - (3) (37) (10) (7) - (3) - 1 1 - - - (137) -
TOTAL SIGNIFICANT ITEMS
BY SEGMENT - PRETAX (168) (2) (172) 74 (68) (38) (293) 147 110 (2) 434 230 - 204 - (486) (331) (40) (80) (35) (857) (383)
DEPRECIATION AND Year Year Year Year Year Year
AMORTIZATION 2016 4Q16 3Q16 2Q16 1Q16 2015 4Q15 3Q15 2Q15 1Q15 2014 4Q14 3Q14 2Q14 1Q14 2013 4Q13 3Q13 2Q13 1Q13 2012 2011
Agriculture 417 74 72 126 145 453 79 74 139 161 436 97 78 121 140 358 79 72 95 112 337 295
Electronics & Communications 87 21 22 22 22 100 30 23 24 23 97 23 25 23 26 105 25 27 27 26 113 99
Industrial Biosciences 100 25 24 25 26 101 25 26 24 26 102 25 26 26 25 98 26 23 24 25 106 74
Nutrition & Health 223 53 55 57 58 236 58 58 58 62 264 64 66 68 66 271 67 66 66 72 288 207
Performance Materials 130 33 32 34 31 125 33 30 31 31 139 33 35 35 36 162 41 40 40 41 171 188
Protection Solutions 146 36 37 35 38 156 38 40 39 39 168 41 41 43 43 178 47 44 43 44 166 143
Other 10 3 3 1 3 6 2 - 3 1 8 1 2 2 3 9 2 1 5 1 10 9
TOTAL DEPRECIATION AND
AMORTIZATION BY SEGMENT 1,113 245 245 300 323 1,177 265 251 318 343 1,214 284 273 318 339 1,181 287 273 300 321 1,191 1,015
SIGNIFICANT ITEMS BY SEGMENT - PRETAX OPERATING INCOME (UNAUDITED)(dollars in millions)
DEPRECIATION AND AMORTIZATION BY SEGMENT (dollars in millions)
4Q16 Supplemental Financial Data and Non-GAAP Reconciliations 33 1/24/2017
E. I. DU PONT DE NEMOURS AND COMPANY AND CONSOLIDATED SUBSIDIARIES
Year Year Year Year Year Year
2016 4Q16 3Q16 2Q16 1Q16 2015 4Q15 3Q15 2Q15 1Q15 2014 4Q14 3Q14 2Q14 1Q14 2013 4Q13 3Q13 2Q13 1Q13 2012 2011
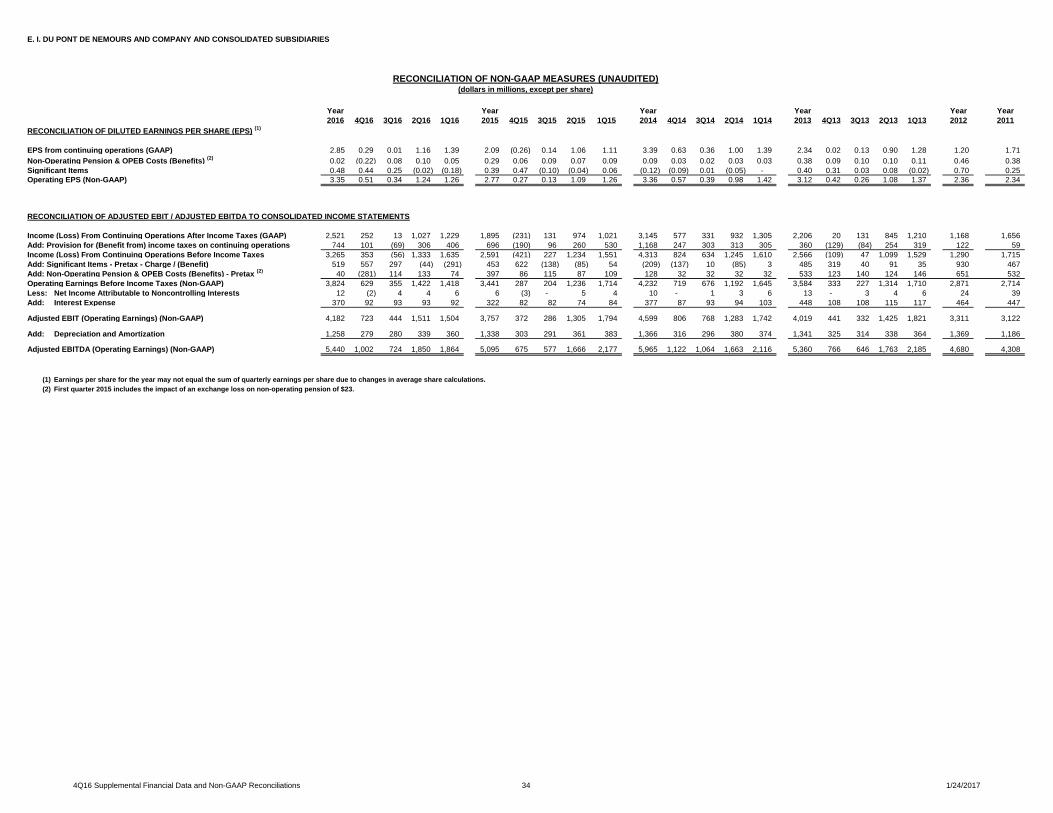
RECONCILIATION OF DILUTED EARNINGS PER SHARE (EPS) (1)
EPS from continuing operations (GAAP) 2.85 0.29 0.01 1.16 1.39 2.09 (0.26) 0.14 1.06 1.11 3.39 0.63 0.36 1.00 1.39 2.34 0.02 0.13 0.90 1.28 1.20 1.71
Non-Operating Pension & OPEB Costs (Benefits) (2)
0.02 (0.22) 0.08 0.10 0.05 0.29 0.06 0.09 0.07 0.09 0.09 0.03 0.02 0.03 0.03 0.38 0.09 0.10 0.10 0.11 0.46 0.38
Significant Items 0.48 0.44 0.25 (0.02) (0.18) 0.39 0.47 (0.10) (0.04) 0.06 (0.12) (0.09) 0.01 (0.05) - 0.40 0.31 0.03 0.08 (0.02) 0.70 0.25
Operating EPS (Non-GAAP) 3.35 0.51 0.34 1.24 1.26 2.77 0.27 0.13 1.09 1.26 3.36 0.57 0.39 0.98 1.42 3.12 0.42 0.26 1.08 1.37 2.36 2.34
RECONCILIATION OF ADJUSTED EBIT / ADJUSTED EBITDA TO CONSOLIDATED INCOME STATEMENTS
Income (Loss) From Continuing Operations After Income Taxes (GAAP) 2,521 252 13 1,027 1,229 1,895 (231) 131 974 1,021 3,145 577 331 932 1,305 2,206 20 131 845 1,210 1,168 1,656
Add: Provision for (Benefit from) income taxes on continuing operations 744 101 (69) 306 406 696 (190) 96 260 530 1,168 247 303 313 305 360 (129) (84) 254 319 122 59
Income (Loss) From Continuing Operations Before Income Taxes 3,265 353 (56) 1,333 1,635 2,591 (421) 227 1,234 1,551 4,313 824 634 1,245 1,610 2,566 (109) 47 1,099 1,529 1,290 1,715
Add: Significant Items - Pretax - Charge / (Benefit) 519 557 297 (44) (291) 453 622 (138) (85) 54 (209) (137) 10 (85) 3 485 319 40 91 35 930 467
Add: Non-Operating Pension & OPEB Costs (Benefits) - Pretax (2)
40 (281) 114 133 74 397 86 115 87 109 128 32 32 32 32 533 123 140 124 146 651 532
Operating Earnings Before Income Taxes (Non-GAAP) 3,824 629 355 1,422 1,418 3,441 287 204 1,236 1,714 4,232 719 676 1,192 1,645 3,584 333 227 1,314 1,710 2,871 2,714
Less: Net Income Attributable to Noncontrolling Interests 12 (2) 4 4 6 6 (3) - 5 4 10 - 1 3 6 13 - 3 4 6 24 39
Add: Interest Expense 370 92 93 93 92 322 82 82 74 84 377 87 93 94 103 448 108 108 115 117 464 447
Adjusted EBIT (Operating Earnings) (Non-GAAP) 4,182 723 444 1,511 1,504 3,757 372 286 1,305 1,794 4,599 806 768 1,283 1,742 4,019 441 332 1,425 1,821 3,311 3,122
Add: Depreciation and Amortization 1,258 279 280 339 360 1,338 303 291 361 383 1,366 316 296 380 374 1,341 325 314 338 364 1,369 1,186
Adjusted EBITDA (Operating Earnings) (Non-GAAP) 5,440 1,002 724 1,850 1,864 5,095 675 577 1,666 2,177 5,965 1,122 1,064 1,663 2,116 5,360 766 646 1,763 2,185 4,680 4,308
(1) Earnings per share for the year may not equal the sum of quarterly earnings per share due to changes in average share calculations.
(2)
RECONCILIATION OF NON-GAAP MEASURES (UNAUDITED)(dollars in millions, except per share)
First quarter 2015 includes the impact of an exchange loss on non-operating pension of $23.
4Q16 Supplemental Financial Data and Non-GAAP Reconciliations 34 1/24/2017
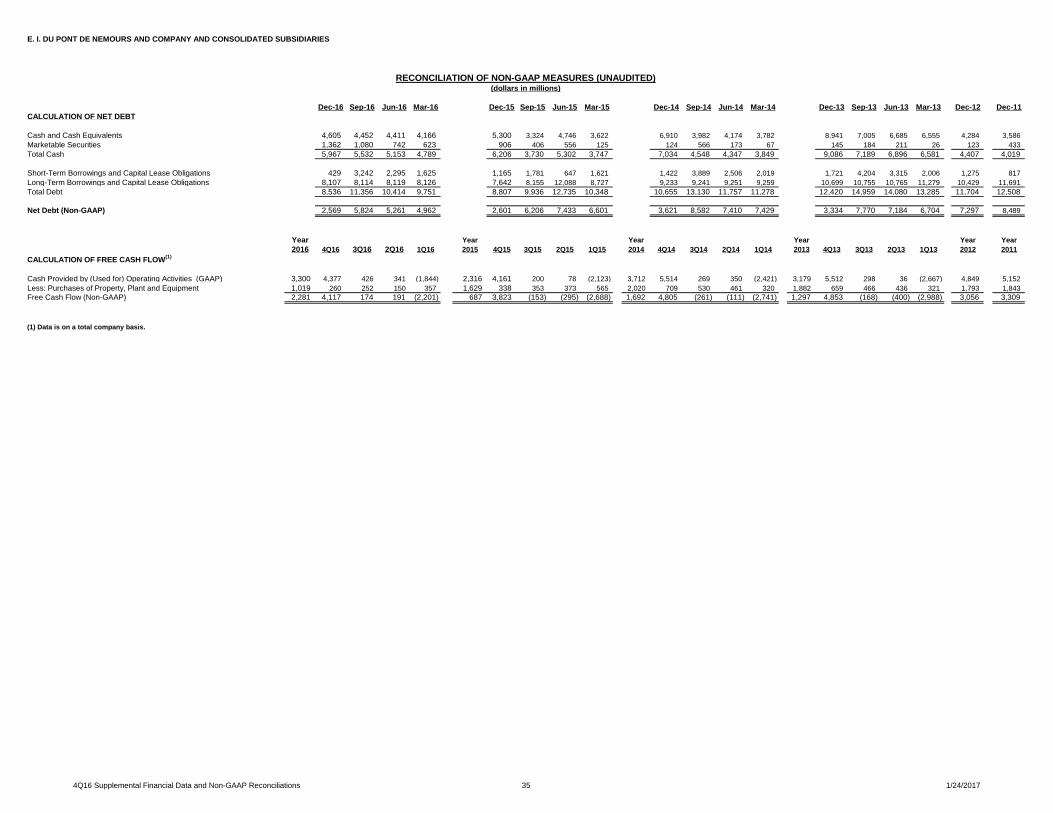
E. I. DU PONT DE NEMOURS AND COMPANY AND CONSOLIDATED SUBSIDIARIES
Dec-16 Sep-16 Jun-16 Mar-16 Dec-15 Sep-15 Jun-15 Mar-15 Dec-14 Sep-14 Jun-14 Mar-14 Dec-13 Sep-13 Jun-13 Mar-13 Dec-12 Dec-11
CALCULATION OF NET DEBT
Cash and Cash Equivalents 4,605 4,452 4,411 4,166 5,300 3,324 4,746 3,622 6,910 3,982 4,174 3,782 8,941 7,005 6,685 6,555 4,284 3,586
Marketable Securities 1,362 1,080 742 623 906 406 556 125 124 566 173 67 145 184 211 26 123 433
Total Cash 5,967 5,532 5,153 4,789 6,206 3,730 5,302 3,747 7,034 4,548 4,347 3,849 9,086 7,189 6,896 6,581 4,407 4,019
Short-Term Borrowings and Capital Lease Obligations 429 3,242 2,295 1,625 1,165 1,781 647 1,621 1,422 3,889 2,506 2,019 1,721 4,204 3,315 2,006 1,275 817
Long-Term Borrowings and Capital Lease Obligations 8,107 8,114 8,119 8,126 7,642 8,155 12,088 8,727 9,233 9,241 9,251 9,259 10,699 10,755 10,765 11,279 10,429 11,691
Total Debt 8,536 11,356 10,414 9,751 8,807 9,936 12,735 10,348 10,655 13,130 11,757 11,278 12,420 14,959 14,080 13,285 11,704 12,508
Net Debt (Non-GAAP) 2,569 5,824 5,261 4,962 2,601 6,206 7,433 6,601 3,621 8,582 7,410 7,429 3,334 7,770 7,184 6,704 7,297 8,489
Year Year Year Year Year Year
2016 4Q16 3Q16 2Q16 1Q16 2015 4Q15 3Q15 2Q15 1Q15 2014 4Q14 3Q14 2Q14 1Q14 2013 4Q13 3Q13 2Q13 1Q13 2012 2011
CALCULATION OF FREE CASH FLOW(1)
Cash Provided by (Used for) Operating Activities (GAAP) 3,300 4,377 426 341 (1,844) 2,316 4,161 200 78 (2,123) 3,712 5,514 269 350 (2,421) 3,179 5,512 298 36 (2,667) 4,849 5,152
Less: Purchases of Property, Plant and Equipment 1,019 260 252 150 357 1,629 338 353 373 565 2,020 709 530 461 320 1,882 659 466 436 321 1,793 1,843
Free Cash Flow (Non-GAAP) 2,281 4,117 174 191 (2,201) 687 3,823 (153) (295) (2,688) 1,692 4,805 (261) (111) (2,741) 1,297 4,853 (168) (400) (2,988) 3,056 3,309
(1) Data is on a total company basis.
RECONCILIATION OF NON-GAAP MEASURES (UNAUDITED)(dollars in millions)
4Q16 Supplemental Financial Data and Non-GAAP Reconciliations 35 1/24/2017
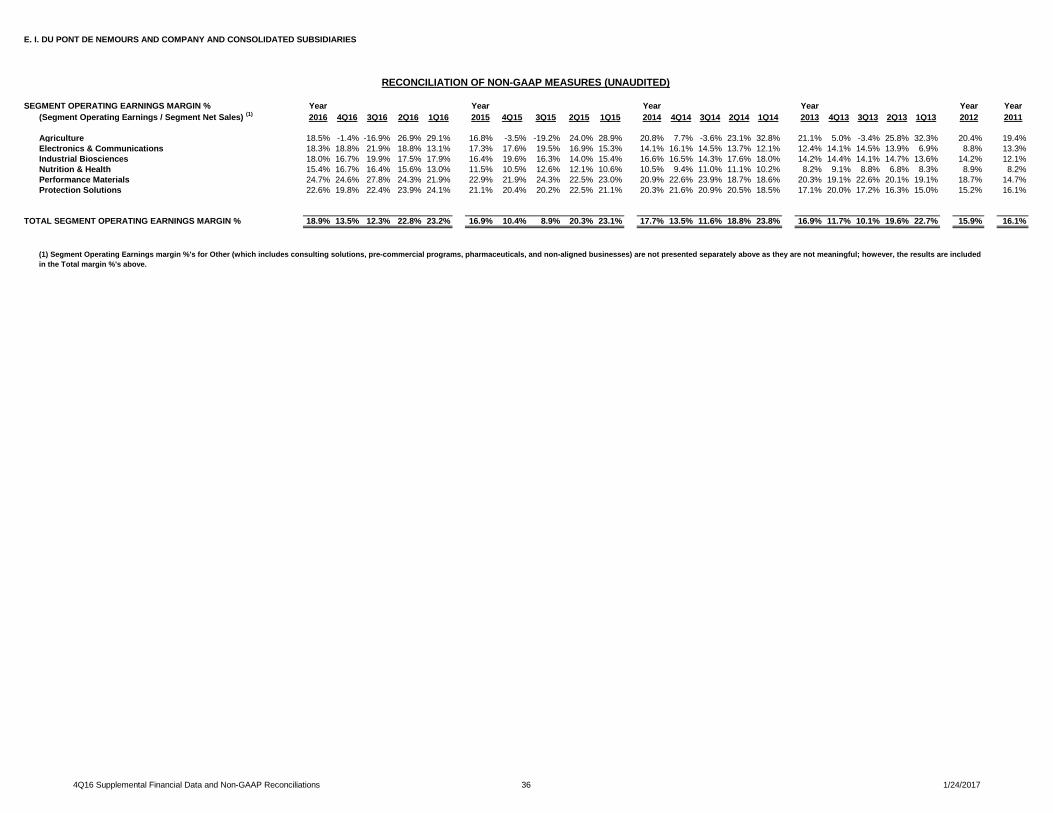
E. I. DU PONT DE NEMOURS AND COMPANY AND CONSOLIDATED SUBSIDIARIES
SEGMENT OPERATING EARNINGS MARGIN % Year Year Year Year Year Year
(Segment Operating Earnings / Segment Net Sales) (1)
2016 4Q16 3Q16 2Q16 1Q16 2015 4Q15 3Q15 2Q15 1Q15 2014 4Q14 3Q14 2Q14 1Q14 2013 4Q13 3Q13 2Q13 1Q13 2012 2011
Agriculture 18.5% -1.4% -16.9% 26.9% 29.1% 16.8% -3.5% -19.2% 24.0% 28.9% 20.8% 7.7% -3.6% 23.1% 32.8% 21.1% 5.0% -3.4% 25.8% 32.3% 20.4% 19.4%
Electronics & Communications 18.3% 18.8% 21.9% 18.8% 13.1% 17.3% 17.6% 19.5% 16.9% 15.3% 14.1% 16.1% 14.5% 13.7% 12.1% 12.4% 14.1% 14.5% 13.9% 6.9% 8.8% 13.3%
Industrial Biosciences 18.0% 16.7% 19.9% 17.5% 17.9% 16.4% 19.6% 16.3% 14.0% 15.4% 16.6% 16.5% 14.3% 17.6% 18.0% 14.2% 14.4% 14.1% 14.7% 13.6% 14.2% 12.1%
Nutrition & Health 15.4% 16.7% 16.4% 15.6% 13.0% 11.5% 10.5% 12.6% 12.1% 10.6% 10.5% 9.4% 11.0% 11.1% 10.2% 8.2% 9.1% 8.8% 6.8% 8.3% 8.9% 8.2%
Performance Materials 24.7% 24.6% 27.8% 24.3% 21.9% 22.9% 21.9% 24.3% 22.5% 23.0% 20.9% 22.6% 23.9% 18.7% 18.6% 20.3% 19.1% 22.6% 20.1% 19.1% 18.7% 14.7%
Protection Solutions 22.6% 19.8% 22.4% 23.9% 24.1% 21.1% 20.4% 20.2% 22.5% 21.1% 20.3% 21.6% 20.9% 20.5% 18.5% 17.1% 20.0% 17.2% 16.3% 15.0% 15.2% 16.1%
18.9% 13.5% 12.3% 22.8% 23.2% 16.9% 10.4% 8.9% 20.3% 23.1% 17.7% 13.5% 11.6% 18.8% 23.8% 16.9% 11.7% 10.1% 19.6% 22.7% 15.9% 16.1%
TOTAL SEGMENT OPERATING EARNINGS MARGIN %
RECONCILIATION OF NON-GAAP MEASURES (UNAUDITED)
(1) Segment Operating Earnings margin %'s for Other (which includes consulting solutions, pre-commercial programs, pharmaceuticals, and non-aligned businesses) are not presented separately above as they are not meaningful; however, the results are included
in the Total margin %'s above.
4Q16 Supplemental Financial Data and Non-GAAP Reconciliations 36 1/24/2017
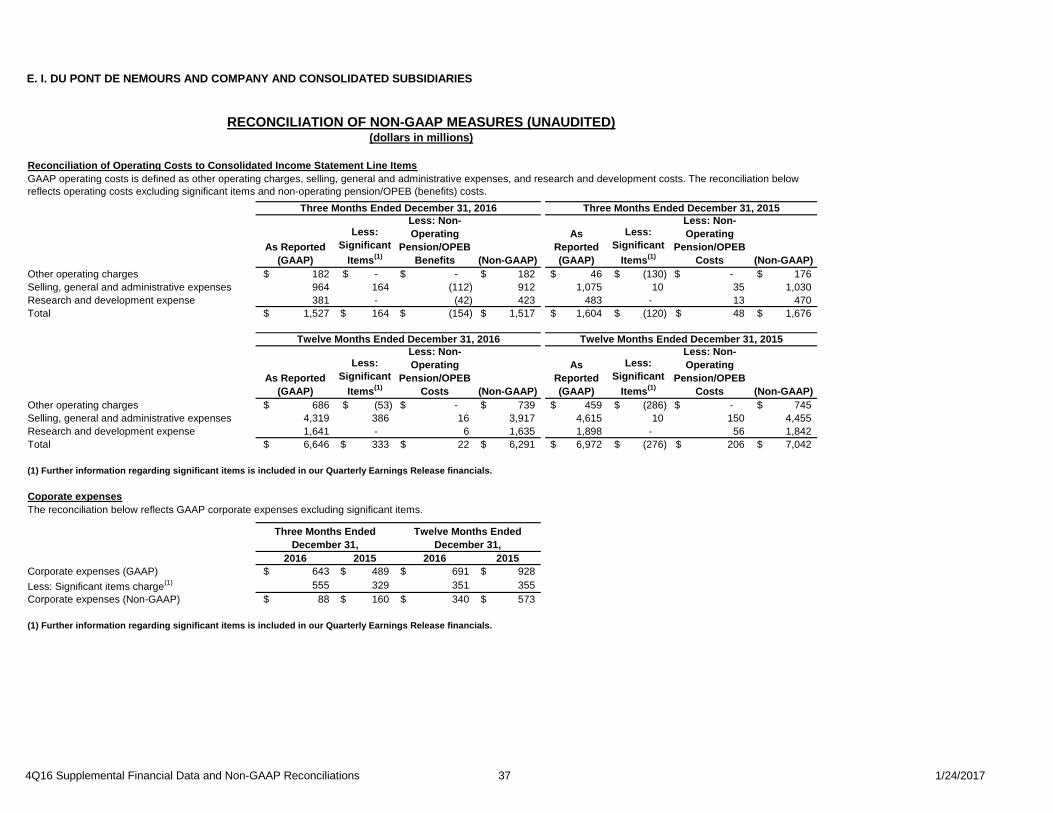
E. I. DU PONT DE NEMOURS AND COMPANY AND CONSOLIDATED SUBSIDIARIES
As Reported
(GAAP)
Less:
Significant
Items(1)
Less: Non-
Operating
Pension/OPEB
Benefits (Non-GAAP)
As
Reported
(GAAP)
Less:
Significant
Items(1)
Less: Non-
Operating
Pension/OPEB
Costs (Non-GAAP)
Other operating charges 182$ -$ -$ 182$ 46$ (130)$ -$ 176$
Selling, general and administrative expenses 964 164 (112) 912 1,075 10 35 1,030
Research and development expense 381 - (42) 423 483 - 13 470
Total 1,527$ 164$ (154)$ 1,517$ 1,604$ (120)$ 48$ 1,676$
As Reported
(GAAP)
Less:
Significant
Items(1)
Less: Non-
Operating
Pension/OPEB
Costs (Non-GAAP)
As
Reported
(GAAP)
Less:
Significant
Items(1)
Less: Non-
Operating
Pension/OPEB
Costs (Non-GAAP)
Other operating charges 686$ (53)$ -$ 739$ 459$ (286)$ -$ 745$
Selling, general and administrative expenses 4,319 386 16 3,917 4,615 10 150 4,455
Research and development expense 1,641 - 6 1,635 1,898 - 56 1,842
Total 6,646$ 333$ 22$ 6,291$ 6,972$ (276)$ 206$ 7,042$
(1) Further information regarding significant items is included in our Quarterly Earnings Release financials.
2016 2015 2016 2015
Corporate expenses (GAAP) 643$ 489$ 691$ 928$
Less: Significant items charge(1) 555 329 351 355
Corporate expenses (Non-GAAP) 88$ 160$ 340$ 573$
(1) Further information regarding significant items is included in our Quarterly Earnings Release financials.
Coporate expenses
The reconciliation below reflects GAAP corporate expenses excluding significant items.
Three Months Ended
December 31,
RECONCILIATION OF NON-GAAP MEASURES (UNAUDITED)(dollars in millions)
Three Months Ended December 31, 2016 Three Months Ended December 31, 2015
Reconciliation of Operating Costs to Consolidated Income Statement Line Items
GAAP operating costs is defined as other operating charges, selling, general and administrative expenses, and research and development costs. The reconciliation below
reflects operating costs excluding significant items and non-operating pension/OPEB (benefits) costs.
Twelve Months Ended December 31, 2016 Twelve Months Ended December 31, 2015
Twelve Months Ended
December 31,
4Q16 Supplemental Financial Data and Non-GAAP Reconciliations 37 1/24/2017
E. I. DU PONT DE NEMOURS AND COMPANY AND CONSOLIDATED SUBSIDIARIES
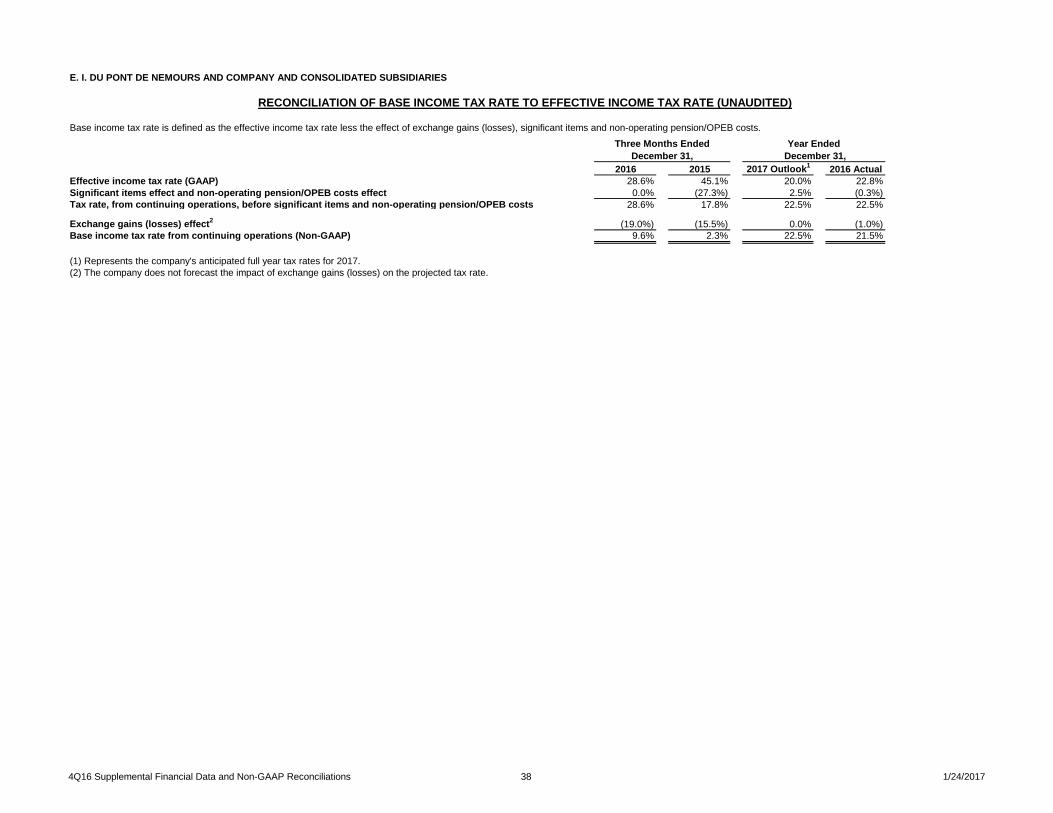
2016 2015 2017 Outlook1
2016 Actual
Effective income tax rate (GAAP) 28.6% 45.1% 20.0% 22.8%
Significant items effect and non-operating pension/OPEB costs effect 0.0% (27.3%) 2.5% (0.3%)
Tax rate, from continuing operations, before significant items and non-operating pension/OPEB costs 28.6% 17.8% 22.5% 22.5%
Exchange gains (losses) effect2
(19.0%) (15.5%) 0.0% (1.0%)
Base income tax rate from continuing operations (Non-GAAP) 9.6% 2.3% 22.5% 21.5%
(1) Represents the company's anticipated full year tax rates for 2017.
(2) The company does not forecast the impact of exchange gains (losses) on the projected tax rate.
Three Months Ended
December 31,
RECONCILIATION OF BASE INCOME TAX RATE TO EFFECTIVE INCOME TAX RATE (UNAUDITED)
Base income tax rate is defined as the effective income tax rate less the effect of exchange gains (losses), significant items and non-operating pension/OPEB costs.
Year Ended
December 31,
4Q16 Supplemental Financial Data and Non-GAAP Reconciliations 38 1/24/2017
28 28
Copyright © 2017 DuPont. All rights reserved. The DuPont Oval Logo, DuPontTM, The miracles of scienceTM, and all products, unless otherwise noted, denoted with ® or TM are trademarks or registered trademarks of E. I. du Pont de Nemours and Company.
+Images reproduced by E. I. du Pont de Nemours and Company under license from the National Geographic Society.