du pont 2005 Annual Meeting Proxy Statement
82
1 New York November 7, 2005 Actions to Increase Shareholder Value Actions to Increase Shareholder Value
-
Upload
finance9 -
Category
Economy & Finance
-
view
334 -
download
1
Transcript of du pont 2005 Annual Meeting Proxy Statement

1
New YorkNovember 7, 2005
Actions to Increase Shareholder
Value
Actions to Increase Shareholder
Value

Investment Community Meeting
Investment Community Meeting
Carl Carl LukachLukachVice President, Investor RelationsVice President, Investor Relations
WelcomeWelcome

3
Agenda
9:00 AM Opening Remarks Chad HollidayProductivity Advancement Richard GoodmansonCapital Deployment Gary PfeifferGrowth Acceleration Tom ConnellyBio-Based Materials Expansion Tom Connelly
10:00 AM Q & A
10:30 AM Closing Remarks Chad Holliday

4
Emergency EXIT
Emergency EXIT
5
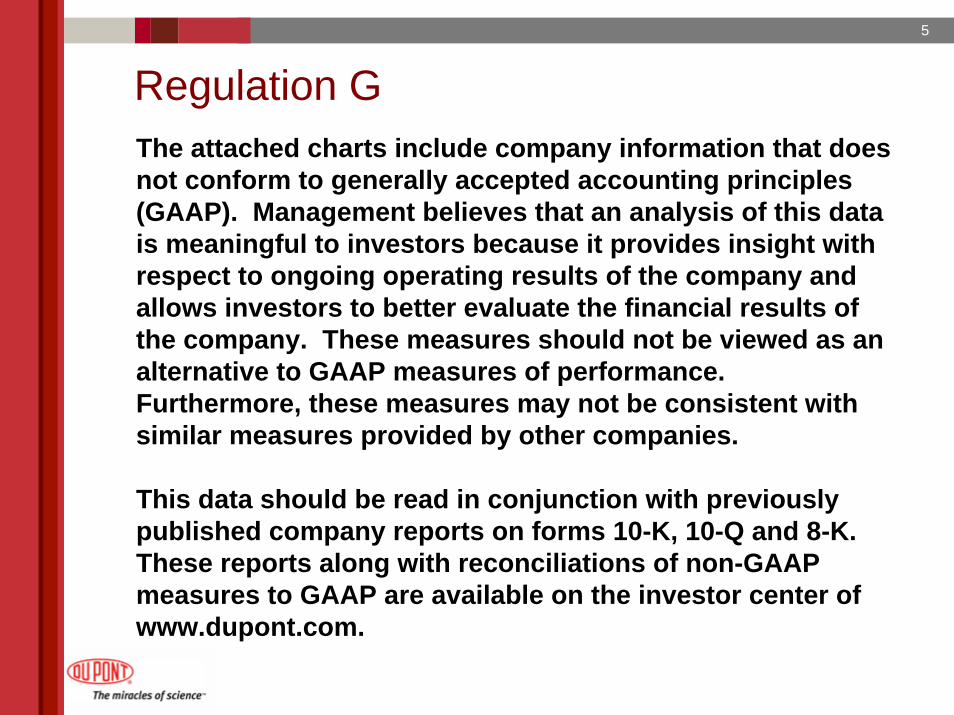
Regulation GThe attached charts include company information that does not conform to generally accepted accounting principles (GAAP). Management believes that an analysis of this data is meaningful to investors because it provides insight with respect to ongoing operating results of the company and allows investors to better evaluate the financial results of the company. These measures should not be viewed as an alternative to GAAP measures of performance. Furthermore, these measures may not be consistent with similar measures provided by other companies.
This data should be read in conjunction with previously published company reports on forms 10-K, 10-Q and 8-K. These reports along with reconciliations of non-GAAP measures to GAAP are available on the investor center of www.dupont.com.

6
During the course of this presentation, I would like to remind you that we may make forward-looking statements. All statements that address expectations or projections about the future are forward-looking statements. Some of these statements include words such as ‘expects,’ ‘anticipates,’‘plans,’ ‘intends,’ ‘projects’ and ‘indicates.’ Although they reflect our current expectations, these statements are not guarantees of future performance, but involve a number of risks, uncertainties, and assumptions. We urge you to review DuPont's SEC filings, particularly its latest annual report on Form 10-K and quarterly reports on Form 10-Q, for a discussion of some of the factors which could cause actual results to differ materially.
Forward-Looking Statement
Chad HollidayChad HollidayChairman & Chief Executive OfficerChairman & Chief Executive Officer
Actions to Increase Shareholder
Value
Actions to Increase Shareholder
Value

8
Put Science To Work
Go Where The Growth Is
One DuPont - Productivity
Dynamic Science Company

Richard GoodmansonExecutive Vice President & Chief Operating Officer
Productivity AdvancementProductivity Advancement

10
Productivity Advancement
Stake $1B cost improvement over 3 years $1B reduction in net working capital over 3 years
Scope All supply chainsAll support functions
Approach Significant down-payment in 2006Extensive re-engineering for simplification and standardization (streamlining)
Performance Quarterly Fixed Cost as % of Sales Metric

11
Discussion Structure
Fixed Cost Momentum
Tight CostControl
Support Processes
‘05Costs
Lean Supply Chain
2006 2007 2008
Support Processes
Streamline

12
Total Fixed Cost* ($B)2000 - 2004
$13.7
$12.860
0.9
0.31.1 (1.4)
(2.5)
2000 Portfolio CurrencyPension/OPEBS/Stock Opts
Volume Inflation Cost Reductions
2004
0.7
* Excludes Significant Items

13
Discussion Structure
Fixed Cost Momentum
Lean Supply Chain
2006 2007 2008Tight Cost
Control
Support Processes
Support Processes
‘05Costs
Streamline

14
’06 Fixed Cost Momentum ($MM YOY)
• Growth Investments: $ 220- China capacity: $70- Major programs (increases): $120- Other (e.g. regulatory, security): $30
• Wage/Salary Increases 180
• Other People Costs 70(e.g. health care, options expenses)
• Depreciation 30Prior year investments (e.g. SAP)
• Currency Translation ?
• Purchased Goods/Services Inflation ?________$ 500 MM+

15
Discussion Structure
Fixed Cost Momentum
Lean Supply Chain
2006 2007 2008Tight Cost
Control
Support Processes
Support Processes
‘05Costs
Streamline

16
Tight Cost ControlPlatforms
A&NFunctions Corporate SBU SBU TOTALS
Finance $ $ + $
HR
IT
Sourcing __________ _________
Totals $ $ + $ $
ILLUSTRATIVE
Set Non-NegotiableStretch Goals
Generate Options
Optimize Trade-offs

17
Generate Options
Staffing Optimization $ 60 – 100 MM
Other HR Opportunities 60 – 70
Functional Optimization 100 – 150
Strengthen Contract Mgt. 30 – 40
POTENTIAL $250 – 360 MM

18
Discussion Structure
Fixed Cost Momentum
Lean Supply Chain
2006 2007 2008Tight Cost
Control
Support Processes
Support Processes
‘05Costs
Streamline

19
The Bigger Opportunity –Streamline Core Processes
Manage the Corporation & Business Portfolio
Marketing Processes
Provide Solutions (Supply Chain)
Develop New Technologies, Products, Services
Sales Processes
Manage Physical ResourcesAccounting and Finance
Manage People ResourcesManage Information / Knowledge
20
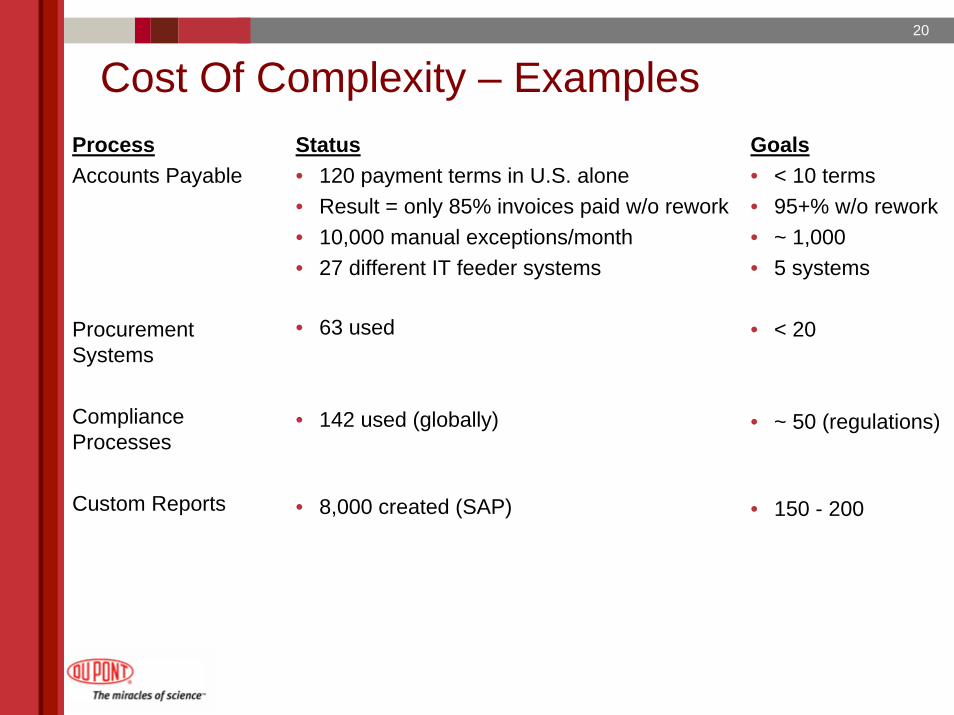
Cost Of Complexity – ExamplesProcessAccounts Payable
Procurement Systems
Compliance Processes
Custom Reports
Status• 120 payment terms in U.S. alone• Result = only 85% invoices paid w/o rework• 10,000 manual exceptions/month• 27 different IT feeder systems
• 63 used
• 142 used (globally)
• 8,000 created (SAP)
Goals• < 10 terms• 95+% w/o rework• ~ 1,000• 5 systems
• < 20
• ~ 50 (regulations)
• 150 - 200

21
Execution Through Six Sigma Project Teams
• Understand Current Processes• Identify Performance Gaps• Use Kaizen for Improvement
• Define Simplified “Best” Process• Assess Conformance & Benchmarks• Establish Standards & Metrics
• Agree Entitlement• Shift Process Capability• Drive Uniformity
QuickWins
StandardizedApproach
Transformation
Execution Through Six Sigma Project Teams
“Tried & True” Approach

22
Lean Supply ChainThe Destination:
Examples of Benefits:
• Waste elimination• Faster order lead times• More capacity• Less inventory/obsolescence• Quicker changeovers• More efficient warehousing• Transport optimization
Transform capability over 3-4 years:• Retain differentiation at lower cost• Improve service level and response time• Be flexible / adaptive
Lean Supply Chain Expectations
0
200
400
600
800
1000
1200
2006 2007 2008
$MM Earnings
NWCImprovement
Lean Supply Chain Expectations

23
Lean Example – One Business Unit
Pre-Lean Situation
• Inventory: 103 days
• Service level outliers: 18.3%
• 2nd Quality sales: 5%
• Distribution expenses: $145 MM
To Date
• 17% improved…$81MM cash freed
• 24% improved
• 29% reduced
• Saved $15MM YTD

24
Discussion Structure
Fixed Cost Momentum
Lean Supply Chain
2006 2007 2008
Streamline
Tight CostControl
Support Processes
Support Processes
‘05Costs

25
HR ExampleObjectives
• Outsource transaction activities
• Implement global SAP platform
• Strengthen HR role to create more business impact
Timing
11/04 - RFP6/05 - Due Diligence
10/05 - Agreement6/06 - Global blueprint
12/07 - Complete
Impact
• Costs down 20-30% over contract life
• Costs variabilized
• Stronger people processes

26
High
Low
IT B
usin
ess I
mpa
ct
(Effe
ctive
ness
)Hackett IT Value Grid
Key Efficiency Drivers+ On-time project delivery+ Number of help desk calls+ Number of programming languages,
database platforms+ Number of network protocols and
data centers- Business standardization and
adherence- Technology infrastructure cost per
end user- On-budget project delivery
Key Effectiveness Drivers+ Member of executive committee+ Orders, payments remittances,
expense reports transmitted electronically
+ Help desk call resolution+ Number of hardware suppliers- Internal SLAs met- Project adhered to standard
methodology- Planning and strategy staff and
costsHighIT Efficiency
Companies in database= SBU
World Class
G&A BenchmarkingOne SBU

27
High Level Benchmarks
20%
30%
25%
0%Cost/$SpendSourcing
Cost/$RevenueFinance
Cost/UserIT
HR Staff/1000 EmployeesHR
DuPont vs. Median
World ClassMedianDuPont

28
Streamlining Opportunity $MM PTOI
Supply Chain Work Plan (over 3 years):
- NWC improvement $1,000
- Annual earnings 600
Other Functions: Gap to Median
- HR $ 60
- IT 200
- Finance 90
- Sourcing 0

29
Broad-Based Severance Not Required
Annual attrition* ~2,000
Displacing variable staff ~1,000
Business growth & improvement projects ~1,000
Redeployment potential ~4,000
Headcount
* e.g. U.S. – 2,500 fully pension eligible
Expected Staffing Needs

30
Productivity Advancement
Lead: Goodmanson
Tight Cost Control
HodgsonBorelGiblin
Streamline Projects
Supply Chain: JohnsonSourcing: CoeFacilities: PorterFinance: PfeifferHR: BorelIT: Ridout
“Best Quartile”Benchmarking
LinsenmannHackett Group
2006 OperationalPlanning
Operating Team
CapitalDeployment
Pfeiffer
InnovationChoices
Connelly

31
TimelineG&A Benchmarking Oct Nov Dec 1Q06 2Q06 3Q06 4Q06Pilot (Hackett)
Execute Pilot
Conduct Co-wideProgram
Execute Co-wideProjects
Streamline
Design
Conduct PilotsExecute PilotsExtendProcesses/Projects
‘05 ‘06

32
Transparency – Metrics ReportedFixed Cost* as a percent of Segment Sales
1 Qtr 2 Qtr
43.1%40.5
38.6
43.240.7
38.9
50.746.7 47.0 48.7
47.0
3 Qtr 4 Qtr2003
2004
2005 * Excludes T&I segment and significant items

33
Productivity Advancement
Stake $1B cost improvement over 3 years $1B reduction in net working capital over 3 years
Scope All supply chainsAll support functions
Approach Significant down-payment in 2006Extensive re-engineering for simplification and standardization (streamlining)
Performance Quarterly Fixed Cost as % of Sales Metric

Gary PfeifferSenior Vice President & Chief Financial Officer
Capital DeploymentCapital Deployment

35
Capital Deployment
Stake Additional 3 point increase in ROIC
Scope All businesses with RONA < 12%
Approach Reallocation of resources (cost and capital) aligned with shifts in strategy, business model, mission. 18 month action plan.
PerformanceMetric Return on Net Assets =
After-Tax Operating IncomeSegment Net Assets

36
Return on Invested Capital*
0%
5%
10%
15%
20%
2001 2002 2003 2004
DuPont Proxy Frame of Reference
*Before Significant Items
GOAL

37
Current StateSegment Net Assets*
% with RONATotal >12% <12%
Agriculture & Nutrition $ 7.2 74% 26%
Coatings & Color Technologies $ 3.8 66% 34%
Electronic & Communication Technologies $ 2.2 49% 51%
Performance Materials $ 3.9 43% 57%
Safety & Protection $ 2.6 72% 28%
$19.7 64% 36%• 12 month average ending 9/30/05;
excludes significant items.

38
Current StateReturn on Net Assets (RONA)
Net Assets (1) RONA (2)
Above (Below)
$ % Total Average CoC
Growth Platforms $19.7 100% 15% 3 pts
(1) 12 month average ending 9/30/05(2) 12 months ending 9/30/05;
excludes significant items.

39
Net Assets (1) RONA (2)
Above (Below)
$ % Total Average CoC
Growth Platforms $19.7 100% 15% 3 pts
> 12% $12.5 64% 23% 11 pts
(1) 12 month average ending 9/30/05(2) 12 months ending 9/30/05;
excludes significant items.
Current StateReturn on Net Assets (RONA)

40
Net Assets (1) RONA (2)
Above (Below)
$ % Total Average CoC
Growth Platforms $19.7 100% 15% 3 pts
> 12% $12.5 64% 23% 11 pts
0 - 12% 5.0 25% 5% (7 pts)
(1) 12 month average ending 9/30/05(2) 12 months ending 9/30/05;
excludes significant items.
Current StateReturn on Net Assets (RONA)

41
Current StateReturn on Net Assets (RONA)
Net Assets (1) RONA (2)
Above (Below)
$ % Total Average CoC
Growth Platforms $19.7 100% 15% 3 pts
> 12% $12.5 64% 23% 11 pts
0 - 12% 5.0 25% 5% (7 pts)
< 0% 2.2 11% (6%) (18 pts)
(1) 12 month average ending 9/30/05(2) 12 months ending 9/30/05;
excludes significant items.

42
Current StateReturn on Net Assets (RONA)
Net Assets (1) RONA (2)
Above (Below) $ % Total Average CoC
Growth Platforms $19.7 100% 15% 3 pts> 12% $12.5 64% 23% 11 pts0 - 12% 5.0 25% 5% (7 pts)< 0% 2.2 11% (6%) (18 pts)
RONA < 12% Commonalities:- Dependence on U.S. Natural Gas- “Distressed” Market Space- Strong Commoditization Trend
or- Embryonic
(1) 12 month average ending 9/30/05(2) 12 months ending 9/30/05;
excludes significant items.

43
Range of Possible Actions
1. Adjust business strategy, business model and/or resource levels to earn RONA >12% across a business cycle
or2. Reduce resource levels – cost and capital – to
support only “operate and maintain safely” (cash mission)
or3. Monetize

44
Capital Deployment
Lead: Pfeiffer
Execution Plans Execution Progress TrackingSWAT Teams (6) Donnelly BeryBusiness Leaders Fyrwald
KeeferKullmanNaylor
2006 Operational PlanningOperating Team

45
Tracking ProgressKey Metric: RONA
Timeline
• Finalize ’06 Execution Plans 12/14/05- Set Compensation Metrics
• Report Progress on RONA Improvement 1/24/064/25/067/25/06
10/24/06

46
Capital DeploymentProgress Report
0 – 12 % <0%<0%
Segment Net Assets Average Segment Net Assets Average
$B % Total RONA $B % Total RONA
09/30/05 5.0 25% 5% 2.2 11% (6%)
12/31/05
03/31/06
06/30/06
09/30/06
12/31/06
Note: 12 months ending;excludes significant items.

47
Capital Deployment
Stake Additional 3 point increase in ROIC
Scope All businesses with RONA < 12%
Approach Reallocation of resources (cost and capital) aligned with shifts in strategy, business model, mission. 18 month action plan.
PerformanceMetric Return on Net Assets =
After-Tax Operating IncomeSegment Net Assets

Tom ConnellyTom ConnellySenior Vice President & Chief Science and Technology Officer Senior Vice President & Chief Science and Technology Officer
Growth Acceleration Growth Acceleration

49
Growth Acceleration
Stake $850MM growth revenue in ’06 from new productsFurther 30% increase in innovation productivity by 2010
Scope All growth technology and marketing investments
Approach Reprioritize for current realities:- Increase resourcing of critical projects- Shut down marginal projects
Performance Percent of revenue from new productsMetrics Growth revenue from new product sales

50
Innovation Choices: Examples
Accelerated Growth Investments• Molecular Breeding• GLY/SU Input Traits• CPP Late Pipeline• New Nonwovens• Asia Resourcing
Restricted Growth Investments• Commodity Polymers• Commodity Coatings• Others
Fewer, Better-Resourced Growth Projects• All SBUs
• Bio-Materials/Fuels• BioSurfaces• BioMedical• I/C Materials/Packaging• PV Materials

51
Clear Momentum
4000
5000
6000
7000
8000
2000 2001 2002 2003 2004
$630 MM Top Line Growth Revenuefrom New Products Commercialized in 2004
30% of Total Sales
Sales From New Products New Products Commercialized
774
902
2004 Total
3Q 2005 YTD
$ M
illio
ns

52
Rich Innovation Pipeline Selected Examples
Ag Herculex® ECB + CRW
GLY/SU TraitsGN2 Insecticides E2Y Insecticide
Broad Spec Fung.
Herculex® XTRA Stacks
Stalk Rot Resist.Yield Traits
Drought ToleranceNutrium® Low–Lin SB
Improved Feed+Fuel
SU BlendsSteward ®/Avaunt®
Proof of Concept & Early Development Adv. Development Launched
Herculex® XTRA + GLY/SU StacksEnhanced Soy Texture/Flavor

53
Rich Innovation PipelineSelected Examples
Elect.Hydrogen FC
FED Materials
Next Gen Refrig
Embedded Passives
PV Enhancements
DMFC
OLED Materials
Thermal Color Filters
Cyrel® FAST/Digital
PV MaterialsFodel® for PDP
Pyralux®Refrig Blends
Early Development Adv. Development Launched
Safety Magellan M5 HighStrength Fiber
TYV 202Tyvek® RoofingTyvek® Flashing
Kevlar® Adv. BallisticOn-Site SAR Units
Medical Fabrics
High performance sheet structures and
filtration media
Chem/Bio Protection
Biofilm treatment / elimination
C-cable Resins
Clean & DisinfectPower Systems

54
Perf. Mat.
Nanocomposites Green Hytrel®
Sorona® EP
Zytel® HTNBlow Molded EP
SentryGlas® Plus
Early Development Adv. Development Launched
Coat. Global Waterborne Technology
New Ink Jet Dispersions and
ColorantsRadiation Cure
Powder
Super High Solids
Artistri™ Digital
HyperCure™ ClearsLaminate Grade TiO2
Super Durable TiO2
Rich Innovation PipelineSelected Examples

55
0.0
0.5
1.0
1.5
2.0
2.5
3.0
3.5
2003A 2004A 2005 2006 2007
Cum
ulat
ive
Top
Line
Gro
wth
(Exc
lude
s re
plac
emen
t)$B
Business Identified Opportunity
Risk Adjusted (Traction Index)
Ag & Nutrition
Electronics
Safety & Protect
Perf MaterialsCoatings & Color
“Top 75” Revenue Projections

56
Growth Acceleration: Tracking Progress
• Total revenue from 5 year products
• Top line growth ($MM)from new products*
33%
700
2005 2006
34%
850
Targets
30%
630
2004Actual
2010
35%(4 yrs)
1,250
• Twice per year Pipeline updates
* Net of cannibalization

57
Growth Acceleration
Stake $850MM growth revenue in ’06 from new productsFurther 30% increase in innovation productivity by 2010
Scope All growth technology and marketing investments
Approach Reprioritize for current realities:- Increase resourcing of critical projects- Shut down marginal projects
Performance Percent of revenue from new productsMetrics Growth revenue from new product sales

Tom ConnellyTom ConnellySenior Vice President & Chief Science and Technology Officer Senior Vice President & Chief Science and Technology Officer
Bio-Based MaterialsExpansion
Bio-Based MaterialsExpansion

59
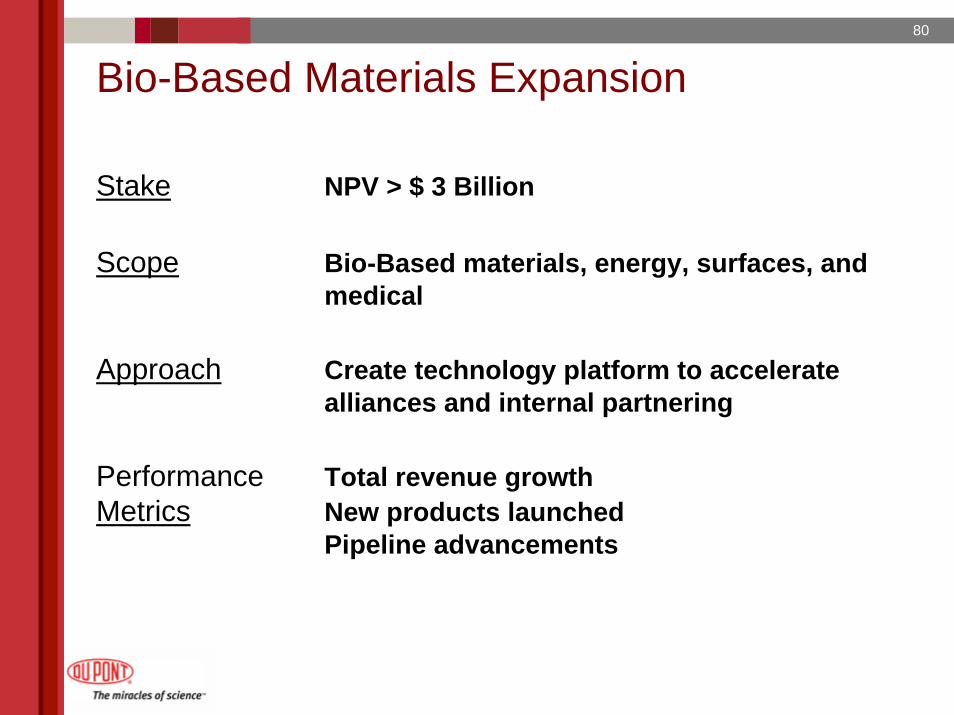
Bio-Based Materials Expansion
Stake NPV > $ 3 Billion
Scope Bio-Based materials, energy, surfaces, and medical
Approach Create technology platform to accelerate alliances and internal partnering
Performance Total revenue growthMetrics New products launched
Pipeline advancements

60
• Materials & Energy• Polymers • Fuels• Chemicals
• BioSurfaces• Personal Care• Fabric and Home Care
• BioMedical• Sealants & Adhesives• Interventional• Dental
Bio-Based Materials

61
0%100%200%300%400%500%600%700%800%
U S N a t . Ga s Oi l ( WTI )P r opy l e ne Gl y c ol C or n
1995 2000 2005
DuPont Bio-Based Materials “The right science at the right time”

62
Bio-Based Materials Strategy
Focus on transformative opportunities:
• Target areas of unique advantage
• Shape the industry with integrated knowledge base
• Establish partnerships to maximize value capture

63
Bio-PDO™
Sorona®
Polymer
Apparel
Elastomers
Fibers
Coatings
EngineeredResins
Flooring
PolyolsNew since
2004
Bio-PDO™ Strategy
Bio-PDO™New since
2004
Direct Applications
Cell software has been re-programmed to increase propanediol production by
500 fold

64
Loudon SiteLoudon SiteSept. 2005 Sept. 2005
DuPont Tate & Lyle BioProducts LLC&TATE LYLE

65
Materials PipelineNPV > $150 Million
Source of Uniqueness• High performance market applications
• Biocatalyst development know-how
• Renewable and sustainable feedstocks
• Sorona® Polymer• Bio-PDO™
• Polyols• Aromatics
• Bio-PDO™Extensions
• Sorona® PolymerExtensions
2006 2007 2008 2010

66
Fuels,Materials,Chemicals
Bio-Based Economy
• Environmental sustainability - energy security
• Biomass - the only renewable source of carbon
MetabolicEngineering
BiomassFeedstock

67
Sustainable Energy
DOE Vision of Oil Savings
Grain
Cellulose
0
5
10
15
20
25
30
35
2000 2005 2010 2015 2020 2025
Year
Eth
an
ol
(Bil
lio
ns
of
gal/
yr)
EXISTING
AdvancedCornMills
EMERGING
SugarPlatform-New Enzymes-Pretreatment-Fermentation
ADVANCED
FundamentalAdvances inLignocelluloseProcessingand fermentation
Re: J.D. McMillan, NREL

68
EnergyNPV >$1.5 Billion
Source of Uniqueness• Proprietary and economical biofuels
• Sustainable biofeedstocks with full value chain integration
• Novel bioprocesses as primary sources of innovation
• BioFuels II
• BioRefinery• Oil Recovery
• Biomass• BioFuels III
Present - 2007 2011 2009 - 2013 2015
• BioFuels I

69
Application• Uniquely specific to surfaces • Water-borne – no solvents• Non-toxic • Programmable placement
– On/off when desired• Novel functionality
BioSurfaces
Combining DuPont’s Biotech & Coatings Know-How
Anchor
Peptides/Proteins
DesiredAttribute
70
BioSurfaces Opportunity / Strategy
• Target high value-in-use– Personal care - hair, nails, oral, skin– Home & fabric care
• Driven by unique technology
• Maximize value capture– Partnerships

71
Source of Uniqueness• Transformational delivery systems that capture significant market value
• Peptides/proteins improve product safety and effectiveness
• Products leverage DuPont’s biology, materials and particle science know-how
BioSurfacesNPV > $300 Million
• Skin Care• Hair Care
• Skin Care Extensions• Hair Care Extensions• Oral Care
• Skin Care Extensions• Hair Care Extensions
• Home & Personal Care
2008 2009 20112010

72
BioMedical
• Sealants & Adhesives
• Dental Monomers
• Interventional Products

73
Tissuesurface
Sealants & Adhesives
Simple, Tunable, IP Protected
DuPont ActaMax™ Surgical Sealants

74
Incumbent ActaMax™***
ProductsSurgeon Needs
Prep time 30 minutes 30 secSet time 10 minutes 15 secBlood derived ingredients Viral carrier* Synthetic**
Patient BenefitsPerformance 3 days 14 + daysInflammatory responses Severe Non-detectableSlow resorption Uncontrolled – variable Tunable 1 - 60 days
* Risk of Hep C, HIV, or BSE** No risk of viral contamination*** Based on pre-clinical studies
ActaMax™ Performance

75
Monomer Formulation Production Distribution Marketing
Dental
DuPont Ultramer
DuPont monomer advantage> 33% less shrinkage
Dental composite manufacturers formulate
Enabling proprietary technology for differentiation
Composite Manufacturers

76
BioMedicalNPV > $1.5 Billion
Source of Uniqueness• Integrated science and engineering in very high value sectors
• DuPont inventions & DuPont/MIT Alliance
• Dental I
• Adhesives• Dental II• Interventional II
• Sealants• Interventional
• BioMedical II
2009 2011 20132007

77
Bio-Based MaterialsRich Innovation Pipeline
Biomass
BioMedical II
BioRefinery
BioFuels IIIBioFuels II
BioFuels I
BioMedical - Sealant
BioMedical – Dental
BioSurfaces – PC I
BioMedical – Interventional
Bio-Aromatics
BioSurfaces – PC III
Bio-PDO™ II
BioSurfaces – PC II
BioMedical – Dental II
BioSurfaces – PC IV
Early Development2010+
Adv. Development2007-2009
Launch2005-2006
Bio-PDO™Polyols
Sorona®EngineeredPolymers
GreenHytrel®
Bio-PDO™Derivatives
Sorona®Apparel
Sorona®Flooring
Bio-PDO™Coatings
Oil Recovery

78
Bio-Based Materials SummaryNPV > $3 Billion
Sorona®Bio-PDO™
Source of Uniqueness• Integrated science and engineering in very high value sectors
• IP and partnerships
Sorona® extBio-PDO™ extPolyolsDental IIBiofuels I & IISkin, Hair & Oral CareSealantInterventional I
Sorona® extBio-PDO™ extPolyolsDental IBiofuels ISkin & Hair Care
Sorona® extBio-PDO™ extPolyolsBioFuels IIIBioRefineryOil RecoverySealantInterventional IIAdhesivesHome & Personal Care
2008 2010 20122006

79
Bio-Based Materials: Tracking Progress
• Total revenue growth
• New products launched
• Pipeline advancements
NPV >$3B from Materials, Energy, BioSurfaces and BioMedical
80
Bio-Based Materials Expansion
Stake NPV > $ 3 Billion
Scope Bio-Based materials, energy, surfaces, and medical
Approach Create technology platform to accelerate alliances and internal partnering
Performance Total revenue growthMetrics New products launched
Pipeline advancements

81
Put Science To Work
Go Where The Growth Is
One DuPont - Productivity
Dynamic Science Company

82