DTIC S ELECTE CT 11993 U
100
AD-A270 704 AFIT/GEE/ENV/93S-05 DTIC ELECTE S CT 11993 U A PREDICTIVE MODEL FOR THE DETERMINATION OF THE ECONOMIC FEASIBILITY OF CONSTRUCTION AND DEMOLITION WASTE RECYCLING IN THE AIR FORCE THESIS Byron L. Dixon, Captain, USAF AFIT/GEE/ENV/93S-05 Approved for public release; di6tribution unli-nited 93-23828 II1i mll1lll
Transcript of DTIC S ELECTE CT 11993 U

AD-A270 704AFIT/GEE/ENV/93S-05
DTICELECTE
S CT 11993 U
A PREDICTIVE MODEL FOR THE DETERMINATIONOF THE ECONOMIC FEASIBILITY OF
CONSTRUCTION AND DEMOLITION WASTERECYCLING IN THE AIR FORCE
THESIS
Byron L. Dixon, Captain, USAF
AFIT/GEE/ENV/93S-05
Approved for public release; di6tribution unli-nited
93-23828II1i mll1lll
The views expressed in this thesis are those of the author and do not reflect theofficial policy or position of the Department of Defense or the U.S. Government.
Accesion Fur
NTIS CR4&I
DTiC ]/• 3
By..Di;,t b::fo;, '

AFIT/GEE/ENV/93S-05
A PREDICTIVE MODEL FOR THE DETERMINATION
OF THE ECONOMIC FEASIBILITY OF CONSTRUCTION AND DEMOLITION
WASTE RECYCLING IN THE AIR FORCE
THESIS
Presented to the Faculty of the School of Engineering
of the Air Force Institute of Technology
Air University
In Partial Fulfillment of the
Requirements for the Degree of
Master of Science in Environmental and Engineering Management
Byron L. Dixon, B.S.
Captain, USAF
September 1993
Approved for public release; distribution unlimited

Acknowledfements
I have had a great deal of help from others in the development of this
research. First, I would like to thank my advisor, Capt Jim Aldrich for helping to
coral my wild thoughts and pointing me in the right direction. I would also like to
thank Lt. Col George Kahias for taking the time to review my thesis from a practical
viewpoint. A word of gratitude is also due to the AFIT library staff for tirelessly
pursuing the multitude of interlibrary loan requests I generated. Finally, and moqt
importantly, I would like to express gratitude to my "silent thesis partner" and wife,
Lorette Dixon. In addition to her understanding and concern, she also provided me
with technical advise and pointers to improve the presentation of my thoughts.
Byron L. Dixon
ii

Table of Contents
Page
Acknowledgements ....................................... ii
List of Figures ......................................... vi
List of Tables .................... ... .... ....... ...... .. vii
A bstract . . . . . . . . . . . . . . . . . . . . . . . . . . . . . . . . . . . . . . . . . . . . . viii
I. Introduction ........................................ 1
General Issue ................................. 1
Specific Problem ............................... 2
Research Objective ............................. 4
Investigative Questions ............................. 4
Scope and Limitations of Study ........................ 4
Definition of Key Terms ............................. 5
Overview of Chapters ............................... 6
II. Literature Review .................................... 7
Introduction ................................. 7
iii

Page
Recycling Air Force C&D Waste ....................... 8
C&D Waste Composition ........................... 9
C&D Waste Recycling ............................. 11
Conclusion .................................. 19
III. M ethodology ....................................... 20
Introduction .................................. 20
C&D Waste Generation ............................ 20
Markets for C&D Recycled Materials ................... 23
Cost-Benefit Analysis ............................ 23
An Economic Model ............................ 26
Sum m ary ................................... 29
IV. Findings and Analysis ................................. 30
Introduction .................................. 30
C&D Waste Generation Estimates ..................... 30
C&D Recycled Materials Markets ..................... 36
Cost/Benefit Analysis ............................ 40
A Predictive Decision Model ........................ 47
Summ ary ................................... 53
iv

Page
V. Conclusions and Recommendations ......................... 55
Appendix A: C&D Waste Generation Worksheet .................... 58
Appendix B: Sample Market Survey ............................. 62
Appendix C: Cost/Benefit Analyses Worksheets ..................... 65
Appendix D: Data Gathered from Hill AFB, Utah .................... 71
Appendix E: C&D Waste Recycling Feasibility Model for Hill AFB for 1994 . . 73
Bibliography .......................................... 84
V ita . . . . . . . . . . . . . . . . . . . . . . . . . . . . . . . . . . . . . . . . . . . . . . . 89
v

Figure
1. Baseline Material Balance ................................... 24
2. Material Balance for Bases Near C&D Recycling Facilities ............ 25
3. Material Balance for Bases Without C&D Recycling Center ............ 25
4. Comparison of C&D Wasteflow Conposition Studies ................ 33
5. Do Nothing Altefiamuve Flowchart .......................... 40
6. Costs/Benefits when Transporting C&D Waste to Recyclers ............ 43
7. C&D Facility Capital Costs vs Production ........................ 46
8. The Relationship of Hauling Factor to Distance to Landfill and Unit HaulingCost at Hill AFB, Utah ................................. 51
9. Relationship of Economic Feasibility of C&D Waste Recycling to HaulingFactors and C&D Landfill Tipping Fees at Hill AFB, Utah ............ 53
vi

List of Tables
Table
1. END-USE MARKETS FOR OTHER C&D WASTE ................ 14
2. PROPOSED ESTIMATORS FOR GENERATION OF C&D WASTE ..... 32
3. DEMOLITION WASTE COMPOSITION FROM ARMY CERL STUDY .. 34
4. CONSTRUCTION WASTE COMPOSITION FROM TWIN CITIESSTU D Y . . . . . . . . . . .. . . . . . . . . . . . .. . . . . . . . . . . . . . . 35
5. C&D MATERIAL DENSITIES .............................. 36
6. SAMPLE MARKET PRICES FOR RECYCLED C&D MATERIAL ..... 39
7. INPUT VARIABLES FOR HILL AFB FOR 1994 ................. 48
vii

AFIT/GEE/ENV/93S-05
Abstract
This study created a model to be used at a CONUS Air Force base to
determine the economic feasibility of Construction and Demolition (C&D) waste
recycling. Three areas were investigated to develop this model: the methods to
determine amounts and types of C&D waste generated at a specific location, the
markets for recycled C&D wastes, and the recycling methods currently availaole.
From this data, gathered through records searches and interviews, a procedure was
developed to perform cost/benefit analyses on the available recycling options. A
model was then creat-! based on these calculations which can arm a manager witn
information to either support or reject a recycling program by indicating cost savings
or losses from recycling C&D waste. Also, the model aids managers in determining
the approximate quantities of recyclable materials being generated, which could be
valuable in reaching base recycling goals. To demonstrate the model, the feasibility
of recycling C&D waste at Hill AFB, Utah in 1994 was evaluated. In addition to
determining recycling feasibility, a method was presented to perform sensitivity
analyses on the base-specific input variables. This procedure can help determine
when it will become feasible to create a C&D waste recycling program.
viii

A PREDICTIVE COST MODEL FOR THE DETERMINATION
OF THE ECONOMIC FEASIBILITY OF CONSTRUCTION AND DEMOLITION
WASTE RECYCLING IN THE AIR FORCE
I. Introduction
General Issue
In an effort to increase resource recovery programs within the Federal
Government, President Bush issued Executive Order 12780 on 31 October 1991.
This order specifically calls for Federal Agencies to "promote cost effective waste
reduction and recycling of reusable material from waste generated by the Federal
Government" (11:1). In response to this order, the Assistant Secretary of the Navy
(Installations and Environment) asked the Society of American Military Engineers'
(SAME) Environmental Affairs Subcommittee to recommend pollution prevention
initiatives that relate to Department of Defense (DOD) design and construction
programs. Although results fro.:, this study have not yet been formalized, the draft
report includes the following recommendation:
[DOD should] establish policy consistent with safety,environmental, and health requirements, requiring waste associated withdemolition, site clearance, and construction (including renovation and
1

repair) be segregated and entered into reutilization or recycling
processes to the extent feasible. (29:4)
This recommendation is in line with the current Air Force Pollution Prevention
Policy Directive which specifically states that the Air Force will reduce municipal
solid waste through source reduction and recycling (15:1). As a follow on to this
policy directive, a Pollution Prevention Program Action Plan has also been issued
which sets the goal to reduce municipal solid waste by 50% by 1997. However,
considering the continL.-" _.",ne of the DOD infrastructure budget, the
recommendation to recycle construction and demolition (C&D) waste should only be
implemented if proven to be economically feasible.
Specific Problem
The economic feasibility of C&D waste recycling should be determined at
base-levrl, since the disposal costs, recycling costs, and recycling markets vary across
the Continental United States (CONUS). Even at the base-level, a number of
predictions and assumptions are required to thoroughly assess the influencing
conditions which effect the feasibility of C&D waste recycling. The Air Force
managers assigned to this duty must first forecast the amount of C&D waste that will
be generated at the base. They must also identify the C&D recycling industries and
markets available in their local area. This data must be used to compare the cost of
landfilling the waste to recycling it.
A predictive model can be developed to aid the base-level manager in the
decision of whether to implement a C&D recycling program, based on economics.
2

However, to ensure accurate analyses, the model must be capable of generalizing the
influencing conditions unique to each base. The three most important of these
conditions are the varying amounts and types of C&D waste, Local landfill costs, and
differing recycling markets.
Since bases have varying amounts of annual construction/demolition projects, a
generalized model is needed which could reasonably predict the quantity and
composition of a particular base's C&D wasteflow. This information will be crucial
to the determination of costs and available markets.
Currently, the location and number of C&D recycling companies in the United
States are limited. Traditionally, the catalyst of growth for the C&D recycling
industry has been high landfill costs. Since landfill costs are a primary function of
available space and local regulations, they vary significantly across the CONUS.
Consequently, the locations of the C&D recycling companies directly correlate to the
areas of the country where landfill fees have increased dramatically in the last five
years (49:28, 37:68, 32:36). A model to determine economical feasibility of
recycling C&D waste should, therefore, be flexible enough to account for varying
landfill costs.
To determine the economic feasibility of C&D waste recycling in an area, the
available markets for the recycled materials must be identified. In many cases, these
markets are dependant on a number of issues, including the availability of local
natural resources and the types of industry in the area (6:33, 2:61). To account for
3

these differing conditions, the model should be structured to accept various market
scenarios.
Research Objective
The purpose of this research is to create a generalized predictive model which
will help Air Force managers determine the economic feasibility of C&D waste
recycling.
Investigative Ouestions
To meet the stated research objective, the following investigative questions
must be answered:
1. What are the total annual quantities and types of C&D wastes generated atindividual Air Force bases?
2. What markets are available for these recycled C&D wastes?
3. Based on the markets for the generated C&D waste materials, what are thecosts and benefits associated with recycling C&D waste?
Scope and Limitations of Study
In addition to economic feasibility, several other issues could be addressed to
fully evaluate the extent to which C&D waste recycling is feasible. Some of these
issues include the possible environmental impacts of the recycling process, possible
Air Force liability, and the regard for worker and public health. Although all of
these issues may be important and could be considered, they will not be addressed in
this study. This study will be restricted to providing a predictive cost model for Air
4

Force CONUS bases only. The model may, however, have applications which can be
adjusted to be of use at other DOD CONUS installations.
lermition of Key Terms
Several key terms will be used throughout this study and must be defined to
fully understand the work that follows.
Construction and demolition (C&D) waste: "all waste resulting from the
construction, renovation, and demolition of buildings, roads, docks, piers, and all
other structures" (37:65).
Economic feasibility: the practicality with regard to cost versus benefit of
recycling vice landfill disposal of C&D waste (49:1 4).
Estimating factors: Unit measurements of construction, demolition, or
renovation of facilities used to estimate the generation and composition of C&D waste
at a particular location (10:4).
Horizontal construction/demolition: construction or demolition of roads,
airfields, bridges, landscapes, docks, and other non-building appurtenances (9:6).
Recycling: the use of an existing material to generate a new, usable product
(5:78).
Unit measurements: basic and accepted units of measure used in the
construction industry (e.g. square foot, linear foot, etc) (30:12).
Vertical construction/demolition: construction, renovation, or demolition of
buildings (9:6).
5

Overview of Chapters
In this chapter, the need to determine the feasibility of C&D waste recycling is
,iscussed. Specifically, the creation of a generalized, predictive model which can be
used to help base-level Air Force managers determine the economic feasibility of
C&D waste recycling, given base-specific criteria, was proposed.
In chapter II a review of the literature on C&D waste recycling is addressed
by discussing past C&D wasteflow studies, existing recycling technologies and
markets, and current recycling companies. The literature review also discusses
national pollution prevention trends which led to the passage of Executive Order
12780.
Chapter III addresses the methodology used to create the economic feasibility
model. The chapter begins with a presentation of the technique employed to estimate
the types and quantities of C&D waste generated at a specific base. A review of the
literature concerning the creation of the predictive models is also included in this
chapter. Finally, chapter III addresses the method of gathering the data needed to
compute costs and benefits of C&D waste recycling.
The economic model used to determine the feasibility of C&D waste recycling
is presented in Chapter IV. The assumptions and constraints used in the development
of the models are discussed in this chapter, as well.
Lastly, Chapter V includes a discussion of recommendations for using the
model and some suggestions for future research on this topic.
6
H. Literature Review
Introducto
The construction and demolition industry has been termed "The last major
industrial sector to undertake significant waste reduction and recycling programs"
(27:35). Although some efforts to recycle construction and demolition (C&D) waste
are now being made, the market is certainly still in its infancy. With recent national
emphasis placed on pollution prevention, and the large amount of construction and
demolition generated by the Air Force, there is great potential for Air Force
involvement in C&D recycling programs. The purpose of this chapter is to present a
review of the literature related to the technologies, incentives, and problems in the
C&D waste recycling market, and to discuss the role economics must play in
determining the feasibility of recycling C&D waste in the Air Force.
Data for this review was drawn from a search of published literature on C&D
waste, recycling of solid waste, studies of solid waste landfills, and applicable
governmental laws. Using this data, the chapter begins with a review of national
legislation and policy that led to the consideration of C&D waste recycling in the Air
Force. This will be followed by an analysis of available C&D wasteflow composition
studies. The recycling of these wastes will then be discussed. Finally, the chapter
will conclude with a discussion of the relevance of this review to the research
question noted in Chapter I.
7

Recycling Air Force C&D Waste
The Pollution Prevention Act of 1990, which was passed as part of the
Omnibus Budget Reconciliation Act of 1991, declared pollution prevention to be a
national policy (12:57). The Environmental Protection Agency (EPA), the agency
charged with the enforcement of the Pollution Prevention Act, defines pollution
prevention as follows:
Pollution prevention is the use of materials, processes, orpractices that reduce or eliminate the creation of pollutants or wastes atthe source. It includes practices that reduce the use of hazardous andnonhazardous materials, energy, water, or other resources as well asthose that protect natural resources through conservation or moreefficient use. (40:1)
To stress the importance of the Federal Government's compliance with the
Pollution Prevention Act, President George Bush issued Executive Order 12780 on 31
October 1991. This order specifically calls for Federal agencies to "promote cost
effective waste reduction and recycling of reusable material from waste generated by
the Federal Government" (11:1) Several Department of Defense (DOD) initiatives
were implemented in response to this order, of which two were of particular
importance to this study.
First, the Assistant Secretary of the Navy (Installations and Environment)
asked the Society of American Military Engineers' (SAME) Environmental Affairs
Subcommittee to recommend pollution prevention programs that relate to DOD design
and construction efforts. In their draft report, the SAME subcommittee recommended
that DOD establish policies requiring C&D wastes be recycled to the extent feasible
8

(30:4). The second DOD initiative implemented as a result of Executive Order
12780 was Air Force Policy Directive 19-4, issued by order of the Secretary of the
Air Force. This policy directive, entitled Pollution Prevention, contains a section
which explicitly states:
The Air Force will reduce municipal solid waste through sourcereduction and recycling. Installations will participate in recycling andcomposting programs conforming with regional solid wastemanagement plans. (15:1)
Since the Air Force's pollution prevention policy is in agreement with SAME's
recommendation that DOD recycle C&D waste where feasible, it can be assumed that
Air Force managers will soon be required to evaluate the feasibility of recycling their
C&D waste.
C&D Waste Composition
Several studies have concluded that construction and demolition waste accounts
for between 10 and 20 percent of solid waste generated in the U.S. (48:12, 27:35,
36:43). However, the characteristics of this major landfill contributor has not yet
been determined nationally. A number of reports were found during this review
which attempted to quantify the composition of specific C&D wastestreams.
The estimation of vertical demolition waste generation nationally was first
attempted in 1973 by Jones, et al. The research methodology for this study was
based on the important assumption that the materials used in the construction of a
facility would appear as a waste source at the end of that facilities lifespan. Since the
authors estimated the average lifespan of a facility to be 40 years, they gathered data
9
on the construction materials input for specific areas in the 1930s. Although many of
the authors' assumptions were later proven to be incorrect, they laid the groundwork
for future studies in this area (26:1-3).
In 1976, an investigation of the potential for resource recovery from
demolition waste was conducted at the Massachusetts Institute of Technology (MIT)
by Wiesman, et al. In this study, data was obtained by taking samples of vertical
demolition activity in three cities: Los Angeles, Boston, and Atlanta. The study's
population consisted of buildings razed from 1960-1975. The authors then applied
some of the assumptions made in the Jones, et al. study to conclude that the amounts
and types of waste material generated during the demolition of the facilities was
approximately equal to the amounts and types of materials that were initially used
during their construction. From these results, Wiesman, et al. calculated an estimate
of the total C&D waste quantity and composition for the United States (49:8-15).
In 1979, the NSF sponsored a new demolition waste study aimed at extending
the 1976 work to the point where the government would have a valid data base upon
which to establish policy for demolition. This report extended the data collection
from the 1976 study and developed a predictive model for demolition-waste
generation in any year and in any particular region of the country (48:7).
Although several national studies of C&D waste composition were conducted
in the 1970s, the only efforts in this area during the past 13 years have been
conducted locally, for specific economic reasons. One such study was accomplished
for Berkshire County, Massachusetts by Hayden-Wegman. Another similar study was
10
performed for the State of Vermont by C.T. Donovan and Associates (36:43, 48:1).
The third analysis was conducted by Innovative Waste Management for the
Metropolitan Council of the Twin Cities Area, Minneapolis, Minnesota (29:1).
The Massachusetts study was accomplished by interviewing homebuilders,
landscapers, waste haulers, woodworkers, and local governments in a rural county
(36:42). The methodology used in the Vermont study involved interviewing major
C&D waste generators from across the entire state (48:3). The study in Minnesota
was conducted by surveying several construction waste generators in the Twin Cities
area (29:3). The results from the various studies indicate that the determination of
quantities of the various C&D wastestreams is dependant upon the location and
methodology used in the studies. However, it should be noted that the wastestreams
considered were all chiefly composed of only three items: asphalt, concrete, and
wood (36:43, 48:12, 29:4-5).
C&D Waste Recycling
Although the idea of recycling C&D waste has been around for over 20 years,
only a small amount of this wastestream has received any attention from recyclers
until the last few years (23). To better understand this topic, a review of past efforts
to evaluate the economic feasibility of demolition waste recycling is presented. This
is followed by a discussion of present recycling technology, current recycling
companies, and incentives for future growth of this market. Finally, some problems
C&D recyclers are facing is addressed.
11

Economic Feasibility Studies. Two previously mentioned studies were found
which addressed the economic feasibility of recycling C&D waste. Both studies, as
noted above, were sponsored by the NSF. The first study, conducted in 1976,
concluded that recycling C&D wastes at that time may have been feasible in the
larger cities, where landfill space was already becoming scarce (49:15). The second
study, conducted in 1979 as a follow-on to the previous work, also limited the
possible economic feasibility of C&D waste recycling to the largest cities (48:224).
In both studies, the low cost of landfill disposal in most areas of the country wab a
key cause of the infeasibility of C&D waste recycling (49:15, 48:228).
Technology. Recycling markets are currently emerging for most of the
materials in the C&D wnstestream. From the previous studies mentioned above,
these materials can be divided into the categories of asphalt, concrete, wood, gypsum
wallboard, and others (36:43, 48:12, 29:4-5, 49:15, 48:25).
Asphalt. Asphalt recycling is traditionally accomplished by first taking
asphalt removed during demolition back to the processing plant. There, it is melted
and screened. Next, the aggregate is removed, and it is remixed with new bituminous
and sent to a new construction site (38:53).
Concrete. Like asphalt, concrete recycling generally involves removing
the waste from the demolition site, reprocessing the debris, and then shipping it back
to a new construction site. The largest use for recycled concrete to date is as
processed concrete stone, which closely resembles natural crushed stone. In this
form, it is quite suitable for use as base course beneath roads (2:60, 13:31, 28:77).
12

Large pieces of broken concrete can be used as riprap. Riprap is a material used to
stabilize steep slopes and shorelines in many areas of the country (35, 2:60).
Wood. The fastest growing recycling market within the C&D industry
involves the reuse of wood (21:77). In fact, a 1991 study on the need to ban wood
from landfills in Illinois concluded that the ban was unnecessary since wood recycling
was becoming a predominant trend among contractors (24:8). Currently, wood is
recycled for several uses. The majority of recycled wood is processed into chips and
used either to fuel wood-fired boilers or to create manufactured building products,
such as particle board. Another use for recycled wood is as an admixture for mulch.
In addition, the use of wood as a bulking agent for sludge compost has also shown
promising results (21:77, 17:87, 31:74, 33:85).
Gypsum Wallboard. In many areas, gypsum wallboard makes up 15 to
20 percent of the C&D wastestream. New West Gypsum, a Canadian firm, has
developed a method to turn this waste into new wallboard by mixing recycled gypsum
with virgin ore. The backing paper from the scrap wallboard is also reprocessed and
made into new sheets to be used on the recycled wallboard (32:35). Another
Canadian company, Canagro Agricultural Ltd., has created a market for recycled
gypsum wallboard that has grown to the point it can no longer meet the demand. The
company mixes some of the recycled gypsum with raw gypsum, and sells the product
as fertilizer. The remainder of the waste gypsum is processed, packaged, and sold as
a very popular cat litter. Finally, the flakes of paper backing and gypsum residue not
removed in processing are sold to farmers as a bedding for livestock (27:36).
13
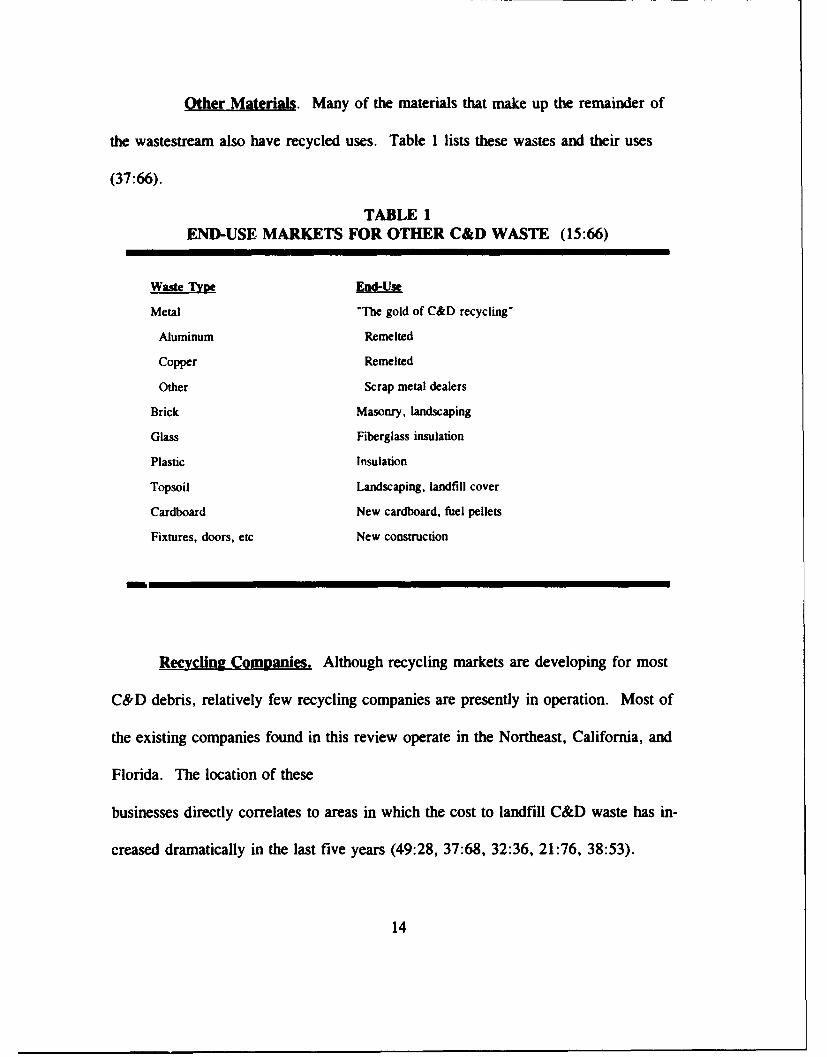
Other Materials. Many of the materials that make up the remainder of
the wastestream also have recycled uses. Table 1 lists these wastes and their uses
(37:66).
TABLE 1END-USE MARKETS FOR OTHER C&D WASTE (15:66)
Waste Type End-Use
Metal "The gold of C&D recycling"
Aluminum Remelted
Copper Remelted
Other Scrap metal dealers
Brick Masonry, landscaping
Glass Fiberglass insulation
Plastic Insulation
Topsoil Landscaping, landfill cover
Cardboard New cardboard, fuel pellets
Fixtures, doors, etc New construction
Recycling Companies. Although recycling markets are developing for most
C&D debris, relatively few recycling companies are presently in operation. Most of
the existing companies found in this review operate in the Northeast, California, and
Florida. The location of these
businesses directly correlates to areas in which the cost to landfill C&D waste has in-
creased dramatically in the last five years (49:28, 37:68, 32:36, 21:76, 38:53).
14

The study of C&D waste conducted for the State of Vermont found that, of the
35 C&D recycling businesses in the state, only 2 process the full C&D wastestream.
The other facilities handle only asphalt,
concrete, and/or wood (48:65-66). The San Francisco Bay area, on the other hand,
claims the most organized of the sparse C&D recycling industries. Several recycling
businesses are flourishing there because municipalities are beginning to target indus-
trial waste to meet state-mandated recycling goals. As in the Northeast, the majority
of the waste targeted for recycling is limited to asphalt, concrete, and wood (23).
Similarly, Kimmins Recycling Corporation has established a network of recycling
centers across urban areas of the state of Florida, except each facility accepts almost
all C&D waste (49:26). In addition, Realco Recycling Company of Florida has
established a recycling-hauling operation which recycles 99.7 percent by weight of all
C&D waste that it receives (34:46, 35).
Incentives. Although few C&D recycling companies presently exist in the
United States, several important incentives are developing which could soon make
C&D waste recycling one of the fastest growing industries in the nation (23). These
incentives can be grouped into the following areas: laws, cost, and governmental
assistance.
Laws. Traditionally, the federal government has paid little attention to
solid waste in general, and no attention to C&D waste in particular. According to
Ellen Pratt of the EPA, "C&D waste is not getting a lot of attention from the EPA
because the agency needs more information about C&D recycling." In 1990, the
15

EPA published a report entitled Characterization of Municipal Solid Waste: 1990
update. According to Robert Brickner and Eileen Glass, authors of the article
Shedding Light on C&D Issues, the report did not even mention C&D waste (5:70).
In the past, state governments regulated C&D waste disposal using the
assumption that C&D debris was inert and harmless. Because of this assumption and
the fact that C&D waste items were bulky and hard to compact, most states provided
separate landfills for C&D debris. These landfills fell under different regulations than
those for ordinary Municipal Solid Waste (MSW). Requirements for leachate
collection systems and liners for C&D landfills were far less strict, and even
nonexistent in some states. Unfortunately, some recent studies have indicated that
landfilled C&D was:- may not be as harmless as originally thought.
One of the studies was accomplished by Sanifill Inc., as reported in Waste Age
in 1991. This study, reported that groundwater around the three C&D waste landfills
in Houston, Texas was adversely affected by leachate. Another study, as reported by
BioCycle, was commissioned by the Greater Vancouver Regional District. This effort
concluded that C&D waste landfills in British Columbia were producing noxious
Hydrogen Sulfide gas and metallic Sulfide leachate.
Although no conclusive evidence has been presented which confirms that C&D
waste poses a significant environmental threat, many states have begun to toughen
their C&D landfill regulations to resemble other MSW landfill requiremeiits (7:15,
49:27, 36:42).
16
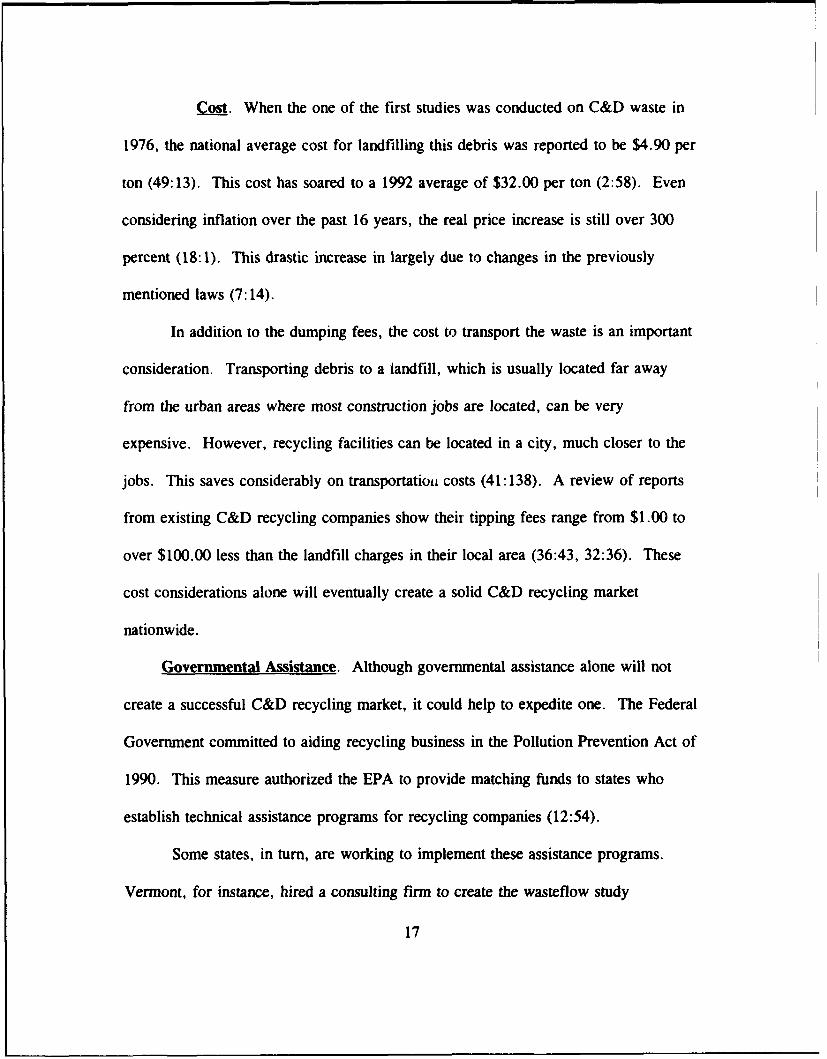
Cost. When the one of the first studies was conducted on C&D waste in
1976, the national average cost for landfilling this debris was reported to be $4.90 per
ton (49:13). This cost has soared to a 1992 average of $32.00 per ton (2:58). Even
considering inflation over the past 16 years, the real price increase is still over 300
percent (18:1). This drastic increase in largely due to changes in the previously
mentioned laws (7:14).
In addition to the dumping fees, the cost to transport the waste is an important
consideration. Transporting debris to a landfill, which is usually located far away
from the urban areas where most construction jobs are located, can be very
expensive. However, recycling facilities can be located in a city, much closer to the
jobs. This saves considerably on transportation costs (41:138). A review of reports
from existing C&D recycling companies show their tipping fees range from $1.00 to
over $100.00 less than the landfill charges in their local area (36:43, 32:36). These
cost considerations alone will eventually create a solid C&D recycling market
nationwide.
Governmental Assistance. Although governmental assistance alone will not
create a successful C&D recycling market, it could help to expedite one. The Federal
Government committed to aiding recycling business in the Pollution Prevention Act of
1990. This measure authorized the EPA to provide matching funds to states who
establish technical assistance programs for recycling companies (12:54).
Some states, in turn, are working to implement these assistance programs.
Vermont, for instance, hired a consulting firm to create the wasteflow study
17

previously mentioned in this review. In addition to characterizing the wastestream,
the report also outlined steps to create a successful recycling business. Vermont is
now in the process of establishing a state-funded revolving loan or interest subsidy to
facilitate investment into recycling markets (37:67-68). Similarly, the State of
Washington is working through their Department of Economic Affairs to encourage
recycling by requiring state-funded construction projects to include recycled products
when possible, and assisting local recycling companies to improve their processes
(3213:36). Other states actively involved in developing aggressive C&D recycling
programs include Florida, Minnesota, Texas, and California.
Problems. As with any large process change, there are obstacles to overcome
in the C&D waste recycling industry. One problem is the segmented nature of the
construction business, and the large number of small companies. Another difficulty is
the lack of space for sorting and storing recyclables on a construction job. Most
construction debris bins are accessible to the public, and can easily be contaminated
by unauthorized dumping (11:35). Yet another concern involves attaining permits to
operate C&D recycling facilities. Many recycling business owners have stated that it
is very frustrating to try to obtain local approval for a C&D recycling facility. Since
currently there are very few recycling facilities, waste from large distances away are
brought in to those who are in operation. Many residents around these facilities
quickly develop a not-in-my-backyard attitude about this practice (2:75-76, 20:61). In
addition, many local environmental regulators have shown concern regarding possible
environmental contamination caused by the various recycling operations (35, 19:58).
18
The most significant barrier, however, is the lack of nationally established recycling
markets for C&D debris. To encourage further development of these markets, more
reliable information on C&D debris is needed (11:35).
Conclusion
There are many advantages to recycling C&D waste. Some of these include
reducing landfill use 10 to 20 percent, meeting recycling goals, saving natural
resources, and possibly reducing liability should C&D waste be deemed
environmentally hazardous in the future. Although these are all noble reasons to
create a C&D waste recycling program, the key advantage that will make a difference
to the construction industry, as well as the Air Force, is cost savings.
In the 1970s, experts found that C&D waste recycling was not economically
feasible due to the abundance of inexpensive landfills around the country. This
resource is rapidly becoming depleted, even in the most rural locations. The rising
cost of landfill disposal, along with the other incentives mentioned above may be the
required catalyst to make recycling a feasible option for handling C&D debris.
19
IM. Methodology
Introductigon
This chapter describes the research methodology needed to construct a
predictive model which will evaluate the economic feasibility of construction and
demolition (C&D) waste recycling at Air Force installations. The construction of this
model will require data which answers the following investigative questions:
1. What are the total annual quantities and types of C&D wastes generated atindividual Air Force bases?
2. What markets are available for these recycled C&D wastes?
3. Based on the markets for the generated C&D waste materials, what are thecosts and benefits associated with recycling C&D waste?
This chapter addresses the techniques which were employed to gather
the data needed to answer each of these questions sequentially. The chapter concludes
with the presentation of a proposed model which utilizes all of the gathered data to
determine the economic feasibility of C&D waste recycling at a particular base.
C&D Waste Generation
To answer the first investigative question, the quantities and types of C&D
waste generated at a base during a specific period must be estimated. In addition to
the research efforts mentioned in Chapter Ii, some similar efforts important to the
methodology of this research have been made to characterize demolition wastes
20

generated on a national and regional level. Therefore, a brief review of these past
works is offered. This review will be followed by a presentation of the methodology
which can be used to estimate C&D waste at a particular Air Force base.
Wilson, et al. Study. In 1979, the authors of the 1976 MIT study mentioned
in Chapter II performed another demolition waste study. This study was aimed at
extending the 1976 work to the point where the government would have a valid data
base upon which to establish policy for demolition, if needed. The authors of this
report extended the data collection from their 1976 study from three major cities to a
total of 27 cities, small towns, and counties. In the 1979 study, they also offered
some correlation analyses between demolition waste generation and several possible
influencing factors. These factors included various census data from the sample
areas, such as percentage of vacant housing units, percentage of owner-occupied
housing units, average rent values, and population density. While some positive
correlations were discovered in the study, the authors also found that in many cases
over 50 percent of the demolition waste generated failed to correlate to any of the
census data analyzed (48:7-15).
US Army Corps of Engineers Studies. Two studies, conducted in
1976, were commissioned by the U.S. Army Corps of Engineers' Construction
Engineering Research Laboratories (CERL) at Battelle Columbus Laboratories. These
studies were aimed at documenting demolition techniques used, costs incurred, and
wastes produced in normal Army peacetime activities. Both of these works noted that
Army structures tended to be predominantly composed of either wood, or
21

brick/concrete. These results were more restrictive than the spectrum of structures
encountered by either of the Wilson et al. works (9:56, 10:87). The first Army
study, dated October 1976, provided a means of estimating volumes of vertical
demolition waste based on the type of structure and its area (10:71). The second
study, dated December 1976, provided estimates of the composition of the C&D
wastestream for vertical demolition on a typical Army installation (9:11).
C&D Waste OtQantities Generated at an Air Force Base. Considering the
available information pertaining to calculating C&D wasteflows as provided by the
studies previously mentioned in this chapter and Chapter II, a records review of these
reports was used to determine a method of estimating waste quantities generated at a
particular Air Force base. Each of the studies noted, however, presented disparate
methods of calculating waste quantities. Therefore, reasonable judgement was used to
select the results from the study which most closely represents the cases typical to an
Air Force installation. From this evaluation, the US Army studies were selected over
the other studies mentioned primarily for two specific reasons. First, the sample
population for the study included several military installations, including an Air Force
base. Second, the Army's studies demonstrated a more valid relationship between
their explanatory variables (the type and area of the demolished structures) and their
dependant variables (amount of waste generated). The other studies provided
estimators for the amounts of waste generated depending on various census data, such
as the size of the sample population. Since the residential area of an Air Force base
22
is much less populated than that of a city of equal size, these factors may not be
applicable to a base,
Markets for C&D Recycled Materials
To answer the second investigative question, data was gathered to help identify
and characterize the available markets for the C&D waste-recycled products. This
data was obtained through an extensive literature review as well as through personal
interviews with C&D waste recyclers and state and local solid waste managers.
Through this process, several important characteristics of each of the recycled
materials in the C&D wasteflow was evaluated.
Cost-Benefit Analysis
To determine the economic feasibility of C&D waste recycling, the costs and
the benefits of the proposed program were analyzed. The method chosen to
accomplish this has been specified in a class handout, entitled Pollution Prevention
Economics. James Aldrich, PhD, author of the handout, states that the first step in
determining the cost of a project is to establish a baseline for the analysis (1:73). For
the purposes of this study, the baseline was considered to be the status-quo
alternative, which is the disposal of all C&D waste in landfills. The method of
computing the baseline cost was determined by performing a material balance where
all relevant input expenses and output revenues for the process are identified. A
conceptual depiction of the baseline material balance is presented in Figure 1.
23

HaulingCoatA.F.
C&D LandfillWaste Tipping
Fees
Figure 1. Baseline Material Balance (43:15, 17:14)
Once a material balance for the baseline option has been created the cost of
recycling must be approximated. The first situation addressed is the case where the
Air Force base is located near a full-scale C&D recycling center. Figure 2 shows one
conceptual material balance for this case.
For the case where little or no recycling capability is currently available to a
base, a more detailed analysis of recycling cost was required to determine the
feasibility of contract recycling options. To accomplish this analysis, an estimation of
the cost of constructing and operating a recycling plant was required. This
information was compiled through records searches and interviews with C&D waste
recyclers. The material balance for this case is shown in Figure 3.
24

Hauling
cost
Nam etelykb~mLandfill
TippingFees =111m
A.F.C&D
Waste
Hauling m RecyclinCostReyln
mclrwý*CenterTippingFees
Figure 2. Material Balance for Bases Near C&D Recycling Facilities(8:26, 29:10-11)
PO.HaulingCost
A.F. Tipping LandfillC&D Fees
Waste
Aecyc"Ab" RecycleI
IrMaterials Wat
Overhead =00-Capital Cost =@M- ContractO&M Costs meom
Regulatory RecyclingCostsProf It moum.-
Figure 3. Material Balance for Base Without C&D Recycling Center
(35, 8:26)
25

An Economic Model
Once all of the answers to the investigative questions were accumulated, a
model was developed which provides an indication of if and when it is economically
feasible to recycle C&D waste for a specific base. In order to furnish a
demonstration of this model, a sample base was evaluated for a specific tune period.
Hill AFB, Utah was selected for this evaluation, and the timeframe for evaluation was
selected to be the year 1994. The selection of Hill AFB for this evaluation in no way
represents a valid or reliable statistical sample. Instead, the data from Hill was used
merely to describe the method by which any Air Force manager tasked with a similar
responsibility can approximate the feasibility of C&D recycling at a specific location.
The methodology used to conduct this evaluation will be presented by first
discussing the data needs and collection techniques. This will be followed by a
discussion of the methods used to determine the economic feasibility, considering the
data collected for Hill AFB. Finally, the procedure used to analyze the variance of
each of the parameters and to predict the economic feasibility, given a change in some
of the given parameters will be offered.
Data Requirements and Collection Methods. The data required to operate
the model was determined through a review of the previously mentioned cost/benefit
analyses. To determine the C&D recycling options disposal requirements in the
vicinity of Hill AFB, a questionnaire was sent to the Hill Simplified Acquisition of
Base Engineering Requirements (SABER) contractor, BENECO Enterprises.
BENECO has been the SABER contractor at Hill for seven years, and Mr. Russell
26
Jex, the BENECO program manager contacted, has been in charge of these operations
for five years. During that time, BENECO has been responsible for over 360
projects at Hill that range from large vertical construction to small remodeling jobs
(25). Therefore, Mr. Jex was considered to be an expert on the construction waste
disposal markets and conditions in the area. Appendix D (a) lists the questions sent
and responses obtained from Mr. Jex.
In addition to the market and disposal conditions, the amount of C&D waste
produced at Hill AFB needed to be estimated for a given year. To gather this
information, a Civil Engineering programmer, Mr. Ron Daniels, was solicited for
support through a telephone interview. The year 1994 was selected as the timeframe
for evaluation since the estimates of construction and demolition activity for this year
were considered by Mr. Daniels to be fairly accurate. Appendix D (b) lists the
questions asked and responses given from Mr. Daniels.
Determining Economic Feasibility. The economic feasibility of C&D waste
recycling was determined for Hill AFB by first developing formulas to calculate the
overall costs and benefits of the applicable baseline and recycling options. These
formulas were then included into a computer spreadsheet model. The site-specific
data that was gathered from Hill was loaded into the spreadsheet model as the input
variables. Given these variables, a feasibility factor was determined for 1994 at Hill
AFB. This factor is defined as the cost of the most economic baseline alternative
minus the cost of the most economic recycling option. Therefore, if the feasibility
27

factor were determined to be a non-negative number, C&D waste recycling could be
considered feasible.
Sensitivity Analysis and Future Economic FeAsibility. A sensitivity analysis
for each of the input variables was conducted by changing their values in the
spreadsheet model from -100% to 200% of the given amount, while holding all other
input variables constant. In some cases, the allowed variance was less due to
practical reasons. For instance, the percentage of concrete-type vertical demolition
was not allowed to vary above an 80% addition to its estimated amount of 20%, since
any variance above that amount would exceed 100% of the total amount of
demolition.
Using the model, i,,w feasibility factors were determined for each variance of
the input variables. The relationships between the feasibility factor values and the
independent variances of each of the input variables were then plotted. From these
graphs, the parameters whose variance caused a pronounced change in the feasibility
factor were identified as indicator variables. The values of the indicator variables
were then allowed to vary simultaneously, and the effects on the value of the
feasibility factor were again plotted.
Su-mma
This chapter provided a description of the proposed methodology needed to
create a predictive model to determine the economic feasibility of C&D waste
recycling at any given Air Force base. First, methods were proposed to gather the
28
data required to answer the investigative questions. This included a review of past
methodologies used in similar studies and a discussion of how the past research will
influence this study. The chapter also identified needed data which will be gathered
through further record analysis and literature reviews. Finally, an economic model
was introduced, and the required uses of the particular data to create such a model
was explained.
29
IV. Finding§ and Analysis
Introduction
In this chapter, a summary of the findings obtained through use of the
methodologies presented in Chapter III are addressed. These findings provided the
answers to the investigative questions presented in Chapter I and reemnphasized in
Chapter III of this rep, r+'- results of the research will be discussed by first
presenting a method for estimating C&D waste generation at a particular Air Force
base. Next, the market factors which affect the feasibility of C&D waste recycling
will be discussed. The data needed to perform a comprehensive cost/benefit analysis
on C&D recycling options will be reviewed, and finally, a predictive decision model
will be offered to help managers determine when it is economically teasible to recycle
C&D waste.
C&D Waste Generation Estimates
In order to perform a cost/benefit analysis for C&D recycling, the types and
weights of each of the wastes generated must be estimated. This can be done by first
determining estimates of the volume of waste generated. This total volume can then
be divided into the approximate percentages of each material in the C&D
wastestream. Finally, given the densities of each of the materials in the wastestream,
the weights of each of the materials in the wastestream can be obtained.
30
C&D Waste Volume Estimates. As mentioned in Chapter III, several studies
have been conducted which attempt to characterize construction and/or demolition
wastes on national and regional levels. From a records search of these reports,
approximate unit measurements have been found to estimate waste volumes generated.
Table 2 lists these unit measurements for the studies discovered during the records
search.
Since this thesis calls for the estimation of C&D wastes generated on an Air
Force base, the data that is most relevant to this cause is that derived by the Army
CERL study. As noted in Chapter III, the authors of this study found that most of
the buildings on the military bases sampled were predominantly composed of either
concrete/brick or wood. For the purposes of this thesis, the assumption will be made
that all structures on the base are either predominantly concrete/brick or wood.
Although the Army CERL study failed to include estimators for horizontal demolition,
this amount can be adequately estimated for a base by simply determining the volume
of the pavements to be demolished and applying an estimating factor for the creation
of rubble. For asphalt, the volume of horizontal demolition should be multiplied by
1.33 to attain a realistic volume of asphalt rubble. Similarly, the volume of
horizontal concrete demolition should be multiplied by a factor of 1.45 (9:26).
Moreover, no estimators are needed for horizontal construction and renovation
projects, since they generate a negligible amount of organic or inert waste which are
normally used or buried on-site (35).
31
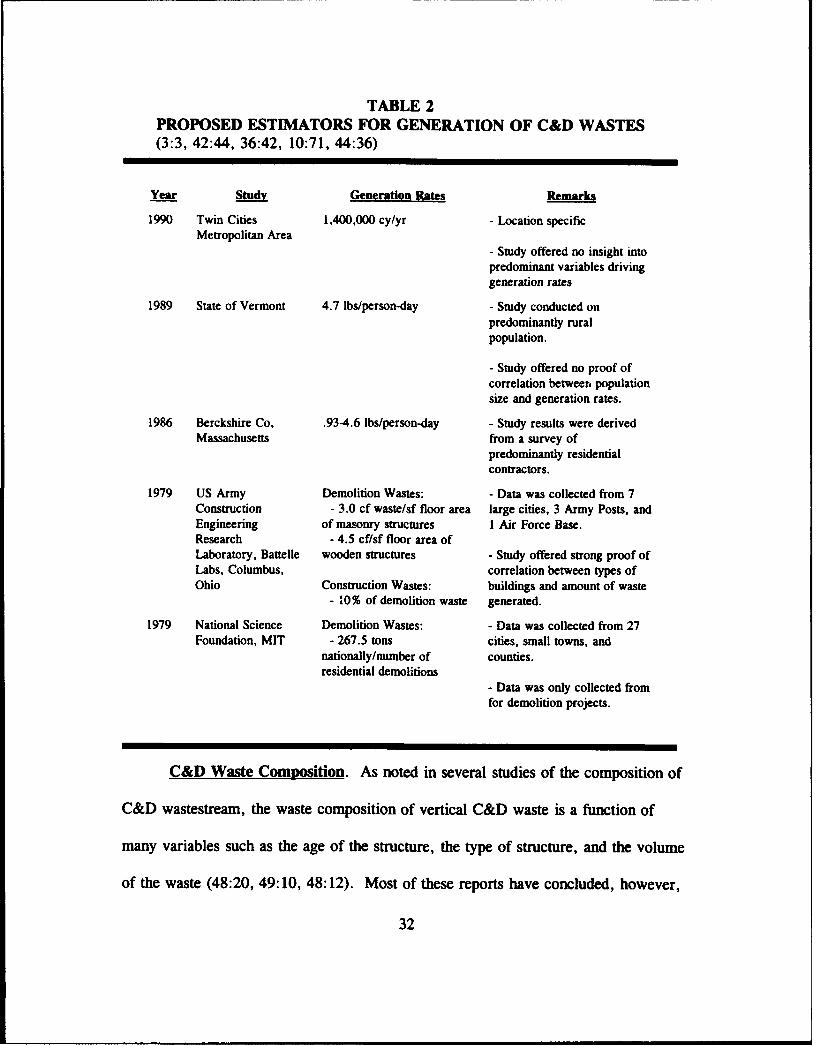
TABLE 2PROPOSED ESTIMATORS FOR GENERATION OF C&D WASTES(3:3, 42:44, 36:42, 10:71, 44:36)
Year Study Generation Rates Remarks
1990 Twin Cities 1,400,000 cy/yr - Location specificMetropolitan Area
- Study offered no insight intopredominant variables drivinggeneration rates
1989 State of Vermont 4.7 lbs/person-day - Study conducted onpredominantly ruralpopulation.
- Study offered no proof ofcorrelation between populationsize and generation rates.
1986 Berckshire Co, .93-4.6 lbs/person-day - Study results were derivedMassachusetts from a survey of
predominantly residentialcontractors.
1979 US Army Demolition Wastes: - Data was collected from 7Construction - 3.0 cf waste/sf floor area large cities, 3 Army Posts, andEngineering of masonry structures I Air Force Base.Research - 4.5 cf/sf floor area ofLaboratory, Battelle wooden structures - Study offered strong proof ofLabs, Columbus, correlation between types ofOhio Construction Wastes: buildings and amount of waste
- 10% of demolition waste generated.
1979 National Science Demolition Wastes: - Data was collected from 27Foundation, MIT - 267.5 tons cities, small towns, and
nationally/number of counties.residential demolitions
- Data was only collected fromfor demolition projects.
C&D Waste Composition. As noted in several studies of the composition of
C&D wastestream, the waste composition of vertical C&D waste is a function of
many variables such as the age of the structure, the type of structure, and the volume
of the waste (48:20, 49:10, 48:12). Most of these reports have concluded, however,
32
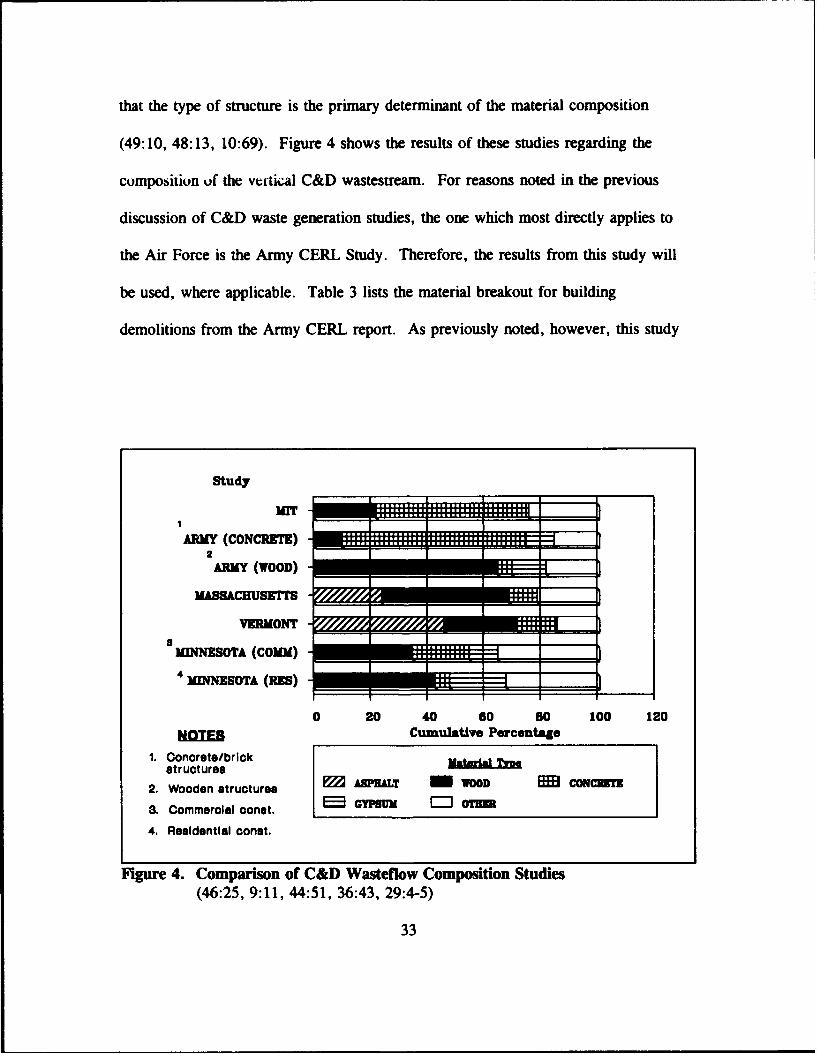
that the type of structure is the primary determinant of the material composition
(49:10, 48:13, 10:69). Figure 4 shows the results of these studies regarding the
composition of the vtftical C&D wastestream. For reasons noted in the previous
discussion of C&D waste generation studies, the one which most directly applies to
the Air Force is the Army CERL Study. Therefore, the results from this study will
be used, where applicable. Table 3 lists the material breakout for building
demolitions from the Army CERL report. As previously noted, however, this study
Study
MIT __ _ _
1
ARMY (CONCRETE) ........2
ARMY (WOOD)
MASSACHU5FSETTS- __
1. Ooncrete/brick mtr tstructures
VERMONTo -H3coca'r
2. Wooden structures MAp&T =T8E oim
3. Comnmerol1 conkt.
4. Residential conet.
Figure 4. Comparison of C&D Wasteflow Composition Studies
(46:25, 9:11, 44:51, 36:43, 29:4-5)
33

only concentrated on vertical demolition. Further information is needed to consider
horizontal demolition as well as vertical construction and renovation.
The determination of material composition of horizontal demolition is
relatively straightforward. The vast majority of the material is either asphalt or
TABLE 3DEMOLITION WASTE COMPOSITION FROM ARMY CERL STUDY (9:11)
Materials Percentage According To Type of Structures (%)
Concrete/Brick Structure Wooden Structure
Concrete 65 5
Bricks 10 14
Wood 10 65
Gypsum Board 10 12
Metals 3 2
Other 2 3
concrete. A quick review of old drawings can give a reliable estimate of the
percentages of each on projects where both materials were used.
The material breakdown for vertical construction and renovation projects differ
somewhat from building demolitions. Since the Army CERL study did not provide
estimates for these materials, another study must be used. The only study found
which looked only at construction and renovation wastes was conducted by the
Metropolitan Council of the Twin Cities Area, Minneapolis, MN. The 1993 study,
34

which was published as part of the Construction Materials Recycling Guidebook,
divided the results into commercial buildings and residential buildings (29:4-5). For
the purposes of this study, the assumption is made that the commercial buildings in
the Twin Cities report roughly coincide with the concrete and block buildings sampled
in the Army CERL study. In turn, the residential building in the Twin Cities report
are assumed to approximate materials found in the wooden structures sampled in the
Army CERL study. These values can be found in Table 4.
C&D Waste Material Densities. In order to determine approximate weights
of the various C&D waste materials generated at a particular base, the material
densities must be multiplied by the estimated volumes. These densities were compiled
in a related study jointly sponsored by the Minnesota Pollution Control Agency and
the Metropolitan Council, Minneapolis, MN. Table 5, an excerpt from their report,
lists the densities of the most common C&D wastes.
TABLE 4CONSTRUCTION WASTE COMPOSITION FROM TWIN CITIES STUDY
(29:4-5)
Materials Percentage According To Type of Structures (%)
Concrete/Brick Structure Wooden Structure
Concrete 20 5
Bricks 5 1
Wood 35 35
Gypsum Board 10 20
Metals 6 1
Other 24 38
35

TABLE 5C&D MATERIAL DENSITIES (20:11)
Material Avg Density (lbs/cv) Ava Density (tons/cf)
Wood 333 0.0062
Brick 1,750 0.037
Gypsum Board 1,500 0.028
Metal 500 0.0093
Concrete/Asphalt Rubble 2,500 0.048
Other Waste 648 0.012
C&D Waste Calculations. Given the estimating factors presented in the
previous tables, the amount of C&D waste generated annually at a specific Air Force
base can be determined by completing the worksheet provided in Appendix A.
C&D Recycled Materials Markets
One of the key ingredients to an economically feasible C&D recycling
program is the availability of reliable markets for the recycled product. Results from
the available research indicate that existing market conditions for C&D recycled
materials are a function of many factors. The two most important factors which
govern these markets are geographic location and state and local governmental
regulations (23, 32:68, 16:33).
Geographic Location. The geographic location of a base can affect C&D
waste recycling markets in a number of ways. Since a large portion of the C&D
36
wastestream is composed of concrete and asphalt, areas with little rock and gravel
resources have excellent markets for these pulverized materials (28:77). As
previously mentioned, wood is also a common C&D waste material. Therefore, areas
with large power generation plants or factories that use incinerators have a strong
market for wood chips as a form of fuel (17:86, 35, 39:52). New markets are also
emerging in metropolitan areas for reusable construction and demolition material.
Some examples include doors, windows, dimensional lumber, trusses, etc (38:53,
49:115-117).
Government R _glati nq Several governmental policies and regulations have
worked to restrict the market development of recycled C&D materials. One of the
problems a number of recyclers face when dealing with the state and local
governments is the determination of what type of permit to obtain for their operations
(35, 19:58). For instance, some states do not consider using wood debris as fuel to
be recycling. Therefore, different permits are required for recycling facilities that sell
their wood product as a fuel (21:77). Additionally, many state, local, and Federal
agencies do not allow for recycled materials to be used on their construction projects.
This creates a large restriction in the use of recycled concrete and asphalt, since most
road work is done for some governmental agency (5:78).
Although state and local officials have been slow to recognize the need to
encourage markets for C&D recycled materials, a number of efforts have recently
been made (and more are underway) to reverse this trend. A number of state,
county, and municipal solid waste departments are developing market guides and
37

wasteflow studies to encourage the development of more C&D waste recycling
initiatives in their jurisdiction (23). One such study for the Minneapolis-St. Paul,
Minnesota area is included in Appendix B as an example of the information currently
being generated by several solid waste departments. Other states currently working
on similar projects include New Jersey, Florida, North Carolina, New York, Texas,
Vermont, Massachusetts, Washington, and Oregon (23, 35, 32:35, 39:53).
Determinigg Market Prices for C&D Waste. Although, as noted above, the
markets for recycled C&D materials is very location-specific, William F. Cosulich
Associates performed a survey in 1991 which led to their report of nationally
representative markets and prices for selected recycled C&D materials. The results of
their survey, as reported in Resource Recycling, are noted in Table 6 (2:60). This
table should be used as a market reference only in the absence of local data. The
local data, which may be available from the local solid waste management agency,
would provide a more accurate depiction of conditions in the specific area of concern.
Cost/Benefit Analysis
The first step that should be taken to evaluate the costs and benefits of C&D
waste recycling is to establish a baseline for the analysis. Once a baseline has been
established, the various recycling options should be analyzed. These options include
turning the waste over to a recycler-hauler, transporting the material to the nearest
recycling facility, or contracting to bring a recycler to the waste, either temporarily
for a large construction/demolition project, or on a permanent basis.
38

TABLE 6SAMPLE MARKET PRICES FOR RECYCLED C&D MATERIALS (2:60)
Material Market Price (Sltoa)
Rubble Asphalt 6- 7
Fill 4- 6
Landfill Cover 4- 6
Riprap 4- 7
Road Sub-Base 5- 8
Brick Decorative Purposes 8-15
Clean Shredded Wood
3"-4" Pieces Bank Stabilizer 0-15
1"-3" Piec-s Boiler Fuel 10-35
1"-3" Pieces Bulking Agent 15-20
1 "-3" Pieces Mulch 10-45
1" Pieces Particleboard 5-20
Gypsum Wallboard Agricultural gypsum 100
Wallboard 0- 5
Carpet Padding Carpet Pads 140
Asphalt Roofing Parking Lots 2
Pothole Repair 57
Asphalt Modifier 60
Baseline Analysis. The baseline for disposal of C&D waste should be the do-
nothing alternative, which, in most cases, would be to continue disposing of the waste
in landfills. In many locations, even the status-quo alternative of landfilling may soon
require an economic analysis. As previously mentioned, a number of municipalities
across the country are in the process of closing their designated C&D waste landfills.
39

The decision flowchart noted in Figure 5 can be used to select the cheapest do-nothing
alternative.
In all of the alternatives noted in Figure 5, the costs involved are the landfill
tipping fees plus the hauling costs. At present, the national median tipping fees for
Yes liandfill avail"~?N
Haul to C&D weeelaD
Dandfll.
prd 0t C&DwadeCosts: Toping fees&No tmH ft
& 5.Jn D h e ia
4H0A to local MSW
Is the cost of disposal at a
ye nba s rwNo & H"uV
C&D IarxfIllI.I
Fligure 5. Do-Nothing Alternative Flowchart
40

C&D landfills are between $26.00 - $32.00/ton, with the costs ranging from a low of
$5.00/ton in the Rocky Mountain states to $65.00/ton in the Atlantic and New
England states (2:58). These figures, however, are simply representative. The best
way to determine information regarding the location, tipping fees, and regulations of
local landfills is to contact the local solid waste management office.
The hauling costs are a function of the haul distance, capacity of hauling
equipment, loading efficiency, and the material being transported (49:14). The haul
distance can be obtained for each option by determining the exact location of the
landfill. The capacity of the hauling equipment used in the area and the loading
efficiencies can be approximated by contacting some of the local contractors that do
work on the base. The volume and weight of the material being hauled can be
estimated by using the worksheet provided in Appendix A of this report. Appendix
C(A) provides a worksheet to determine the costs of the baseline alternative.
Recyder-Hauler Analysis. In some areas where C&D waste recycling has
become established, the recycler-hauler option may be available. A recycler-hauler
company will collect all C&D wastes from the jobsite, sort out and process the
recyclables and transport them to the appropriate buyers, and transport the remaining
unrecyclable waste to a landfill. Typically, these companies charge a fee for their
service, and they receive all of the revenues from the sale of the recycled product
(35, 29:10). In this case the total cost to the Air Force would be the collection fee
from the recycler-hauler. Appendix C(B) provides a worksheet to determine the costs
of this alternative.
41
TransMrting Waste to Recycler Analysis. This option can be used in areas
where there are C&D recyclers, but no recycler-haulers exist, or when trucks are
already available to the Air Force due to the nature of the construction/demolition
jobs. In some cases, these recycling facilities will accept commingled waste, which
places them with the responsibility for separating the recyclables and disposing of
non-recyclables. In most cases, however, these facilities call for separated wastes. In
the instance where the recvwlin facility accepts the entire wastestream, the only costs
involved are hauling and tipping fees. In the instance where the waste must be pre-
sorted, sorting costs must be considered as well as hauling and tipping fees at both
recycling facilities for recyclables and landfills for non-recyclables. Some of the
material in this case may bring revenue to the generator. In that case, the revenue
must be accounted for as a benefit. Some administrative costs should also be
considered for keeping track of the revenues, as well (29:11, 13:31). Figure 6
graphically depicts various cost and benefits which should be considered, depending
on the local circumstances. A worksheet is provided in Appendix C(C) to calculate
these costs and benefits.
Contract Recyn Analysis. In some cases where local C&D recycling does
not exist, it may be beneficial for the Air Force to contract with a recycling company
to locate near or on the base and recycle the C&D waste generated. This
arrangement may be useful either temporarily for a large demolition/construction
operation or permanently if the amount of C&D waste generated annually at that base
is substantial enough to support such an operation. In either case, the evaluation of
42

yes No
COMM. ft~ Cmew H&*19
%aCRY, a dWpaig ol fbIar. a TIpbg t"nmnqwyd~ DIm t
0-d 1 WVV
haf 'I"I"~~ to
No
ftgure 6. Costs/Benefits when Transporting C&D Waste to Recyders
the costs and benefits will be the same (35). A worksheet is provided in Appendix
C(D) to estimate the costs and benefits of this option.
43

Costs. The costs to the Air Force will essentially be the cost of the
contract. This cost can be estimated by evaluating the potential contractor's cost and
adding an overhead and profit margin. It is assumed that typical overhead and profit
margins (15% and 10%, respectively) used to estimate construction contracts would
be appropriate for this purpose, as well. From the research and discussions with a
C&D waste recycler, the contractor's costs can be divided into the following
categories for estimating purposes: capital costs, operations and maintenance (O&M)
costs, and regulatory costs (35, 8:25-26).
Capital costs are comprised of costs for equipment and facilities. Assuming
the contract will be let for full and open competition, a good estimate of the capital
costs charged to the project would be the amount of depreciation of the equipment and
the required facilities Although there are a number of methods used to calculate
depreciation, the straight line method should be used to estimate a competitive bid,
since this method evenly distributes the cost over the useful life of an asset. When
the straight line method is used, depreciation over a certain time period is calculated
by simply dividing the difference of the historical costs and the salvage values by the
useful life of the capital assets as noted in equation (1) below (1:86-87).
HC" - SV D
UL
where
HC = historical cost ($)
44
SV = salvage value ($)
UL = useful lifetime (years)
D = depreciation ($/year)
To ensure a conservative estimate of the capital costs, the equipment should be
assumed to have a negligible salvage value. Also, from discussions with a C&D
recycler, the equipment used can be assumed to have a useful life of five years (35).
Furthermore, in an evaluation of 20 C&D waste processing facilities, a linear
relationship was found between the daily capacity of the plant and the historical
capital costs (2:58). To simplify the determination of capital costs, the assumptions
were used to determine annual capital costs of a C&D recycling operation as a
function of daily recycling capacity. This relationship is shown graphically in Figure
7.
O&M costs include costs for labor, fuel, utilities, routine maintenance, and
landfill disposal of non-recyclables (35, 7:14). The amount of labor at a C&D
recycling operation has been estimated to be between 4,000 - 5,000 annual tons per
worker (2:58) The typical breakdown of labor specialties for C&D waste recycling
is two thirds of the workforce as semi-skilled laborers, and one-third as heavy
equipment operators. The labor rates for each of these specialties can be obtained
from the local employment office. Fuel, utilities, and routine maintenance has been
estimated for a C&D recycling plant to be $5.00 - $7.00 per daily ton (35).
Regulatory costs include expenditures for required permits as well as the
environmental testing and monitoring called for in the permits. Some typical costs in
45

Annual Capital CasUJtba
$2,8000$2.600
$2,400
$2,200$2.200052,000
$1,300
$1,600
$1.400
$1,200 I Iso 100 150 200 250 300
Plant Capacity (tounsday)
Figure 7. C&D Facility Capital Costs vs Production (2:58)
this category may include engineering designs, test well drilling and groundwater
monitoring, air emissions tests, noise emissions tests, etc. The local EPA office
should be able to provide the list of requirements and costs for this category (35,
6:34).
Benefits. The tangible benefits from this option are the recycled
material gained. These materials can include base course, topsoil, drainage
aggregate, wood mulch, scrap metal, dimensional lumber, and wood chips for fuel
(2:60). Most of these materials have a use either to the Air Force or to businesses or
46

residences in the surrounding community. The amount of benefit realized from this
material will be a function of base location, base construction activity, and the
surrounding community's needs. Therefore, these markets should be looked into to
determine price for these materials in the local area. Estimations of the amount of
material produced should coincide with the estimations of the different C&D wastes
generated.
A Predictive Decision Model
Using the base-specific data from the cost/benefit analyses of the various C&D
waste management options, a model can be developed which provides an indication of
when it becomes economically feasible to recycle C&D waste. In order to provide a
demonstration of this model, a sample base was evaluated. The results from this
evaluation will be discussed by first presenting the data obtained from the sample
base. This will be followed by a sensitivity analysis for each of the input variables
and a selection of the indicator variables. Finally, the generic use of this model at
any base will be discussea.
Sample Base Input Variables. In order to demonstrate the model, site-
specific information was collected from Hill AFB, Utah for 1994. From this data the
input variables, listed in Table 7, were determined. By applying to the flowchart in
Figure 5 the information gathered from Hill AFB regarding the cost and location of
the MSW and C&D landfills, the baseline alternative in this case was determined to
be the disposal of all C&D waste in the local C&D landfill. Also, since reportedly
47
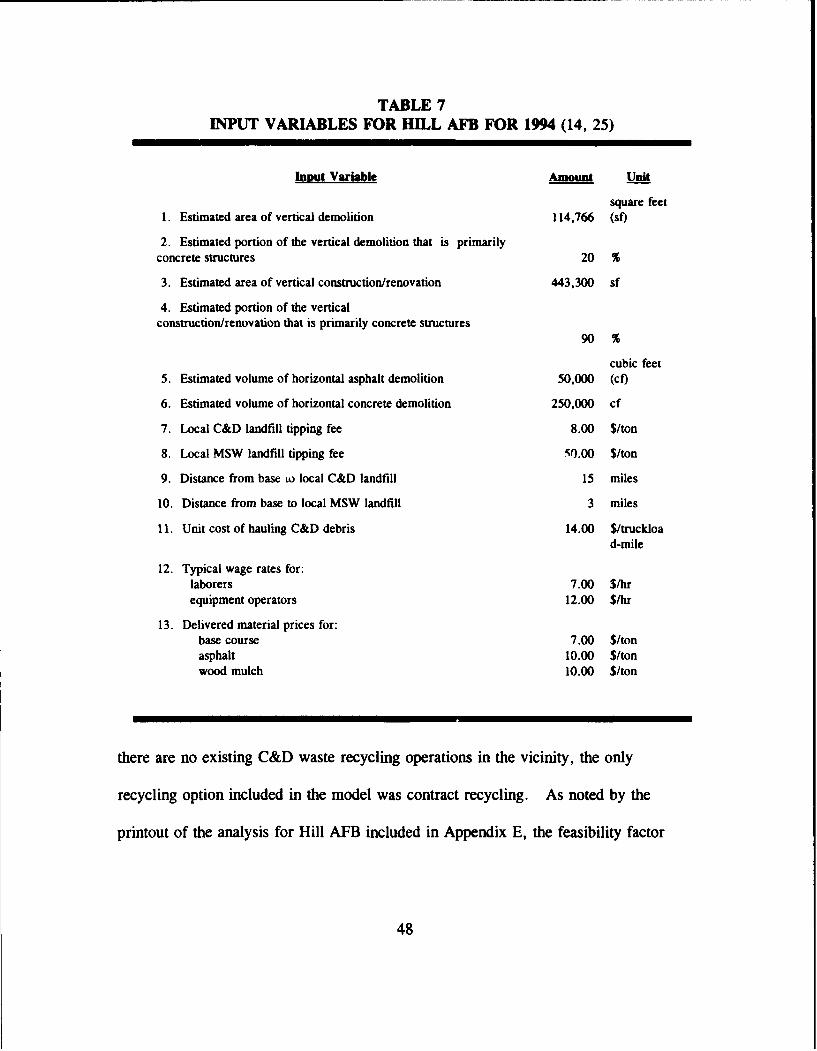
TABLE 7INPUT VARIABLES FOR HILL AFB FOR 1994 (14, 25)
Input Variable Amount Unit
square feet1. Estimated area of vertical demolition 114,766 (sf)
2. Estimated portion of the vertical demolition that is primarilyconcrete structures 20 %
3. Estimated area of vertical construction/renovation 443,300 sf
4. Estimated portion of the verticalconstruction/renovation that is primarily concrete structures
90 %
cubic feet5. Estimated volume of horizontal asphalt demolition 50,000 (cf)
6. Estimated volume of horizontal concrete demolition 250,000 cf
7. Local C&D landfill tipping fee 8.00 S/ton
8. Local MSW landfill tipping fee 50.00 S/ton
9. Distance from base to local C&D landfill 15 miles
10. Distance from base to local MSW landfill 3 miles
11. Unit cost of hauling C&D debris 14.00 $/truckload-mile
12. Typical wage rates for:laborers 7.00 S/hrequipment operators 12.00 S/hr
13. Delivered material prices for:base course 7.00 S/tonasphalt 10.00 S/tonwood mulch 10.00 S/ton
there are no existing C&D waste recycling operations in the vicinity, the only
recycling option included in the model was contract recycling. As noted by the
printout of the analysis for Hill AFB included in Appendix E, the feasibility factor
48

was found to be a negative number, thereby indicating that for the given input
variables, C&D waste recycling is not feasible in 1994.
Sensitivity Analysis of Innt Variables. Once the model was created, further
analysis was conducted to determine the effect independent variance of each input
variables has on the recycling feasibility. By performing sensitivity analyses on each
of the variables, the value of the feasibility factor in relation to variations in each of
the input variables was determined. This analysis was conducted by changing the
value of each variable in the spreadsheet model from -100% to 200% of the given
amount, while holding all other variables constant. This range was chosen to
represent the entire realistically feasible variation of any one variable. These
relationships for the data specific to Hill AFB are aepicted graphically in Appendix F.
As can be observed from the graphs of the 13 input variables, the variance of
only six have any appreciable effect on the economic feasibility of C&D waste
recycling. These six input variables are noted below in order of the magnitude of
effect the variance of each has on recycling feasibility:
1. Distance from the base to the C&D landfill
2. Unit cost of hauling C&D waste
3. C&D landfill tipping fees
4. Distance from the base to the recycling center
5. Market prices of recycled materials
6. Labor wage rates
49
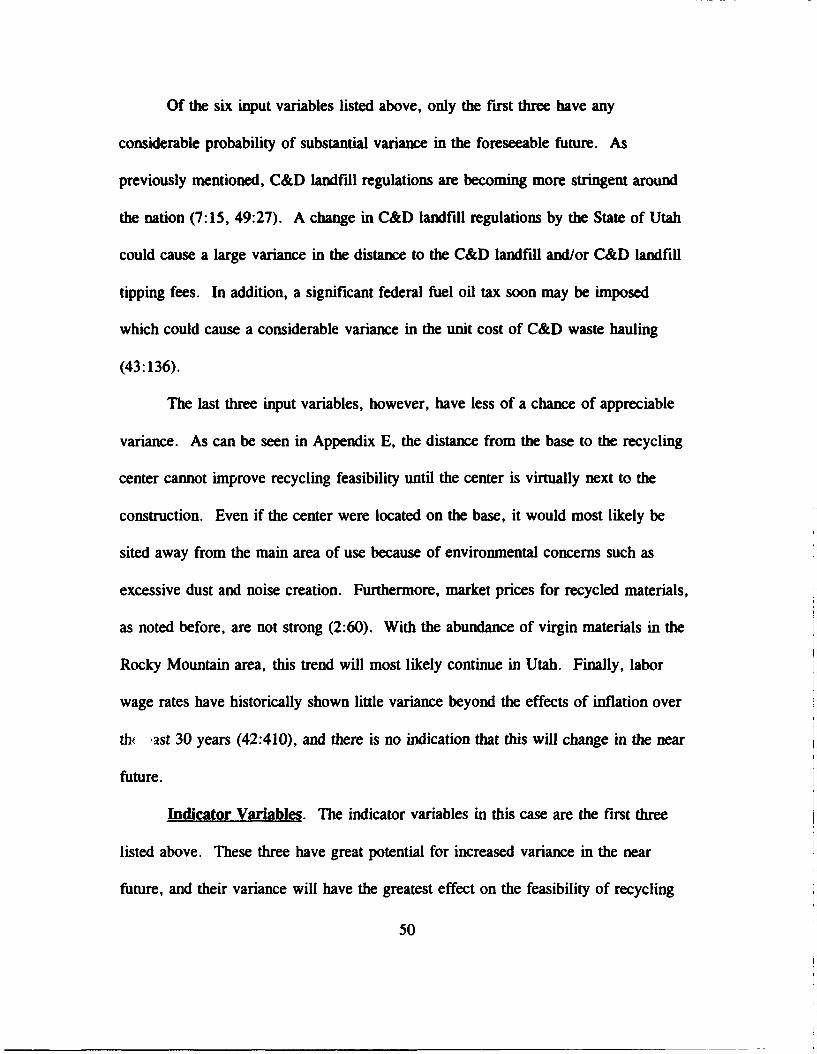
Of the six input variables listed above, only the first three have any
considerable probability of substantial variance in the foreseeable future. As
previously mentioned, C&D landfill regulations are becoming more stringent around
the nation (7:15, 49:27). A change in C&D landfill regulations by the State of Utah
could cause a large variance in the distance to the C&D landfill and/or C&D landfill
tipping fees. In addition, a significant federal fuel oil tax soon may be imposed
which could cause a considerable variance in the unit cost of C&D waste hauling
(43:136).
The last three input variables, however, have less of a chance of appreciable
variance. As can be seen in Appendix E, the distance from the base to the recycling
center cannot improve recycling feasibility until the center is virtually next to the
construction. Even if the center were located on the base, it would most likely be
sited away from the main area of use because of environmental concerns such as
excessive dust and noise creation. Furthermore, market prices for recycled materials,
as noted before, are not strong (2:60). With the abundance of virgin materials in the
Rocky Mountain area, this trend will most likely continue in Utah. Finally, labor
wage rates have historically shown little variance beyond the effects of inflation over
tht 'ast 30 years (42:410), and there is no indication that this will change in the near
future.
Indicator Variables. The indicator variables in this case are the first three
listed above. These three have great potential for increased variance in the near
future, and their variance will have the greatest effect on the feasibility of recycling
50

C&D waste at Hill AFB. By performing manipulations on the spreadsheet shown in
Appendix E, two graphs were developed to show when C&D waste recycling is
economically feasible, based solely on the three indicator variables. To create the
graphs, a hauling factor was first created. The hauling factor is the cost of the haul
to the landfill minus the cost of the haul to the recycling center. Values for the
hauling factor were calculated using different unit hauling costs and distances to the
landfill. The relationships between the hauling factor and these two variables are
shown in Figure 8. The second graph, presented in Figure 9, was created by
soHaullug Factor
45 -Distance to Landfill (miles)
40
35
3,
25
20
10
9 12 1s 1i 21 24 27 30
Unit Haul Cost ($/ton)
Figure 8. The Relationship of Hauling Factor to Distance to Landfill and UnitHauling Cost at Hill AFB, Utah
51
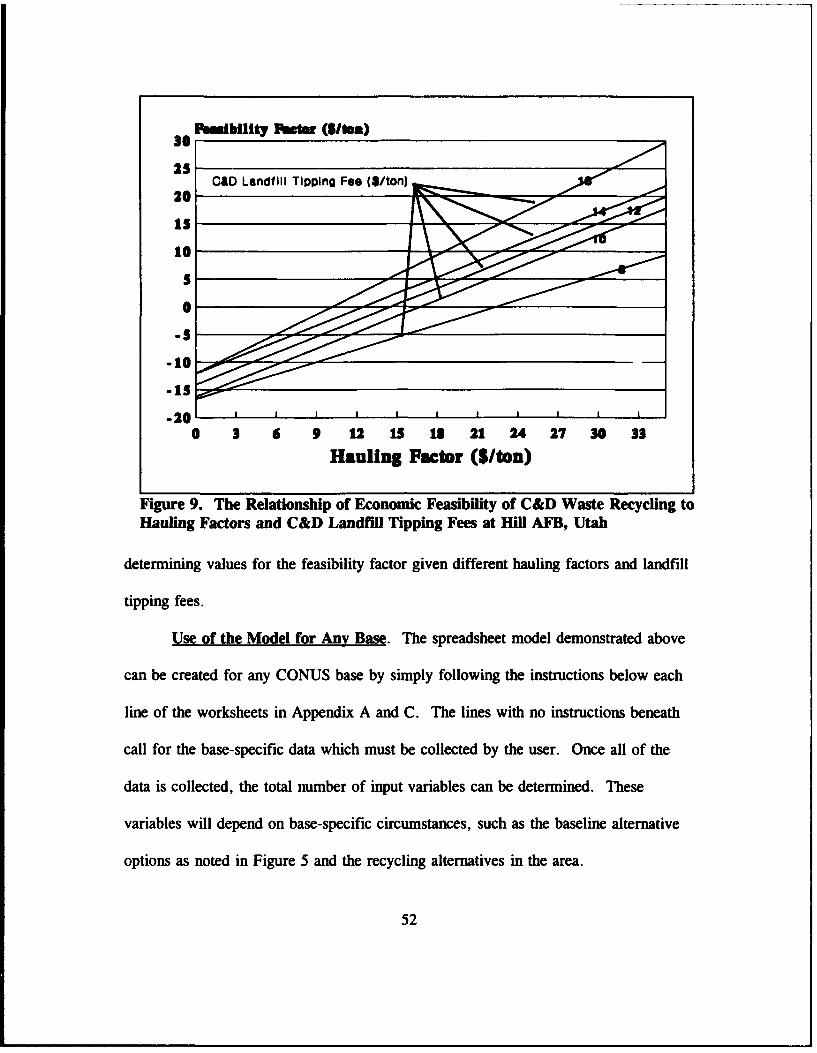
30Pe bility Facs• o (mlena)
25SCAD Landfill Tipping Fee (S/ton)
1510S
10
-10
0 3 6 9 12 13 18 21 4 27 30 33Hauling Factor (S/ton)
Figure 9. The Relationship of Economic Feasibility of C&D Waste Recycling to
Hauling Factors and C&D Landfill Tipping Fees at Hill AFB, Utah
determining values for the feasibility factor given different hauling factors and landfill
tipping fees.
Use of the Model for Any Base. The spreadsheet model demonstrated above
can be created for any CONUS base by simply following the instructions below each
line of the worksheets in Appendix A and C. The lines with no instructions beneath
call for the base-specific data which must be collected by the user. Once all of the
data is collected, the total number of input variables can be determined. These
variables will depend on base-specific circumstances, such as the baseline alternative
options as noted in Figure 5 and the recycling alternatives in the area.
52

The effect of the variance of these variables on recycling feasibility can be
determined by performing manipulations noted in Chapter III on the spreadsheet
model. From this analysis, the indicator variables can be selected from the input
variables. The indicators can then be applied to the spreadsheet model in different
combinations and the results graphed as shown in Figures 8 and 9 to create a
predictive graph which indicates approximately when C&D recycling can become
economically feasible.
A word of caution, however, should be included at this point. Although the
indicator variables may be the single most important variables in the model,
combinations of the other variables may create a synergistic and/or antagonistic effect
on recycling feasibility. For instance, the vo"-me of horizontal concrete demolition
and the recycling materials market are not indicator variables for the sample case
noted. However, if the volume of concrete waste and the price for recycled base
course material drastically increased drastically increased simultaneously, the resulting
synergistic effect of the variance could create a pronounced effect on recycling
feasibility. Therefore, this model should not be used blindly as a cookbook to
determine economic feasibility of C&D recycling. Instead, it should only be used to
indicate when it may be worthwhile to accomplish a detailed feasibility study.
SuryRM
This chapter provided a synopsis of the findings and analyses obtained through
the use of the methodologies presented in Chapter III. First, methods were
53

introduced and a worksheet was provided to help Air Force managers characterize and
estimate the C&D waste generation at a specific base. Next, the markets for C&D
recycled materials was discussed, and a sample of the types of market directories
being produced nationwide was provided. Various options were then presented for
both C&D waste disposal and recycling alternatives. Worksheets were also provided
to calculate the costs and benefits of each applicable option. A predictive model was
then presented by encoding the worksheets into a spreadsheet model, and a sample
base was selected to apply data to the model to illustrate its usefulness. The use of
the model was generalized to any specific base's data, and finally an important
limitation of the model was reviewed.
54

V. Conclusions and Recommendations
Introduction
The purpose of this chapter is threefold. First, this chapter presents a brief
summary of the research conducted to create a predictive model for the determination
of economic feasibility of C&D waste recycling. Secondly, this chapter will address
the practical implicationq nf the development of this model. Finally, this chapter will
point out some recommendations for further research on this subject.
Research Summary
Initiatives have been implemented from the Office of the President down to
Air Force base-level managers to prevent pollution in the U.S. One initiative being
developed at the DoD level is to require C&D waste be recycled when economically
feasible. The problem at hand is the development of a method to determine if and
when it is economically feasible to recycle this waste at a given location.
Since C&D waste recycling is an emerging industry in some areas of the U.S.
today, some limited information on the costs and revenue markets for these operations
are available. Additionally, several studies have been conducted which offer
estimating factors to determine the amount of C&D waste generated in a certain area.
Therefore, the development of a predictive model to determine the feasibility of C&D
waste recycling at a given base was possible.
55

Several steps were taken to develop this model. First, past C&D waste
generation studies were reviewed to find estimating factors for generation of the waste
that were relevant to typical Air Force base operations. Then, literature reviews and
personal interviews were conducted to evaluate the characteristics of the C&D waste
recycling markets. Once this data was gathered, methods to conduct cost/benefit
analyses were developed and provided for the reader in the form of worksheets.
These worksheets also included the required formulas and calculations to create the
model. A sample base was then selected and data specific to its location was loaded
into the worksheets as a demonstration of the model. Finally, a method was
demonstrated to analyze the relationship of the variance of the data to the feasibility
of C&D waste recycling.
Practical Implications of the Model
There are three practical uses of the model developed from this research.
First, this model can be used to help justify C&D waste recycling at a base. This
justification can include an estimate of the cost savings generated by recycling C&D
waste. The justification also addresses the increase in C&D waste recycling which
can help in the attainment of base recycling goals. Conversely, this model can also
be used as support for not recycling where it is not economically feasible. In this
capacity, Air Force commanders can be informed of the additional cost to the base of
implementing an infeasible program. Finally, this model can be used by Air Force
managers to forecast when recycling C&D waste will become cost effective at a base.
56

This would enable a manager to develop a proactive plan and to implement policies
and any required contracts to ensure the creation ,of a successful recycling program.
Recommendations
Several recommendations are offered to encourage C&D waste recycling in the
Air Force and to make the model presented in this report more valid and useful. One
way to encourage C&D waste recycling would be to change Air Force construction
specifications to allow for use of recycled materials on Air Force construction
projects. As a means to this end, research could be conducted which evaluates the
costs and benefits of such an initiative. Additionally, the effects that the use of
recycled products would have on construction quality could be evaluated.
The model presented in this report assumes the validity and reliability of
several estimating factors for C&D waste generation. Research could be conducted to
prove the validity of this model. Finally, the usefulness of the model could be
improved by developing it into a user-friendly software package. This package could
even offer the ability to perform what-if calculations to help the user forecast future
conditions.
57

ADvondix A: C&D Waste Generation Worksheet
The following worksheet is designed to help estimate tha C&D wastegenerated at a particular base for a given year. Please refer to C&DWaste Generation Estimates in Chapter IV of this report for furtherexplanations of the estimating factors used in this worksheet.
STEP ONE: Estimate the Amount of Vertical Ducilition
1. Estimate vertical demo in square feet (sf) ..... 1 sf
2. Estimate percentage of concrete buildings ....... 2 2
3. Estimate percentage of wood buildings ........... 3 3(2 and 3 should equal 100%.)
4. Total concrete vertical demo ................... 4 sf(Multiply box 1 by box 2)
5. Total wood vertical demo ........................ 5 sf(Multiply box 1 by box 3)
STEP TWO: Estimate the Amount of Vertical Construction/Renovation
6. Estimate vertical construction/renovation insquare feet ..................................... 6 sf
7. Estimate percentage of concrete/brickbuildings ....................................... 7 t
8. Estimate percentage of wood buildings ........... 8 8(line 7 and line 8 should sum to 100%.)
9. Total conc vertical construction/renovation .... 9 sf(Multiply line 6 by line 7)
10. Total wood vertical construction/renovation... I0 sf(Multiply line 6 by line 8)
STEP THREE: Calculate the Estimated Volumes of Vertical C&D Wast*
11. Calculate the volume from concrete verticaldemolition .................................... 11 cf(Multiply line 4 by 3.0 cubic feet (cf)/sf)
12. Calculate the volume from wood verticaldemolition ..................................... 12 cf(Multiply line 5 by 4.5 cf/sf)
13. Calculate total demolition volume ............. 13 cf(Add lines 11 and 12)
14. Calculate the volume from concrete verticalconstruction/renovation ....................... 14 cf(Multiply line 9 by .3 cf/sf)
15. Calculate the volume from wood verticalconstruction/renovation ....................... 15 cf(Multiply line 10 by .45 cf/sf)
58

16. Calculate total const/renovation volume ....... 16 cf
(Add lines 14 and 15)
STEP FOUR: Estimate the Volume of Horizontal Demolition
17. Estimate volume of asphalt demolition ......... 17 cf(Multiply volume of asphalt laid by 1.33 toobtain rubble volume.)
18. Estimate volume of concrete demolition ........ 18 cf(Multiply volume of concrete placed by 1.45 toobtain rubble volume.)
19. Calculate total volume of horizontal demo ..... 19 cf
(Add lines 17 and 18)
STEP FIVE: Calculate the Total Volume of C&D Waste Generated
20. Calculate ..astes generated from horizontaldemolition & vertical construction/renovationand demolition ................................ 20 cf(Add lines 13, 16, and 19)
STEP SIX: Estimate Waste Volumes by Material
21. Calculate volume of waste concrete from eachoperation listed below ......................... 21 cf(Add lines 21.a through 21.e)
21.a. wood vertical demolition ............ cf(Multiply line 12 by 5%)
21.b. concrete vertical demolition ........ cf(Multiply line 11 by 65%)
21.c. wood vertical const/renovation ...... cf(Multiply line 15 by 5%)
21.d. conc vertical const/renovation ...... cf(Multiply line 14 by 20%)
21.e. concrete horizontal demolition ...... cf(Same as line 18)
22. Calculate volume of waste bricks from eachoperation listed below ........................ 22 cf(Add lines 22.a through 22.d)
22.a. wood vertical demolition ............ cf(Multiply line 12 by 14%)
22.b. concrete vertical demolition ........ cf(Multiply line 11 by 10%)
22.c. wood vertical const/renovation ...... cf(Multiply line 15 by 1%)
22.d. conc vertical const/renovation ...... cf(Multiply line 14 by 5%)
23. Calculate volume of waste wood from eachoperation listed below ......................... 23 cf(Add lines 23.a through 23.d)
23.a. wood vertical demolition ............ cf
59

(Multiply line 12 by 65%)23.b. concrete vertical demolition ........ cf
(Multiply line 11 by 10%)23.c. wood vertical const/renovation ...... cf
(Multiply line 15 by 43%)23.d. conc vertical const/renovation ...... cf
(Multiply line 14 by 35%)
24. Calculate volume of waste drywall from eachoperation listed below ......................... 24 cf(Add lines 24.a through 24.d)
24.a. wood vertical demolition ............ cf(Multiply line 12 by 12%)
24.b. concrete vertical demolition ........ cf(Multiply line 11 by 10%)
24.c. wood vertical const/renovation ...... cf(Multiply line 15 by 20%)
2z.d. conc vertical const/renovation....... cf(Multiply line 14 by 10%)
25. Calculate volume of waste metal from eachoperation listed below ......................... 25 cf(Add lines 25.a through 25.d)
25.a. wood vertical demolition ............ cf(Multiply line 12 by 2%)
25.b. concrete vertical demolition ........ cf(Multiply line 11 by 3%)
25.c. wood vertical const/renovation ...... cf(Multiply line 15 by 1%)
25.d. conc vertical const/renovation ...... cf(Multiply line 14 by 6%)
26. Calculate volume of waste asphalt ............ 26 cf(Same as line 17)
27. Calculate volume of other wastes .............. 27 cf(Add lines 27.a through 27.d)
27.a. wood vertical demolition ............ cf(Multiply line 12 by 1%)
27.b. concrete vertical demolition ........ cf(Multiply line 11 by 2%)
27.c. wood vertical const/renovation ...... cf(Multiply line 15 by 38%)
27.d. conc vertical const/renovation ...... cf(Multiply line 14 by 24%)
STEP SEVEN: Calculate the Weights of the Waste Materials
28. Calculate the weight of waste concrete ........ 28 ton(Multiply line 21 by .048 tons/cf)
29. Calculate the weight of waste bricks .......... 29 ton(Multiply line 22 by .037 tons/cf)
30. Calculate the weight of waste wood ............ 30 ton
60

(Multiply line 23 by .0062 tons/cf)
31. Calculate the weight of waste drywall ......... 31 _ ton(Multiply line 24 by .028 tons/cf)
32. Calculate the weight of scrap metal ........... 32 ton(Multiply line 25 by .0093 tons/cf)
33. Calculate the weight of waste asphalt ......... 33 ton(Multiply line 26 by .048 tons/cf)
34. Calculate the weight of other misc wastes ..... 34 ton(Multiply line 27 by .012 tons/cf)
35. Calculate the total weight of C&D waste ....... 35 ton(Add lines 28 - 34)
61

Appendix B: Sample Market Survey
The listing of salvage and reuse organizations, waste haulers, transferstations, and construction waste processors is intended to provide arepresentative sample of market directories currently being published inmany areas. The inclusion of any company on this list in no wayrepresents an indorsement by the author of the research or the US AirForce.
Multi-material haulers and processors:Organi••aom that ransport and/or process morm tan one coasUuctioa waste nmaer forrecycling.
Unless otherwise noted, organizations listed provide waste container, and do not accept deliverieu.
1. Haulers, transer stations, and MRF* that accept mixed loads o(constructo Wastes andsort out three or more materials forrecyclingi
CWOVIDr. 1 C-wgi Scape 01W00 6 & cador F~a owl s i~~oni
Materlals Organdatio Name Phone Addhtonel Arsand Address Contac -honsabn Skeved
S• •T 8U~p Cumpw SinS
FW Ný F4 0 Seep W4. 56373 &X~ rps O
P .utidow $M11
6454M 4W lute"81 W915 NAMt St P00' Ku N AmSA 0 POWM Iafts"SpL MMA N 56104 t• ta
icII Ma
II]Good*s Tuids 14M2-M CONNWI~ m
19109N 5631 O Ib donMosl
FW A &WI Wm 5D1 Godn hw n No
IM5 Zu"w LAW - r o o m o
US= =UI~ 'SiE It of dre~orm A
62

Single Mateuial Recyclers: Organizations that transport and/or processprimarily one construction waste material.
Many of the single material recyclers require you to deliver materials to them. AI reserve theright to refuse a load if it does not meet their specifications. Your best bet is to call ahead
materials organization Namne Phone Additional AresI and Address Contact Infiormation 3re
;MW ajooshold appiaence (No TVs) A-PIIA Apiance 560 296-192 W q kMdy af o i
Appliance only ARCA 378-1100 ft"dn WANe WAN* - Mitro Mae2601 94oadlay NE rVa qvlp m ustibe at rWidtWW -
--ooks MN 55413 w".d Orep-ofeb opsd.
AN mnaWo appliances, rkic"n TVs BloomigtonAAkloi Appliance 884-1594 DApl diapl)al No ha~gift ~ Sao' Moo18863 Cedar Ave S we avaftl (hOonMmlon a e aoe~Lakevil MN 5504 bm~eenC101
All majo 4ousehod appliacea. no Dan Barbeau Aplawnc 827.7019 AicepS ropd~a 111111 anTVs. 319 WLakieSt n/a suuf
M hIS MN 55406
All maWo Owlst pods JRs Appliance Diaposal 454-9215- IHaft esvic wakW. Saimla MMtr AimBW Jellerso Trait W Wa 0=90111Irwe Grov Hp IMN 5507
Carpet.A~ Rfntdn iw-barke a8W CARPET, Inc 241-064 Provme W"e Van~r 11I"My Magi Areepa-e~lced,and carpetpad. Must be PO0Box 452 VAI senneCallorqxcl-0 "Idry ElkRrw MN 5538
Ca"pe Carpet Recovery w~ioaban 4414830 Cal to araige dmpdo or Im*ig Meboc Arm3273124th st PONe Hode seenoe.
Carpe and ca"pe pad. No nibber United Rweyling 92.9-7175 Call ID arrangs *adr or haft Melro iasbacked orwaftabackedcarpet. Mist 3119LyrMAVOS Kirn Servic.
bedySL L&uAPat MN 55416 Hanmto
"Clancecrte(ýno ruiw,. wire, mesh, Aaltach Coanstxution Co 222-1994 Tippin foe t ecib No9m Ie for Mw ggAmbrick or asphal). Clean aspialt (no 299 Olmelea St asphalt Calto mane p-af. NoWConcre). SL PaiA MN 55101 conlaierworhainig-m~s
Concrt eand asphal. PeAW and wire kaiton Sand and Gravel 425-4191 14 metr macain Calls MeWAmemfesh okay, bsA extra &ope. Keep 10633 -USMAv N ria Arting dropAl No haftg or=acrt and esphiSeparate IOClew MN 5536 contairler"Aerva -
63

materials Organization Marne Phone Additional Areaand Addirss Contact Inlonnation Served
Maw~rva 14mm",LU& 437-8618 M~ebral mwvy Maoo13135 Do*imPah cr~ieq GoIOY W40ID 4Pluosgrn MN 5506 wws wood wad
from owsbuchon was* We& No hazanAw wulmbs.m -Wmbw, missiew. at tresowt bift awsple N t tod a~ MessUCas ior mod oi ft NKMaji bWm here)
Nout Noup Rwcycing & 425-2MO Trumbar n MoocTrw~wl Tim MOMa Ampf OW-pokh Ama
MM5 Zhariy Law Aboa cpS od
Poor Ructads Icc. 77M2323 Tw4lr mNow MaltI ~I ~ e~ L ~ K U 400 Wh~ll %PO Box172 I KuVyCrwi Aboa~ kernA
SL Pma MN 55117 es OWd
2. Haulers, transfer stations, MRWs, and landfills that recycle onq or two types of constructionmaterials from mixed loads or transport to recyclers one or more materials that have beensorted on site.
10a Sew"ce 894-7470 Smel lmatng MODc'1460 Waoo*W Rd Wkijdvss canyuro puk AmeSumw** MN 55337 ~ sc0
wood iwumes
r-iso 0~ Ae OsmSons 451-1 145 TnaInerswoan Wulh-[~ [~ [ ~Daugft 10619 C*uttios m a V. w uih w" Ilr. V8Wd. kww &avwe Nhi~1 Vwueb Recyda -waw*ts mi.eyMN 55077 hum nued lowes AnftS
- - acepDoha
Boudrea RcAoHIcc ft 867-1321 ItW eje ydel MINDPO eoz 185 Derwu aoajwepwabd Ame
11dodMN 55373 Boujeau ecqmoWuWd
Copper's Hauqn 824-25 Srnd =watncin ft~h1*I A~m Cooper -as heler Puk 000n
Mer Some
64

ADoendix C: Cost/Benefit Analyses Workshoets
These worksheets should be used to evaluate the costs and benefitsof the various alternatives to landfill disposal of C&D waste. Pleaserefer to Cost/Benefit Analysis in Chapter IV for further explanations ofthe estimating factors presented in this worksheet.
A. Baseline Analysis
Refer to Figure 5 of this report to determine which costs apply tothe local circumstances.
STEP ONE: Determine Tipping Cost
1. Local C&D landfill tipping fee ................ 1 /ton
2. Local MSW landfill tipping fee ................ 2 /ton
3. Nearest legal C&D landfill tipping fee ........ 3 /ton
4. Total weight of C&D waste ...................... 4 ton(Refer to line 35 of Appendix A.)
5. Local C&D landfill tipping cost ............... 5 $(Multiply line 1 by line 4.)
6. Local MSW landfill tipping cost ............... 6 $(Multiply line 2 by line 4.)
7. Nearest legal C&D landfill tipping cost ....... 7 $(Multiply line 3 by line 4.)
STEP TWO: Determine Hauling Costs
8. Distance to local C&D landfill ................ 8 mi
9. Distance to local MSW landfill ................ 9 mi
10. Distance to nearest legal C&D landfill ........ 10 mi
11. Capacity of hauling equipment ................. 11 cy(Estimate by contacting local contractors.)
12. Estimated loading efficiencies ................ 12 %(Estimate by contacting local contractors.)
13. Estimated haul per truckload .................. 13 cy(Multiply line 11 by line 12.)
14. Total volume of C&D waste ..................... 14 cy(Divide line 20 of Appendix A by 27 cf/cy.)
15. Number of truckloads of waste ................. 15(Divide line 14 by line 13.)
16. Cost of hauling per truckload-mile ............ 16 $(Estimate by contacting local contractors.)
17. Cost of hauling to local C&D landfill ......... 17 $
65

(Multiply lines 8, 15, and 16.)
18. Cost of hauling to local MSW landfill ......... 18 $(Multiply lines 9, 15, and 16.)
19. Cost of hauling to nearest legal C&D landfill. 19 $(Multiply lines 10, 15, and 16.)
STEP THREE: Determine Total Cost of Do-Nothing Options
20. Total cost of disposing of C&D waste inlocal C&D landfill ............................. 20 $(Add lines 5 and 17.)
21. Total cost of disposing of C&D waste inlocal MSW landfill ............................. 21 $(Add lines 6 and 18.)
22. Total cost of disposing of C&D waste innearest legal C&D landfill .................... 22 $(Add lines 7 and 19.)
23. Total cost of most economical option .......... 23 $(Chose lessor of lines 20 - 22.)
B. Racycler-Haular Analysis
STEP ONE: Determine Recycler-Hauler Cost
1. Recycler-Hauler fee per ton of waste .......... 1 $(Contact nearest recycler-hauler for fee.)
2. Amount of waste generated ..................... 2 ton
3. Cost of recycling C&D waste throughuse of the recycler-hauler option ............. 3 $
C. Transporting Waste to Reevoler Analysis
Refer to Figure 6 of this report to determine which costs
apply to the local situation.
STEP ONE: Determine Tipping Costs
1. Recycler(s)'s tipping fee(s) per ton ........... 1 $
2. Landfill tipping fees per ton for disposalof nonrecyclables ................................ 2 $(Refer to Appendix C (A).)
3. Amount of material hauled to recycler .......... 3 ton(Refer to STEP SEVEN, Appendix A)
4. Amount of material hauled to landfili .......... 4 ton(Subtract line 3 from Appendix A, line 35.)
5. Recycler tipping costs .......................... 5 $
66

(Multiply line 1 by line 3.)
6. Landfill tipping costs .......................... 6 $(Multiply line 2 by line 4.)
7. Total tipping costs .............................. 7 $(Add lines 5 and 6.)
STEP TWO: Determine Hauling Costs
8. Distance to recycling center(s) ................... mi
9. Distance to landfill ............................. 9 mi
10. Estimated haul per truckload .................... 10 ......ton(Same as Appendix C (A), line 13.)
11. Volume of recyclable waste ..................... 11 ....... cy(Dividn "" - volumes of appropriate materialfrom STEP SIX, Appendix A by 27 cy/cf.)
12. Volume of nonrecyclable waste .................. 12 ...... cy(Subtract line 11 from line 14, Appendix C (A).)
13. Number of truckloads of recyclables ............ 13(Divide line 11 by line 10.)
14. Number of truckloads of nonrecyclables ......... 14(Divide line 12 by line 10.)
15. Cost of hauling per truckload-mile ............ 15 $(Same as line 16, Appendix C (A).)
16. Cost of hauling to recyclers .................. 16 $(Multiply lines 8, 13, and 15.)
17. Cost of hauling to landfill ................... 17 $(Multiply lines 9, 14, and 15.)
18. Total hauling cost ............................. 18 $(Add lines 16 and 17.)
STEP THREE: Determine Sorting/Separation Costs
19. Time needed to sort 1 cy of C&D waste ......... 19 ------- hr(Contact local contractors for estimate.)
20. Cost of labor per hour ........................ 20 $
21. Total volume of waste generated ............... 21 ...... cy(Same as line 14, Appendix C (A).)
22. Total sorting/separating costs ................ 22 $(Multiply lines 19, 20, and 21.)
STEP FOUR: Determine Benefits from Scrap Revenues
23. Amount of each recyclable material deliveredto market:(Refer to STEP SEVEN, Appendix A.)
67

a ..... tonb..... tonc . .... tond. ..... tone . .... ton
24. Market value for each of the recyclable materials:
a. .... $ /tonb. .... $ /tonC..... $ /tond. .... $ /tone. .... $ /ton
25. Revenues from each recyclable material:(Multiply 23 a-e by 24 a-e, respectively.)
a. ...... $ -b. .... $C. .... $,d. .... $_e. .... $,
26. Total Revenue Generated ....................... 26 $(Add lines 25 a-e.)
STEP FIVE: Determine Total Costs for Transporting Waste to RecyclerOption.
27. Cost of recycling C&D waste by hauling toa recycler ..................................... 27 $(Subtract line 26 from the sum of lines 7, 18,
and 22.)
D. Contract Recvclina Analysis
STEP ONE: Estimate the Capital Costs of a C&D Recycling Operation
1. Estimated C&D waste generation ................ 1 ton(Same as line 35, Appendix A.)
2. Estimated C&D waste generation per day ........ 2 ton(Divide line 1 by 272 working days/year.)
3. Estimated annual capital costs per ton ........ 3 $(See Figure 7 of this report.)
4. Total annual capital costs ..................... 4 $
(Multiply line 1 by line 3.)
STEP TWO: Estimate the OAK Costs of a C&D Recycling Operation
5. Number of workers needed for operation ........ 5(Divide line I by 4000 tons/worker.)
6. Number of semiskilled laborers ................ 6(Multiply line 5 by .667, round to nexthighest whole number.)
68

7. Number of heavy equipment operators ........... 7(Multiply line 5 by .333, round to nexthighest whole number.)
8. Wage rates for:a. Semiskilled laborer ................ $ /hrb. Heavy equipment operator ........... $ /hr
(Conta't local employment office for wage info.)
9. Hourly labor cost for semiskilled laborers ..... 9 $(Multiply line 9 by line 8a.)
10. Hourly labor cost for heavy eqpt operators ..... 10 $(Multiply line 7 by line 8b.)
11. Total hourly cost of operations ................ 11 $(Add lines 9 and 10.)
12. Total labor cost ................................ 12 $(Multiply line 11 by 2240 hrs/yr.)
13. Hauling distance to recycler ................... 13 mi(Assume a certain distance.)
14. Hauling cost/truckload mile .................... 14 $(Same as Appendix C (a), line 16.)
15. Total volume of C&D waste ...................... 15 cy(Same -- Appendix C (a), line 14.)
16. Estimated haul per truckload ................... 16 cy(Same as Appendix C (a), line 13.)
17. Number of truckloads of waste .................. 17(Same as Appendix C (a), line 15.)
18. Cost of hauling to contract recycler ........... 18 $(Multiply lines 13, 14, & 17.)
19. Other O&M costs ................................. 19 $(Multiply line 1 by $7.00/ton.)
20. Total O&M costs ................................. 20 $(Add lines 12, 18, & 19.)
STEP THREE: Estimate Regulatory CostsContact local EPA and solid waste management agency for
information on specific requirements.
21. Permit Costs .................................... 21 $
22. Number of monitoring wells required ............ 22
23. Cost per monitoring well installation .......... 23 $
24. Cost for monitoring wells ...................... 24 $(Multiply line 21 by line 22.)
25. Number of samples required ..................... 25
69

26. Cost of analysis per sample .................... 26 $
27. Cost of sampling ................................ 27 $(Multiply line 25 by line 26.)
28. Cost of other requirements ..................... 28 $
29. Total regulatory costs ......................... 29 $(Add lines 21, 24, 27, and 28.)
STEP FOUR: Determine Eatimated Contract Cost
30. Estimated direct contract costs ................ 30 $(Add lines 4, 20, and 28.)
31. Contractor's estimated overhead ................ 31 $(Multiply line 30 by 15%.)
32. Contractor's estimated profit .................. 32 $(Multiply the sum of lines 30 and 31 by 10%.)
33. Total estimated contract cost .................. 33 $
(Add lines 30-32.)
STEP FIVE: Determine Zatimated Benefits
34. Types, quantities, and prices of recycled materialsproduced:(If the recycled material i- to be stockpiledand used on the base, the material prices shouldreflect the savings in hauling costs.)
a. base course... ton @ $ /ton = $b. asphalt ....... ton @ $ /ton = $c. topsoil ....... ton a $ /ton = $d. wood mulch .... ton a $ /ton = $e. wood chips .... ton a $ /ton = $f. dimensional board- board-
lumber ........ ft a $ /ft . $g. scrap metal ... ton @ $ /ton = $h. other ........ a $ / = $
35. Total estimated benefits ....................... 35 $(Add lines 34 a-h.)
STEP SIX: Determine Total Cost of Contract Recycler Option
36. Total cost of contract recycler option ......... 36 $(Subtract line 35 from line 33.)
70

ADoendix D: Data Gathored from Hill AIB, Utah
A. Guestions and Responsos from B=NCO anterorises
1. Q: Are there any public or private landfills in the local vicinitywhich accept construction debris, but not municipal garbage?
A: Yes.
2. Q: If the answer is yes to #1, what is the fee charged for dumpingat these landfills?
A: $5.00 - $8.00 per ton.
3. Q: If the answer is yes to #1, how far away from the base is theclosest of these landfills?
A: Approximately 15 miles
4. Q: What does the local MSW landfill charge per ton to dump?
A: $50.00 per ton.
5. Q: How far from the base is the local MSW landfill?
A: 3 miles.
6. Q: Is it legal to haul debris to some other county to dump it?
A: No, but there are some exceptions, like hauling clean fill andsalvageable materials.
7. Q: If the answer to question #6 is yes, how far from the base isthe nearest place other out of the county you can takeconstruction debris for dumping?
A: N/A
8. Q: What is the cost of hauling debris per truckload-mile?
A: $10.00 - $1E.00 per truckload-mile.
9. Q: What is the typical capacity of trucks used to haulconstruction debris?
A: Capacity would be 20 to 40 cubic yards, but the realisticloading would be 12 to 14 cubic yards.
10. Q: What are the typical wage rates for laborers and heavy
equipment operators?
A: Laborer: $6.00 - $8.00, Equipment Operator: $10.00 - $12.00
11. Q: Are there any types of recycling operations for constructionand demolition debris in the area (concrete, asphalt, wood,cardboard, etc.)?
A: No, but there are some contractors who reuse their ownmaterial.
71
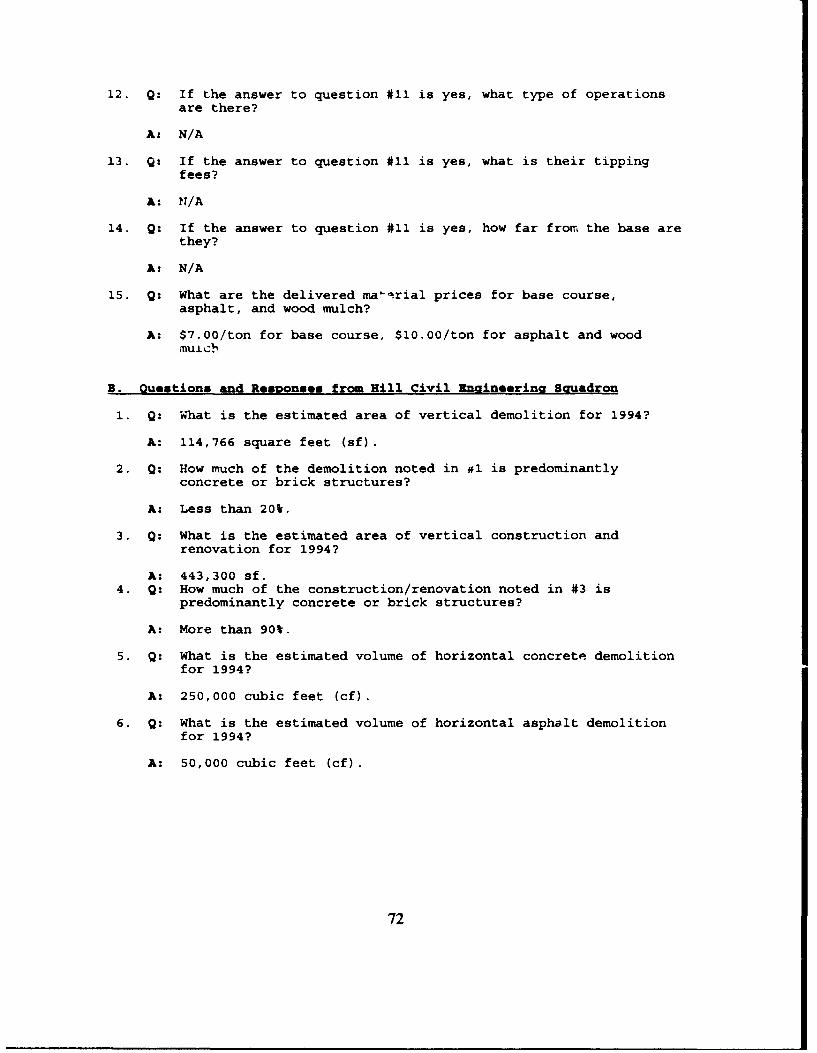
12. Q: If the answer to question #11 is yes, what type of operations
are there?
A: N/A
13. Q: If the answer to question #11 is yes, what is their tippingfees?
A: N/A
14. Q: If the answer to question #11 is yes, how far from the base arethey?
A: N/A
15. Q: What are the delivered ma-rial prices for base course,asphalt, and wood mulch?
A: $7.00/ton for base course, $10.00/ton for asphalt and woodmulch
B. Questions and Responses from Hill Civil Enaineering Sauadron
1. Q: What is the estimated area of vertical demolition for 1994?
A: 114,766 square feet (sf).
2. Q: How much of the demolition noted in *1 is predominantlyconcrete or brick structures?
A: Less than 20%.
3. Q: What is the estimated area of vertical construction andrenovation for 1994?
A: 443,300 sf.4. Q: How much of the construction/renovation noted in #3 is
predominantly concrete or brick structures?
A: More than 90%.
5. Q: What is the estimated volume of horizontal concrete demolitionfor 1994?
A: 250,000 cubic feet (cf).
6. Q: What is the estimated volume of horizontal asphalt demolitionfor 1994?
A: 50,000 cubic feet (cf).
72
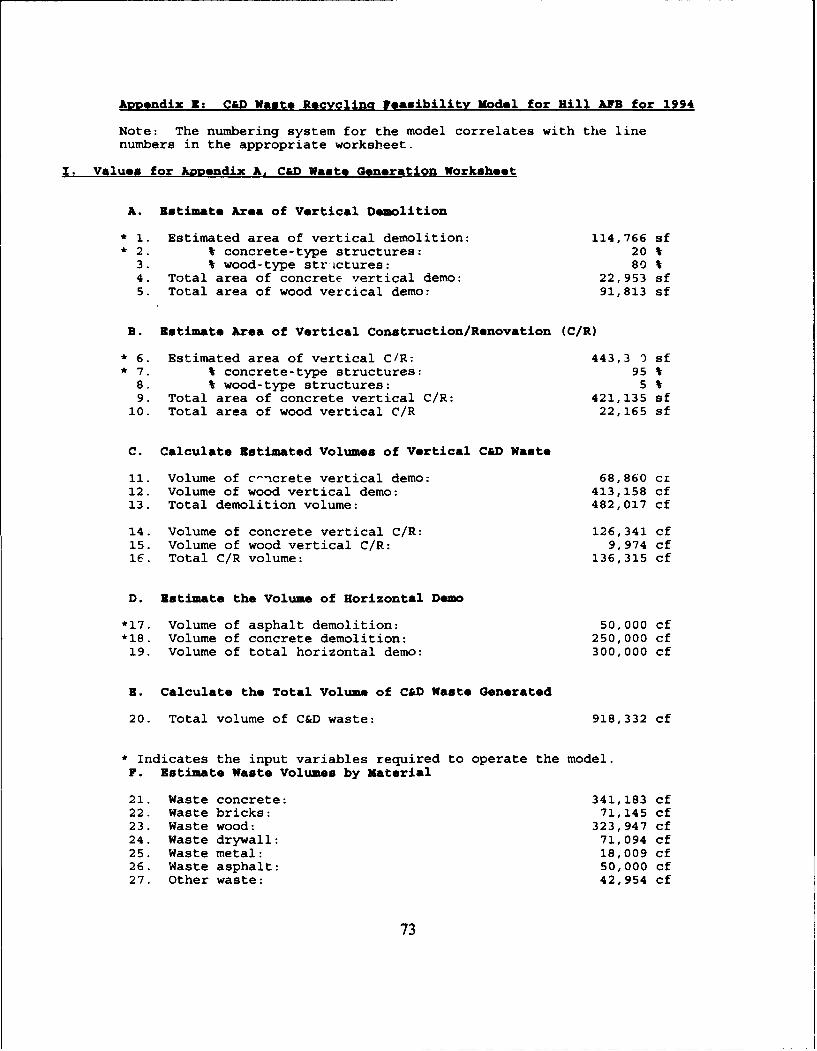
Appendix Z: C&D Waste Recycling Feasibility Model for Hill AFB for 1994
Note: The numbering system for the model correlates with the linenumbers in the appropriate worksbeet.
I. Values for kApendix A. C&D Waste Generation Worksheet
A. Estimate Area of Vertical Demolition
* 1. Estimated area of vertical demolition: 114,766 sf* 2. V concrete-type structures: 20 %
3. % wood-type strictures: 80 t4. Total area of concrete vertical demo: 22,953 sf5. Total area of wood vercical demo: 91,813 sf
B. Estimate Area of Vertical Construction/Renovation (C/R)
* 6. Estimated area of vertical C/R: 443,3 1 sf*7. % concrete-type structures: 95 %8. t wood-type structures: 5 %9. Total area of concrete vertical C/R: 421,135 sf
10. Total area of wood vertical C/R 22,165 sf
C. Calculate Estimated Volumes of Vertical C&D Waste
11. Volume of c-ncrete vertical demo: 68,860 cz12. Volume of wood vertical demo: 413,158 cf13. Total demolition volume: 482,017 cf
14. Volume of concrete vertical C/R: 126,341 cf15. Volume of wood vertical C/R: 9,974 cf16. Total C/R volume: 136,315 cf
D. Estimate the Volume of Horizontal Demo
*17. Volume of asphalt demolition: 50,000 cf*18. Volume of concrete demolition: 250,000 cf
19. Volume of total horizontal demo: 300,000 cf
R. Calculate the Total Volume of C&D Waste Generated
20. Total volume of C&D waste: 918,332 cf
* Indicates the input variables required to operate the model.F. Estimate Waste Volumes by Material
21. Waste concrete: 341,183 cf22. Waste bricks: 71,145 cf23. Waste wood: 323,947 cf24. Waste drywall: 71,094 cf25. Waste metal: 18,009 cf26. Waste asphalt: 50,000 cf27. Other waste: 42,954 cf
73

G. Calculate Weights of Waste Materials
28. Waste concrete: 16,377 ton29. Waste bricks: 2,632 ton30. Waste wood: 2,008 ton31. Waste drywall: 1,991 ton32. Waste metal: 167 ton33. Waste asphalt: 2,400 ton34. Other waste: 515 ton35. Total weight of C&D materials: 25,576 ton
II. Values for Appendix C (A). Baseline Analysis
A. Determine Tipping Cost
* 1. Local C&D landfill tipping fee: $8.00 /ton* 2. Local MSW tipping fee: $50.00 /ton3. Nearest legal C&D landfill tipping fee: N/A4. Total weight of C&D waste: 25,576 ton5. Local C&D landfill tipping cost: $204,6066. Local MSW landfill tipping cost: $1,278,7877. Nearest legal C&D landfill tipping cost: N/A
B. Determine Hauling Cost
* 8. Distance to local C&D landfill: 15 miles* 9. Distance to local MSW landfill: 3 miles10. Distance to nearest legal C&D landfill: N/A11. Capacity of hauling equipment: 30 cy12. Estimated loading efficiency: 50 %
*13. Estimated haul per truckload: 15 cy14. Total volume of C&D waste: 34,012 cy15. Number of truckloads of waste: 2,267
* Indicates the input variables required to operate the model."*16. Cost of hauling per truckload mile (T): $14.00 /T
17. Cost of hauling to local C&D landfill: $476,17218. Cost of hauling to local MSW landfill: $95,23419. Cost of hauling to nearest legal C&D landfill: N/A
C. Determine Costs of Do-Nothing Options
20. Total cost using local C&D landfill: $680,77821. Total cost using local MSW landfill: $1,374,02122. Total cost using nearest legal C&D landfill: N/A23. Cost of most economical option: $680,778
III. Values for Appendix C (D) Analysis of Contractor Recvclina option
A. Estimate the Annual Capital Costs
1. Estimated C&D waste generation: 25,576 ton2. Estimated C&D waste generation per day: 96ntn/dy3. Estimated Capital costs per ton: $14,000.00 /ton
74
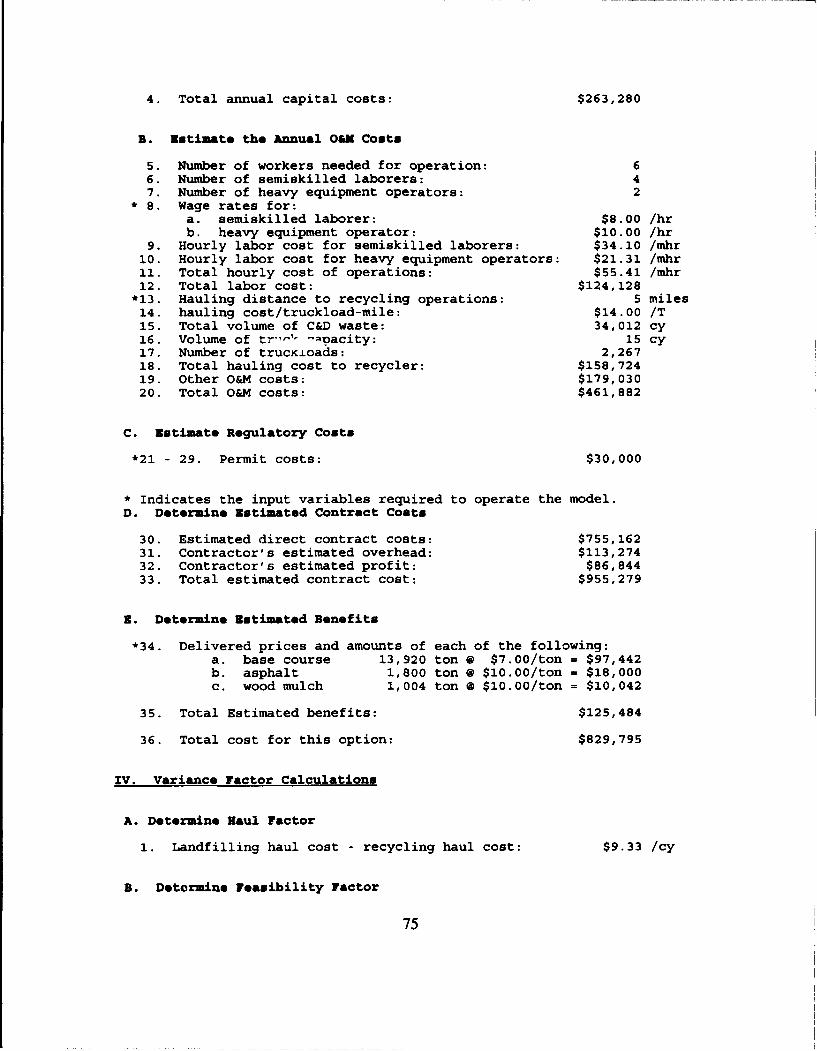
4. Total annual capital costs: $263,280
B. Estimate the Annual O&M Costs
5. Number of workers needed for operation: 66. Number of semiskilled laborers: 47. Number of heavy equipment operators: 2
* 8. Wage rates for:a. semiskilled laborer: $8.00 /hrb. heavy equipment operator: $10.00 /hr
9. Hourly labor cost for semiskilled laborers: $34.10 /mhr10. Hourly labor cost for heavy equipment operators: $21.31 /mhr11. Total hourly cost of operations: $55.41 /mhr12. Total labor cost: $124,128
"*13. Hauling distance to recycling operations: 5 miles14. hauling cost/truckload-mile: $14.00 /T15. Total volume of C&D waste: 34,012 cy16. Volume of tr"-'- -•pacity: 15 cy17. Number of trucxioads: 2,26718. Total hauling cost to recycler: $158,72419. Other O&M costs: $179,03020. Total O&M costs: $461,882
C. Estimate Regulatory Costs
"*21 - 29. Permit costs: $30,000
* Indicates the input variables required to operate the model.D. Determine Estimated Contract Costs
30. Estimated direct contract costs: $755,16231. Contractor's estimated overhead: $113,27432. Contractor's estimated profit: $86,84433. Total estimated contract cost: $955,279
Z. Determine Estimated Benefits
*34. Delivered prices and amounts of each of the following:a. base course 13,920 ton @ $7.00/ton = $97,442b. asphalt 1,800 ton @ $10.00/ton = $18,000c. wood mulch 1,004 ton @ $10.00/ton = $10,042
35. Total Estimated benefits: $125,484
36. Total cost for this option: $829,795
IV. Variance Factor Calculations
A. Determine Haul Factor
1. Landfilling haul cost - recycling haul cost: $9.33 /cy
B. Determine Feasibility Factor
75

2. Most economical landfill option cost -Most economical recycling option cost: ($5.83)/ton
* Indicates the input variables required to operate the model.
76

Apiaondix 1: Sensitivity Analyaes of Zuout Variablos; for Bill 5
Distance to C&D Landfill
$5Landrilumn - Recycli. Cost a wih S$25il ipsa &
$0
-$25100.. . ...
-100 -80 -60 -40 -20 0 20 40 60 80 100 120 140 160 180 200
% Change
0% Change =15 miles
77
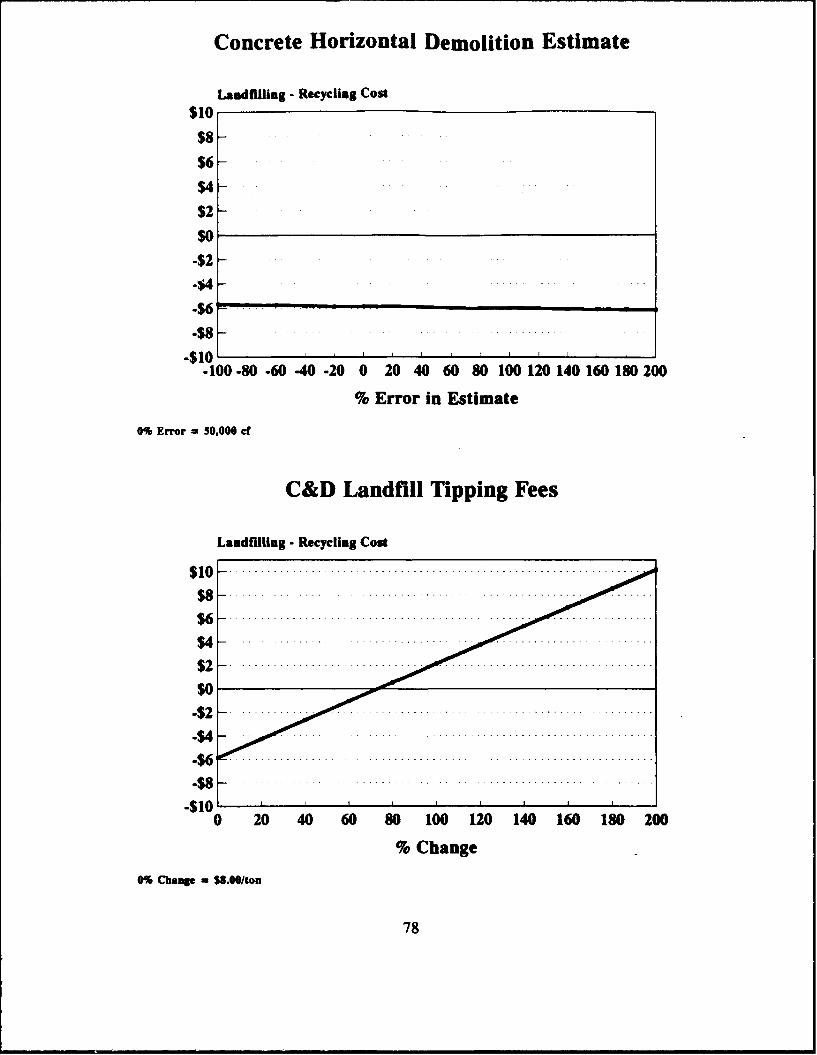
Concrete Horizontal Demolition Estimate
Laadfilling - Recycling Cost$10
$8-
$6-$4-
$2-
$0-$2-
44-
-$6-
-$8-.$10 I
.100.80 .60 -40 -20 0 20 40 60 80 100120140160180200
% Error in Estimate
0% Error = 50,000 ct
C&D Landfill Tipping Fees
Landfilliag - Recycling Cost
-$8
0 20 40 60 80 100 120 140 160 180 200
% Change
0% Cbanp M $8.00/ton
78

Estimated Regulatory Costs
$10 Landfilling. Re•,cling Cost
S6 i
$41
$2-
.s4
-$10' 1 1 I I I I I I I
-100-80 .60 .40 .20 0 20 40 60 80 100 120 140 160 180 200
% Change0%- 30,000
Portion of Concrete Vertical Demolition
Landfilling - Recycling Cost$10 r--slý$60
$41$2iSol
.S21
-$I[
.$101
.100 -0 -60 -40 -20 0 20 40 60 0o 100% Error In Estimate
0% Error - 29% Concrete Demolition
79

Portion of Concrete Vertical Const/Renov
Landfilling - Recycling Cost
$6 -$41'
50$2 .soi
-$4 H---
.S6r
•100 -o0 .60 .40 .20 0 20% Error in Estimate
0% BrSr - 90S
Asphalt Horizontal Demolition Estimate
Landfilling - Recycling Cost$101
56 -
$4
$2k--
so i
421.$41
-$6 F--..
.- 8.$10' I I I I I I I I I I
-100 .80 -60 -40 -20 0 20 40 60 80 100 120 140 160 10S20I
% Error in Estimate0%1 Drier - 56,000 ef
80

Labor Wage Rates
Landfillieg. Recycling Cost
$8-
$4-
$0
-$12
-$16-
-20 0 20 40 60 80 100 120 140 160 180 200
% Change
0% - $8&br (laborer) & $10/hr (operator)
Distance to Recycling Center
Landfiling.- Recycling Cost$25
$20
-100.80 -60 40-.20 0 20 40 60 80 100 120 140 160 180 200
% Change
0% Change - miles
81
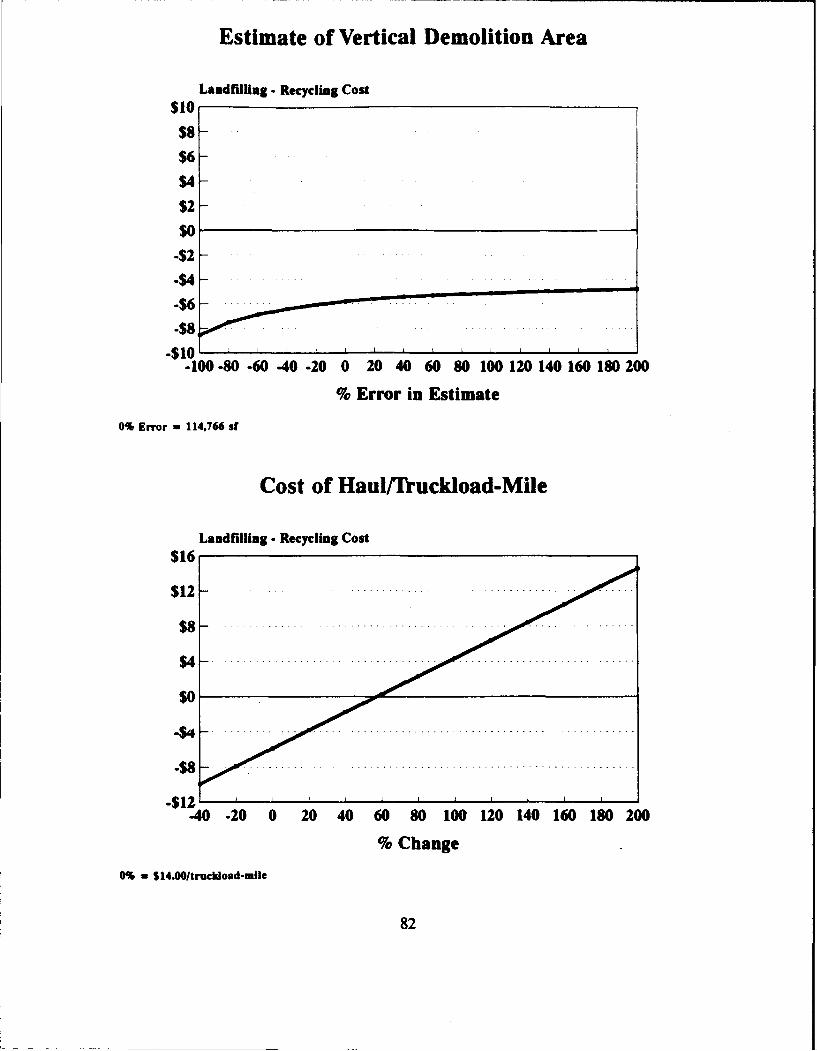
Estimate of Vertical Demolition Area
Landfllliug - Recycling Cost$10
$8-
$6-
$4-$2-
$0-$2
.$10
-100-80 -60 -40 .20 0 20 40 60 80 100120140160180200
% Error in Estimate
0% Error = 114,766 sf
Cost of Haul/Truckload-Mile
Landfilling - Recycling Cost$16
$ 1 2 . . ... .. ... .. ... .. ..
$0
-40 -20 0 20 40 60 80 100 120 140 160 180 200
% Change
0% - $14.00/truckload-mile
82

ReNCcycled Materials Market Prices
Landflhling - Recycling Cost$10
$8-
$6-
$4-
$2-
$0
-$2-4-$
4-$
4-$
-$10 I
-60 -40 -20 0 20 40 60 80 100 120 140 160 180 200
% Change
0% -57/ton base courst, 510/ton asphalt , 810/ton wood mulch
Est of Vertical Colist/Renovation Area
Landfilling - Recycling Cost$10
$ 8 -. . . .. .. .
$ 6 -. . .. .. .. . - --
$ 4 -. .. .. . ..
$ 2 -. . . .. .. ..
$0-$ 2 -. .... .... .
-$4 -. .. . . ..
-$6 .......
-$8 -. .. .. .. . .
-$10 . . . . . . . I
-1080-6-4-2 0 20 40 60 80100120140 160 180200o% Error in Estimate
0% Error =225,00 sf Const/Renovatlon
83

Bibliography
1. Aldrich, James R. Class handout, ENVR 550, Pollution Prevention Economics.School of Engineering, Air Force Institute of Technology, Wright-Patterson AFBOH, February 1993.
2. Apotheker, Steve. "Managing Construction and Demolition Materials," ResourceRecycling, 10: 50-61 (August 1992).
3. Barnes-Driscoll, Erin. Demolition Debris Disposal in the Twin CitiesMetropolitan Area. Metropolitan Council of the Twin Cities Area PublicationNo. 520-90-153, July 1990.
4. Brabec, George W. "Commercial Recycling Recommendations," Proceedings ofthe 23rd Annual Biocycle Conference. 13-21. Minneapolis, MN 11-13 May,1993.
5. Brickner, Robert and Eileen Glass, "Shedding Light on C&D Issues," RecyclingToday, 30: 72-78 (June 15, 1992).
6. Brickner, Robert H. "Construction Waste and Demolition Debris... Problem orOpportunity? Part II Getting Started," Demolition Age, 12:14-15 (November 1992).
7. Brickner, Robert H. "Construction Waste and Demolition Debris.. .Problem orOpportunity? Part III C&D Recycling Alternatives," Demolition Age, 12: 25-26(December 1992).
8. Brickner, Robert H. "Construction Waste and Demolition Debris.. Problem orOpportunity?" Demolition Age, 12: 32-35 (October 1992).
9. Chaterjee, Samar. Predictive Criteria for Construction/Demolition Solid WasteManagement. Construction Engineering Research Laboratory Report No. N-14.Department of the Army, Battelle Columbus Laboratories, Columbus OH,December 1976.
10. Chaterjee, Samar, and Murphy, K.S. Development of Predictive Criteria forDemolition and Construction. Construction Engineering Research LaboratoryReport N-15, Department of the Army, Battelle Columbus Laboratories, October1976.
84

11. 102nd Congress - First Session 1991. United States Code Congressional andAdministrative News. St. Paul, Minnesota: West Publishing Company, 1991.
12. Congressional Research Service, Environment and Natural Resources Division.Summaries of Environmental Laws Administered by the Environmental ProtectionAgency. Report Series No. 91-251 ENR. Washington: Government PrintingOffice, March 14, 1991.
13. Curro, Joseph P. "An Inside View of C&D Recycling," Biocycle, 32:31 (March1991).
14. Daniels, Ron. Programmer, 2849 Air Base Wing/Civil Engineering, Hill AirForce Base, UT. Telephone interview. 21 July 1993.
15. Department of the Air Force. Pollution Prevention. USAF Policy Directive 1• -
4. Washington: HQ USAF, 30 November 1992.
16. Department of the Air Force. Pollution Prevention Program Action Plan.Washington: HQ USAF, January 11, 1993.
17. Donovan, Christine T. "Wood Waste Recovery and Processing," ResourceRecycling, 9: 84-92 (March 1991).
18. Duncan, Michael. Class handout, EMGT 550, Economic Decision Analysis.School of Engineering, Air Force Institute of Technology, Wright-Patterson AFBOH, October, 1992.
19. Fusco, Peter. "No More Landfills," Recycling Today, 30: 56-61 (May 15,1992).
20. Gates, Betsy, et al. Non-Mixed Municipal Solid Waste Composition and VolumeMetropolitan Area 1990-1991. The Minnesota Pollution Control Agency and theMetropolitan Council, no date [1992].
21. Goldstein, Nora. "Demolition Contractor Becomes Recycler," Biocycle, 33: 76-77 (January 1992).
22. Greenwood, Steve. "A Model for Calculating the Avoided Costs of Disposal,"Resource Recycling, 6: 22-25 (January/February 1988).
23. Grogan, Peter L. Partner and Executive Director, Materials Recovery, R.W.Beck and Associates. "Economic Developers Use Recycling Technologies."
85
Address to conferees. 23rd Annual Biocycle National Conference, Minneapolis,MN 13 May 1993.
24. Illinois Departmeit of Energy and Natural Resources, Office of Solid Waste andRenewable Reson:-ces. Wood Waste Disposal-in !llinois, March, 1991.
25. Jex, Pusseil D. Project Manager, BENLCO Enterprises, Hill AFB UT. PersonalCorrespondence. 14 July 1993.
26. Jones, George Vernon. Improved Util-zation of Construction Materials.Research Report R 73-34, Structures Publication no. 370, NSF Grant GK2551OX. Department of Civil Engineering, Massachusetts Institute ofTechnology, June 1973.
27. Kalin, Zev. "Canada Targets C&D Debris," Biocycle, 32: 35-36 (January
1991).
28. "Landfills and Concrete Shouldn't Mix," Waste Age, 24: 77 (January 1989).
29. Metropolitan Council of the Twin Cities Ar"". Construction Materia!s RecyclingGuidebook. Minneapolis: The Perfect Page, March, 1993.
30. Meyer, Alvin F. and Rock Ken. Recommendation to Support DOD Recyclingand Reutilization Initiatives As They Relate to MILCON Design andConstruction. Arlington, VA: Society of American Military Engineers,Environmental Affairs Committee, Subcommittee on Pollution Prevention,December 1992.
31. Misner, Michael. "Cutting into Wood Waste Markets," Waste Age, 22: 73-76(August 1991).
32. Musick, Mark. "Recycling Gypsum from C&D Debris," Biocycle, 33: 34-36(March 1992).
33. O'Brien, Kathleen. "Wood Waste Recycling Options," Biocycle, 32: 82-86(May 1991).
34. "Realco Recycling: Real Solutions," Recycling Today, 30: 46-50 (July 15,1992).
35. Senesac, Real P. President, Realco Recycling, Jacksonville, FL. PersonalInterview. 18 June 1993.
86

36. Spencer, Robert. "Recycling Opportunities for Demolition Debris," Biocycle,30: 42-44 (November 1989).
37. Spencer, Robert. "Taking Control of C&D Debris," Biocycle, 32: 65-68 (July1991).
38. Spencer, Robert. "Tearing Down for Reuse," Biocycle, 33: 53 (May 1992).
39. Spencer, Robert. "Whittling Away at Wood Waste," Biocycle, 34: 52-53(January 1993).
40. United States Environmental Protection Agency. Facility Pollution PreventionGuide. EPA/600/R-92-088. Washington: GPO, 1992.
41. "Unlocking the Environmental Puzzle," Recycling Today. 30: 134-138(February 15, 1992).
42. U.S. Bureau of the Census. Statistical Abstract of the United States 1992.112th Edition. Washington: Government Printing Office, 1992.
43. United States Congress. "FY 94 Budget Resolution," U.S. CongressionalReview. 72: 136 (May 1993).
44. Vermont Agency of Natural Resources. Recycling Construction and DemolitionWaste in Vermont, C.T. Donovan and Associates, Inc., December 1990.
45. Wiesman, Richard M., and Wilson, David G. "Demolition Debris: Quantities,Composition, and Possibilities for Recycling," Proceedings of the Fifth MineralWaste Utilization Symposium. 8-15. Chicago: U.S. Bureau of Mines and IITResearch Institute, April 13-14, 1976.
46. Wilson, David G., Davidson, Thomas A., and NG, Herbert T.S. DemolitionWastes: Data Collection and Separation Studies. NSF Grant No. 76-22048AER. Department of Mechanical Engineering, Massachusetts Institute ofTechnology, December 1979.
47. Witten, Matthew. "Reuse of Low-End Construction and Demolition Debris,"Resource Recycling, 10: 115-122 (April 1992).
48. Wolfe, Paris R. "Disposal Ban Scares Contractors," Recycling Today, 30: 52-62 (April 15, 1992).
87
49. Woods, Randy. "C&D Debris: A Crisis Is Building," Waste Age, 28: 26-28(January 1992).
88

Vita
Captain Byron L. Dixon was born on I July 1964 in Gulfport, Mississippi. He
graduated from Bay High School in Bay St Louis, Mississippi in 1982 and attended
the University of Mississippi, graduating with a Bachelor of Science in Civil
Engineering in December, 1986. Upon graduation, he received a commission through
the USAF Reserve Officer Training Corps and served his first tour of duty at Hill
AFB, Utah. He began his Air Force career as a Civil Design Engineer for tje 2849th
Civil Engineering Squadron, where he was responsible for designs of several base
facility construction projects. In November 1988, he was selected to serve as the
Civil Engineering O'•rations Executive Officer until September 1989 when he wab
appointed Chief of the Simplified Acquisition of Base Engineering Requirements
(SABER) construction unit. As Chief of SABER, he was responsible for the
management of an $11 million cradle-to-grave design/construction program. Captain
Dixon was in charge of the SABER unit until May 1992, when he became a Masters
Candidate in the Environmental and Engineering Management Department, School of
Engineering, Air Force Institute of Technology.
Permanent Address: 4286 Fowler Dr.Bellbrook, OH 45305
89

Fo:rm •'r~c
REPORT DOCUMENTATION PAGE oM r0008
1. AGENCY USE ONLY $Leave O/•rk) !2 REPORT DATE 3. REPORT TYPE AND DATES COVERED
I September 1993 Master's Thesis4. TITLE AND SUBTITLE 5. FUNDING NUMBERS
A PREDICTIVE MODEL FOR THE DETERMINATION OF THEECONOMIC FEASIBILITY OF CONSTRUCTION ANDDEMOLITION WASTE RECYCLING IN THE AIR FORCE
6. AUTHOR(S)
Byron L. Dixon, Captain, USAF
7. PERFORMING ORGANIZATION NAME(S) AND ADORESS(ES) 8. PERFORMING ORGANIZATIONREPORT NUMBER
Air Force Institute of Technology AFIT/GEE/ENV/93S-05WPAFB OH 45433-6583
9. SPONSORING, MONITORING AGENCY NAME(S) AND AODRESS(ES) 10. SPONSORING MONITORINGAGENCY REPORT NUMBER
11. SUPPLEMENTARY NOTES
1Za. DISTRIBUTION AVAILABILITY STATEMENT 12b. DISTRIBUTION CODE
Approved for public release;distribution unlimited
13. ABSTRACT (Maximum 200 words)
This study created a model to be used at a CONUS Air Force base to determine
the econimic feasibility of Construction and Demolition (C&D) waste recycling.Three areas were investigated to develop this model: the methods to determine theamounts and types of C&D waste generated at a specific location, the mark-tq forrecycled C&D wastes, and the recycling methods currently available. From thisdata, gathered through records searches and interviews, a procedure was developedto perform cost/benefit analyses on the available recycling options. A model wasthen created based on these calculations which can arm a manager with informationto either support or reject a recycling program by indicating cost savings orlosses from recycling C&D waste. Also, the model aids managers in determining theapproximate quantities of recyclable materials being generated, which could bevaluable in reaching base recycling goals. To demonstrate the model, thefeasibility of recycling C&D waste at Hill AFB, UT in 1994 was evaluated. Inaddition to determining recycling feasibility, a method was presented to performsensitivity analyses on the base-specific input variables. This procedure can helpdetermine when it will become feasible to create a C&D waste recycling program.
14. SUBJECT TERMS 15. NUMBER OF PAGES
Demolition Waste, Construction Waste, Recycling, 16. PRICE CODEEconomic Feasibility, Pollution Prevention
1 17. SECURITY CLASSIFICATION 18. SECURITY CLASSIFICATION 19. SECURITY CLASSIFICATION 20. LIMITATION OF ABSTRACTOF REPORT OF THIS PAGE OF ABSTRACT
UnclUnclassifienlssified Tnglasifimd TTT.,NSN 7540-0"-280-5501 Standard ;orm 298 (Pev 2-89
" -• i |, |