DTE Electric Company TRM - 2018 Reconciliation Case No. U ...
22
Exhibit No. Title Witness (hyperlinked) A-1 Capital Expenditures K. R. Whitman A-2 Operation & Maintenance (O&M) K. R. Whitman A-3.1 Revenue from Former PLD Customers K. J. Hansard A-3.2 TRM Surcharge Revenue K. J. Hansard A-4 Net Plant Balance, Depreciation & AFUDC K. J. Hansard A-5 Uncollectible Expense K. J. Hansard A-6 Property Tax Calculation R. A. Biel A-7 Deferred Tax Liability Balance R. A. Biel A-8 Revenue Requirement & Under Recovery Balance M. A. Suchta A-9 Pre-Tax Return on Rate Base M. A. Suchta A-10 Pre-Tax Rate of Return M. A. Suchta A-11 Revenue Conversion Factors M. A. Suchta A-12 Carrying Cost Calculation M. A. Suchta A-13 Transitional Tariff Credit K. A. Holmes A-14 Transitional Reconciliation Mechanism Surcharge Calculation K. A. Holmes A-15 Proposed Tariff Sheets K. A. Holmes DTE Electric Company TRM - 2018 Reconciliation Case No. U-20364 Exhibit Index
Transcript of DTE Electric Company TRM - 2018 Reconciliation Case No. U ...
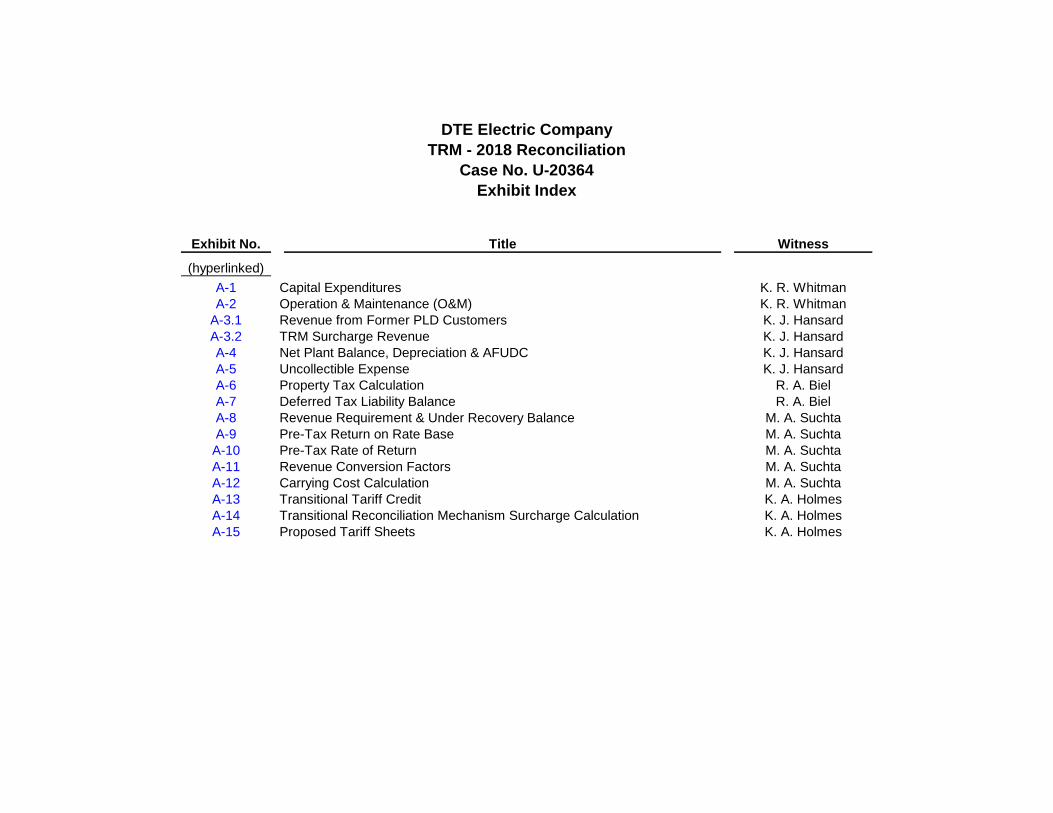
Exhibit No. Title Witness
(hyperlinked)
A-1 Capital Expenditures K. R. Whitman
A-2 Operation & Maintenance (O&M) K. R. Whitman
A-3.1 Revenue from Former PLD Customers K. J. Hansard
A-3.2 TRM Surcharge Revenue K. J. Hansard
A-4 Net Plant Balance, Depreciation & AFUDC K. J. Hansard
A-5 Uncollectible Expense K. J. Hansard
A-6 Property Tax Calculation R. A. Biel
A-7 Deferred Tax Liability Balance R. A. Biel
A-8 Revenue Requirement & Under Recovery Balance M. A. Suchta
A-9 Pre-Tax Return on Rate Base M. A. Suchta
A-10 Pre-Tax Rate of Return M. A. Suchta
A-11 Revenue Conversion Factors M. A. Suchta
A-12 Carrying Cost Calculation M. A. Suchta
A-13 Transitional Tariff Credit K. A. Holmes
A-14 Transitional Reconciliation Mechanism Surcharge Calculation K. A. Holmes
A-15 Proposed Tariff Sheets K. A. Holmes
DTE Electric Company
TRM - 2018 Reconciliation
Case No. U-20364
Exhibit Index
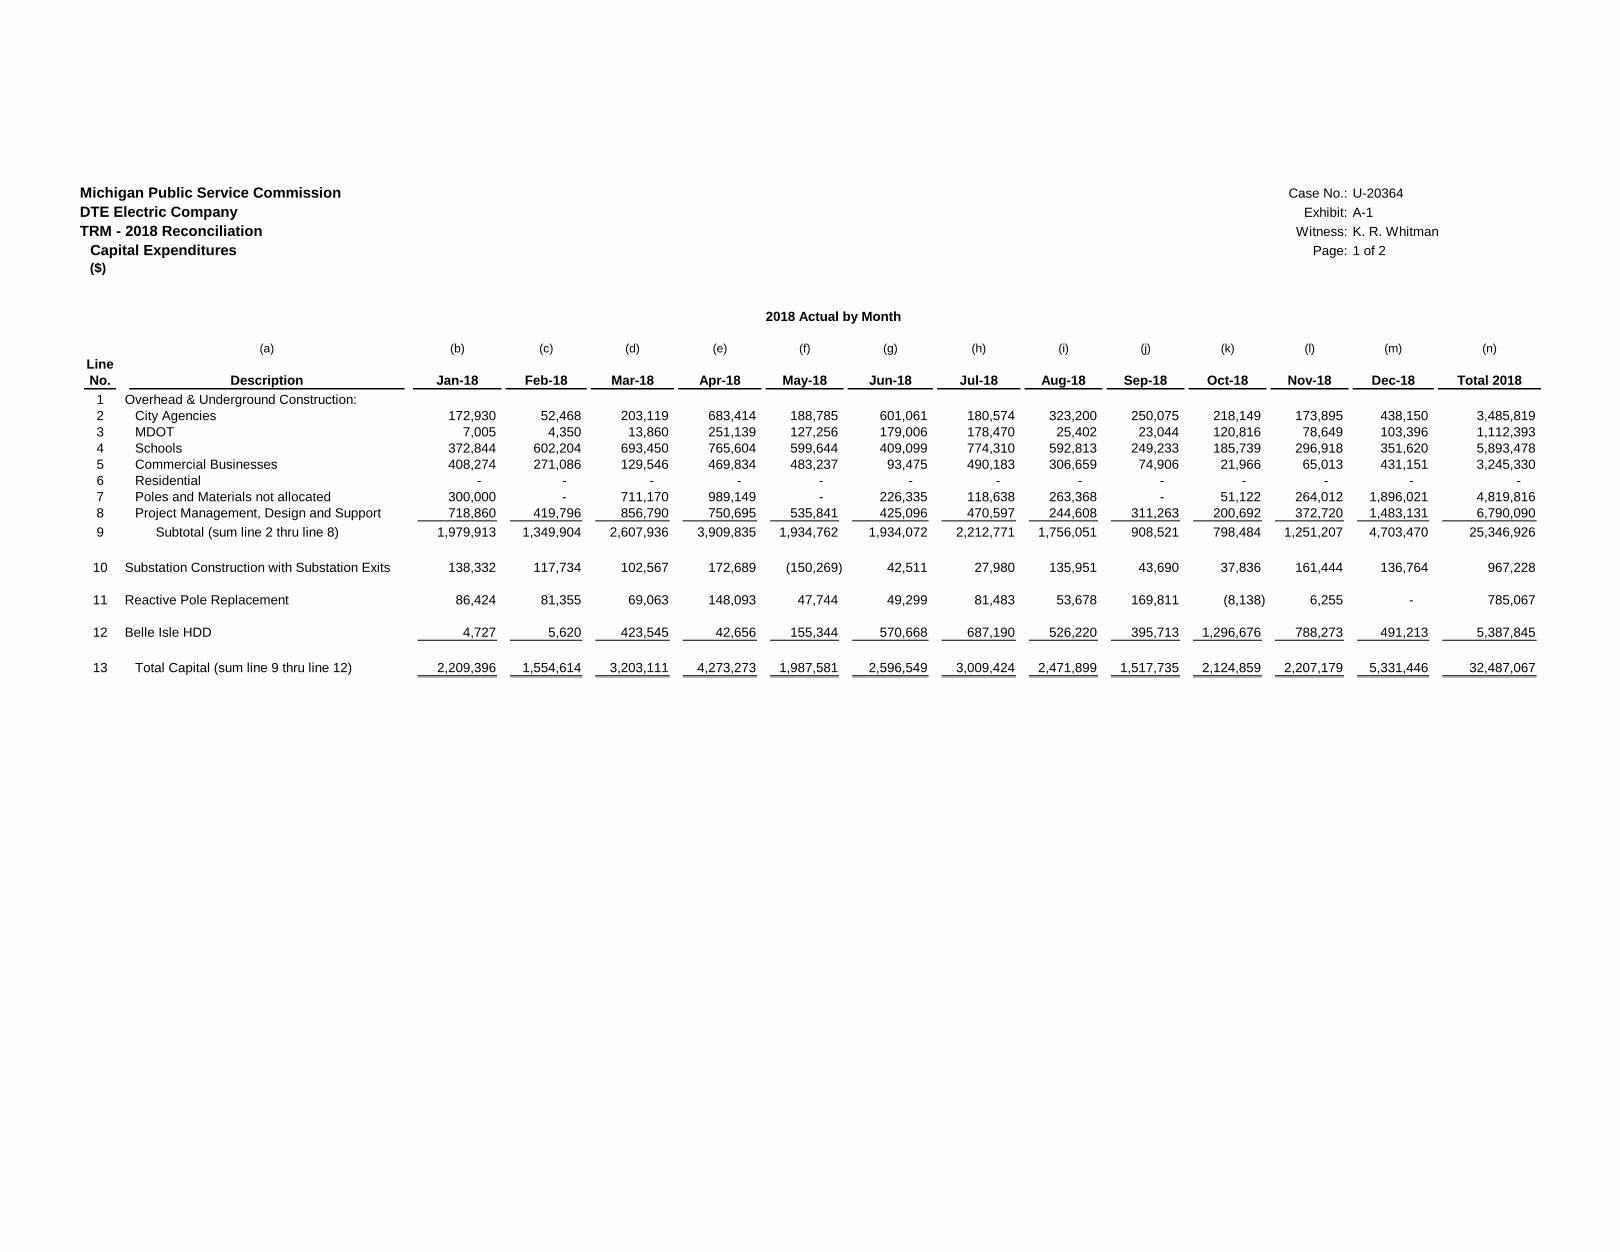
Michigan Public Service Commission Case No.: U-20364
DTE Electric Company Exhibit: A-1
TRM - 2018 Reconciliation Witness: K. R. Whitman
Capital Expenditures Page: 1 of 2
($)
2018 Actual by Month
(a) (b) (c) (d) (e) (f) (g) (h) (i) (j) (k) (l) (m) (n)
Line
No. Description Jan-18 Feb-18 Mar-18 Apr-18 May-18 Jun-18 Jul-18 Aug-18 Sep-18 Oct-18 Nov-18 Dec-18 Total 2018
1 Overhead & Underground Construction:
2 City Agencies 172,930 52,468 203,119 683,414 188,785 601,061 180,574 323,200 250,075 218,149 173,895 438,150 3,485,819
3 MDOT 7,005 4,350 13,860 251,139 127,256 179,006 178,470 25,402 23,044 120,816 78,649 103,396 1,112,393
4 Schools 372,844 602,204 693,450 765,604 599,644 409,099 774,310 592,813 249,233 185,739 296,918 351,620 5,893,478
5 Commercial Businesses 408,274 271,086 129,546 469,834 483,237 93,475 490,183 306,659 74,906 21,966 65,013 431,151 3,245,330
6 Residential - - - - - - - - - - - - -
7 Poles and Materials not allocated 300,000 - 711,170 989,149 - 226,335 118,638 263,368 - 51,122 264,012 1,896,021 4,819,816
8 Project Management, Design and Support 718,860 419,796 856,790 750,695 535,841 425,096 470,597 244,608 311,263 200,692 372,720 1,483,131 6,790,090
9 Subtotal (sum line 2 thru line 8) 1,979,913 1,349,904 2,607,936 3,909,835 1,934,762 1,934,072 2,212,771 1,756,051 908,521 798,484 1,251,207 4,703,470 25,346,926
10 Substation Construction with Substation Exits 138,332 117,734 102,567 172,689 (150,269) 42,511 27,980 135,951 43,690 37,836 161,444 136,764 967,228
11 Reactive Pole Replacement 86,424 81,355 69,063 148,093 47,744 49,299 81,483 53,678 169,811 (8,138) 6,255 - 785,067
12 Belle Isle HDD 4,727 5,620 423,545 42,656 155,344 570,668 687,190 526,220 395,713 1,296,676 788,273 491,213 5,387,845
13 Total Capital (sum line 9 thru line 12) 2,209,396 1,554,614 3,203,111 4,273,273 1,987,581 2,596,549 3,009,424 2,471,899 1,517,735 2,124,859 2,207,179 5,331,446 32,487,067
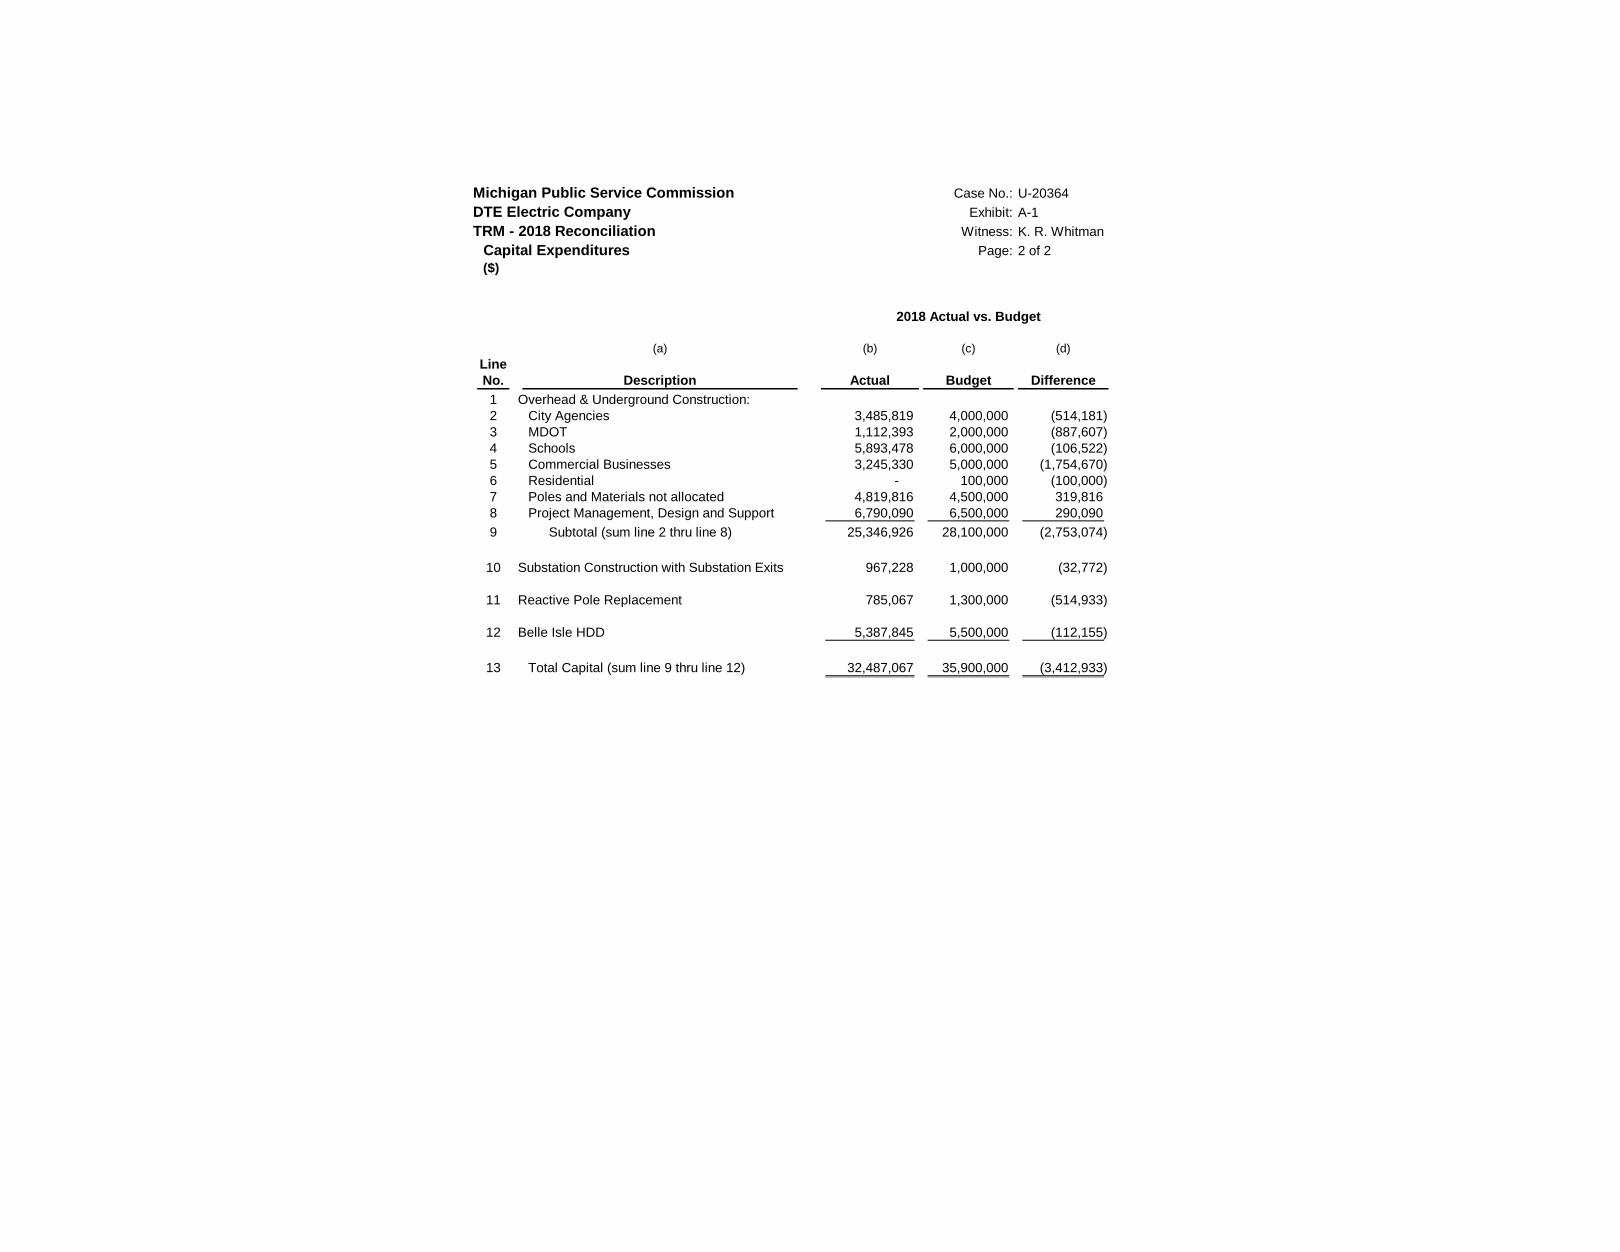
Michigan Public Service Commission
DTE Electric Company
TRM - 2018 Reconciliation
Capital Expenditures($)
(a)
Line
No. Description
1 Overhead & Underground Construction:
2 City Agencies
3 MDOT
4 Schools
5 Commercial Businesses
6 Residential
7 Poles and Materials not allocated
8 Project Management, Design and Support
9 Subtotal (sum line 2 thru line 8)
10 Substation Construction with Substation Exits
11 Reactive Pole Replacement
12 Belle Isle HDD
13 Total Capital (sum line 9 thru line 12)
Case No.: U-20364
Exhibit: A-1
Witness: K. R. Whitman
Page: 2 of 2
2018 Actual vs. Budget
(b) (c) (d)
Actual Budget Difference
3,485,819 4,000,000 (514,181)
1,112,393 2,000,000 (887,607)
5,893,478 6,000,000 (106,522)
3,245,330 5,000,000 (1,754,670)
- 100,000 (100,000)
4,819,816 4,500,000 319,816
6,790,090 6,500,000 290,090
25,346,926 28,100,000 (2,753,074)
967,228 1,000,000 (32,772)
785,067 1,300,000 (514,933)
5,387,845 5,500,000 (112,155)
32,487,067 35,900,000 (3,412,933)
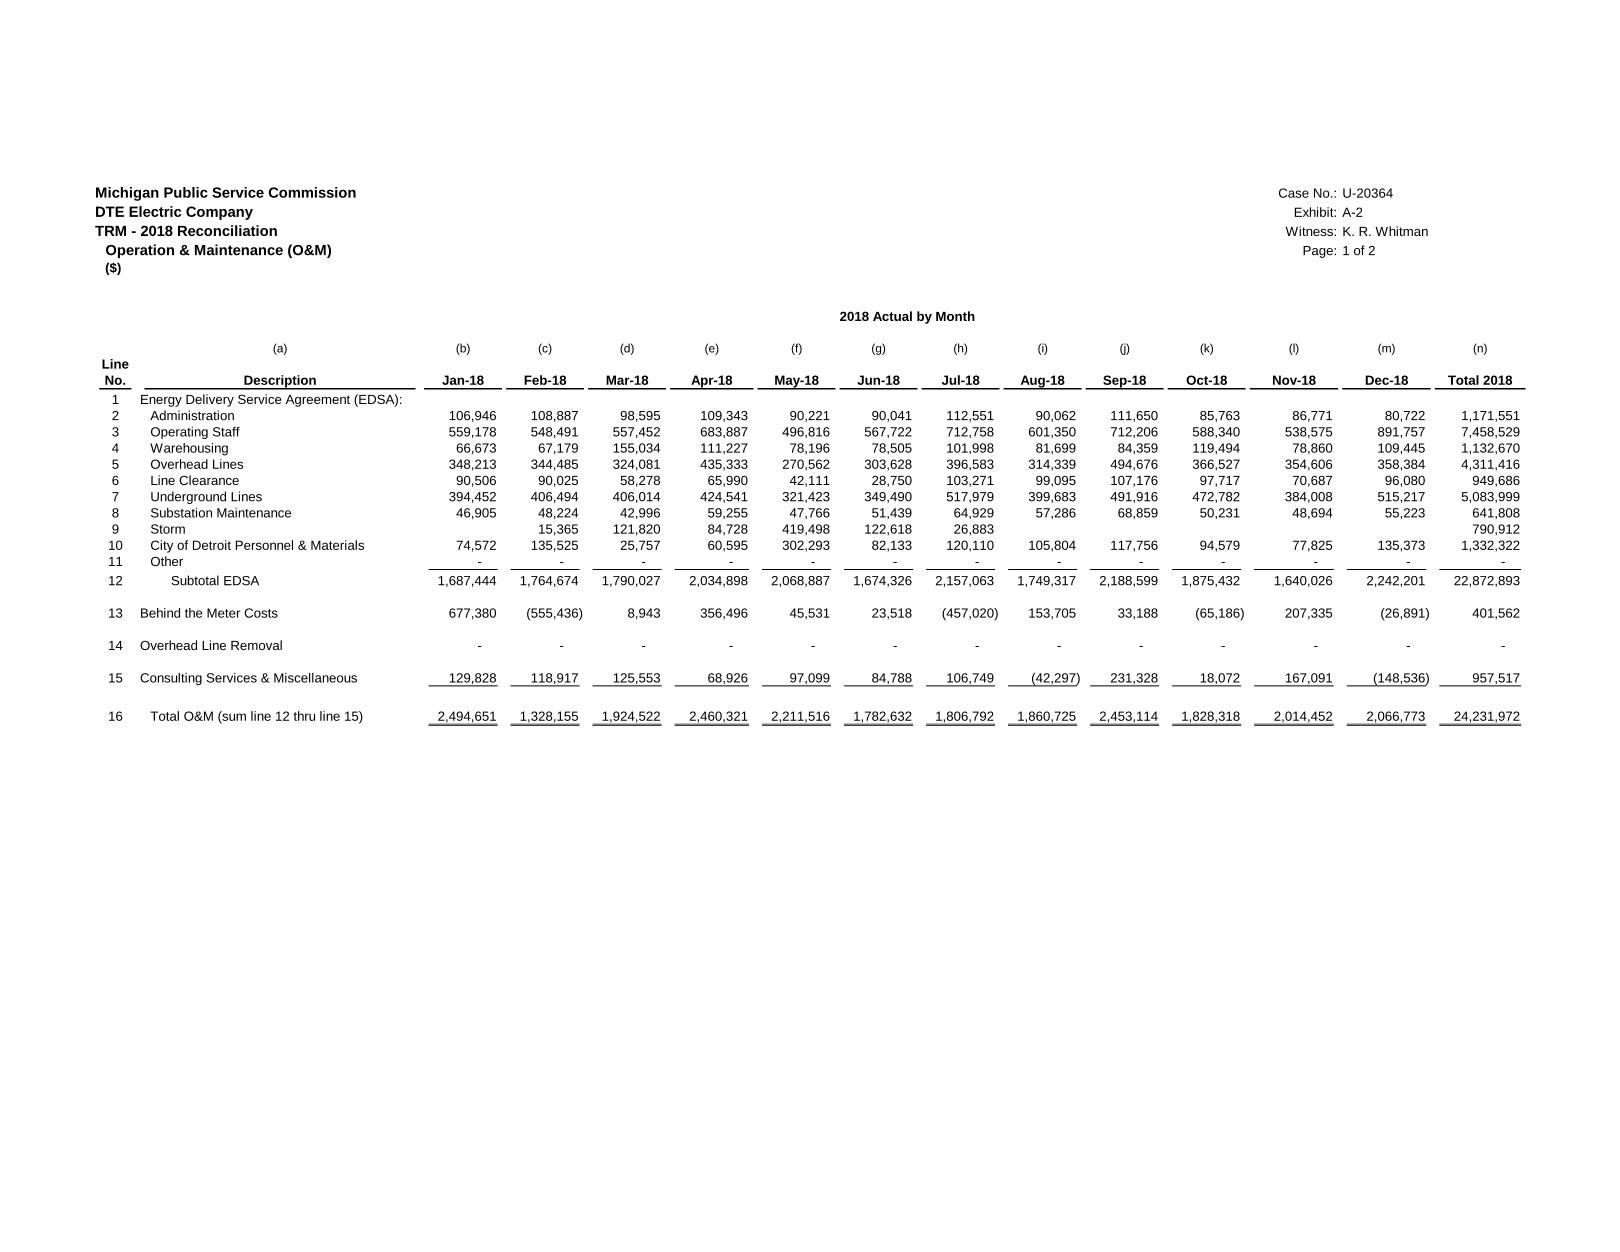
Michigan Public Service Commission Case No.: U-20364
DTE Electric Company Exhibit: A-2
TRM - 2018 Reconciliation Witness: K. R. Whitman
Operation & Maintenance (O&M) Page: 1 of 2
($)
2018 Actual by Month
(a) (b) (c) (d) (e) (f) (g) (h) (i) (j) (k) (l) (m) (n)
Line
No. Description Jan-18 Feb-18 Mar-18 Apr-18 May-18 Jun-18 Jul-18 Aug-18 Sep-18 Oct-18 Nov-18 Dec-18 Total 2018
1 Energy Delivery Service Agreement (EDSA):
2 Administration 106,946 108,887 98,595 109,343 90,221 90,041 112,551 90,062 111,650 85,763 86,771 80,722 1,171,551
3 Operating Staff 559,178 548,491 557,452 683,887 496,816 567,722 712,758 601,350 712,206 588,340 538,575 891,757 7,458,529
4 Warehousing 66,673 67,179 155,034 111,227 78,196 78,505 101,998 81,699 84,359 119,494 78,860 109,445 1,132,670
5 Overhead Lines 348,213 344,485 324,081 435,333 270,562 303,628 396,583 314,339 494,676 366,527 354,606 358,384 4,311,416
6 Line Clearance 90,506 90,025 58,278 65,990 42,111 28,750 103,271 99,095 107,176 97,717 70,687 96,080 949,686
7 Underground Lines 394,452 406,494 406,014 424,541 321,423 349,490 517,979 399,683 491,916 472,782 384,008 515,217 5,083,999
8 Substation Maintenance 46,905 48,224 42,996 59,255 47,766 51,439 64,929 57,286 68,859 50,231 48,694 55,223 641,808
9 Storm 15,365 121,820 84,728 419,498 122,618 26,883 790,912
10 City of Detroit Personnel & Materials 74,572 135,525 25,757 60,595 302,293 82,133 120,110 105,804 117,756 94,579 77,825 135,373 1,332,322
11 Other - - - - - - - - - - - - -
12 Subtotal EDSA 1,687,444 1,764,674 1,790,027 2,034,898 2,068,887 1,674,326 2,157,063 1,749,317 2,188,599 1,875,432 1,640,026 2,242,201 22,872,893
13 Behind the Meter Costs 677,380 (555,436) 8,943 356,496 45,531 23,518 (457,020) 153,705 33,188 (65,186) 207,335 (26,891) 401,562
14 Overhead Line Removal - - - - - - - - - - - - -
15 Consulting Services & Miscellaneous 129,828 118,917 125,553 68,926 97,099 84,788 106,749 (42,297) 231,328 18,072 167,091 (148,536) 957,517
16 Total O&M (sum line 12 thru line 15) 2,494,651 1,328,155 1,924,522 2,460,321 2,211,516 1,782,632 1,806,792 1,860,725 2,453,114 1,828,318 2,014,452 2,066,773 24,231,972
Michigan Public Service Commission Case No.: U-20364
DTE Electric Company Exhibit: A-2
TRM - 2018 Reconciliation Witness: K. R. Whitman
Operation & Maintenance (O&M) Page: 2 of 2
($)
2018 Actual vs. Budget
(a) (b) (c) (d)
Line
No. Description Actual Budget Difference
1 Energy Delivery Service Agreement (EDSA):
2 Administration 1,171,551 1,629,479 (457,928)
3 Operating Staff 7,458,529 8,386,778 (928,248)
4 Warehousing 1,132,670 1,134,100 (1,430)
5 Overhead Lines 4,311,416 4,089,340 222,077
6 Line Clearance 949,686 1,000,152 (50,467)
7 Underground Lines 5,083,999 6,327,403 (1,243,404)
8 Substation Maintenance 641,808 734,377 (92,569)
9 Storm 790,912 400,000 390,912
10 City of Detroit Personnel & Materials 1,332,322 1,316,192 16,130
11 Other - - -
12 Subtotal EDSA 22,872,893 25,017,820 (2,144,927)
13 Behind the Meter Costs 401,562 4,200,000 (3,798,438)
14 Overhead Line Removal - - -
15 Consulting Services & Miscellaneous 957,517 1,400,000 (442,483)
16 Total O&M (sum line 12 thru line 15) 24,231,972 30,617,820 (6,385,848)

Michigan Public Service Commission Case No.: U-20364
DTE Electric Company Exhibit: A-3.1
TRM - 2018 Reconciliation Witness: K. J. Hansard
Revenue from Former PLD Customers Page: 1 of 1
(Exclusive of Power Supply Cost Recovery and all Surcharges)
(a) (b) (c) (d) (e) (f) (g) (h) (i) (j) (k) (l) (m) (n)
Line
No. Description Jan-18 Feb-18 Mar-18 Apr-18 May-18 Jun-18 Jul-18 Aug-18 Sep-18 Oct-18 Nov-18 Dec-18 Total 2018
1 Total Revenue per Billing Reports 1/ 3,115,987 3,319,565 3,357,399 2,958,976 2,856,600 3,108,475 3,258,210 4,013,957 2,877,457 2,807,269 3,239,682 2,827,638 37,741,214
2 Less PSCR and Surcharges:
3 PSCR Base (1,094,075) (1,104,577) (1,137,420) (1,022,402) (962,249) (1,097,613) (1,147,654) (1,423,183) (1,086,130) (994,166) (1,125,623) (986,523) (13,181,615)
4 PSCR Factor 60,366 30,195 29,699 26,693 24,558 29,104 30,027 37,375 29,642 25,716 29,726 25,702 378,803
5 Nuclear Decommissioning (23,607) (23,849) (24,605) (22,086) (20,869) (24,945) (26,115) (32,304) (24,809) (22,583) (25,556) (22,370) (293,699)
6 Renewable Energy - - - - - - - - - - - - -
7 Energy Waste Reduction Program (34,244) (29,778) (39,150) (34,648) (36,813) (30,706) (35,990) (44,297) (21,651) (30,554) (35,802) (33,968) (407,601)
8 Low Income Energy Assistance Fund (839) (720) (1,082) (874) (856) (781) (979) (1,397) (388) (829) (947) (914) (10,603)
9 TRM Reconciliation (44,374) (43,684) (46,243) (41,496) (27,449) (1,654) (525) (383) (2,383) (8,127) (44,007) (39,709) (300,035)
10 Subtotal (1,136,773) (1,172,412) (1,218,801) (1,094,813) (1,023,677) (1,126,595) (1,181,236) (1,464,190) (1,105,719) (1,030,543) (1,202,210) (1,057,782) (13,814,751)
11 Revenue excluding PSCR & Surcharges 1,979,214 2,147,152 2,138,598 1,864,163 1,832,923 1,981,880 2,076,974 2,549,767 1,771,738 1,776,726 2,037,472 1,769,856 23,926,463
12 Automatic Traffic Signals (Unmetered) 2/ 28,719 25,940 28,719 27,793 29,097 28,158 29,097 28,417 27,500 28,417 27,500 28,417 337,773
13 Base Revenue Billed Basis 2,007,933 2,173,092 2,167,317 1,891,956 1,862,019 2,010,038 2,106,071 2,578,184 1,799,238 1,805,142 2,064,972 1,798,273 24,264,236
14 Estimated Current Month Unbilled Revenue 2,055,000 1,966,000 2,400,000 1,779,000 1,924,000 1,945,000 2,178,000 2,578,000 1,741,000 1,865,000 1,999,000 1,859,000 24,289,000
15 Reverse Prior Month Unbilled Revenue (1,926,000) (2,055,000) (1,966,000) (2,400,000) (1,779,000) (1,924,000) (1,945,000) (2,178,000) (2,578,000) (1,741,000) (1,865,000) (1,999,000) (24,356,000)
16 Base Revenue Unbilled Estimate 129,000 (89,000) 434,000 (621,000) 145,000 21,000 233,000 400,000 (837,000) 124,000 134,000 (140,000) (67,000)
17 Base Revenue from Former PLD Customers 2,136,933 2,084,092 2,601,317 1,270,956 2,007,019 2,031,038 2,339,071 2,978,184 962,238 1,929,142 2,198,972 1,658,273 24,197,236
1/ Includes Transition Rate Credit (15,257) (34,262) (8,804) (9,398) (10,780) (9,913) (13,207) (3,757) (2,691) (2,631) (2,435) (2,481) (115,617)
(sponsored by Witness Holmes)
2/ Based on estimated billable wattage of 507,906 at approved rate in effect for E2 Traffic and Signal Lights tariff.

Michigan Public Service Commission Case No.: U-20364
DTE Electric Company Exhibit: A-3.2
TRM - 2018 Reconciliation Witness: K. J. Hansard
TRM Surcharge Revenue Page: 1 of 1
(a) (b) (c) (d) (e) (f) (g) (h) (i) (j) (k) (l) (m) (n)
Line
No. Description Jan-18 Feb-18 Mar-18 Apr-18 May-18 Jun-18 Jul-18 Aug-18 Sep-18 Oct-18 Nov-18 Dec-18 Total 2018
1 TRM Surcharge U-18251 (2016 Rec) 5,861,939$ 5,161,527$ 4,970,219$ 5,101,702$ 1,577,638$ 47,475$ (27,698)$ (4,647)$ 10,899$ 7,423$ 13,732$ 8,236$ 22,728,446$
2 TRM Surcharge U-20051 (2017 Rec) - - - - - - - - 733 3,568,906 5,016,039 4,842,543 13,428,221
3 Total Surcharge Revenue 5,861,939$ 5,161,527$ 4,970,219$ 5,101,702$ 1,577,638$ 47,475$ (27,698)$ (4,647)$ 11,632$ 3,576,329$ 5,029,772$ 4,850,779$ 36,156,667$
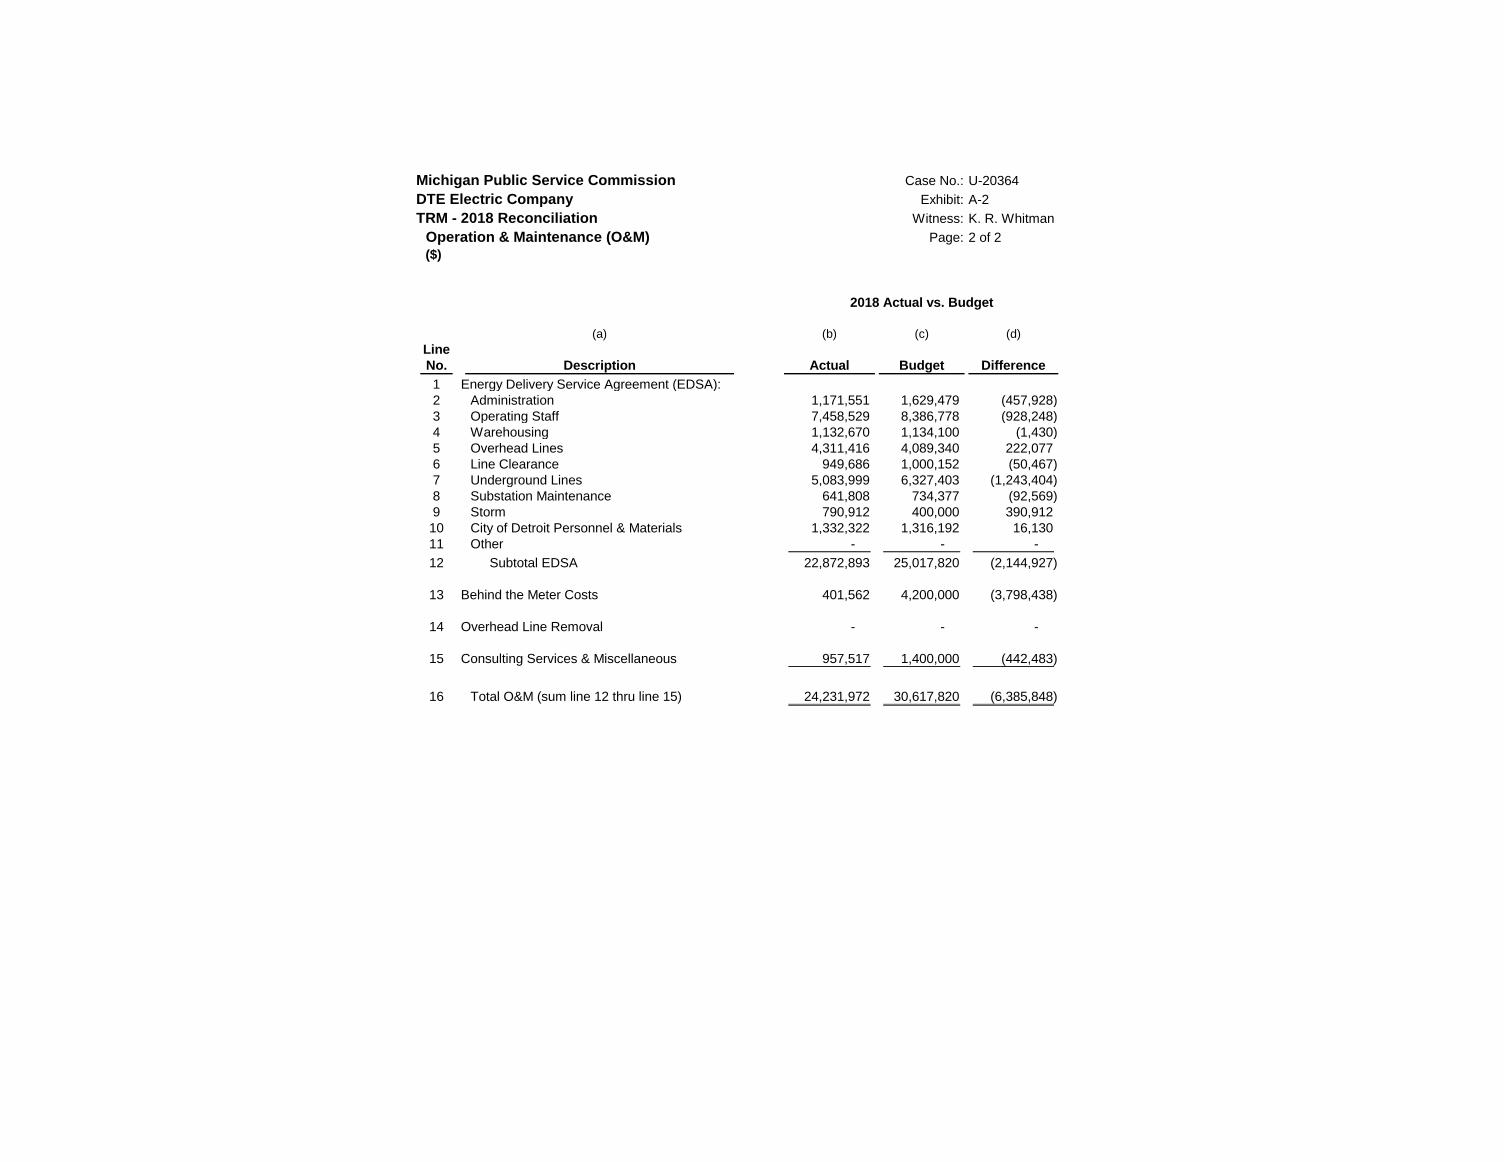
Michigan Public Service Commission Case No.: U-20364
DTE Electric Company Exhibit: A-4
TRM - 2018 Reconciliation Witness: K. J. Hansard
Net Plant Balance, Depreciation & AFUDC Page: 1 of 1
($)
(a) (b) (c) (d) (e) (f) (g) (h) (i) (j) (k) (l) (m) (n) (o) (p)
Line
No. Description Source Beg. Bal. 1/ Jan-18 Feb-18 Mar-18 Apr-18 May-18 Jun-18 Jul-18 Aug-18 Sep-18 Oct-18 Nov-18 Dec-18 Total 2018
1 NET PLANT BALANCE
2 Plant in Service Line 10 40,448,830 40,448,830 40,448,830 40,453,844 40,453,844 52,456,130 52,680,638 53,493,764 53,576,372 53,596,867 53,641,712 54,080,095 83,860,714
3 Construction Work in Progress Line 15 40,961,921 43,171,317 44,725,931 47,924,028 52,197,301 42,182,596 44,554,637 46,750,936 49,140,227 50,637,466 52,717,480 54,486,276 30,037,103
4 Subtotal Gross Plant 81,410,751 83,620,147 85,174,760 88,377,872 92,651,145 94,638,726 97,235,275 100,244,699 102,716,598 104,234,334 106,359,192 108,566,371 113,897,818
5 Accum. Depreciation Line 19 (1,737,911) (1,829,699) (1,921,486) (2,013,262) (2,105,025) (2,216,019) (2,327,480) (2,438,079) (2,551,551) (2,665,092) (2,774,455) (2,886,039) (3,639,709)
6 Net Plant Balance 79,672,840 81,790,448 83,253,274 86,364,610 90,546,120 92,422,707 94,907,796 97,806,620 100,165,048 101,569,241 103,584,737 105,680,333 110,258,108
7 Plant in Service Rollforward
8 Beginning Balance Prior Month Bal. 40,448,830 40,448,830 40,448,830 40,453,844 40,453,844 52,456,130 52,680,638 53,493,764 53,576,372 53,596,867 53,641,712 54,080,095 40,448,830
9 Plant Unitization Books & Records - - 5,015 - 12,002,286 224,508 813,126 82,608 20,495 44,845 438,383 29,780,619 43,411,885
10 Ending Balance Sum L8 thru L9 40,448,830 40,448,830 40,453,844 40,453,844 52,456,130 52,680,638 53,493,764 53,576,372 53,596,867 53,641,712 54,080,095 83,860,714 83,860,714
11 CWIP Rollforward
12 Beginning Balance Prior Month Bal. 40,961,921 43,171,317 44,725,931 47,924,028 52,197,301 42,182,596 44,554,637 46,750,936 49,140,227 50,637,466 52,717,480 54,486,276 40,961,921
13 Capital Expenditures Whitman Exh. A-1 2,209,396 1,554,614 3,203,111 4,273,273 1,987,581 2,596,549 3,009,424 2,471,899 1,517,735 2,124,859 2,207,179 5,331,446 32,487,067
14 Plant Unitization Line 9 - - (5,015) - (12,002,286) (224,508) (813,126) (82,608) (20,495) (44,845) (438,383) (29,780,619) (43,411,885)
15 Ending Balance Sum L12 thru L14 43,171,317 44,725,931 47,924,028 52,197,301 42,182,596 44,554,637 46,750,936 49,140,227 50,637,466 52,717,480 54,486,276 30,037,103 30,037,103
16 Accum. Depr. Rollforward
17 Beginning Balance Prior Month Bal. (1,737,911) (1,829,699) (1,921,486) (2,013,262) (2,105,025) (2,216,019) (2,327,480) (2,438,079) (2,551,551) (2,665,092) (2,774,455) (2,886,039) (1,737,911)
18 Provision Line 21 (91,788) (91,788) (91,776) (91,763) (110,994) (111,461) (110,599) (113,472) (113,542) (109,363) (111,583) (753,671) (1,901,798)
19 Ending Balance Sum L17 thru L18 (1,829,699) (1,921,486) (2,013,262) (2,105,025) (2,216,019) (2,327,480) (2,438,079) (2,551,551) (2,665,092) (2,774,455) (2,886,039) (3,639,709) (3,639,709)
20 DEPRECIATION & AFUDC
21 Book Depreciation Books & Records 91,788 91,788 91,776 91,763 110,994 111,461 110,599 113,472 113,542 109,363 111,583 753,671 1,901,798
22 AFUDC Credit Books & Records (29,692) (4,218) (4,223) (4,061) (3,929) (3,951) (3,982) (4,029) (11,463) (13,866) (16,863) (18,580) (118,857)
1/ Beginning of year balance per Order in Case No. U-20051
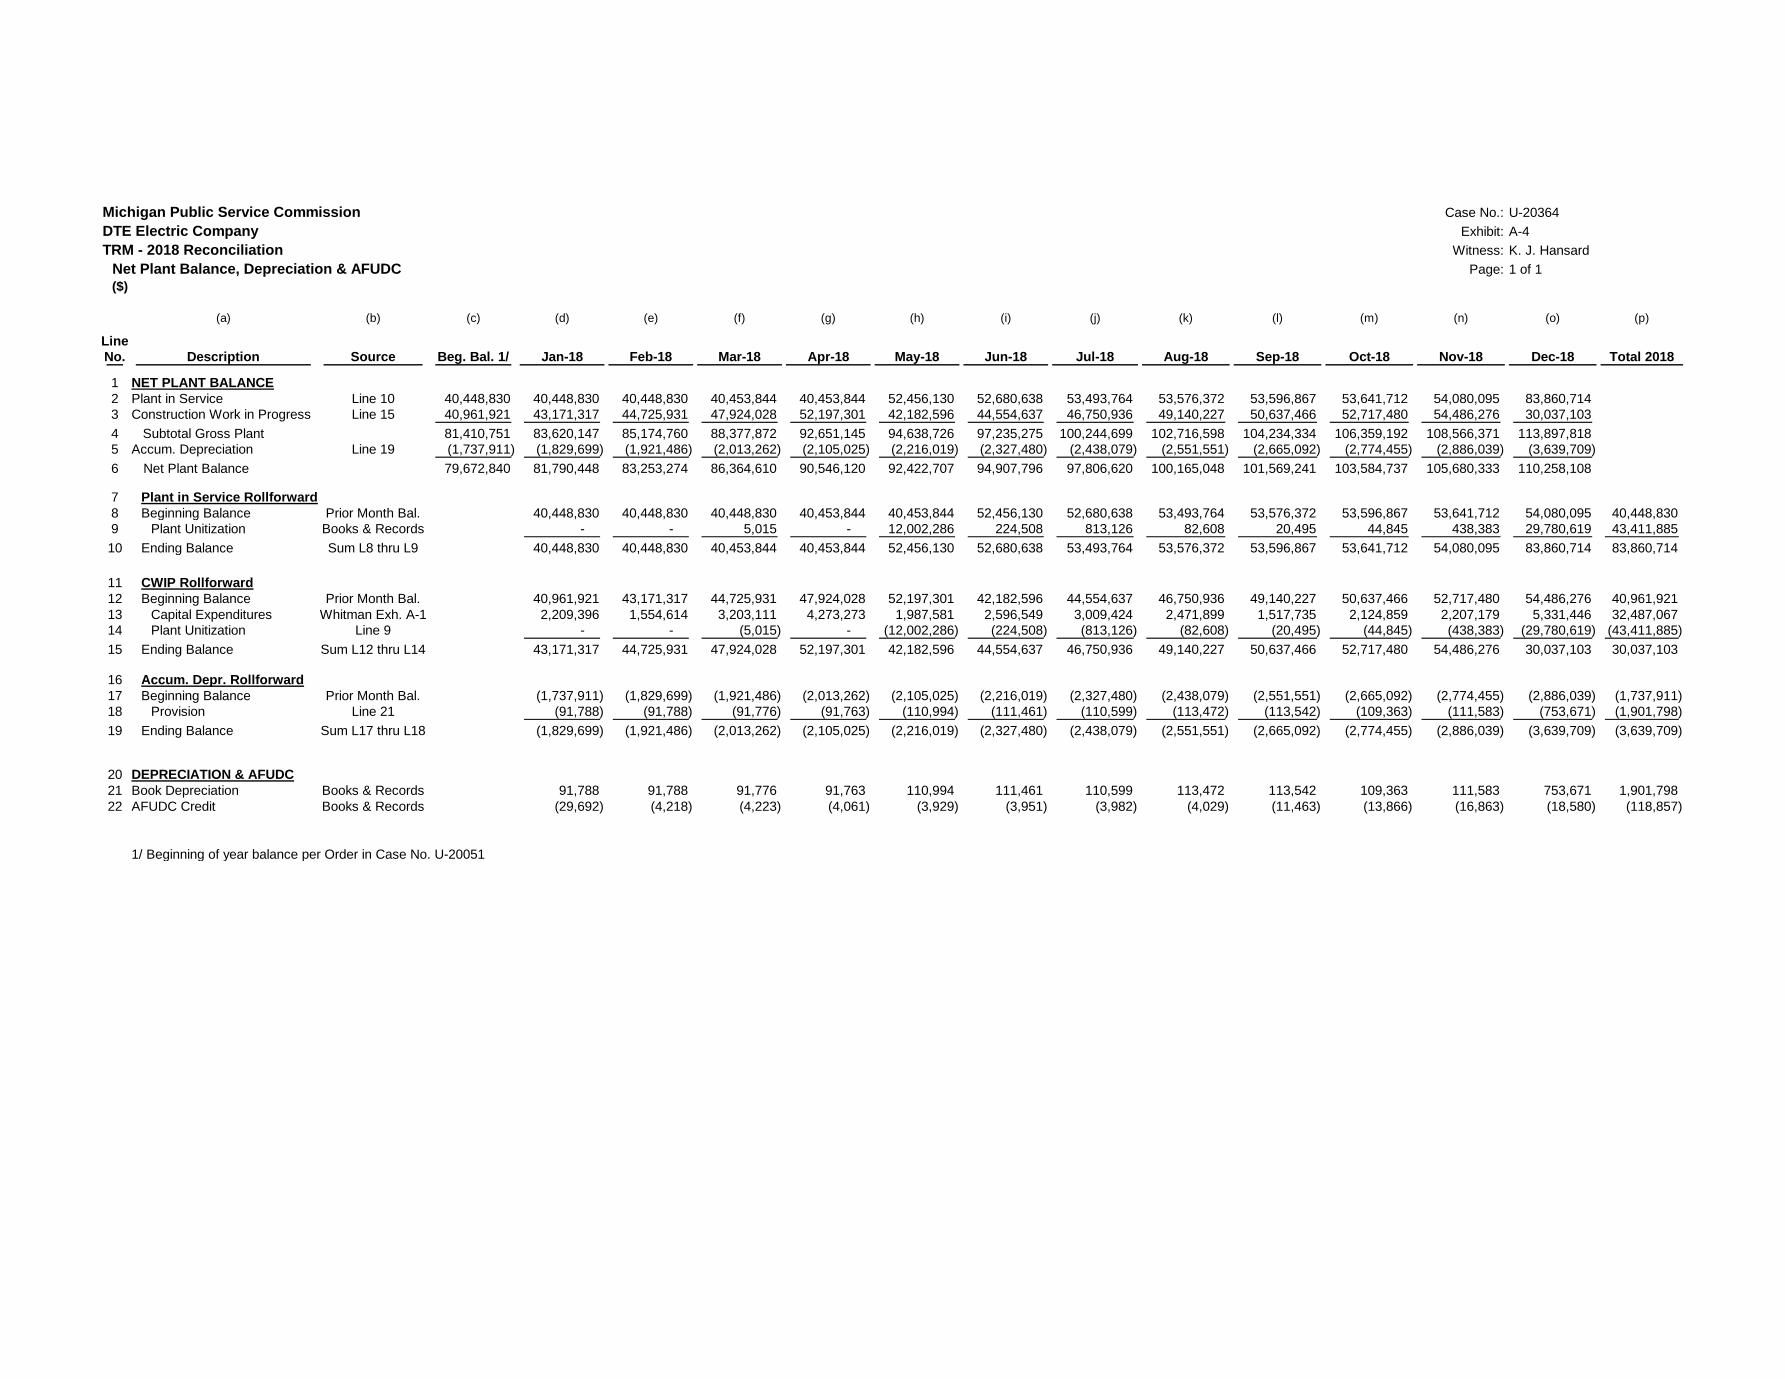
Michigan Public Service Commission Case No.: U-20364
DTE Electric Company Exhibit: A-5
TRM - 2018 Reconciliation Witness: K. J. Hansard
Uncollectible Expense Page: 1 of 1
(a) (b) (c) (d) (e) (f) (g) (h) (i) (j) (k) (l) (m) (n) (o) (p)
Line
No. Description Reference Beg. Bal. Jan-18 Feb-18 Mar-18 Apr-18 May-18 Jun-18 Jul-18 Aug-18 Sep-18 Oct-18 Nov-18 Dec-18
1 PLD Customer Arrears ($)2 Current Receivables 647,386 1,600,121 2,680,673 1,371,335 2,581,007 2,677,785 709,697 1,306,584 1,686,733 4,740,831 169,414 1,308,290 765,131
3 Active Arrears:4 30 Day Active 1,256,658 809,697 1,043,922 1,187,708 580,642 1,081,814 3,105,944 1,240,943 1,565,861 1,412,249 1,691,462 713,004 1,112,926 5 60 Day Active 589,574 686,580 474,933 800,172 756,189 411,396 296,056 2,549,609 823,545 455,552 613,228 1,264,114 618,896 6 90 Day Active 724,634 304,547 510,789 459,017 686,567 304,369 311,042 231,263 2,462,489 192,830 138,418 583,624 1,072,598
7 >90 Day Active 2,014,407 2,050,805 2,146,404 1,458,104 1,414,417 1,306,903 1,185,475 1,388,506 1,131,479 625,219 527,823 596,957 772,937
8 Total Active Arrears 4,585,272 3,851,629 4,176,047 3,905,001 3,437,815 3,104,482 4,898,517 5,410,321 5,983,373 2,685,849 2,970,930 3,157,699 3,577,358
9 Final Arrears 348,276 336,125 289,920 160,243 160,574 101,078 97,934 156,022 160,961 97,934 171,875 182,449 153,970
10 Total Arrears 5,580,934 5,787,875 7,146,640 5,436,579 6,179,397 5,883,345 5,706,147 6,872,927 7,831,067 7,524,613 3,312,219 4,648,438 4,496,458
11 Reserve Rates (%)12 Current Receivables 0.6% 0.7% 0.5% 0.6% 0.9% 1.6% 1.1% 0.7% 1.7% 1.9% 1.0% 0.5% 1.3%13 Active Arrears:14 30 Day Active 4.8% 6.3% 4.4% 6.1% 7.5% 4.6% 7.9% 6.6% 6.0% 5.3% 7.0% 4.3% 5.2%15 60 Day Active 15.0% 16.2% 18.3% 19.3% 14.9% 16.3% 14.7% 20.7% 20.2% 18.8% 19.0% 15.4% 10.6%16 90 Day Active 28.9% 30.5% 30.1% 31.4% 32.9% 29.4% 29.1% 26.7% 34.5% 24.9% 20.7% 31.6% 27.0%17 >90 Day Active 40.5% 40.9% 40.9% 41.1% 41.5% 42.1% 41.8% 41.7% 43.0% 42.8% 41.2% 40.2% 39.4%18 Final Arrears 131.6% 92.0% 83.1% 72.3% 97.6% 97.1% 96.2% 83.1% 93.4% 96.4% 92.9% 96.5% 96.4%
19 Reserve Balance ($)20 Current Receivables Line 2 x Line 12 4,117 11,835 13,767 8,495 24,101 42,661 7,464 9,033 28,993 91,639 1,759 6,026 9,966 21 Active Arrears:22 30 Day Active Line 4 x Line 14 59,807 50,723 45,426 72,635 43,302 49,860 245,755 81,732 93,757 74,871 118,572 30,552 57,326 23 60 Day Active Line 5 x Line 15 88,344 111,192 87,071 154,138 112,542 67,231 43,499 528,976 166,557 85,449 116,807 194,451 65,384 24 90 Day Active Line 6 x Line 16 209,278 92,948 153,857 144,353 225,564 89,362 90,497 61,689 850,311 47,942 28,639 184,625 290,099
25 >90 Day Active Line 7 x Line 17 815,839 838,466 878,939 599,174 587,283 550,177 495,153 578,702 486,444 267,703 217,697 240,073 304,346
26 Total Active Arrears 1,173,268 1,093,329 1,165,293 970,299 968,691 756,631 874,904 1,251,098 1,597,069 475,965 481,715 649,701 717,156
27 Final Arrears Line 9 x Line 18 458,467 309,187 240,808 115,922 156,690 98,164 94,258 129,685 150,295 94,433 159,710 176,030 148,397
28 Ending Reserve Required L20 + L26 + L27 1,635,852 1,414,351 1,419,868 1,094,716 1,149,482 897,456 976,625 1,389,816 1,776,357 662,037 643,184 831,756 875,518
29 Uncollectible Expense Jan-18 Feb-18 Mar-18 Apr-18 May-18 Jun-18 Jul-18 Aug-18 Sep-18 Oct-18 Nov-18 Dec-18 Total 2018
30 Ending Reserve Required Line 28 1,414,351 1,419,868 1,094,716 1,149,482 897,456 976,625 1,389,816 1,776,357 662,037 643,184 831,756 875,518 875,518
31 Less Beginning Reserve Prior Month Line 28 (1,635,852) (1,414,351) (1,419,868) (1,094,716) (1,149,482) (897,456) (976,625) (1,389,816) (1,776,357) (662,037) (643,184) (831,756) (1,635,852)
32 Change in Reserve (221,501) 5,517 (325,151) 54,765 (252,026) 79,169 413,191 386,542 (1,114,320) (18,853) 188,572 43,762 (760,333) 33 Plus: Write-offs 248 36,577 106,082 432 54,057 5,054 216,001 35,156 5,759 363,570 - 4,316 827,251
34 Less: Recoveries (123) - - - - - (209,858) - - (51,077) - - (261,057)
35 Total Uncollectible Expense (221,375)$ 42,093$ (219,069)$ 55,197$ (197,969)$ 84,223$ 419,334$ 421,698$ (1,108,562)$ 293,639$ 188,572$ 48,078$ (194,140)$

Michigan Public Service Commission Case No.: U-20364
DTE Electric Company Exhibit: A-6
TRM - 2018 Reconciliation Witness: R. A. Biel
Property Tax Calculation Page: 1 of 1
($)
(a) (b) (c) (d) (e) (f) (g)
Current Year Liability is based on Prior Year Liability is based on
Dec. 31, 2017 balance Dec. 31, 2016 balance
Line STC True Cash STC True Cash
No. Description Cost (1) Multiplier (2) Value Cost (1) Multiplier (2) Value
1 True Cash Value (TCV) col. (b) x col. (c) col. (e) x col. (f)
2 2017 Additions 12,101,092 0.96 11,617,048
3 2016 Additions 24,562,130 0.93 22,842,781 24,562,130 0.96 23,579,645
4 2015 Additions 134,388 0.90 120,949 134,388 0.93 124,981
5 2014 Additions 3,651,220 0.86 3,140,050 3,651,220 0.90 3,286,098
6 CWIP Balance 40,961,921 0.50 20,480,961 25,188,986 0.50 12,594,493
7 True Cash Value 58,201,788 39,585,217
(1) Additions & CWIP cost is carried from Exhibit A-4 per Order in Case No. U-20051
(2) Electric Distribution and Transmission Utility Personal Property STC Original Cost Multiplier
(h) (i) (j) (k) (l)
Line Current Year Prior Year Total
No. Description Liability Liability Expense Source/Calculation
8 Estimated Property Tax Expense
9 True Cash Value 58,201,788 39,585,217 Line 7
10 % Assessed Value x 50% x 50%
11 Assessed Value 29,100,894 19,792,608 50% x Line 9
12 Millage Rate (per thousand) 86.48 87.74 Based on City of Detroit Taxing Jurisdiction
13 Property Tax Liability 2,516,645 1,736,603 Line 11 x Line 12 ÷ 1000
14 Portion Expensed during 2018 39% 61%
15 Annual Property Tax Expense 981,492 1,059,328 2,040,820 Line 13 x Line 14
16 Monthly Expense 170,068 Line 15 ÷ 12 Months

Michigan Public Service Commission Case No.: U-20364
DTE Electric Company Exhibit: A-7
TRM - 2018 Reconciliation Witness: R. A. Biel
Deferred Tax Liability Balance Page: 1 of 1
($)
(a) (b) (c) (d) (e) (f) (g) (h) (i) (j) (k) (l) (m) (n) (o)
Line
No. Description Source Jan-18 Feb-18 Mar-18 Apr-18 May-18 Jun-18 Jul-18 Aug-18 Sep-18 Oct-18 Nov-18 Dec-18 Total 2018
1 Deferred Tax Balance
2 Deferred Tax Liability (DTL)
3 Beginning Balance (DTL) 1/ Prior month Line 6 (5,123,584) (5,143,940) (5,156,074) (5,168,216) (5,180,362) (5,202,097) (5,225,282) (5,248,538) (5,271,211) (5,293,918) (5,317,852) (5,343,436) (5,123,584)
4 Rate adjustment (8,223) (8,223)
5 Change Line 18 x -1 (12,134) (12,134) (12,142) (12,145) (21,736) (23,184) (23,256) (22,673) (22,707) (23,934) (25,583) (129,039) (340,669)
6 Ending Balance (DTL) Line 3 + Line 5 (5,143,940) (5,156,074) (5,168,216) (5,180,362) (5,202,097) (5,225,282) (5,248,538) (5,271,211) (5,293,918) (5,317,852) (5,343,436) (5,472,475) (5,472,475)
7 New Tax Regulatory Liability - Tax Reform
8 Deferred Tax Liability (DTL)
9 Beginning Balance (DTL) 1/ Prior month Line 11 (2,603,847) (2,603,351) (2,603,351) (2,603,351) (2,603,351) (2,603,351) (2,603,351) (2,603,351) (2,603,351) (2,603,351) (2,603,351) (2,603,351) (2,603,847)
10 Rate adjustment 495 - - - - - - - - - - - 495
11 Ending Balance (DTL) 2/ Line 9 + Line 10 (2,603,351) (2,603,351) (2,603,351) (2,603,351) (2,603,351) (2,603,351) (2,603,351) (2,603,351) (2,603,351) (2,603,351) (2,603,351) (2,603,351) (2,603,351)
12 Net Deferred Tax Asset/(Liab) Line 6 + Line 11 (7,747,292) (7,759,426) (7,771,568) (7,783,713) (7,805,449) (7,828,633) (7,851,890) (7,874,562) (7,897,269) (7,921,204) (7,946,787) (8,075,826) (8,075,826)
13 Deferred Tax Expense
14 Tax Depreciation 5, 7, 10 & 20 Year MACRS 138,637 138,637 138,656 138,656 194,917 200,976 200,392 201,011 201,214 201,774 210,360 1,251,892 3,217,121
15 Book Depreciation Exh. A-4, Line 21 (91,788) (91,788) (91,776) (91,763) (110,994) (111,461) (110,599) (113,472) (113,542) (109,363) (111,583) (753,671) (1,901,798)
16 Timing Difference Line 14 + Line 15 46,849 46,849 46,880 46,893 83,923 89,515 89,793 87,540 87,672 92,411 98,776 498,221 1,315,322
17 Composite Tax Rate Exh. A-11, Line 9 25.90% 25.90% 25.90% 25.90% 25.90% 25.90% 25.90% 25.90% 25.90% 25.90% 25.90% 25.90%
18 Deferred Tax Expense - Change in DTL Line 16 x Line 17 12,134 12,134 12,142 12,145 21,736 23,184 23,256 22,673 22,707 23,934 25,583 129,039 340,669
1/ Beginning of year balance per Order in Case No. U-20051
2/ DTL balance at 12/31/2017 was re-measured to reflect the impact of the 2017 Tax Cut and Job Act (TCJA). Amortization will begin May 2019.
Michigan Public Service Commission Case No.: U-20364
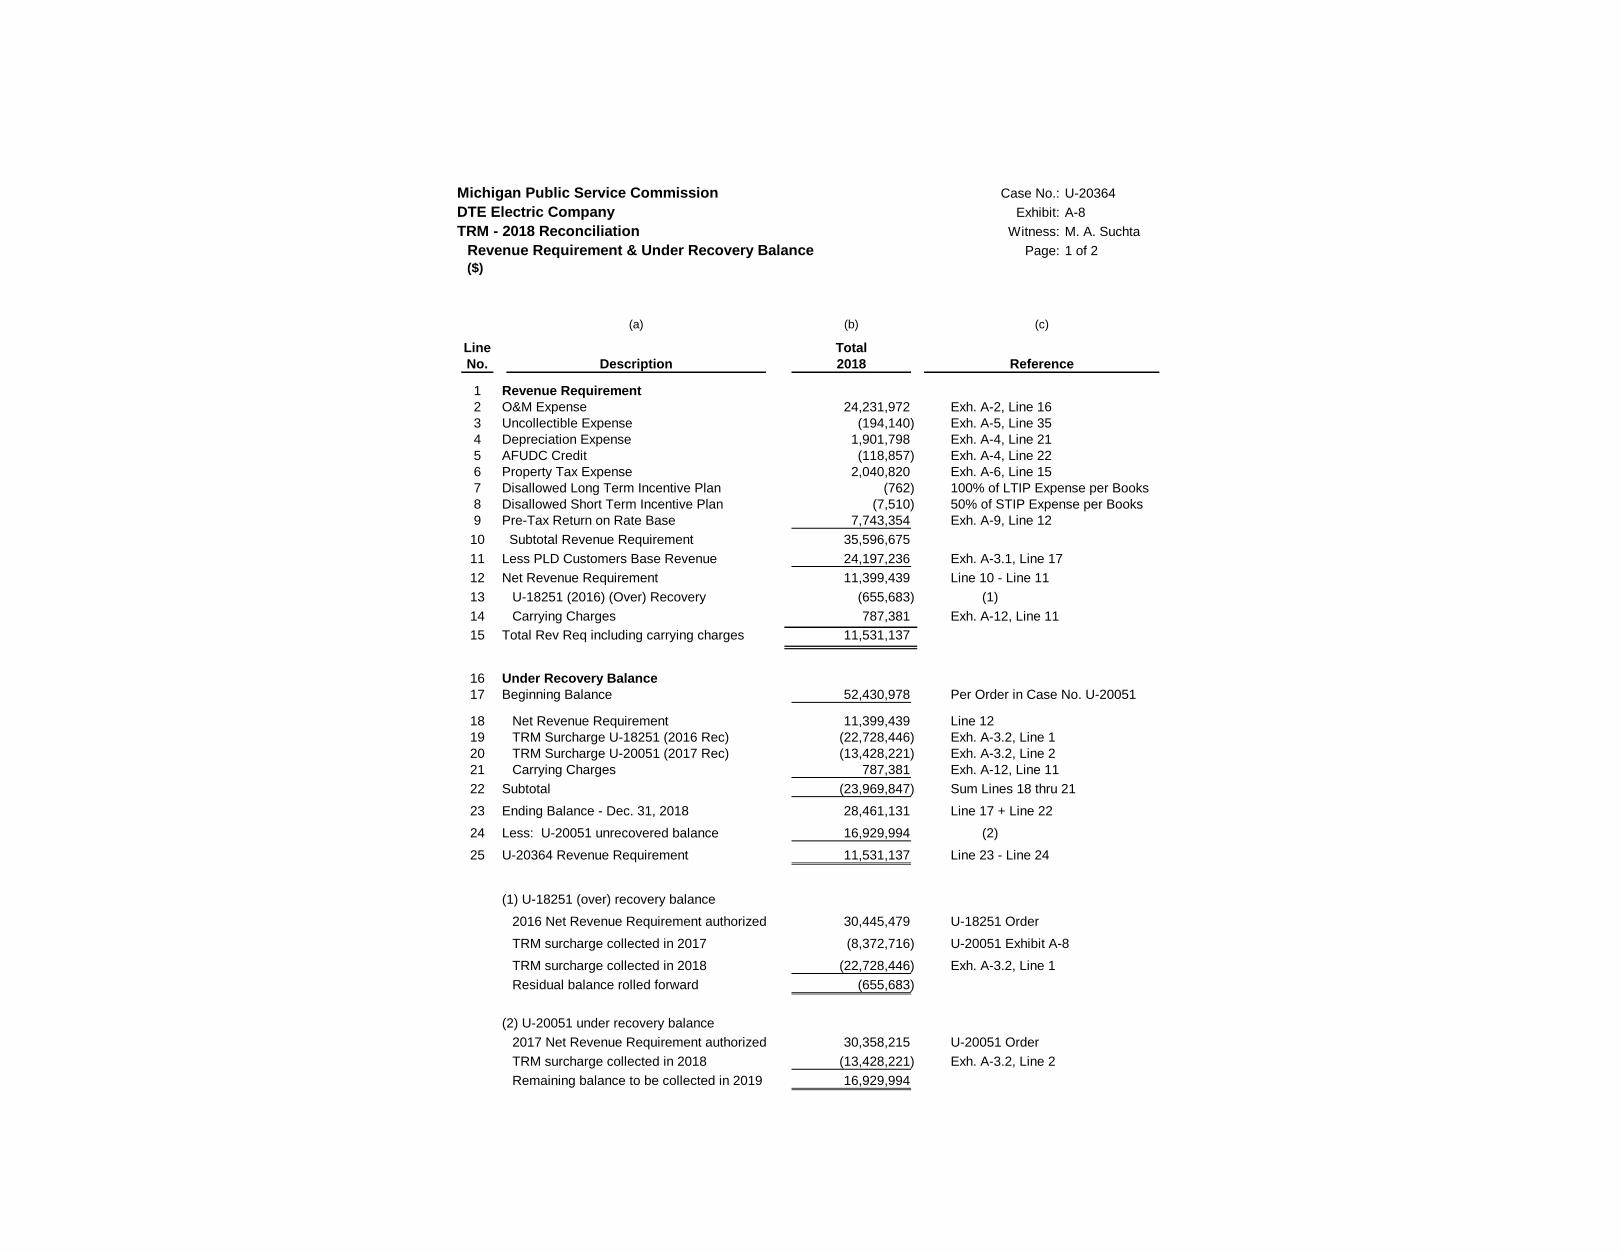
DTE Electric Company Exhibit: A-8
TRM - 2018 Reconciliation Witness: M. A. Suchta
Revenue Requirement & Under Recovery Balance Page: 1 of 2
($)
(a) (b) (c)
Line Total
No. Description 2018 Reference
1 Revenue Requirement
2 O&M Expense 24,231,972 Exh. A-2, Line 16
3 Uncollectible Expense (194,140) Exh. A-5, Line 35
4 Depreciation Expense 1,901,798 Exh. A-4, Line 21
5 AFUDC Credit (118,857) Exh. A-4, Line 22
6 Property Tax Expense 2,040,820 Exh. A-6, Line 15
7 Disallowed Long Term Incentive Plan (762) 100% of LTIP Expense per Books
8 Disallowed Short Term Incentive Plan (7,510) 50% of STIP Expense per Books
9 Pre-Tax Return on Rate Base 7,743,354 Exh. A-9, Line 12
10 Subtotal Revenue Requirement 35,596,675
11 Less PLD Customers Base Revenue 24,197,236 Exh. A-3.1, Line 17
12 Net Revenue Requirement 11,399,439 Line 10 - Line 11
13 U-18251 (2016) (Over) Recovery (655,683) (1)
14 Carrying Charges 787,381 Exh. A-12, Line 11
15 Total Rev Req including carrying charges 11,531,137
16 Under Recovery Balance
17 Beginning Balance 52,430,978 Per Order in Case No. U-20051
18 Net Revenue Requirement 11,399,439 Line 12
19 TRM Surcharge U-18251 (2016 Rec) (22,728,446) Exh. A-3.2, Line 1
20 TRM Surcharge U-20051 (2017 Rec) (13,428,221) Exh. A-3.2, Line 2
21 Carrying Charges 787,381 Exh. A-12, Line 11
22 Subtotal (23,969,847) Sum Lines 18 thru 21
23 Ending Balance - Dec. 31, 2018 28,461,131 Line 17 + Line 22
24 Less: U-20051 unrecovered balance 16,929,994 (2)
25 U-20364 Revenue Requirement 11,531,137 Line 23 - Line 24
(1) U-18251 (over) recovery balance
2016 Net Revenue Requirement authorized 30,445,479 U-18251 Order
TRM surcharge collected in 2017 (8,372,716) U-20051 Exhibit A-8
TRM surcharge collected in 2018 (22,728,446) Exh. A-3.2, Line 1
Residual balance rolled forward (655,683)
(2) U-20051 under recovery balance
2017 Net Revenue Requirement authorized 30,358,215 U-20051 Order
TRM surcharge collected in 2018 (13,428,221) Exh. A-3.2, Line 2
Remaining balance to be collected in 2019 16,929,994

Michigan Public Service Commission Case No.: U-20364
DTE Electric Company Exhibit: A-8
TRM - 2018 Reconciliation Witness: M. A. Suchta
Revenue Requirement & Under Recovery Balance Page: 2 of 2
($)
2018 Monthly Amounts
(a) (b) (c) (d) (e) (f) (g) (h) (i) (j) (k) (l) (m) (n)
Line
No. Description Jan-18 Feb-18 Mar-18 Apr-18 May-18 Jun-18 Jul-18 Aug-18 Sep-18 Oct-18 Nov-18 Dec-18 Total 2018
1 Revenue Requirement
2 O&M Expense 2,494,651 1,328,155 1,924,522 2,460,321 2,211,516 1,782,632 1,806,792 1,860,725 2,453,114 1,828,318 2,014,452 2,066,773 24,231,972
3 Uncollectible Expense (221,375) 42,093 (219,069) 55,197 (197,969) 84,223 419,334 421,698 (1,108,562) 293,639 188,572 48,078 (194,140)
4 Depreciation Expense 91,788 91,788 91,776 91,763 110,994 111,461 110,599 113,472 113,542 109,363 111,583 753,671 1,901,798
5 AFUDC Credit (29,692) (4,218) (4,223) (4,061) (3,929) (3,951) (3,982) (4,029) (11,463) (13,866) (16,863) (18,580) (118,857)
6 Property Tax Expense 170,068 170,068 170,068 170,068 170,068 170,068 170,068 170,068 170,068 170,068 170,068 170,068 2,040,820
7 Disallowed Long Term Incentive Plan (158) (204) (114) (242) (44) - - - - - - - (762)
8 Disallowed Short Term Incentive Plan (734) (645) (553) (649) (509) (540) (499) (620) (846) (526) (989) (399) (7,510)
9 Pre-Tax Return on Rate Base 547,457 560,764 577,826 605,083 622,094 638,138 657,976 677,345 691,160 703,697 718,792 743,020 7,743,354
10 Subtotal Revenue Requirement 3,052,006 2,187,800 2,540,233 3,377,480 2,912,222 2,782,031 3,160,289 3,238,659 2,307,013 3,090,694 3,185,615 3,762,632 35,596,675
11 Less PLD Customers Base Revenue 2,136,933 2,084,092 2,601,317 1,270,956 2,007,019 2,031,038 2,339,071 2,978,184 962,238 1,929,142 2,198,972 1,658,273 24,197,236
12 Net Revenue Requirement 915,073 103,708 (61,084) 2,106,524 905,203 750,993 821,218 260,475 1,344,775 1,161,551 986,644 2,104,359 11,399,439
13
14
15
16 Under Recovery Balance
17 Beginning Balance 52,430,978 47,554,852 42,561,855 37,596,217 34,667,323 34,055,528 34,822,733 35,735,558 36,064,193 37,463,910 35,119,736 31,142,055 52,430,978
18 Net Revenue Requirement 915,073 103,708 (61,084) 2,106,524 905,203 750,993 821,218 260,475 1,344,775 1,161,551 986,644 2,104,359 11,399,439
19 TRM Surcharge U-18251 (2016 Rec) (5,861,939) (5,161,527) (4,970,219) (5,101,702) (1,577,638) (47,475) 27,698 4,647 (10,899) (7,423) (13,732) (8,236) (22,728,446)
20 TRM Surcharge U-20051 (2017 Rec) - - - - - - - - (733) (3,568,906) (5,016,039) (4,842,543) (13,428,221)
21 Carrying Charges 70,740 64,822 65,664 66,284 60,641 63,687 63,910 63,512 66,574 70,604 65,446 65,496 787,381
22 Subtotal (4,876,125) (4,992,997) (4,965,638) (2,928,894) (611,794) 767,204 912,825 328,635 1,399,717 (2,344,173) (3,977,682) (2,680,924) (23,969,847)
23 Ending Balance - Dec. 31, 2018 47,554,852 42,561,855 37,596,217 34,667,323 34,055,528 34,822,733 35,735,558 36,064,193 37,463,910 35,119,736 31,142,055 28,461,131 28,461,131
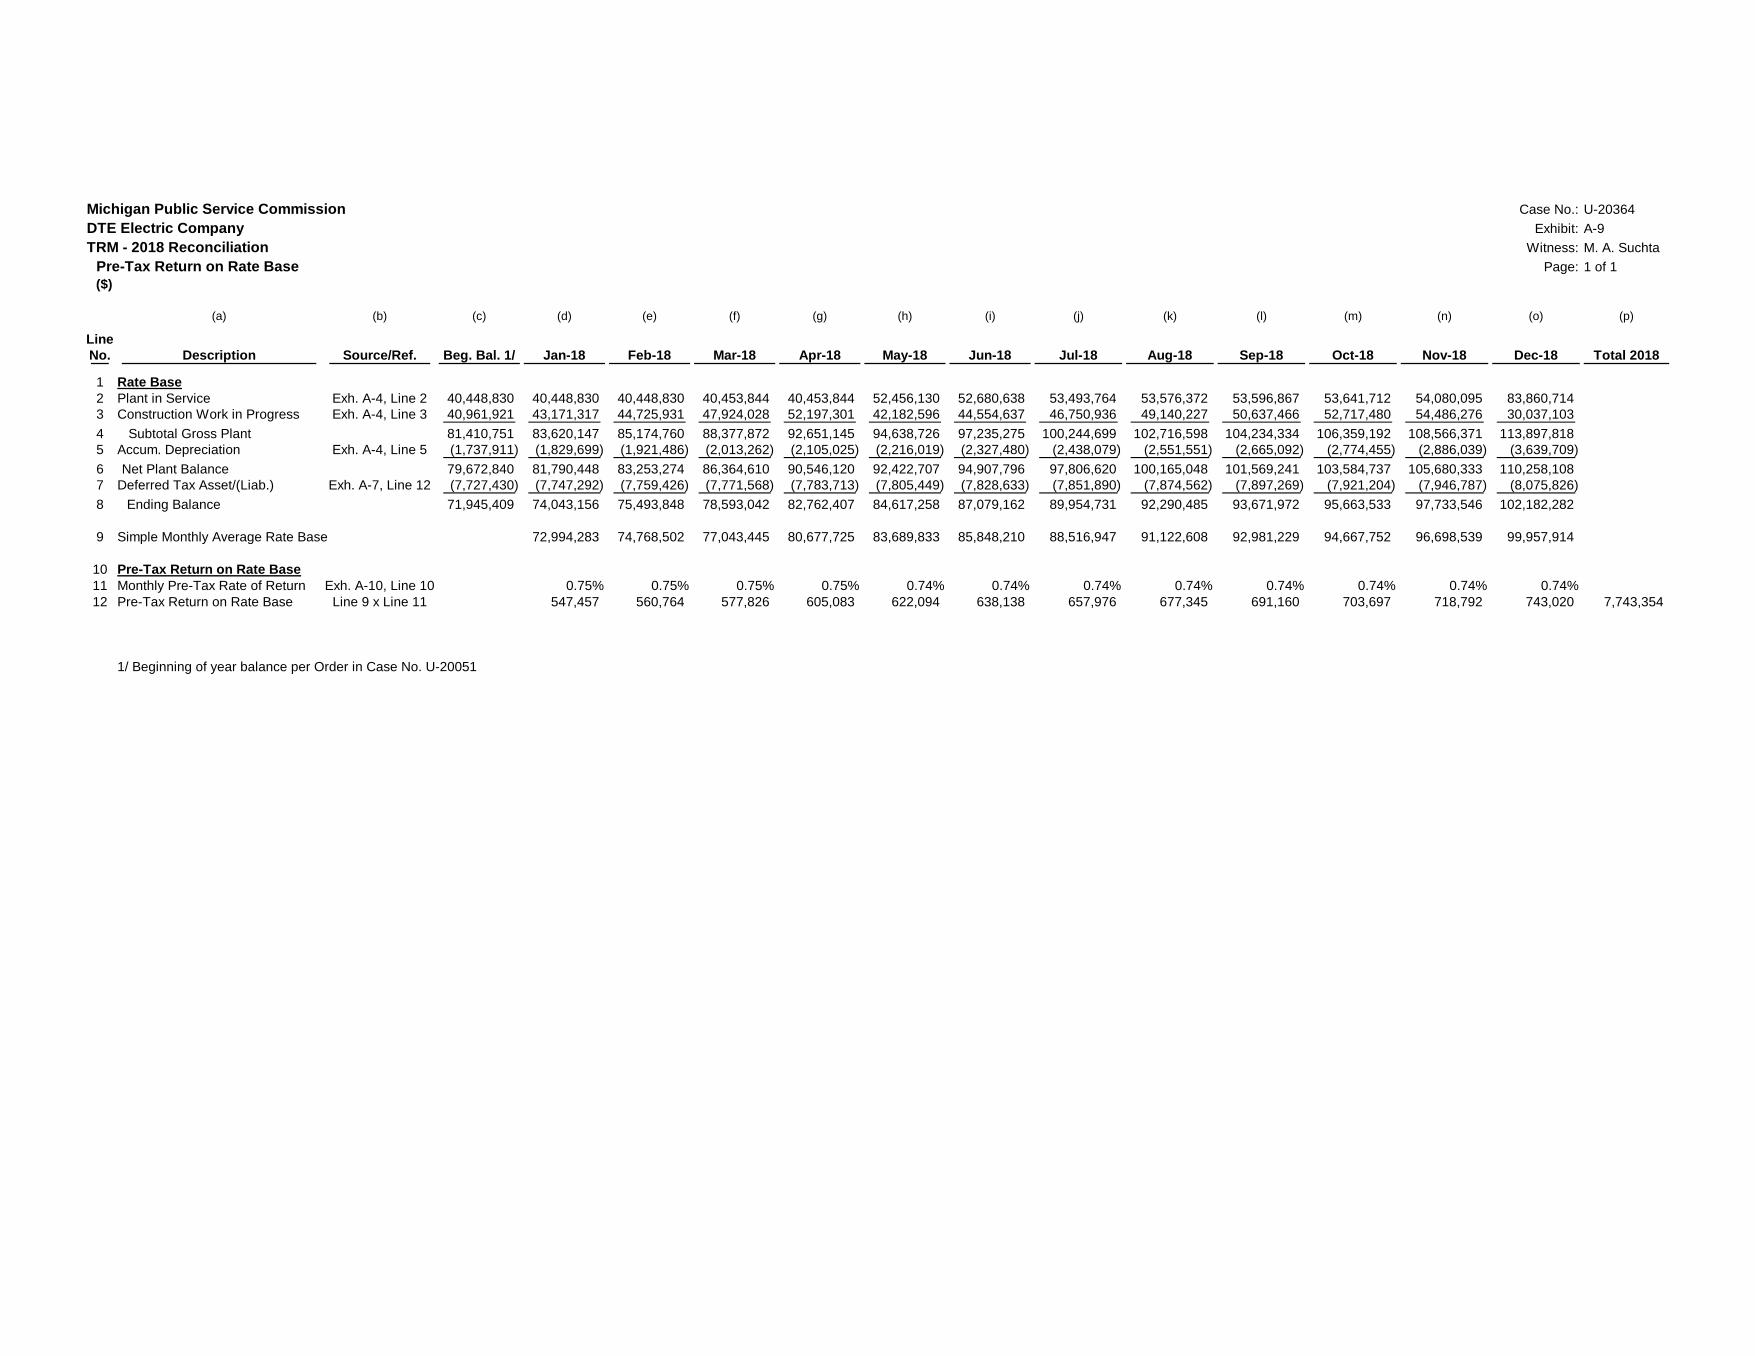
Michigan Public Service Commission Case No.: U-20364
DTE Electric Company Exhibit: A-9
TRM - 2018 Reconciliation Witness: M. A. Suchta
Pre-Tax Return on Rate Base Page: 1 of 1
($)
(a) (b) (c) (d) (e) (f) (g) (h) (i) (j) (k) (l) (m) (n) (o) (p)
Line
No. Description Source/Ref. Beg. Bal. 1/ Jan-18 Feb-18 Mar-18 Apr-18 May-18 Jun-18 Jul-18 Aug-18 Sep-18 Oct-18 Nov-18 Dec-18 Total 2018
1 Rate Base
2 Plant in Service Exh. A-4, Line 2 40,448,830 40,448,830 40,448,830 40,453,844 40,453,844 52,456,130 52,680,638 53,493,764 53,576,372 53,596,867 53,641,712 54,080,095 83,860,714
3 Construction Work in Progress Exh. A-4, Line 3 40,961,921 43,171,317 44,725,931 47,924,028 52,197,301 42,182,596 44,554,637 46,750,936 49,140,227 50,637,466 52,717,480 54,486,276 30,037,103
4 Subtotal Gross Plant 81,410,751 83,620,147 85,174,760 88,377,872 92,651,145 94,638,726 97,235,275 100,244,699 102,716,598 104,234,334 106,359,192 108,566,371 113,897,818
5 Accum. Depreciation Exh. A-4, Line 5 (1,737,911) (1,829,699) (1,921,486) (2,013,262) (2,105,025) (2,216,019) (2,327,480) (2,438,079) (2,551,551) (2,665,092) (2,774,455) (2,886,039) (3,639,709)
6 Net Plant Balance 79,672,840 81,790,448 83,253,274 86,364,610 90,546,120 92,422,707 94,907,796 97,806,620 100,165,048 101,569,241 103,584,737 105,680,333 110,258,108
7 Deferred Tax Asset/(Liab.) Exh. A-7, Line 12 (7,727,430) (7,747,292) (7,759,426) (7,771,568) (7,783,713) (7,805,449) (7,828,633) (7,851,890) (7,874,562) (7,897,269) (7,921,204) (7,946,787) (8,075,826)
8 Ending Balance 71,945,409 74,043,156 75,493,848 78,593,042 82,762,407 84,617,258 87,079,162 89,954,731 92,290,485 93,671,972 95,663,533 97,733,546 102,182,282
9 Simple Monthly Average Rate Base 72,994,283 74,768,502 77,043,445 80,677,725 83,689,833 85,848,210 88,516,947 91,122,608 92,981,229 94,667,752 96,698,539 99,957,914
10 Pre-Tax Return on Rate Base
11 Monthly Pre-Tax Rate of Return Exh. A-10, Line 10 0.75% 0.75% 0.75% 0.75% 0.74% 0.74% 0.74% 0.74% 0.74% 0.74% 0.74% 0.74%
12 Pre-Tax Return on Rate Base Line 9 x Line 11 547,457 560,764 577,826 605,083 622,094 638,138 657,976 677,345 691,160 703,697 718,792 743,020 7,743,354
1/ Beginning of year balance per Order in Case No. U-20051

Michigan Public Service Commission Case No.: U-20364
DTE Electric Company Exhibit: A-10
TRM - 2018 Reconciliation Witness: M. A. Suchta
Pre-Tax Rate of Return Page: 1 of 1
(a) (b) (c) (d) (e) (f) (g) (h) (i) (j) (k) (l) (m) (n)
Line
No. Description Source/Ref. Jan-18 Feb-18 Mar-18 Apr-18 May-18 Jun-18 Jul-18 Aug-18 Sep-18 Oct-18 Nov-18 Dec-18
1 Debt Ratio (1) 50.00% 50.00% 50.00% 50.00% 50.00% 50.00% 50.00% 50.00% 50.00% 50.00% 50.00% 50.00%
2 Actual Debt Cost (2) 4.37% 4.37% 4.37% 4.37% 4.35% 4.35% 4.35% 4.35% 4.35% 4.35% 4.35% 4.35%
3 Revenue Conversion Exh. A-11, Col. (c), Line 8 1.0000 1.0000 1.0000 1.0000 1.0000 1.0000 1.0000 1.0000 1.0000 1.0000 1.0000 1.0000
4 Debt Component L1 x L2 x L3 2.18% 2.18% 2.18% 2.18% 2.17% 2.17% 2.17% 2.17% 2.17% 2.17% 2.17% 2.17%
5 Equity Ratio (1) 50.00% 50.00% 50.00% 50.00% 50.00% 50.00% 50.00% 50.00% 50.00% 50.00% 50.00% 50.00%
6 Authorized Return on Equity (1) 10.10% 10.10% 10.10% 10.10% 10.00% 10.00% 10.00% 10.00% 10.00% 10.00% 10.00% 10.00%
7 Revenue Conversion Exh. A-11, Col. (d), Line 8 1.3496 1.3496 1.3496 1.3496 1.3496 1.3496 1.3496 1.3496 1.3496 1.3496 1.3496 1.3496
8 Equity Component L5 x L6 x L7 6.82% 6.82% 6.82% 6.82% 6.75% 6.75% 6.75% 6.75% 6.75% 6.75% 6.75% 6.75%
9 Annual Pre-Tax ROR Line 4 + Line 8 9.00% 9.00% 9.00% 9.00% 8.92% 8.92% 8.92% 8.92% 8.92% 8.92% 8.92% 8.92%
10 Monthly Pre-Tax ROR Line 9 ÷ 12 Months 0.75% 0.75% 0.75% 0.75% 0.74% 0.74% 0.74% 0.74% 0.74% 0.74% 0.74% 0.74%
Source
(1) Commission Order in DTE Electric's General Rate Case No. U-18014 effective February 7, 2017
Commission Order in DTE Electric's General Rate Case No. U-18255 effective May 1, 2018
(2) Provided by DTE Energy Treasury Department

Michigan Public Service Commission Case No.: U-20364
DTE Electric Company Exhibit: A-11
TRM - 2018 Reconciliation Witness: M. A. Suchta
Revenue Conversion Factors Page: 1 of 1
(a) (b) (c) (d)
Debt Equity
Line Conversion Conversion
No. Description Source Percent Percent
1 Base 100.0% 100.00%
2 Michigan Corporate Income Tax (1) 5.88%
3 Municipal Tax Rate (1) 0.33%
4 FIT Base L1 - L2 - L3 100.0% 93.79%
5 FIT Rate (1) 21.00%
6 FIT Tax L4 x L5 0.0% 19.70%
7 Income L4 - L6 100.0% 74.09%
8 Revenue Conversion Factors L1 ÷ L7 1.0000 1.3496
Weighted Composite Federal, State,
9 and Local Tax Rate L1 - L7 25.9%
(1) Provided by DTE Energy Tax Department

Michigan Public Service Commission Case No.: U-20364
DTE Electric Company Exhibit: A-12
TRM - 2018 Reconciliation Witness: M. A. Suchta
Carrying Cost Calculation Page: 1 of 1
($)
(a) (b) (c) (d) (e) (f) (g) (h) (i) (j) (k) (l) (m) (n) (o)
Line
No. Description Source/Ref. Jan-18 Feb-18 Mar-18 Apr-18 May-18 Jun-18 Jul-18 Aug-18 Sep-18 Oct-18 Nov-18 Dec-18 Total 2018
1 TRM Regulatory Asset Balance
2 Beginning Balance Prior Bal. (1) 52,430,978 47,484,112 42,426,293 37,394,990 34,399,812 33,727,377 34,430,894 35,279,810 35,544,933 36,878,076 34,463,298 30,420,170
3 Regulatory Asset Deferral Exh. A-8, Line 18 915,073 103,708 (61,084) 2,106,524 905,203 750,993 821,218 260,475 1,344,775 1,161,551 986,644 2,104,359
4 TRM Surcharge U-18251 (2016 Rec) Exh. A-8, Line 19 (5,861,939) (5,161,527) (4,970,219) (5,101,702) (1,577,638) (47,475) 27,698 4,647 (10,899) (7,423) (13,732) (8,236)
5 TRM Surcharge U-20051 (2017 Rec) Exh. A-8, Line 20 - - - - - - - - (733) (3,568,906) (5,016,039) (4,842,543)
6 Ending Balance excl. Carrying Costs 47,484,112 42,426,293 37,394,990 34,399,812 33,727,377 34,430,894 35,279,810 35,544,933 36,878,076 34,463,298 30,420,170 27,673,750
7 Carrying Costs (compound annually) 787,381
8 Ending Balance 28,461,131
9 Simple Monthly Average 49,957,545 44,955,202 39,910,641 35,897,401 34,063,595 34,079,136 34,855,352 35,412,372 36,211,504 35,670,687 32,441,734 29,046,960
10 Short Term Debt Rate (Annual) (2) 1.6992% 1.7303% 1.9743% 2.2158% 2.1363% 2.2425% 2.2003% 2.1522% 2.2062% 2.3752% 2.4208% 2.7058%
11 Carrying Cost Interest Revenue Line 9 x (Line 10÷12) 70,740 64,822 65,664 66,284 60,641 63,687 63,910 63,512 66,574 70,604 65,446 65,496 787,381
Source
(1) Beginning balance at January 1 per Order in Case No. U-20051
(2) Provided by DTE Energy Treasury Department

Michigan Public Service Commission Case No.: U-20364
DTE Electric Company Exhibit: A-13
TRM - 2018 Reconciliation Witness: K. A. Holmes
Transitional Tariff Credit Page: 1 of 1
(a) (b) (c) (d) (e) (f) (g) (h) (i) (j) (k) (l) (m) (n)
Line
No. Description Jan-18 Feb-18 Mar-18 Apr-18 May-18 Jun-18 Jul-18 Aug-18 Sep-18 Oct-18 Nov-18 Dec-18 Total 2018
Standard Tariff Billing Components (1)
1 Power Supply Energy Charge 158,255$ 355,404$ 121,463$ 130,092$ 147,937$ 135,360$ 184,456$ 198,337$ 136,764$ 133,256$ 121,760$ 124,437$ 1,947,520$
2 Service Charge 11 11 275 275 275 275 275 275 275 275 275 275 2,773
3 Distribution Charge 80,119 179,928 15,824 16,478 20,232 19,261 21,636 22,416 21,227 21,227 21,227 21,227 460,802
4 Base Revenue 238,384$ 535,343$ 137,562$ 146,845$ 168,444$ 154,896$ 206,367$ 221,029$ 158,266$ 154,758$ 143,262$ 145,939$ 2,411,094$
5 Transitional Tariff Credit Percentage (2) 6.4% 6.4% 6.4% 6.4% 6.4% 6.4% 6.4% 1.7% 1.7% 1.7% 1.7% 1.7%
6 Transitional Tariff Credit (15,257)$ (34,262)$ (8,804)$ (9,398)$ (10,780)$ (9,913)$ (13,207)$ (3,757)$ (2,691)$ (2,631)$ (2,435)$ (2,481)$ (115,617)$
(1) Customer took service under the D3 General Service tariff (Jan & Feb) and switched to D11 Primary Supply Rate for remainder of 2018.
All billing components are priced accordingly, and Transitional Tariff Credit is applied to the base revenue (excluding all surcharges and the PSCR factor).
(2) Customer qualified for Tier 3 under the Company's approved Transitional Tariff. Percentage applicable for 4th year (July 2017 - June 2018 billing cycles) of System Conversion Period is 6.4%.
Percentage applicable for 5th year of billing (beginning with the July 2018 billing cycle ) is 1.7%.
Due to financial reporting cutoff dates, the sales and revenue for a given billing cycle are reported as billed in the following month.
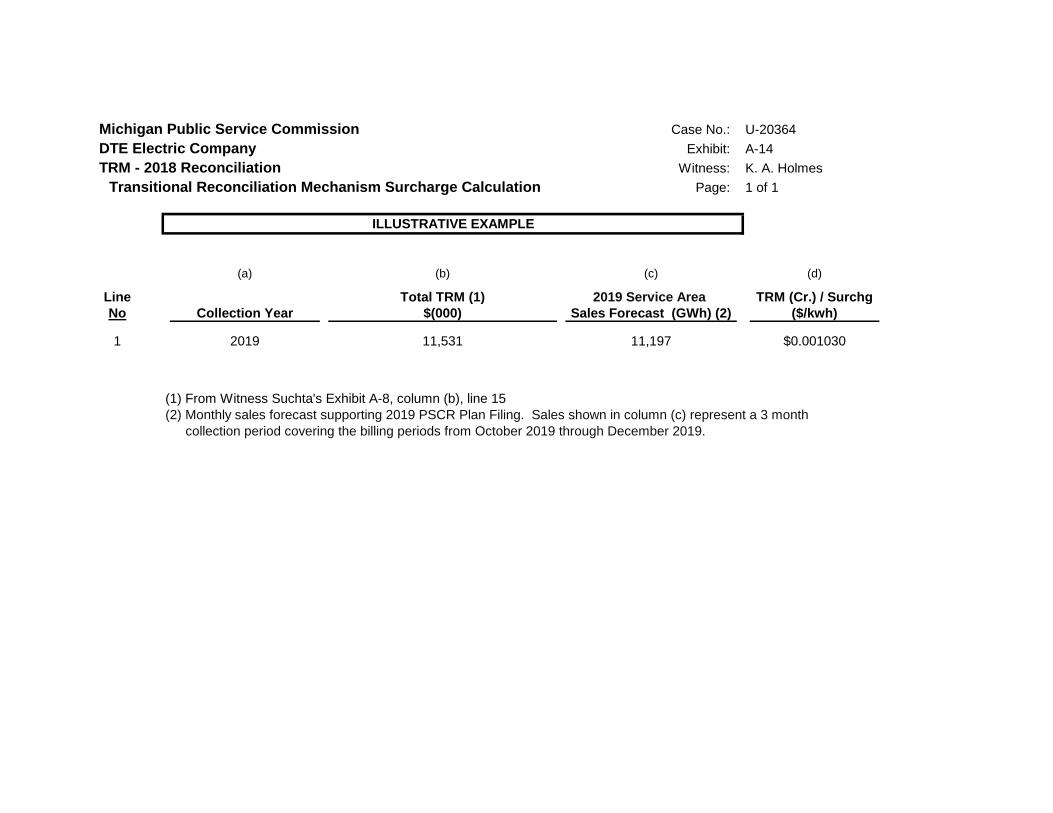
Michigan Public Service Commission Case No.: U-20364
DTE Electric Company Exhibit: A-14
TRM - 2018 Reconciliation Witness: K. A. Holmes
Transitional Reconciliation Mechanism Surcharge Calculation Page: 1 of 1
(a) (b) (c) (d)
Line Total TRM (1) 2019 Service Area TRM (Cr.) / Surchg
No Collection Year $(000) Sales Forecast (GWh) (2) ($/kwh)
1 2019 11,531 11,197 $0.001030
(1) From Witness Suchta's Exhibit A-8, column (b), line 15
(2) Monthly sales forecast supporting 2019 PSCR Plan Filing. Sales shown in column (c) represent a 3 month
collection period covering the billing periods from October 2019 through December 2019.
ILLUSTRATIVE EXAMPLE
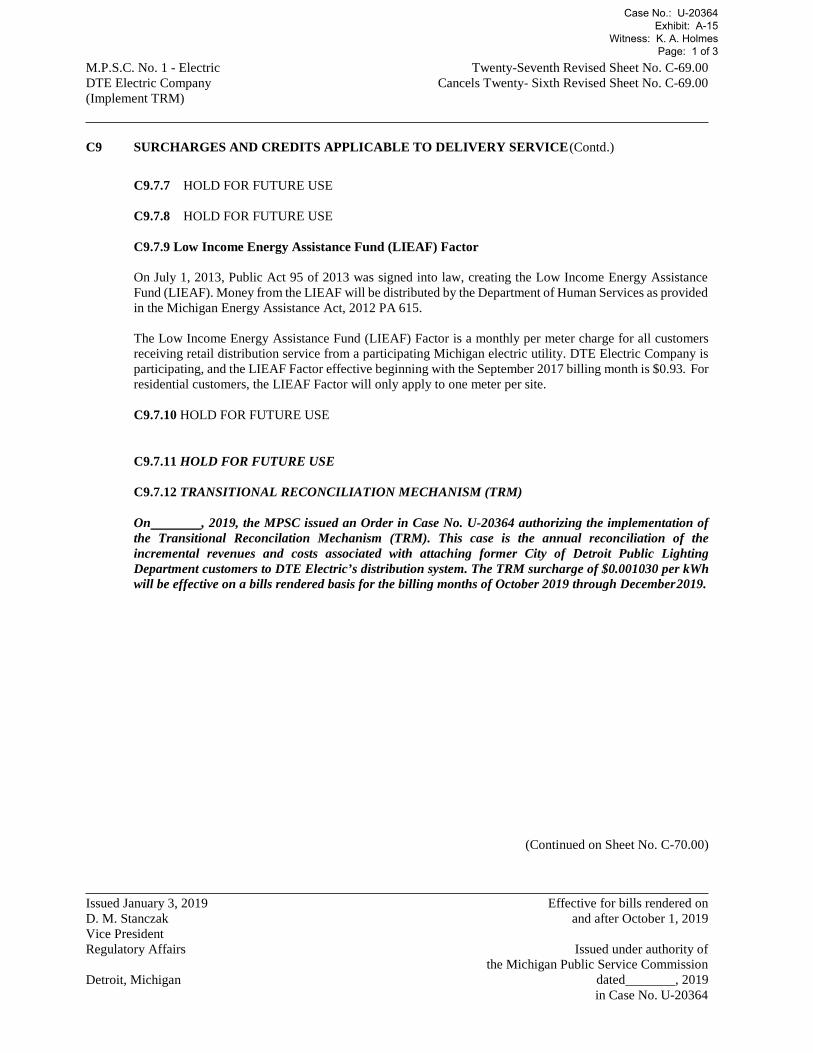
M.P.S.C. No. 1 - ElectricDTE Electric Company(Implement TRM)
Twenty-Seventh Revised Sheet No. C-69.00 Cancels Twenty- Sixth Revised Sheet No. C-69.00
Issued January 3, 2019 D. M. StanczakVice PresidentRegulatory Affairs
Effective for bills rendered on and after October 1, 2019
Issued under authority of the Michigan Public Service Commission
dated , 2019 in Case No. U-20364
Detroit, Michigan
C9 SURCHARGES AND CREDITS APPLICABLE TO DELIVERY SERVICE (Contd.)
C9.7.7 HOLD FOR FUTURE USE
C9.7.8 HOLD FOR FUTURE USE
C9.7.9 Low Income Energy Assistance Fund (LIEAF) Factor
On July 1, 2013, Public Act 95 of 2013 was signed into law, creating the Low Income Energy Assistance Fund (LIEAF). Money from the LIEAF will be distributed by the Department of Human Services as provided in the Michigan Energy Assistance Act, 2012 PA 615.
The Low Income Energy Assistance Fund (LIEAF) Factor is a monthly per meter charge for all customers receiving retail distribution service from a participating Michigan electric utility. DTE Electric Company is participating, and the LIEAF Factor effective beginning with the September 2017 billing month is $0.93. For residential customers, the LIEAF Factor will only apply to one meter per site.
C9.7.10 HOLD FOR FUTURE USE
C9.7.11 HOLD FOR FUTURE USE
C9.7.12 TRANSITIONAL RECONCILIATION MECHANISM (TRM)
On , 2019, the MPSC issued an Order in Case No. U-20364 authorizing the implementation of the Transitional Reconcilation Mechanism (TRM). This case is the annual reconciliation of the incremental revenues and costs associated with attaching former City of Detroit Public Lighting Department customers to DTE Electric’s distribution system. The TRM surcharge of $0.001030 per kWh will be effective on a bills rendered basis for the billing months of October 2019 through December 2019.
(Continued on Sheet No. C-70.00)
Case No.: U-20364 Exhibit: A-15
Witness: K. A. Holmes Page: 1 of 3

M.P.S.C. No. 1 - ElectricDTE Electric Company(Implement TRM)
Forty-Fifth Revised Sheet No. C-70.00 Cancels Forty- Fourth Revised Sheet No. C-70.00
Issued January 4, 2019 D. M. StanczakVice PresidentRegulatory Affairs
Effective for bills rendered on and after October 1, 2019
Issued under authority of the Michigan Public Service Commission
dated , 2019 in Case No. U-20364
Detroit, Michigan
(Continued from Sheet No. C-69.00)
C9 SURCHARGES AND CREDITS APPLICABLE TO DELIVERY SERVICE: (Contd.)
C9.8 Summary of Surcharges and Credits: Summary of surcharges and credits, pursuant to sub-rules C9.1, C9.2, C9.6, C9.7.9, C9.7.10, C9.7.11, C9.7.12 and C9.7.13. Cents per kilowatthour or percent of base bill, unless otherwise noted.
NS ¢/kWh
EWRS ¢/kWh
TRM ¢/kWh
Total Delivery Surcharges
¢/kWh
LIEAF Factor $/Billing Meter
Residential D1 Residential 0.0765 0.4487 0.1030 0.6282¢ $0.93 D1.1 Int. Space Conditioning 0.0765 0.4487 0.1030 0.6282¢ N/A D1.2 Time of Day 0.0765 0.4487 0.1030 0.6282 $0.93 D1.6 Special Low Income Pilot 0.0765 0.4487 0.1030 0.6282¢ $0.93 D1.7 Geothermal Time-of-Day 0.0765 0.4487 0.1030 0.6282¢ N/A D1.8 Dynamic Peak Pricing 0.0765 0.4487 0.1030 0.6282¢ $0.93 D1.9 Electric Vehicle 0.0765 0.4487 0.1030 0.6282¢ N/A D2 Space Heating 0.0765 0.4487 0.1030 0.6282¢ $0.93 D5 Wtr Htg 0.0765 0.4487 0.1030 0.6282¢ N/A D9 Outdoor Lighting 0.0765 0.4487 0.1030 0.6282¢ N/A
Commercial D1.1 Int. Space Conditioning 0.0765 See C9.6 0.1030 $0.93 D1.7 Geothermal Time –of- day 0.0765 See C9.6 0.1030 $0.93 D1.8 Dynamic Peak Pricing D1.9 Electric Vehicle
0.0765 0.0765
See C9.6 See C9.6
0.1030 0.1030
$0.93 $0.93
D3 General Service 0.0765 See C9.6 0.1030 $0.93 D3.1 Unmetered 0.0765 See C9.6 0.1030 N/A D3.2 Educ. Inst. 0.0765 See C9.6 0.1030 $0.93 D3.3 Interruptible 0.0765 See C9.6 0.1030 $0.93 D4 Large General Service 0.0765 See C9.6 0.1030 $0.93 D5 Wtr Htg 0.0765 See C9.6 0.1030 $0.93 D9 Outdoor Lighting 0.0765 See C9.6 0.1030 N/A R3 Standby Secondary 0.0765 See C9.6 0.1030 $0.93 R7 Greenhouse Lighting 0.0765 See C9.6 0.1030 $0.93 R8 Space Conditioning 0.0765 See C9.6 0.1030 $0.93
Industrial D6.2 Educ. Inst. 0.0765 See C9.6 0.1030 $0.93 D8 Interruptible Primary 0.0765 See C9.6 0.1030 $0.93 D10 Schools 0.0765 See C9.6 0.1030 $0.93 D11 Primary Supply 0.0765 See C9.6 0.1030 $0.93 R1.1 Metal Melting 0.0765 See C9.6 0.1030 $0.93 R1.2 Electric Process Heating 0.0765 See C9.6 0.1030 $0.93 R3 Standby Primary 0.0765 See C9.6 0.1030 $0.93 R10 Interruptible Supply 0.0765 See C9.6 0.1030 $0.93
(Continued on Sheet No. C-71.00)
Case No.: U-20364 Exhibit: A-15
Witness: K. A. Holmes Page: 2 of 3

M.P.S.C. No. 1 - ElectricDTE Electric Company(Implement TRM)
Forty-Fifth Revised Sheet No. C-70.00 Cancels Forty- Fourth Revised Sheet No. C-70.00
Issued January 4, 2019 D. M. StanczakVice PresidentRegulatory Affairs
Effective for bills rendered on and after October 1, 2019
Issued under authority of the Michigan Public Service Commission
dated , 2019 in Case No. U-20364
Detroit, Michigan
(Continued from Sheet No. C-70.00)
C9 SURCHARGES AND CREDITS APPLICABLE TO DELIVERY SERVICE: (Contd.)
C9.8 Summary of Surcharges and Credits (Contd.):
NS ¢/kWh
EWRS ¢/kWh
TRM ¢/kWh
LIEAF Factor $/Billing Meter
Governmental
E1 Streetlighting Option I 0.0765 See C9.6 0.1030 N/A E1 Streetlighting Option II & III 0.0765 See C9.6 0.1030 N/A
E1.1 Energy Only 0.0765 See C9.6 0.1030 $0.93
E2 Traffic Lights 0.0765 See C9.6 0.1030 N/A
Electric Choice
EC2 Secondary
EC2 D1.1 Int. Space Conditioning 0.0765 See C9.6 0.1030 $0.93
EC2 D1.7 Geothermal Time of Day 0.0765 See C9.6 0.1030 $0.93
EC2 D1.9 Electric Vehicle 0.0765 See C9.6 0.1030 $0.93
EC2 D3 General Service 0.0765 See C9.6 0.1030 $0.93
EC2 D3.2 Educ. Inst. 0.0765 See C9.6 0.1030 $0.93
EC2 D3.3 Interruptible 0.0765 See C9.6 0.1030 $0.93
EC2 D4 Large General Service 0.0765 See C9.6 0.1030 $0.93
EC2 D5 Wtr Htg 0.0765 See C9.6 0.1030 $0.93
EC2 R7 Greenhouse Ltg 0.0765 See C9.6 0.1030 $0.93
EC2 Space Conditioning 0.0765 See C9.6 0.1030 $0.93
EC2 Primary
EC2 D6.2 Educ. Inst. 0.0765 See C9.6 0.1030 $0.93
EC2 D8 Interruptible Primary 0.0765 See C9.6 0.1030 $0.93
EC2 D10 Schools 0.0765 See C9.6 0.1030 $0.93
EC2 D11 Primary Supply 0.0765 See C9.6 0.1030 $0.93
EC2 R1.1 Metal Melting 0.0765 See C9.6 0.1030 $0.93
EC2 R1.2 Electric Process Htg 0.0765 See C9.6 0.1030 $0.93
EC2 R10 Interruptible Supply 0.0765 See C9.6 0.1030 $0.93
EC2 Residential 0.0765 0.4487 0.1030 $0.93
(Continued on Sheet No. C-72.00)
Case No.: U-20364 Exhibit: A-15
Witness: K. A. Holmes Page: 3 of 3