DTC Archive: data repositories in the fight against diffuse pollution Mark Hedges, Richard Gartner:...
28
DTC Archive: data repositories in the fight against diffuse pollution Mark Hedges, Richard Gartner: King’s College London Mike Haft, Hardy Schwamm: Freshwater Biological Association Open Repositories 2012, Edinburgh, Scotland/UK, 10 th July
-
Upload
ashley-west -
Category
Documents
-
view
214 -
download
0
Transcript of DTC Archive: data repositories in the fight against diffuse pollution Mark Hedges, Richard Gartner:...

DTC Archive: data repositories in the fight against diffuse pollution
Mark Hedges, Richard Gartner: King’s College London
Mike Haft, Hardy Schwamm: Freshwater Biological Association
Open Repositories 2012, Edinburgh, Scotland/UK, 10th July 2012

A message from our sponsors
• Collaboration between the Freshwater Biological Association and King’s College London (Centre for e-Research)
• Funded by DEFRA (Department for the Environment, Food and Rural Affairs)– A UK government ministry
• Runs from Jan. 2011 – Dec. 2014
Background: water quality and the DTC project
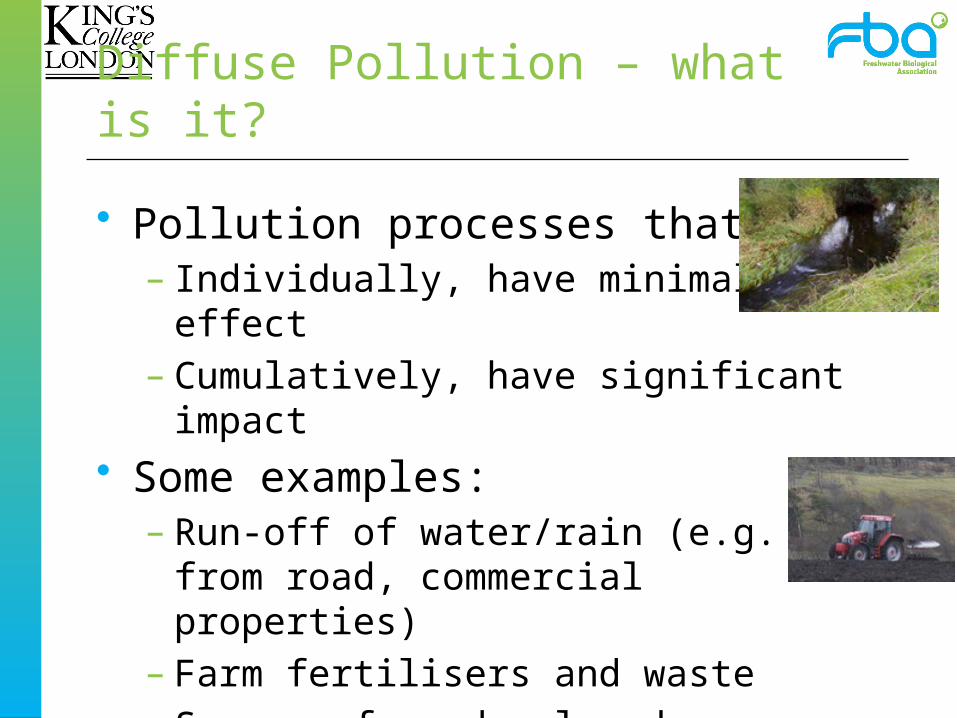
Diffuse Pollution – what is it?
• Pollution processes that:– Individually, have minimal effect– Cumulatively, have significant impact
• Some examples:– Run-off of water/rain (e.g. from road,
commercial properties)– Farm fertilisers and waste– Seepage from developed landscapes
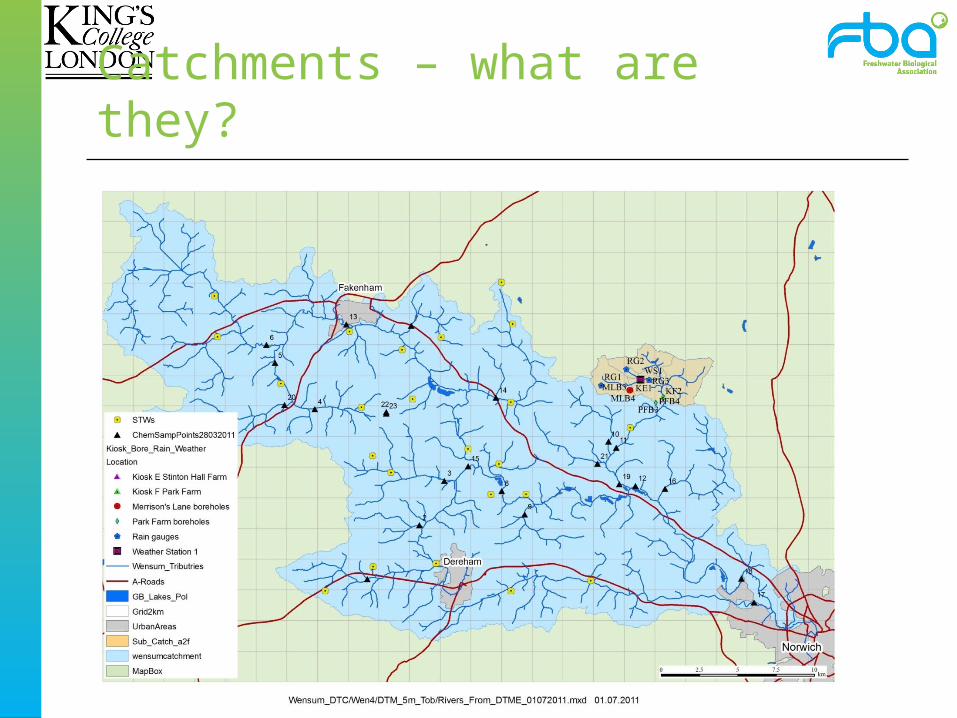
Catchments – what are they?
Water Framework Directive
• What is an EU Directive?– An EU Directive is a European Union legal instruction or
secondary European legislation which is binding on all Member States but which must be implemented through national legislation within a prescribed time-scale.
• Water Framework Directive concerns water quality
• Freshwater (rivers, lakes, groundwater,) adversely affected by diffuse pollution
• Failure to comply means problems!

DTC Project
• DTC = Demonstration Test Catchment • Investigate measures for reducing impact
of diffuse water pollution on ecosystems• Evaluate the extent to which on-farm
mitigation measures can reduce impact of water pollution on river ecology – cost-effectively– maintaining food production capacity
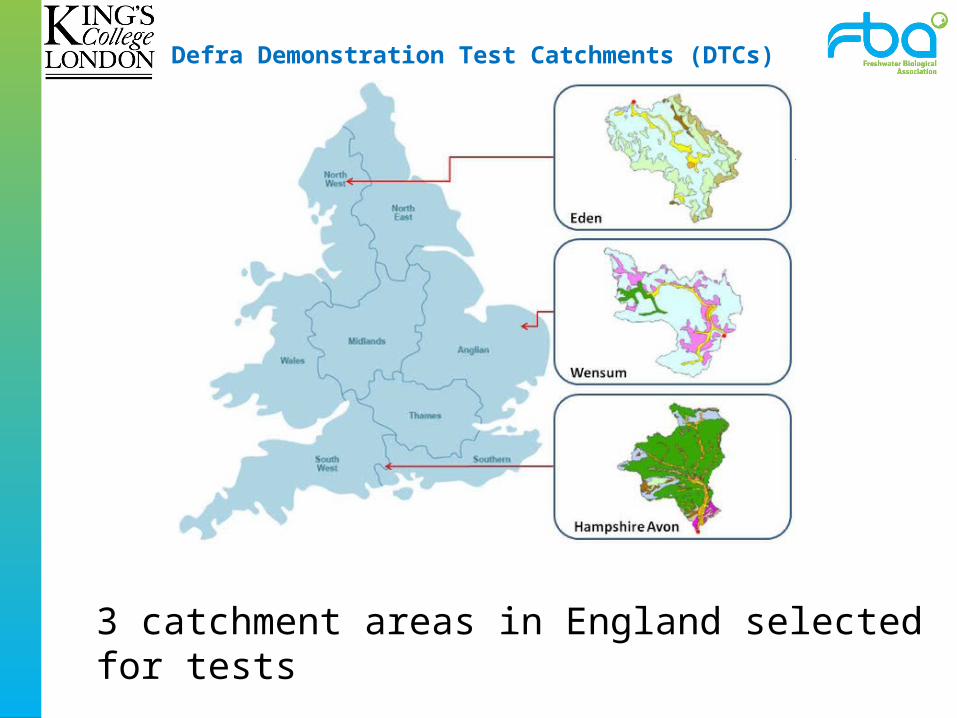
Defra Demonstration Test Catchments (DTCs)
3 catchment areas in England selected for tests

How does the DTC project work?
• The procedure is (roughly speaking):– Monitor various environmental markers– Try out mitigation measures– Analyse changes in baseline trends of markers in
response to these measures
• All this produces a great variety of data• The DTCs create data, the DTC Archive
project has to make it usable and useful!
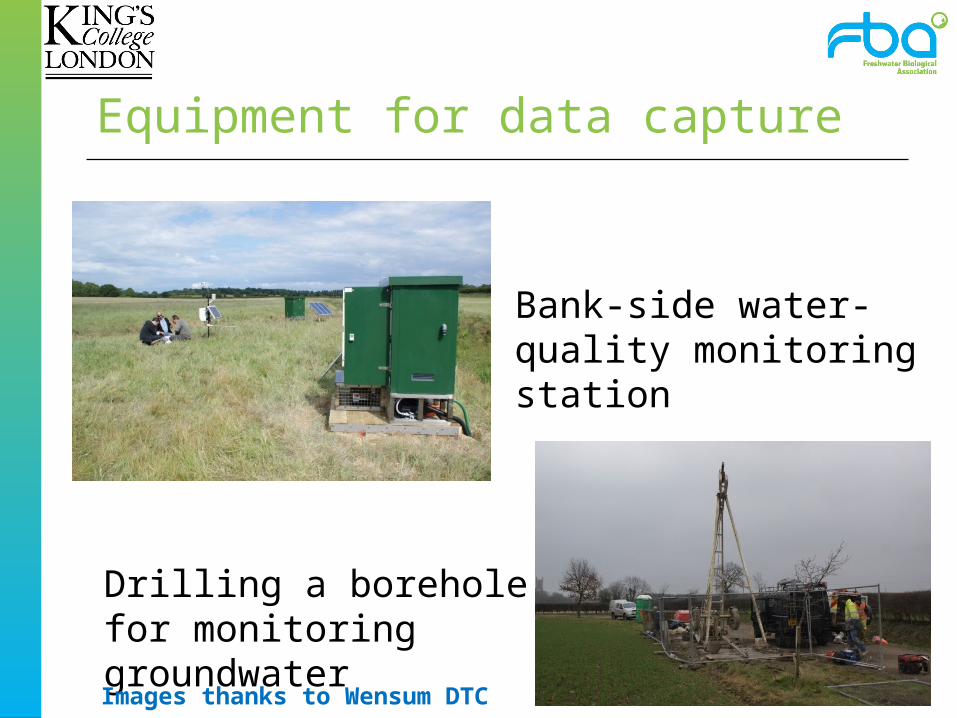
Bank-side water-quality monitoring station
Equipment for data capture
Drilling a borehole for monitoring groundwater
Images thanks to Wensum DTC
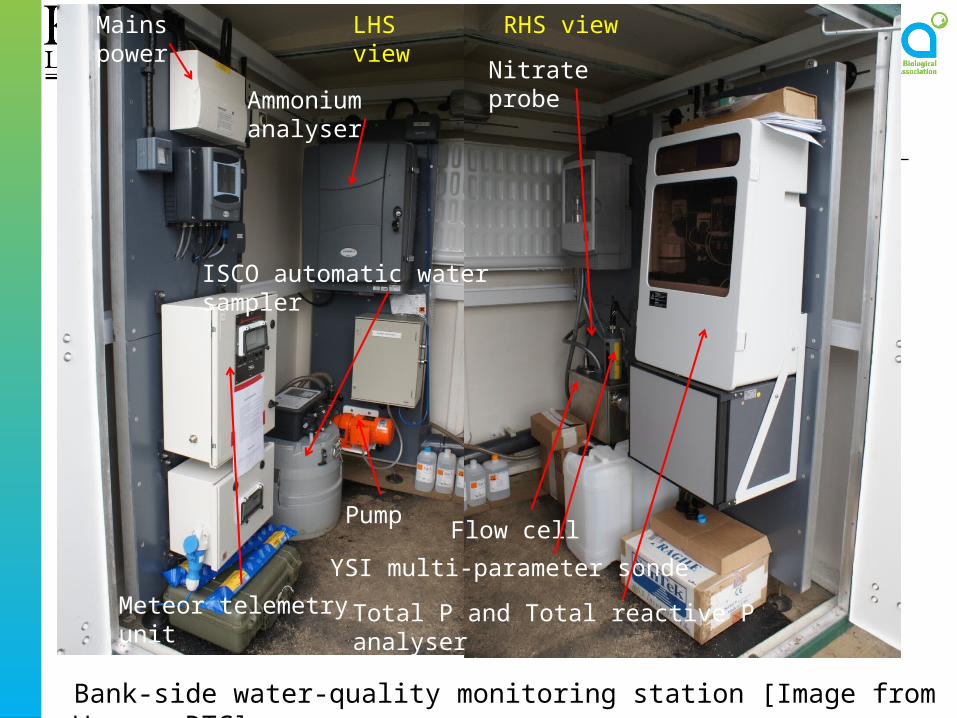
Mains power
Ammonium analyser
Pump
Meteor telemetry unit
Flow cell
YSI multi-parameter sonde
Total P and Total reactive P analyser
Nitrate probe
ISCO automatic water sampler
LHS view
RHS view
Bank-side water-quality monitoring station [Image from Wensum DTC]

DTC Archive
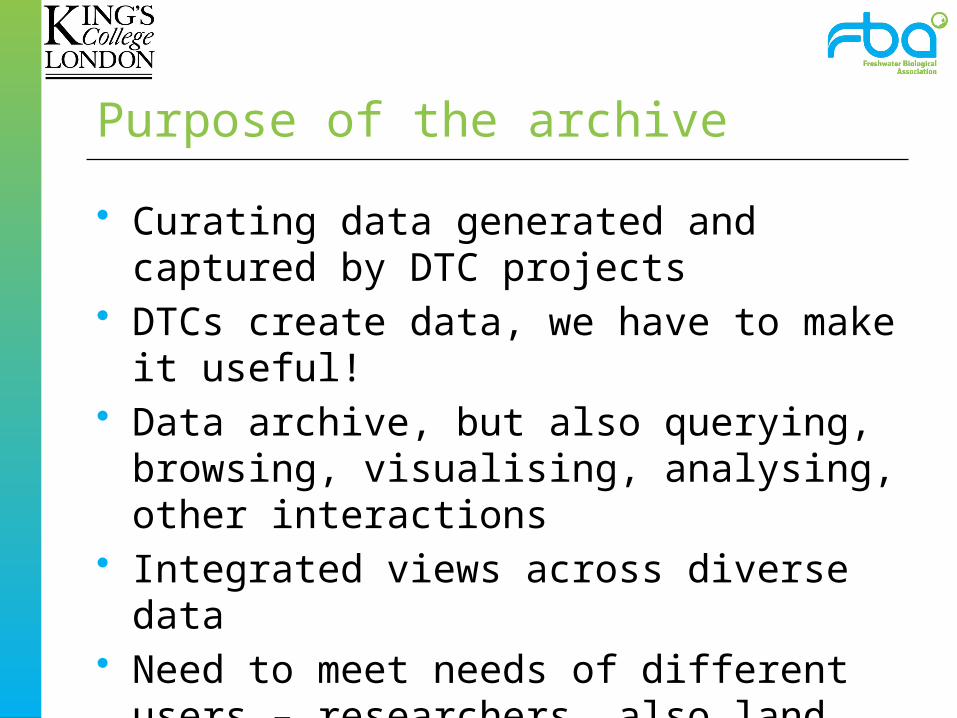
Purpose of the archive
• Curating data generated and captured by DTC projects
• DTCs create data, we have to make it useful!
• Data archive, but also querying, browsing, visualising, analysing, other interactions
• Integrated views across diverse data• Need to meet needs of different users –
researchers, also land managers, civil servants, planners, ...

The Data
• Mostly numerical in some form: spreadsheets, databases, CSV files– Sensor data (automated, telemetry)– Manual samples/analyses
• Species/ecological data• Geo-data • Also less highly structured information:
– Time series images, video– Stakeholder surveys – Unstructured documents

Example: water quality dataDate/time pH Electrical Conductivity Ca Mg Na K SO4 Cl Total Alkalinity HCO3 CO3 Si B NO3 NO2 NH3 Total N Total Particulate N Total Dissolved N Dissolved Organic N
dd/mm/yyyy HH:MM - uS/cm mg/l mg/l mg/l mg/l mg/l mg/l mg CaCO3/l mg/l mg/l ug/l ug/l mg N/l ug N/l ug N/l mg/l mg/l mg/l mg/l
11/10/2010 12:00 8.18 700 129.3 3.5 12.72 1.6 32.39 42.64 293 358 0 3336 48 5.73 42.6 20 6.3 0 6.3 0.5
18/10/2010 14:42 7.9 701 134.6 3.98 14.79 2 29.95 39.07 289 353 0 3690 26 4.07 30.3 21 5.3 0 5.3 1.2
21/10/2010 00:36 7.87 727 137.8 3.31 13.57 1.3 27.04 41.03 293 357 0 2954 26 9.01 19.7 31 10.1 0 10.1 1
26/10/2010 13:43 7.93 585 162.8 3.84 16.11 1.5 27.1 40.06 294 358 0 3015 26 8.79 20.8 16 10.1 0 10.1 1.3
29/10/2010 09:45 8.24 688 148.7 3.54 14.7 1.2 26.49 39.91 273 325 0.16 2857 15 8.54 26.7 26 9.7 NaN 9.8 1.2
02/11/2010 12:00 8.22 585 137.8 3.53 14.15 1.3 28.3 40.75 275 328 0.14 2887 33 6.71 41.2 24 7.8 0 7.8 1.1
05/11/2010 09:50 8.23 763 141.4 3.66 14.23 1.3 30.16 42.41 257 307 0.14 3761 30 6.78 42.1 21 7.1 NaN 7.3 0.5
09/11/2010 11:13 8.32 696 135.3 3.36 12.69 1.7 21.64 33.6 271 320 0.2 2590 21 11.05 16.7 21 12.5 0.1 12.4 1.3
12/11/2010 09:58 7.92 681 138.9 3.27 12.94 1.2 24.23 37.66 279 340 0 2712 7 11.16 13.6 11 12.5 0 12.5 1.3
16/11/2010 10:19 7.88 699 136.7 3.42 13.47 1.1 26.26 37.64 293 357 0 3190 25 8.22 24.1 23 10 0 10 1.7
19/11/2010 10:00 7.9 768 137.3 3.53 13.7 1.1 27 38 296 361 0 3328 14 7.5 30.8 24 9 0 9 1.4
23/11/2010 10:43 7.97 713 132.3 3.55 14.51 1.4 26.42 38.74 292 356 0 3597 7 6.32 32.9 29 7.9 0 7.9 1.5
26/11/2010 10:15 7.79 632 130.4 3.19 16.77 1.3 20.79 39.59 274 334 0 2583 63 9.34 11.9 13 11.3 0 11.3 2
30/11/2010 10:24 8.01 679 135.7 3.34 17.16 1.2 25.64 43.11 290 353 0 2825 35 9.14 17.1 8 10.7 0 10.7 1.6
02/12/2010 14:05 8.05 717 133.1 3.27 15.75 1.1 25.92 41.74 288 351 0 2880 21 9.11 23.7 1 11.1 0.2 10.9 1.8
07/12/2010 09:54 7.98 680 137.5 3.37 13.89 1.1 26.24 36.78 292 356 0 2843 39 9.09 13.9 24 10.9 0 11 1.8
10/12/2010 10:08 7.96 753 136 3.51 21.28 1.3 27.88 49.67 297 362 0 3157 28 7.83 24.5 46 9.8 NaN 9.8 1.9
14/12/2010 10:28 8.04 709 144.6 3.59 15.37 1.1 26.23 38.42 298 363 0 2803 22 8.47 15.1 20 10.4 NaN 10.5 2
16/12/2010 09:40 7.95 718 133.2 3.31 15.92 1.1 25.03 40.34 290 354 0 2972 12 8.21 16.8 47 10.4 0 10.4 2.1
21/12/2010 11:48 7.98 718 131.6 3.33 13.74 1.1 27.17 37.57 302 368 0 3016 21 8.54 14.4 24 10.2 0 10.2 1.6
30/12/2010 09:20 7.97 688 131.1 3.17 13.78 1.1 24.34 35.91 288 352 0 2564 21 9.18 11.2 23 11 0 11 1.8
05/01/2011 11:07 8.1 706 126.9 3.16 12.88 1 27.72 38.5 311 379 0 2833 23 8.52 17 22 10 0.1 9.9 1.3
07/01/2011 10:00 7.98 700 130.9 3.38 14.77 1.1 34.8 40.93 300 366 0 3023 21 7.68 21.2 31 9.6 NaN 9.7 1.9
11/01/2011 10:02 8.04 688 120.7 2.98 14.41 1.2 28.32 38.02 279 340 0 2587 13 7.92 12.8 29 10.5 0.2 10.3 2.3
14/01/2011 09:47 7.88 588 105.9 2.65 11.32 1.3 22.91 27.69 261 319 0 2044 23 8.14 8.2 21 10.3 0.2 10.1 2
61,752 data points per year for all stations
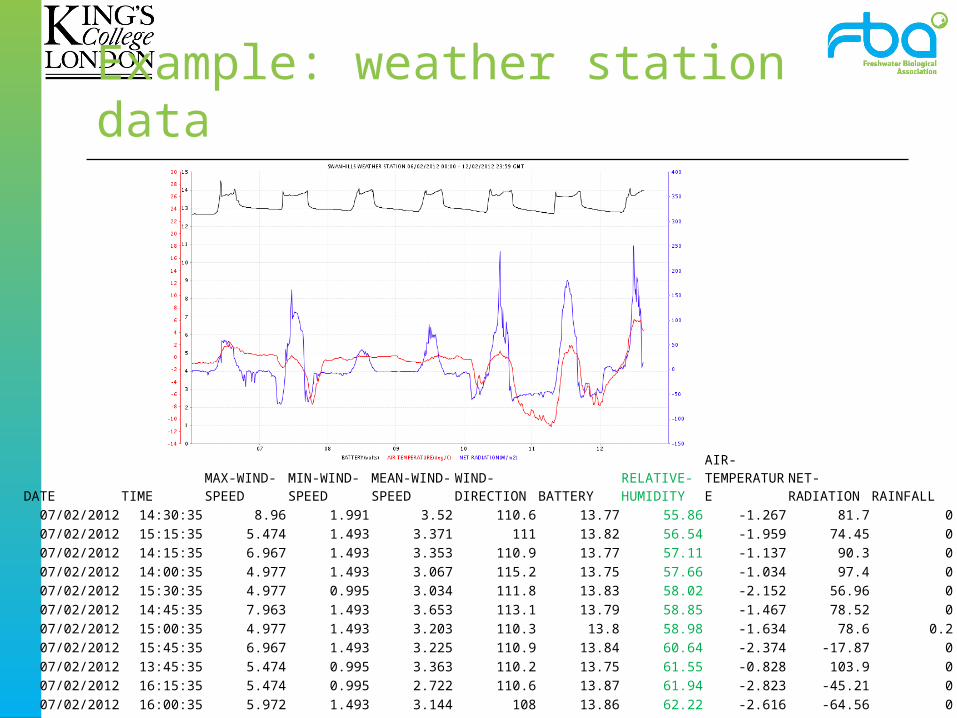
Example: weather station data
DATE TIMEMAX-WIND-SPEED
MIN-WIND-SPEED
MEAN-WIND-SPEED
WIND-DIRECTION BATTERY
RELATIVE-HUMIDITY
AIR-TEMPERATURE
NET-RADIATION RAINFALL
07/02/2012 14:30:35 8.96 1.991 3.52 110.6 13.77 55.86 -1.267 81.7 007/02/2012 15:15:35 5.474 1.493 3.371 111 13.82 56.54 -1.959 74.45 007/02/2012 14:15:35 6.967 1.493 3.353 110.9 13.77 57.11 -1.137 90.3 007/02/2012 14:00:35 4.977 1.493 3.067 115.2 13.75 57.66 -1.034 97.4 007/02/2012 15:30:35 4.977 0.995 3.034 111.8 13.83 58.02 -2.152 56.96 007/02/2012 14:45:35 7.963 1.493 3.653 113.1 13.79 58.85 -1.467 78.52 007/02/2012 15:00:35 4.977 1.493 3.203 110.3 13.8 58.98 -1.634 78.6 0.207/02/2012 15:45:35 6.967 1.493 3.225 110.9 13.84 60.64 -2.374 -17.87 007/02/2012 13:45:35 5.474 0.995 3.363 110.2 13.75 61.55 -0.828 103.9 007/02/2012 16:15:35 5.474 0.995 2.722 110.6 13.87 61.94 -2.823 -45.21 007/02/2012 16:00:35 5.972 1.493 3.144 108 13.86 62.22 -2.616 -64.56 007/02/2012 13:30:35 5.972 1.991 3.591 105.6 13.7 62.68 -0.71 109.7 0
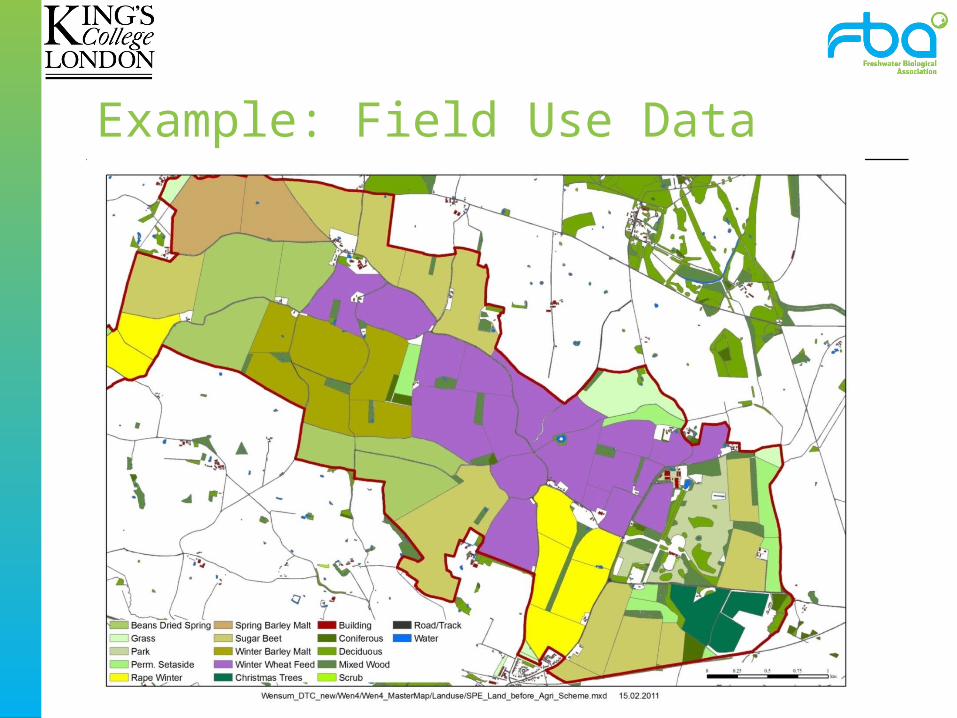
Example: Field Use Data

Challenges of data
• Not primarily an issue of scale• Datasets diverse in terms of structure• Different degrees of structuring:
– Highly structured (e.g. sensor outputs)
– Highly unstructured (e.g. surveys, interviews)
• Different types of structure (tables of data, geospatial)• Some small, hand-crafted data sets.
– Idiosyncratic metadata, description, vocabularies
– Varying provenance and reliability
INSPIRE
• Another EU directive • An Infrastructure for Spatial Information in the
European Community• Create a European Spatial Data Infrastructure
for improved sharing of spatial information• Includes standards for describing, representing,
disseminating geo-spatial data, e.g.– Gemini2 for catalogue metadata– GML (Geography Markup Language)
• Builds on ISO standards (ISO 19100 series)
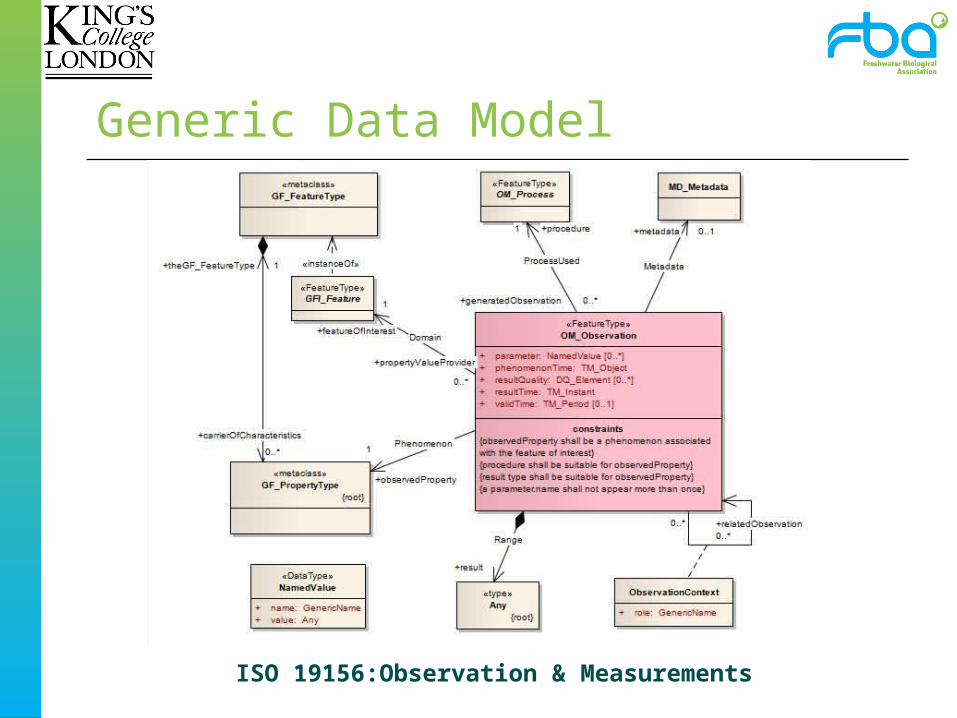
Generic Data Model
ISO 19156:Observation & Measurements

Multiple Data Representations
Generic data model implemented in several ways for different purposes:• Archival representation
– based on library/archive standards
• Data representation for data integration– “Atomic” representation as triples
• Various derived representations– Generated for input to specific tools/analysis
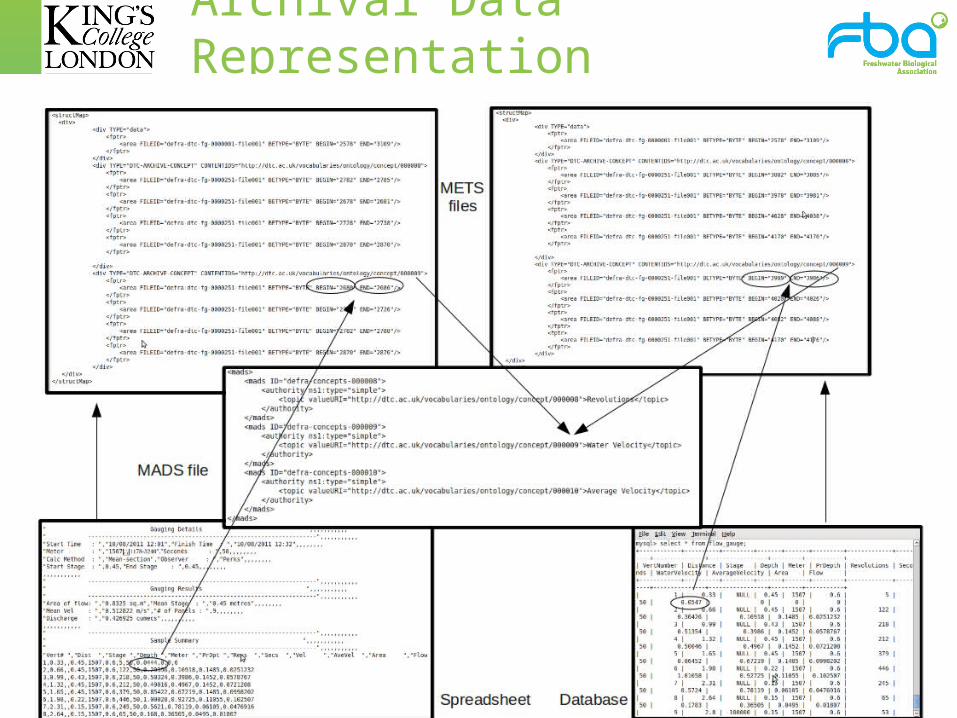
Archival Data Representation
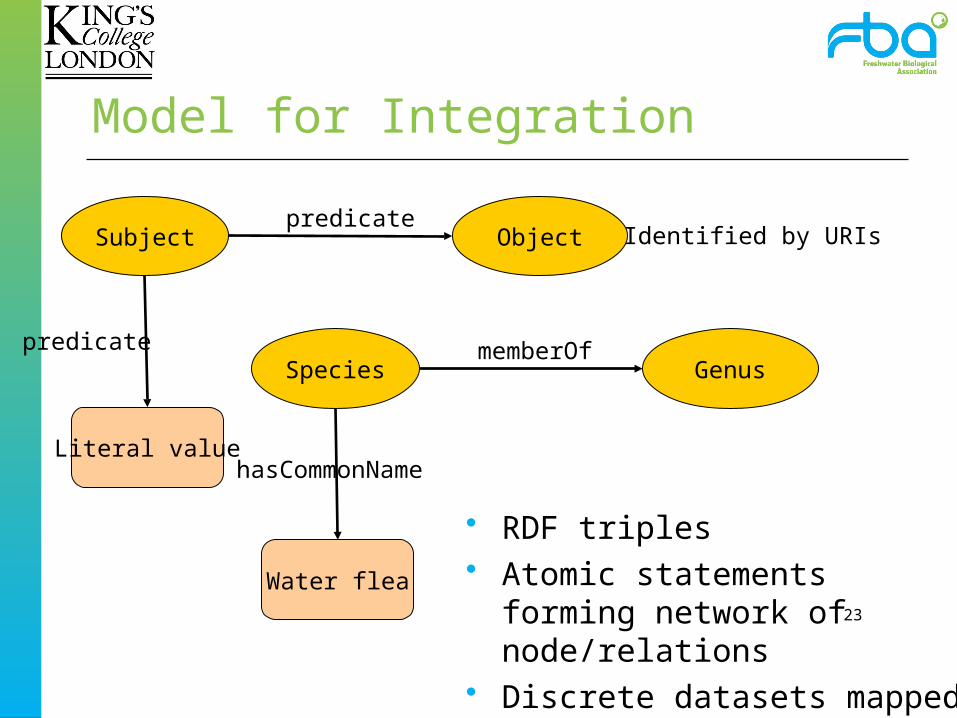
Model for Integration
23
Subject Objectpredicate
Literal value
Identified by URIs
predicateSpecies Genus
memberOf
Water flea
hasCommonName
• RDF triples• Atomic statements forming
network of node/relations • Discrete datasets mapped into
common format
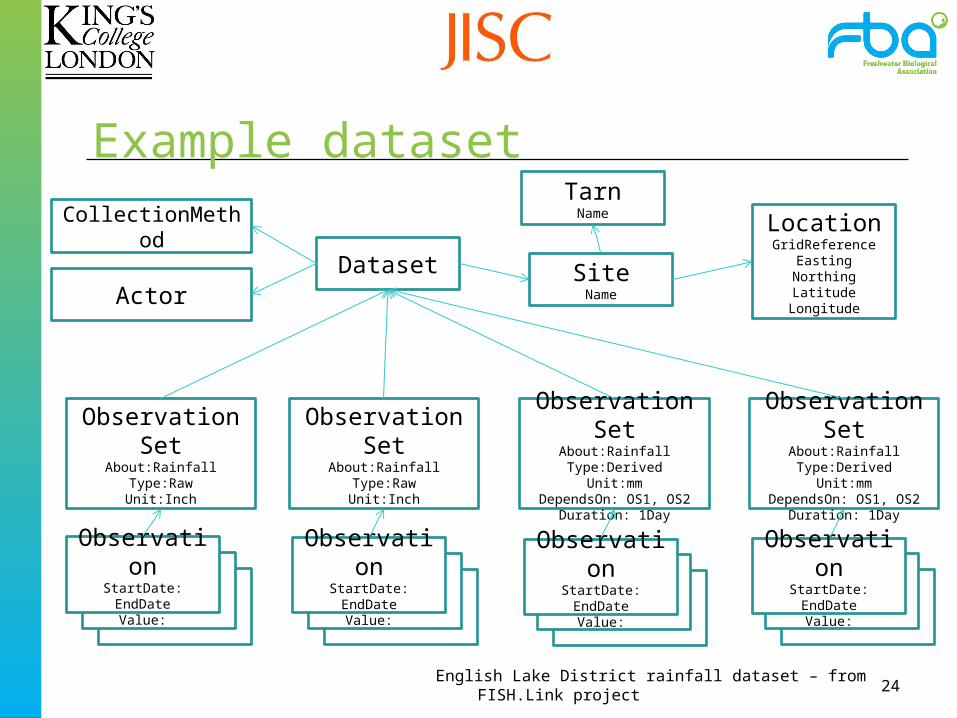
Example dataset
24
Dataset SiteName
LocationGridReference
EastingNorthingLatitude
Longitude
ObservationSetAbout:Rainfall
Type:RawUnit:Inch
ObservationSetAbout:RainfallType:Derived
Unit:mmDependsOn: OS1, OS2
Duration: 1Day
ObservationSetAbout:Rainfall
Type:RawUnit:Inch
ObservationSetAbout:RainfallType:Derived
Unit:mmDependsOn: OS1, OS2
Duration: 1Day
CollectionMethod
ObservationStartDate:EndDate
Value:
ObservationStartDate:EndDate
Value:
ObservationStartDate:EndDate
Value:
ObservationStartDate:EndDate
Value:
Actor
TarnName
English Lake District rainfall dataset – from FISH.Link project
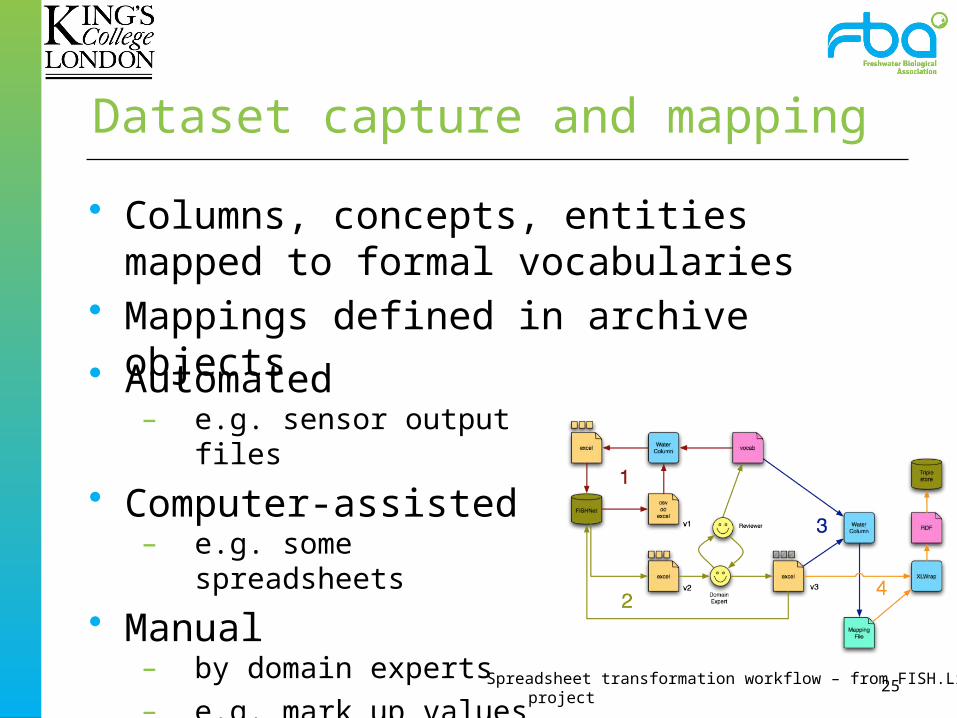
Dataset capture and mapping
• Automated– e.g. sensor output files
• Computer-assisted– e.g. some spreadsheets
• Manual– by domain experts
– e.g. mark up values in texts
25Spreadsheet transformation workflow – from FISH.Link project
• Columns, concepts, entities mapped to formal vocabularies
• Mappings defined in archive objects

Architectural Overview
26
SearchVisualisationBrowsing
Source datasets
Mappings
RDF triples
Analysis
Mappings
Archive Objects

Current Status and Next Steps
• Archive project started Jan. 2011, runs till end 2014.
• Datasets are already being generated in large quantities.
• Prototype functionality• Modelling and Ingestion of data (incremental)• Next steps:
– Extend types of dataset covered.– User interactions (queries, visualisation etc.)
Thank you
http://dtcarchive.org/