
dt84155;vulcan value funds a17 (4.30.2017) Letter April 30, 2017 (Unaudited) Annual Report | April...
52
VULCAN VALUE PARTNERS FUND VULCAN VALUE PARTNERS SMALL CAP FUND ANNUAL April 30, 2017
Transcript of dt84155;vulcan value funds a17 (4.30.2017) Letter April 30, 2017 (Unaudited) Annual Report | April...

VULCAN VALUE PARTNERS FUND
VULCAN VALUE PARTNERS SMALL CAP FUND
ANNUALApril 30, 2017
www.vulcanvaluepartners.com
Table of Contents
CONTENTS PAGE
Shareholder Letter 1
Fund Overview
Vulcan Value Partners Fund 4Vulcan Value Partners Small Cap Fund 7
Disclosure of Fund Expenses
Vulcan Value Partners Fund 6Vulcan Value Partners Small Cap Fund 9
Statements of Investments
Vulcan Value Partners Fund 10Vulcan Value Partners Small Cap Fund 13
Statements of Assets and Liabilities 16
Statements of Operations 17
Statements of Changes in Net Assets
Vulcan Value Partners Fund 18Vulcan Value Partners Small Cap Fund 19
Financial Highlights
Vulcan Value Partners Fund 20Vulcan Value Partners Small Cap Fund 22
Notes to Financial Statements 24
Report of Independent Registered Public Accounting Firm 34
Disclosure Regarding Approval of Fund Advisory Agreements 35
Additional Information 38
Trustees and Officers 39
Privacy Policy 44
Shareholder Letter April 30, 2017 (Unaudited)
Annual Report | April 30, 2017 1
Vulcan Value Partners Fund and Vulcan Value Partners Small Cap Fund delivered double digit returns for the year ended April 30, 2017 and, more importantly, the funds have produced strong long‐term returns as both funds have outperformed their primary benchmarks inception to date. As we have often said, we place no weight on short‐term results, good or bad, and neither should you. In fact, we have made and will continue to make decisions that negatively impact short‐term performance when we think we can improve our long‐term returns and mitigate risk. We encourage you to place more weight on our longer‐term historical results and a great deal of weight on our long‐term prospects. We are proud to announce that Vulcan celebrated its ten year anniversary as a firm during the first quarter of 2017. Between the founding of the firm in 2007 and December 30, 2009, the inception of the funds, Vulcan built sufficient staff and infrastructure to seek to ensure the firm’s ability to manage substantial client assets. Our success in providing value to clients over the firm’s ten year history confirms that the investment disciplines pioneered by the great value investors who preceded us are still relevant today. What are these disciplines that we believe in and follow? First, it is essential to consistently execute our disciplined investment philosophy and let it take the portfolio where it is supposed to go as part of our effort to produce attractive long‐term results. Second, to achieve attractive long‐term results you must be willing and able to stand apart from the crowd and endure periods of short‐term underperformance. Third, capturing attractive long‐term results requires patience and a long‐term time horizon.
Vulcan Value Partners Large Cap Fund Review In the discussion that follows, we highlight a few holdings in the Vulcan Value Partners Fund. One year ago we wrote the following about Oracle, our largest holding:
“Oracle has faced a significant headwind from the strong dollar. More importantly, the company is rapidly shifting its business mix to Cloud‐based delivery of its software products. Cloud‐based revenues are more profitable over time than on‐premise software license fees. However, Oracle’s consolidated growth has slowed because Cloud sales do not have one‐time setup fees, while on‐premise sales do. Investors with shorter time horizons than ours have punished Oracle’s stock for the last couple of years because of its slowing consolidated growth. As Oracle’s Cloud business continues to grow at high double‐digit rates, the company’s consolidated growth rate should begin to accelerate sometime over the next twelve months and continue to accelerate for many years to come. As this inflection point becomes more visible to short‐term investors, they are pushing up Oracle’s stock price, and we are being rewarded for our patience.”
Fast forward to today: We could not be more pleased with Oracle’s progress. Oracle has hit its inflection point, and we expect growth to accelerate over the next several years. More importantly, the company has strengthened its competitive position by extending its reach into the Cloud.

Shareholder Letter April 30, 2017 (Unaudited)
2 www.vulcanvaluepartners.com
Skyworks, a new purchase in the third quarter of 2016, makes radio frequency filters (RF), power amplifiers, and mixed signal semiconductors. These chipsets are critical components in modern cell phones. As telecommunications technology continues to evolve from 2G to 3G to 4G and soon to 5G, bands continue to proliferate and data usage grows exponentially. Their products are a small part of the cost of a cell phone, but the phone will not function without them. They operate in a global oligopoly (1). Only a handful of companies can produce these increasingly complex chipsets at scale. Switching costs are high and risky. As an example, think about the financial and reputational damage to Samsung from the Galaxy 7 battery debacle— and batteries are commoditized while RF chipsets are not. We sold Franklin Resources. After compounding nicely for several years, its value has been flat for the past couple of years. As we have said in the past, part of our investment discipline is to reassess a company whose value has not grown over two years. We admire Franklin’s business model which generates large amounts of stable free cash flow and its competitive advantages such as scale and a broad and diverse product offering. However, as we look forward over our five year investment horizon, we are less certain about Franklin’s competitive advantages. Following our investment discipline, we sold our position and redeployed capital to companies that we believe have more stable values and more attractive price to value ratios.
Vulcan Value Partners Small Cap Fund Review In the discussion that follows, we highlight a few holdings in the Vulcan Value Partners Small Cap Fund. CEB, Inc., a new purchase in the fourth quarter of 2016, has a unique networking and database business helping executives find best practices within their industries. CEB is illustrative of our challenges in Small Cap. For us, there are few qualifying companies that are attractively priced, and the few that are selling at a discount do not stay discounted long. We were forced sellers in the first quarter of 2017 as Gartner offered to buy the company at a substantial premium to our estimate of intrinsic worth. Our gain on CEB was over 40% in the short time that we owned it. Sotheby’s, a material contributor, gained just over 47% during the 12 month period ended April 30, 2017. We believe Sotheby’s management team is doing an excellent job operationally and in terms of allocating capital. The market is belatedly recognizing Sotheby’s improved performance which is transpiring against the backdrop of a relatively weak art market. Select Comfort, another material contributor over this time period, is a company we have successfully owned before. Select Comfort has a unique distribution model that it uses to sell premium bedding products including mattresses. The company produces high levels of free cash flow and is benefitting from a shift to more comfortable, higher‐end mattresses among consumers. Its Sleep Number mattresses have a loyal following, which is impressive for such a long‐lasting product with infrequent sales. My wife and I personally bought a Sleep Number bed as part of our research process, and I have to say that we love it. We will never buy another brand. CEB, Inc., a new purchase in the fourth quarter of 2016, has a unique networking and database business helping executives find best practices within their industries. CEB is illustrative of our challenges in Small Cap. For us, there are few qualifying companies that are attractively priced, and the few that are selling at a discount do not stay discounted long. We were forced sellers in

Shareholder Letter April 30, 2017 (Unaudited)
Annual Report | April 30, 2017 3
the first quarter of 2017 as Gartner offered to buy the company at a substantial premium to our estimate of intrinsic worth. Our gain on CEB was over 40% in the short time that we owned it. CEB is also an example of our challenges in Small Cap. We made a large gain in a short period of time and sold it above our estimate of fair value, but we have very few qualifying businesses into which we can re‐deploy capital from the sale. Consequently, our cash levels are rising. Cash is a residual decision. We demand a margin of safety to invest. We will not knowingly pay fair value or more than fair value for any business. Closing We are very pleased to be able to share good news with you in this letter regarding our results while we maintain our focus on long‐term investing. We appreciate the confidence you have placed in us. We would not have been able to produce our outstanding long‐term results without your stable capital. Thank you! C.T. Fitzpatrick Chief Executive Officer Vulcan Value Partners, LLC Past performance does not guarantee future results. The Fund’s prices fluctuate as the underlying assets have exposure to market fluctuations and other risks, as described in the Funds’ prospectus. Please call 877.421.5078 to obtain current performance information and for the current prospectus and statement of additional information. This material must be preceded or accompanied by a prospectus. Please read the prospectus carefully before investing. The views of the Vulcan Value Partners, LLC and information discussed in this commentary are as of the date of publication, are subject to change, and may not reflect the writer's current views. The views expressed represent an assessment of market conditions at a specific point in time, are opinions only and should not be relied upon as investment advice regarding a particular investment or markets in general. Such information does not constitute a recommendation to buy or sell specific securities or investment vehicles. It should not be assumed that any investment will be profitable or will equal the performance of the Funds or any securities or any sectors mentioned in this letter. The subject matter contained in this letter has been derived from several sources believed to be reliable and accurate at the time of compilation. Neither Vulcan Value Partners, LLC nor the Funds accept any liability for losses either direct or consequential caused by the use of this information. The Funds are distributed by ALPS Distributors, Inc. The Funds are subject to investment risks, including possible loss of the principal amount invested and therefore is not suitable for all investors. The Funds may not achieve their objectives. Diversification does not eliminate the risk of experiencing investment losses. (1) Oligopoly is a market structure in which a small number of firms has the large majority of market
share. An oligopoly is similar to a monopoly, except that rather than one firm, two or more firms dominate the market.

Fund Overview April 30, 2017 (Unaudited)
4 www.vulcanvaluepartners.com
VULCAN VALUE PARTNERS FUND
Cumulative Total Returns (as of 4/30/17)
6 Month 1 Year 3 Year 5 Year Since
Inception* Expense Ratios Total Net(1)
Vulcan Value Partners Fund 15.40% 13.85% 7.48% 12.72% 12.70% 1.08% 1.08% S&P 500® Total Return Index(2) 13.32% 17.92% 10.47% 13.68% 13.13% Russell 1000® Value Index(3) 11.69% 16.55% 8.26% 13.32% 12.43% Performance data quoted represents past performance. Past performance does not guarantee future results. Investment return and principal value of an investment will fluctuate so that an investor’s shares, when sold or redeemed, may be worth more or less than the original cost. The Fund imposes a 2.00% redemption fee on shares held for less than 90 days. Current performance data may be higher or lower than actual data quoted. For the most current month-end performance data, please call 1-877-421-5078. The table does not reflect the deduction of taxes that a shareholder would pay on Fund distributions or the redemption of Fund shares. Subject to investment risks, including possible loss of the principal amount invested. Returns for periods greater than 1 year are annualized. * Fund inception date of 12/30/09. (1) Vulcan Value Partners, LLC (“Vulcan” or the “Adviser”) has contractually agreed to limit
the Fund’s total annual fund operating expenses (exclusive of Acquired Fund Fees and Expenses, brokerage expenses, interest expense, taxes and extraordinary expenses) to 1.25% of the Fund’s average daily net assets. This agreement (the “Expense Agreement”) is in effect through August 31, 2017. The Adviser will be permitted to recover, on a class-by-class basis, expenses it has borne through the Expense Agreement to the extent that the Fund’s expenses in later periods fall below the expense cap in effect at the time of waiver or reimbursement. Notwithstanding the foregoing, the Fund will not be obligated to pay any such fees and expenses more than three years after the end of the fiscal year in which the fees or expenses were foregone or reimbursed. The Adviser may not discontinue or modify this waiver prior to August 31, 2017 without the approval by the Fund’s Board of Trustees.
(2) The S&P 500® Total Return Index is an unmanaged index of 500 common stocks chosen for market size, liquidity and industry group representation. It is a market-value weighted index. The Index is not actively managed and does not reflect any deductions for fees, expenses or taxes. An investor may not invest directly in the Index.
(3) The Russell 1000® Value Index measures the performance of the large-cap value segment of the U.S.equity universe. It includes those Russell 1000® companies with lower price-to-book ratios and lower expected growth values. The index is not actively managed and does not reflect any deductions for fees, expense or taxes. An investor may not invest directly in an index.
Fund Overview April 30, 2017 (Unaudited)
Annual Report | April 30, 2017 5
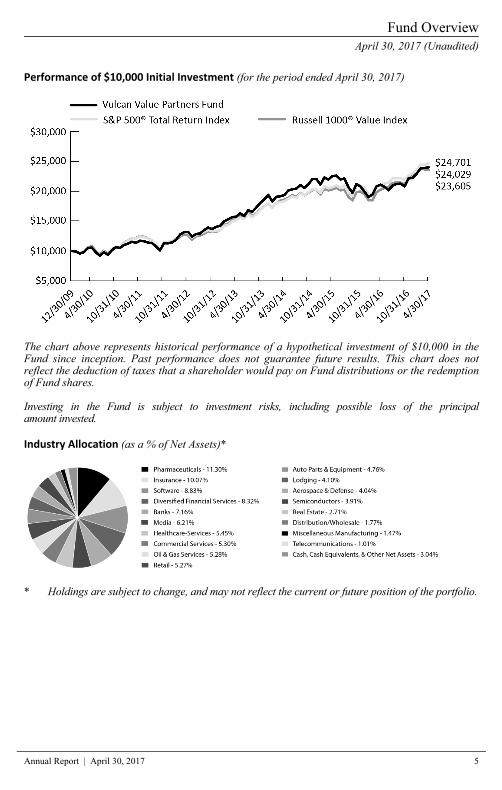
Performance of $10,000 Initial Investment (for the period ended April 30, 2017)
The chart above represents historical performance of a hypothetical investment of $10,000 in the Fund since inception. Past performance does not guarantee future results. This chart does not reflect the deduction of taxes that a shareholder would pay on Fund distributions or the redemption of Fund shares. Investing in the Fund is subject to investment risks, including possible loss of the principal amount invested. Industry Allocation (as a % of Net Assets)*
* Holdings are subject to change, and may not reflect the current or future position of the portfolio.

Disclosure of Fund Expenses April 30, 2017 (Unaudited)
6 www.vulcanvaluepartners.com
As a shareholder of the Vulcan Value Partners Fund (the “Fund”), you will incur two types of costs: (1) transaction costs, including applicable redemption fees; and (2) ongoing costs, including management fees and other fund operating expenses. The following examples are intended to help you understand your ongoing costs (in dollars) of investing in the Fund and to compare these costs with the ongoing costs of investing in other mutual funds. The examples are based on an investment of $1,000 invested on November 1, 2016 and held until April 30, 2017.
Actual Expenses. The first line of each table below provides information about actual account values and actual expenses. You may use the information in this line, together with the amount you invested, to estimate the expenses that you paid over the period. Simply divide your account value by $1,000 (for example, an $8,600 account value divided by $1,000 = 8.6), then multiply the result by the number in the first line under the heading “Expenses Paid During Period” to estimate the expenses you paid on your account during this period.
Hypothetical Example for Comparison Purposes. The second line of the table below provides information about hypothetical account values and hypothetical expenses based on the Fund’s actual expense ratio and an assumed rate of return of 5% per year before expenses, which is not the Fund’s actual return. The hypothetical account values and expenses may not be used to estimate the actual ending account balance or expenses you paid for the period. You may use this information to compare the ongoing costs of investing in the Fund and other mutual funds. To do so, compare this 5% hypothetical example with the 5% hypothetical examples that appear in the shareholder reports of the other mutual funds. Please note the expenses shown in the table are meant to highlight ongoing Fund costs only and do not reflect transactional costs, such as redemption fees or exchange fees. Therefore, the second line of the table below is useful in comparing your ongoing costs only, and will not help you determine the relative total costs of owning different funds. In addition, if these transactional costs were included, your costs would have been higher.
Vulcan Value Partners Fund
Beginning Account Value
11/1/16
Ending Account Value
4/30/17 Expense Ratio(a)
Expenses Paid During period
11/1/16 - 4/30/17(b) Actual $ 1,000.00
$1,154.00 1.07% $ 5.71 Hypothetical (5% return before expenses) $ 1,000.00
$1,019.49 1.07% $ 5.36
(a) The Fund's expense ratios have been annualized based on the Fund's most recent fiscal half-year expenses.
(b) Expenses are equal to the Fund's annualized expense ratio multiplied by the average accountvalue over the period, multiplied by the number of days in the most recent fiscal half-year (181)/365 (to reflect the half-year period).

Fund Overview April 30, 2017 (Unaudited)
Annual Report | April 30, 2017 7
VULCAN VALUE PARTNERS SMALL CAP FUND
Cumulative Total Returns (as of 4/30/17)
6 Month 1 Year 3 Year 5 Year Since
Inception* Expense Ratios Total Net(1)
Vulcan Value Partners Small Cap Fund 17.99% 21.97% 8.65% 14.14% 15.04% 1.26% 1.26% Russell 2000® Value Index(2) 18.26% 27.18% 8.71% 12.96% 12.33% Russell 2000® Index(3) 18.37% 25.63% 9.04% 12.95% 12.95%
Performance data quoted represents past performance. Past performance does not guarantee future results. Investment return and principal value of an investment will fluctuate so that an investor’s shares, when sold or redeemed, may be worth more or less than the original cost. The Fund imposes a 2.00% redemption fee on shares held for less than 90 days. Current performance data may be higher or lower than actual data quoted. For the most current month-end performance data, please call 1-877-421-5078. The table does not reflect the deduction of taxes that a shareholder would pay on Fund distributions or the redemption of Fund shares. Subject to investment risks, including possible loss of the principal amount invested. Returns for periods greater than 1 year are annualized. * Fund inception date of 12/30/09. (1) Vulcan Value Partners, LLC (“Vulcan” or the “Adviser”) has contractually agreed to limit
the Fund’s total annual fund operating expenses (exclusive of Acquired Fund Fees and Expenses, brokerage expenses, interest expense, taxes and extraordinary expenses) to 1.25% of the Fund’s average daily net assets. This agreement (the “Expense Agreement”) is in effect through August 31, 2017. The Adviser will be permitted to recover, on a class-by-class basis, expenses it has borne through the Expense Agreement to the extent that the Fund’s expenses in later periods fall below the expense cap in effect at the time of waiver or reimbursement. Notwithstanding the foregoing, the Fund will not be obligated to pay any such fees and expenses more than three years after the end of the fiscal year in which the fees or expenses were foregone or reimbursed. The Adviser may not discontinue or modify this waiver prior to August 31, 2017 without the approval by the Fund’s Board of Trustees.
(2) The Russell 2000® Value Index measures the performance of small-cap value segment of the U.S.equity universe. It includes those Russell 2000® companies with lower price-to-book ratios and lower forecasted growth values. The index is not actively managed and does not reflect any deductions for fees, expense or taxes. An investor may not invest directly in an index.
(3) The Russell 2000® Index measures the performance of the small-cap segment of the U.S. equity universe. The Russell 2000® Index is a subset of the Russell 3000® Index representing approximately 8% of the total market capitalization of that index. It includes approximately 2,000 of the smallest securities based on a combination of their market cap and current index membership. The index is not actively managed and does not reflect any deductions for fees, expense or taxes. An investor may not invest directly in an index.

Fund Overview April 30, 2017 (Unaudited)
8 www.vulcanvaluepartners.com
Performance of $10,000 Initial Investment (for the period ended April 30, 2017)
The chart above represents historical performance of a hypothetical investment of $10,000 in the Fund since inception. Past performance does not guarantee future results. This chart does not reflect the deduction of taxes that a shareholder would pay on Fund distributions or the redemption of Fund shares. Investing in the Fund is subject to investment risks, including possible loss of the principal amount invested. Industry Allocation (as a % of Net Assets)*
* Holdings are subject to change, and may not reflect the current or future position of the portfolio.

Disclosure of Fund Expenses April 30, 2017 (Unaudited)
Annual Report | April 30, 2017 9
As a shareholder of the Vulcan Value Partners Small Cap Fund (the “Fund”), you will incur two types of costs: (1) transaction costs, including applicable redemption fees; and (2) ongoing costs, including management fees and other fund operating expenses. The following examples are intended to help you understand your ongoing costs (in dollars) of investing in the Fund and to compare these costs with the ongoing costs of investing in other mutual funds. The examples are based on an investment of $1,000 invested on November 1, 2016 and held until April 30, 2017.
Actual Expenses. The first line of each table below provides information about actual account values and actual expenses. You may use the information in this line, together with the amount you invested, to estimate the expenses that you paid over the period. Simply divide your account value by $1,000 (for example, an $8,600 account value divided by $1,000 = 8.6), then multiply the result by the number in the first line under the heading “Expenses Paid During Period” to estimate the expenses you paid on your account during this period.
Hypothetical Example for Comparison Purposes. The second line of the table below provides information about hypothetical account values and hypothetical expenses based on the Fund’s actual expense ratio and an assumed rate of return of 5% per year before expenses, which is not the Fund’s actual return. The hypothetical account values and expenses may not be used to estimate the actual ending account balance or expenses you paid for the period. You may use this information to compare the ongoing costs of investing in the Fund and other mutual funds. To do so, compare this 5% hypothetical example with the 5% hypothetical examples that appear in the shareholder reports of the other mutual funds. Please note the expenses shown in the table are meant to highlight ongoing Fund costs only and do not reflect transactional costs, such as redemption fees or exchange fees. Therefore, the second line of the table below is useful in comparing your ongoing costs only, and will not help you determine the relative total costs of owning different funds. In addition, if these transactional costs were included, your costs would have been higher.
Vulcan Value Partners Small Cap Fund
Beginning Account Value
11/1/16
Ending Account Value
4/30/17 Expense Ratio(a)
Expenses Paid During period
11/1/16 - 4/30/17(b) Actual $ 1,000.00
$1,179.90 1.25% $ 6.76 Hypothetical (5% return before expenses) $ 1,000.00
$1,018.60 1.25% $ 6.26
(a) The Fund's expense ratios have been annualized based on the Fund's most recent fiscal half-year expenses.
(b) Expenses are equal to the Fund's annualized expense ratio multiplied by the average accountvalue over the period, multiplied by the number of days in the most recent fiscal half-year (181)/365 (to reflect the half-year period).

Statement of Investments Vulcan Value Partners Fund April 30, 2017
10 www.vulcanvaluepartners.com
Value Shares (Note 2) COMMON STOCKS (96.96%) Communications (7.22%)
Media (6.21%) Discovery Communications, Inc., Class C(a) 1,665,650 $ 46,604,887 Time Warner, Inc. 132,594 13,162,607 Walt Disney Co. 173,637 20,072,437
79,839,931
Telecommunications (1.01%)Cisco Systems, Inc. 380,816 12,974,401
TOTAL COMMUNICATIONS 92,814,332
Consumer, Cyclical (15.90%)
Auto Parts & Equipment (4.76%)GKN PLC 13,165,204 61,198,135
Distribution/Wholesale (1.77%)Fossil Group, Inc.(a) 1,317,934 22,734,361
Lodging (4.10%) Hilton Worldwide Holdings, Inc. 527,398 31,100,660 Intercontinental Hotels Group PLC, ADR 408,187 21,548,192
52,648,852
Retail (5.27%) CVS Health Corp. 820,812 67,667,741
TOTAL CONSUMER, CYCLICAL 204,249,089
Consumer, Non‐cyclical (22.05%)
Commercial Services (5.30%)Moody's Corp. 203,025 24,021,918 S&P Global, Inc. 158,436 21,260,527 Sabre Corp. 971,748 22,748,621
68,031,066
Healthcare‐Services (5.45%)Aetna, Inc. 173,096 23,380,077 Anthem, Inc. 198,288 35,273,452 UnitedHealth Group, Inc. 65,038 11,373,845
70,027,374
Pharmaceuticals (11.30%) AmerisourceBergen Corp. 637,209 52,282,999

Vulcan Value Partners Fund Statement of Investments April 30, 2017
Annual Report | April 30, 2017 11
Value Shares (Note 2) Consumer, Non‐cyclical (continued)
Pharmaceuticals (continued)Cardinal Health, Inc. 540,273 $ 39,218,417 McKesson Corp. 388,384 53,709,623
145,211,039
TOTAL CONSUMER, NON‐CYCLICAL 283,269,479
Energy (5.28%)
Oil & Gas Services (5.28%) National Oilwell Varco, Inc. 1,939,968 67,840,681
TOTAL ENERGY 67,840,681
Financial (28.26%)
Banks (7.16%) Bank of New York Mellon Corp. 605,004 28,471,488 Northern Trust Corp. 222,648 20,038,320 State Street Corp. 518,136 43,471,610
91,981,418
Diversified Financial Services (8.32%)Mastercard, Inc., Class A 462,107 53,752,286 Visa, Inc., Class A 582,630 53,147,509
106,899,795
Insurance (10.07%) Axis Capital Holdings, Ltd. 607,162 40,011,976 Everest Re Group, Ltd. 145,154 36,536,713 Swiss Re AG 607,249 52,852,024
129,400,713
Real Estate (2.71%) CBRE Group, Inc., Class A(a) 971,590 34,792,638
TOTAL FINANCIAL 363,074,564
Industrial (5.51%)
Aerospace & Defense (4.04%)Boeing Co. 237,128 43,828,368 United Technologies Corp. 68,055 8,097,865
51,926,233
Statement of Investments Vulcan Value Partners Fund April 30, 2017
12 www.vulcanvaluepartners.com
Value Shares (Note 2) Industrial (continued)
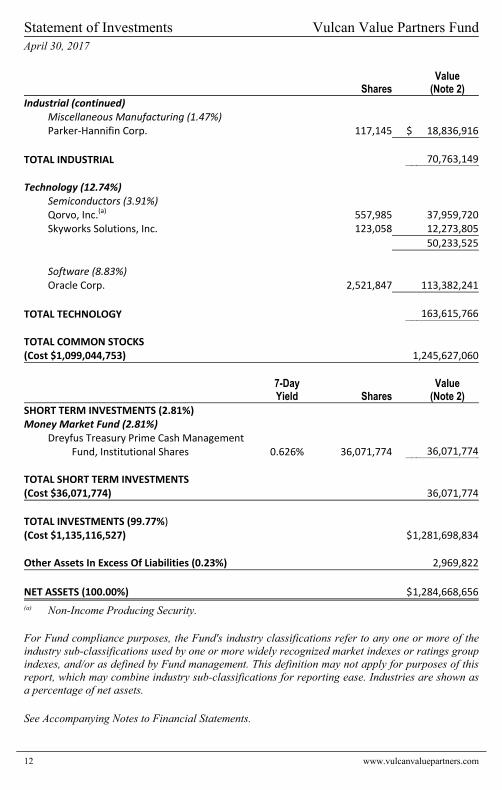
Miscellaneous Manufacturing (1.47%)Parker‐Hannifin Corp. 117,145 $ 18,836,916
TOTAL INDUSTRIAL 70,763,149
Technology (12.74%)
Semiconductors (3.91%) Qorvo, Inc.(a) 557,985 37,959,720 Skyworks Solutions, Inc. 123,058 12,273,805
50,233,525
Software (8.83%) Oracle Corp. 2,521,847 113,382,241
TOTAL TECHNOLOGY 163,615,766
TOTAL COMMON STOCKS (Cost $1,099,044,753) 1,245,627,060
7-Day Value Yield Shares (Note 2) SHORT TERM INVESTMENTS (2.81%)Money Market Fund (2.81%)
Dreyfus Treasury Prime Cash Management Fund, Institutional Shares 0.626% 36,071,774 36,071,774
TOTAL SHORT TERM INVESTMENTS(Cost $36,071,774) 36,071,774
TOTAL INVESTMENTS (99.77%) (Cost $1,135,116,527) $1,281,698,834 Other Assets In Excess Of Liabilities (0.23%) 2,969,822
NET ASSETS (100.00%) $1,284,668,656
(a) Non-Income Producing Security.
For Fund compliance purposes, the Fund's industry classifications refer to any one or more of theindustry sub-classifications used by one or more widely recognized market indexes or ratings groupindexes, and/or as defined by Fund management. This definition may not apply for purposes of thisreport, which may combine industry sub-classifications for reporting ease. Industries are shown as a percentage of net assets.
See Accompanying Notes to Financial Statements.
Vulcan Value Partners Small Cap Fund Statement of Investments April 30, 2017
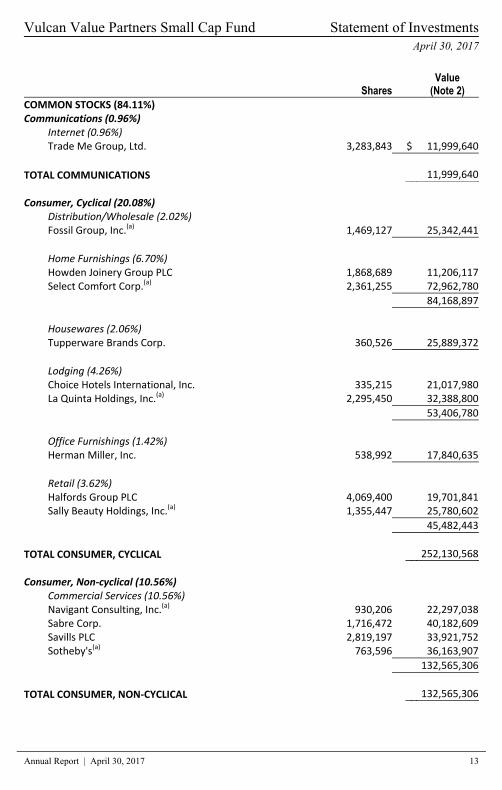
Annual Report | April 30, 2017 13
Value Shares (Note 2) COMMON STOCKS (84.11%) Communications (0.96%)
Internet (0.96%) Trade Me Group, Ltd. 3,283,843 $ 11,999,640
TOTAL COMMUNICATIONS 11,999,640
Consumer, Cyclical (20.08%)
Distribution/Wholesale (2.02%)Fossil Group, Inc.(a) 1,469,127 25,342,441
Home Furnishings (6.70%) Howden Joinery Group PLC 1,868,689 11,206,117 Select Comfort Corp.(a) 2,361,255 72,962,780
84,168,897
Housewares (2.06%) Tupperware Brands Corp. 360,526 25,889,372
Lodging (4.26%) Choice Hotels International, Inc. 335,215 21,017,980 La Quinta Holdings, Inc.(a) 2,295,450 32,388,800
53,406,780
Office Furnishings (1.42%) Herman Miller, Inc. 538,992 17,840,635
Retail (3.62%) Halfords Group PLC 4,069,400 19,701,841 Sally Beauty Holdings, Inc.(a) 1,355,447 25,780,602
45,482,443
TOTAL CONSUMER, CYCLICAL 252,130,568
Consumer, Non‐cyclical (10.56%)
Commercial Services (10.56%)Navigant Consulting, Inc.(a) 930,206 22,297,038 Sabre Corp. 1,716,472 40,182,609 Savills PLC 2,819,197 33,921,752 Sotheby's(a) 763,596 36,163,907
132,565,306
TOTAL CONSUMER, NON‐CYCLICAL 132,565,306

Statement of Investments Vulcan Value Partners Small Cap Fund April 30, 2017
14 www.vulcanvaluepartners.com
Value Shares (Note 2) Energy (1.60%)
Oil & Gas Services (1.60%) Thermon Group Holdings, Inc.(a) 982,070 $ 20,132,435
TOTAL ENERGY 20,132,435
Financial (28.57%)
Diversified Financial Services (4.40%)Ashmore Group PLC 3,352,854 15,103,631 Virtus Investment Partners, Inc. 377,111 40,124,610
55,228,241
Insurance (18.06%) Aspen Insurance Holdings, Ltd. 1,227,307 64,249,522 Axis Capital Holdings, Ltd. 951,141 62,680,192 Everest Re Group, Ltd. 195,386 49,180,610 Navigators Group, Inc. 937,428 50,667,983
226,778,307
Real Estate (5.26%) Jones Lang LaSalle, Inc. 574,448 65,981,097
REITS (0.85%) Outfront Media, Inc. 410,113 10,728,556
TOTAL FINANCIAL 358,716,201
Industrial (17.18%)
Electronics (6.20%) Ituran Location and Control, Ltd. 1,936,082 60,599,366 Woodward, Inc. 255,007 17,256,324
77,855,690
Machinery‐Diversified (4.99%)Concentric AB 2,115,920 34,877,933 Lindsay Corp. 319,458 27,748,122
62,626,055
Miscellaneous Manufacturing (3.48%)Actuant Corp., Class A 901,504 24,611,059 Crane Co. 239,430 19,132,852
43,743,911

Vulcan Value Partners Small Cap Fund Statement of Investments April 30, 2017
Annual Report | April 30, 2017 15
Value Shares (Note 2) Industrial (continued)
Transportation (2.51%) Forward Air Corp. 591,746 $ 31,463,135
TOTAL INDUSTRIAL 215,688,791
Technology (5.16%)
Software (5.16%) ACI Worldwide, Inc.(a) 3,016,738 64,829,700
TOTAL TECHNOLOGY 64,829,700
TOTAL COMMON STOCKS (Cost $901,905,738) 1,056,062,641
7-Day Value Yield Shares (Note 2) SHORT TERM INVESTMENTS (17.40%)Money Market Fund (17.40%)
Dreyfus Treasury Prime Cash Management Fund, Institutional Shares 0.626% 218,528,058 218,528,058
TOTAL SHORT TERM INVESTMENTS(Cost $218,528,058) 218,528,058
TOTAL INVESTMENTS (101.51%)(Cost $1,120,433,796) $1,274,590,699 Liabilities In Excess Of Other Assets (‐1.51%) (18,984,869)
NET ASSETS (100.00%) $1,255,605,830
(a) Non-Income Producing Security.
For Fund compliance purposes, the Fund's industry classifications refer to any one or more of theindustry sub-classifications used by one or more widely recognized market indexes or ratings groupindexes, and/or as defined by Fund management. This definition may not apply for purposes of this report, which may combine industry sub-classifications for reporting ease. Industries are shown as a percentage of net assets.
See Accompanying Notes to Financial Statements.

Statements of Assets and Liabilities
April 30, 2017
See Accompanying Notes to Financial Statements.
16 www.vulcanvaluepartners.com
Vulcan Value Partners
Fund Vulcan Value Partners
Small Cap Fund ASSETS:
Investments, at value $ 1,281,698,834 $ 1,274,590,699 Receivable for investments sold 9,671,812 1,637,343 Receivable for shares sold 113,774 1,885,125 Dividends receivable 2,850,871 1,169,946 Other assets 17,725 15,924
Total assets 1,294,353,016 1,279,299,037
LIABILITIES: Payable for investments purchased 8,422,429 21,684,063 Payable for shares redeemed 63,494 678,187 Payable to adviser 1,058,156 1,155,170 Payable for administration fees 29,990 28,803 Payable for transfer agency fees 14,487 12,397 Payable for delegated transfer agent
equivalent services fees 22,207 60,223 Payable for professional fees 24,657 24,019 Payable for trustee fees and expenses 5,661 5,258 Payable for principal financial officer fees 428 405 Accrued expenses and other liabilities 42,851 44,682
Total liabilities 9,684,360 23,693,207
NET ASSETS $ 1,284,668,656 $ 1,255,605,830
NET ASSETS CONSIST OF:
Paid‐in capital (Note 5) $ 1,133,011,221 $ 1,030,631,433 Accumulated net investment income 5,164,657 1,029,011 Accumulated net realized gain/(loss) (114,597) 69,758,015 Net unrealized appreciation 146,607,375 154,187,371
NET ASSETS $ 1,284,668,656 $ 1,255,605,830
INVESTMENTS, AT COST $ 1,135,116,527 $ 1,120,433,796
PRICING OF SHARES: Net Asset Value, offering and redemption price
per share $ 19.30 $ 20.16 Shares of beneficial interest outstanding
(unlimited number of shares, no par value common stock authorized) 66,572,453 62,287,943

Statements of Operations For the Year Ended April 30, 2017
See Accompanying Notes to Financial Statements.
Annual Report | April 30, 2017 17
Vulcan Value Partners
Fund Vulcan Value Partners
Small Cap Fund INVESTMENT INCOME:
Dividends $ 29,185,696 $ 17,680,593 Foreign taxes withheld (444,865) (616,072)
Total investment income 28,740,831 17,064,521
EXPENSES: Investment advisory fees (Note 6) 13,808,728 13,736,066 Administrative fees 384,471 334,210 Transfer agency fees 139,624 111,534 Delegated transfer agent equivalent
services fees 137,162 349,405 Professional fees 41,296 38,610 Custodian fees 182,760 154,384 Principal financial officer fees 5,349 4,651 Trustee fees and expenses 28,193 25,299 Recoupment of previously waived fees – 88,403 Other 70,180 94,618
Total expenses before waiver 14,797,763 14,937,180 Less fees waived/reimbursed by
investment adviser (Note 6) – (3,407)
Total net expenses 14,797,763 14,933,773
NET INVESTMENT INCOME 13,943,068 2,130,748
Net realized gain on investments 89,828,413(a) 113,977,593 Net realized gain/(loss) on foreign currency
transactions (261,098) 166,422
Net realized gain 89,567,315 114,144,015
Net change in unrealized appreciation of investments 69,367,230 123,753,274
Net change in unrealized appreciation/(depreciation) on translation of assets and liabilities denominated in foreign currencies (53,659) 19,097
Net change in unrealized appreciation 69,313,571 123,772,371
NET REALIZED AND UNREALIZED GAIN ON INVESTMENTS 158,880,886 237,916,386
NET INCREASE IN NET ASSETS RESULTING FROM OPERATIONS $ 172,823,954 $ 240,047,134
(a) See Note 2 for gain/(loss) on In-Kind transactions.

Statements of Changes in Net Assets Vulcan Value Partners Fund
See Accompanying Notes to Financial Statements.
18 www.vulcanvaluepartners.com
For the Year Ended
April 30, 2017
For the Year Ended
April 30, 2016 OPERATIONS:
Net investment income $ 13,943,068 $ 18,348,805 Net realized gain 89,567,315 10,248,578 Net change in unrealized
appreciation/(depreciation) 69,313,571 (154,854,968)
Net increase/(decrease) in net assets resulting from operations 172,823,954 (126,257,585)
DISTRIBUTIONS TO SHAREHOLDERS (Note 3):From net investment income (17,969,116) (12,104,797) From net realized gains on investments – (119,403,152)
Net decrease in net assets from distributions (17,969,116) (131,507,949)
SHARE TRANSACTIONS (Note 5):Proceeds from sales of shares 162,065,966 572,087,701 Issued to shareholders in reinvestment of
distributions 13,362,586 108,659,155 Cost of shares redeemed, net of redemption fees (573,695,164) (665,005,259)
Net increase/(decrease) from share transactions (398,266,612) 15,741,597
Net decrease in net assets (243,411,774) (242,023,937)
NET ASSETS: Beginning of year 1,528,080,430 1,770,104,367
End of year* $ 1,284,668,656 $ 1,528,080,430
*Includes accumulated net investment income of: $ 5,164,657 $ 9,450,857
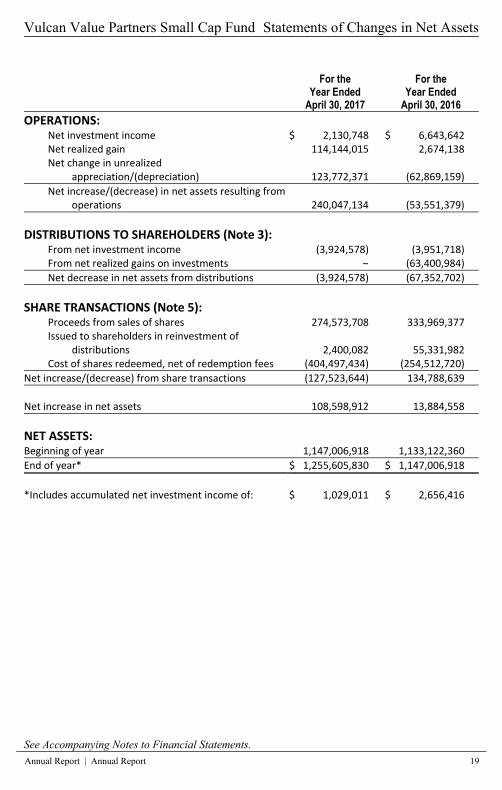
Vulcan Value Partners Small Cap Fund Statements of Changes in Net Assets
See Accompanying Notes to Financial Statements.
Annual Report | Annual Report 19
For the Year Ended
April 30, 2017
For the Year Ended
April 30, 2016 OPERATIONS:
Net investment income $ 2,130,748 $ 6,643,642 Net realized gain 114,144,015 2,674,138 Net change in unrealized
appreciation/(depreciation) 123,772,371 (62,869,159)
Net increase/(decrease) in net assets resulting from operations 240,047,134 (53,551,379)
DISTRIBUTIONS TO SHAREHOLDERS (Note 3):From net investment income (3,924,578) (3,951,718) From net realized gains on investments – (63,400,984)
Net decrease in net assets from distributions (3,924,578) (67,352,702)
SHARE TRANSACTIONS (Note 5):Proceeds from sales of shares 274,573,708 333,969,377 Issued to shareholders in reinvestment of
distributions 2,400,082 55,331,982 Cost of shares redeemed, net of redemption fees (404,497,434) (254,512,720)
Net increase/(decrease) from share transactions (127,523,644) 134,788,639
Net increase in net assets 108,598,912 13,884,558
NET ASSETS: Beginning of year 1,147,006,918 1,133,122,360
End of year* $ 1,255,605,830 $ 1,147,006,918
*Includes accumulated net investment income of: $ 1,029,011 $ 2,656,416

Financial Highlights For a share outstanding throughout the years presented.
See Accompanying Notes to Financial Statements.
20 www.vulcanvaluepartners.com
NET ASSET VALUE, BEGINNING OF PERIOD
INCOME/(LOSS) FROM OPERATIONS:
Net investment income(a)
Net realized and unrealized gain/(loss) on investments
Total from investment operations
LESS DISTRIBUTIONS TO SHAREHOLDERS:
From net investment income
From net realized gains on investments
Total distributions
Redemption fees added to paid‐in capital
Increase/(decrease) in net asset value
NET ASSET VALUE, END OF YEAR
Total return
RATIOS AND SUPPLEMENTAL DATA:
Net assets, end of year (000's)
Ratio of expenses to average net assets without fee waivers/reimbursements
Ratio of expenses to average net assets including fee waivers/reimbursements
Net investment income to average net assets including fee waivers/reimbursements
Portfolio turnover rate
(a) Per share numbers have been calculated using the average shares method. (b) Less than $0.005 per share.
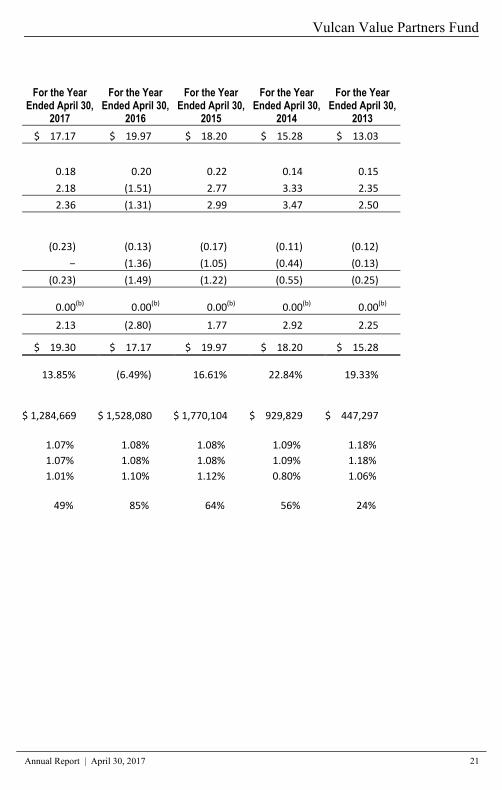
Vulcan Value Partners Fund
Annual Report | April 30, 2017 21
For the Year Ended April 30,
2017
For the Year Ended April 30,
2016
For the Year Ended April 30,
2015
For the Year Ended April 30,
2014
For the Year Ended April 30,
2013
$ 17.17
$ 19.97
$ 18.20 $ 15.28 $ 13.03
0.18
0.20
0.22 0.14 0.15
2.18
(1.51)
2.77 3.33 2.35
2.36
(1.31)
2.99 3.47 2.50
(0.23)
(0.13)
(0.17) (0.11) (0.12)
–
(1.36)
(1.05) (0.44) (0.13)
(0.23)
(1.49)
(1.22) (0.55) (0.25)
0.00(b)
0.00(b)
0.00(b) 0.00(b) 0.00(b)
2.13
(2.80)
1.77 2.92 2.25
$ 19.30
$ 17.17
$ 19.97 $ 18.20 $ 15.28
13.85%
(6.49%)
16.61% 22.84% 19.33%
$ 1,284,669
$ 1,528,080
$ 1,770,104 $ 929,829 $ 447,297
1.07%
1.08%
1.08% 1.09% 1.18%
1.07%
1.08%
1.08% 1.09% 1.18%
1.01%
1.10%
1.12% 0.80% 1.06%
49%
85%
64% 56% 24%
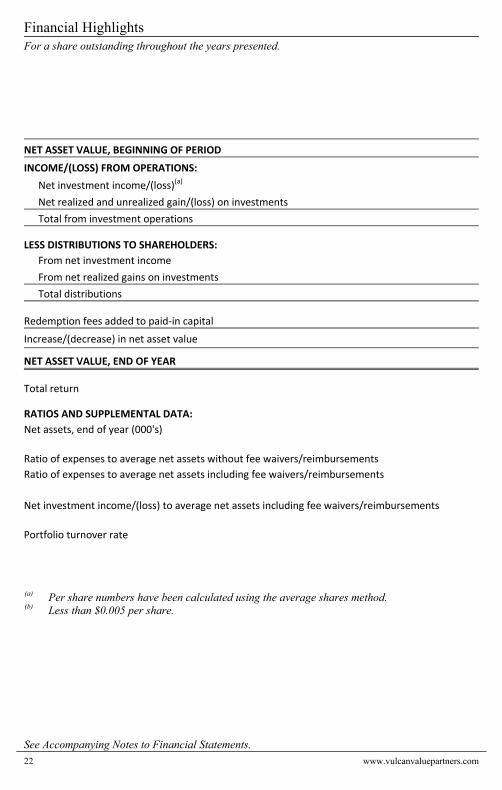
Financial Highlights For a share outstanding throughout the years presented.
See Accompanying Notes to Financial Statements.
22 www.vulcanvaluepartners.com
NET ASSET VALUE, BEGINNING OF PERIOD
INCOME/(LOSS) FROM OPERATIONS:
Net investment income/(loss)(a)
Net realized and unrealized gain/(loss) on investments
Total from investment operations
LESS DISTRIBUTIONS TO SHAREHOLDERS:
From net investment income
From net realized gains on investments
Total distributions
Redemption fees added to paid‐in capital
Increase/(decrease) in net asset value
NET ASSET VALUE, END OF YEAR
Total return
RATIOS AND SUPPLEMENTAL DATA:
Net assets, end of year (000's)
Ratio of expenses to average net assets without fee waivers/reimbursements
Ratio of expenses to average net assets including fee waivers/reimbursements
Net investment income/(loss) to average net assets including fee waivers/reimbursements
Portfolio turnover rate
(a) Per share numbers have been calculated using the average shares method. (b) Less than $0.005 per share.

Vulcan Value Partners Small Cap Fund
Annual Report | April 30, 2017 23
For the Year Ended April 30,
2017
For the Year Ended April 30,
2016
For the Year Ended April 30,
2015
For the Year Ended April 30,
2014
For the Year Ended April 30,
2013
$ 16.58
$ 18.61
$ 18.74 $ 16.97 $ 13.18
0.03
0.10
0.10 (0.01) 0.03
3.61
(1.05)
1.77 2.76 3.91
3.64
(0.95)
1.87 2.75 3.94
(0.06)
(0.06)
(0.11) – (0.06)
–
(1.02)
(1.89) (0.98) (0.09)
(0.06)
(1.08)
(2.00) (0.98) (0.15)
0.00(b)
0.00(b)
0.00(b) 0.00(b) 0.00(b)
3.58
(2.03)
(0.13) 1.77 3.79
$ 20.16
$ 16.58
$ 18.61 $ 18.74 $ 16.97
21.97%
(5.04%)
10.74% 16.11% 30.07%
$ 1,255,606
$ 1,147,007
$ 1,133,122 $ 1,066,246 $ 425,152
1.25%
1.25%
1.26% 1.30% 1.38%
1.25%
1.25%
1.25% 1.25% 1.28%
0.18%
0.61%
0.56% (0.05%) 0.21%
52%
80%
73% 70% 57%
Notes to Financial Statements April 30, 2017
24 www.vulcanvaluepartners.com
1. ORGANIZATION
Financial Investors Trust (the “Trust”) is organized as a Delaware statutory trust and is registered as an open‐end management investment company under the Investment Company Act of 1940, as amended (“1940 Act”). The Trust consists of multiple separate portfolios or series. This annual report describes the Vulcan Value Partners Fund and Vulcan Value Partners Small Cap Fund (each a “Fund” and collectively, the “Funds”). The Funds seek to achieve long‐term capital appreciation.
2. SIGNIFICANT ACCOUNTING POLICIES
The accompanying financial statements were prepared in accordance with accounting principles generally accepted in the United States of America (“U.S. GAAP”), including policies specific to investment companies. The preparation of financial statements in conformity with U.S. GAAP requires management to make certain estimates and assumptions that affect the reported amounts of assets and liabilities and disclosures of contingent assets and liabilities at the date of the financial statements and the reported amounts of revenue and expenses during the period. Actual results could differ from those estimates. The Funds are considered an investment company for financial reporting purposes under U.S. GAAP. The following is a summary of significant accounting policies consistently followed by the Funds in preparation of their financial statements.
Investment Valuation: The Funds generally value their securities based on market prices determined at the close of regular trading on the New York Stock Exchange (“NYSE”), normally 4:00 p.m. Eastern Time, on each day the NYSE is open for trading. For equity securities and mutual funds that are traded on an exchange, the market price is usually the closing sale or official closing price on that exchange. In the case of equity securities not traded on an exchange, or if such closing prices are not otherwise available, the securities are valued at the mean of the most recent bid and ask prices on such day. Redeemable securities issued by open‐end registered investment companies are valued at the investment company’s applicable net asset value, with the exception of exchange‐traded open‐end investment companies, which are priced as equity securities. The market price for debt obligations is generally the quote supplied by an independent third‐party pricing service approved by the Board of Trustees (the “Board”), which may use a matrix, formula or other objective method that takes into consideration quotations from dealers, market transactions in comparable investments, market indices and yield curves. If vendors are unable to supply a quote, or if the quote supplied is deemed to be unreliable, the market price may be determined using quotations received from one or more broker–dealers that make a market in the security. Equity securities that are primarily traded on foreign securities exchanges are valued at the preceding closing values of such securities on their respective exchanges, except when an occurrence subsequent to the time a value was so established is likely to have changed such value. In such an event, the fair values of those securities are determined in good faith through consideration of other factors in accordance with procedures established by and under the general supervision of the Board.
Notes to Financial Statements April 30, 2017
Annual Report | April 30, 2017 25
When such prices or quotations are not available, or when Vulcan Value Partners, LLC (the “Adviser”) believes that they are unreliable, securities may be priced using fair value procedures approved by the Board.
Fair Value Measurements: A three‐tier hierarchy has been established to classify fair value measurements for disclosure purposes. Inputs refer broadly to the assumptions that market participants would use in pricing the asset or liability, including assumptions about risk. Inputs may be observable or unobservable. Observable inputs are inputs that reflect the assumptions market participants would use in pricing the asset or liability that are developed based on market data obtained from sources independent of the reporting entity. Unobservable inputs are inputs that reflect the reporting entity’s own assumptions about the assumptions market participants would use in pricing the asset or liability that are developed based on the best information available. Various inputs are used in determining the value of each Fund’s investments as of the reporting period end. The designated input levels are not necessarily an indication of the risk or liquidity associated with these investments. These inputs are categorized in the following hierarchy under applicable financial accounting standards: Level 1 – Unadjusted quoted prices in active markets for identical investments, unrestricted assets
or liabilities that the Funds have the ability to access at the measurement date; Level 2 – Quoted prices which are not active, quoted prices for similar assets or liabilities in active
markets or inputs other than quoted prices that are observable (either directly orindirectly) for substantially the full term of the asset or liability; and
Level 3 – Significant unobservable prices or inputs (including the Funds’ own assumptions indetermining the fair value of investments) where there is little or no market activity forthe asset or liability at the measurement date.
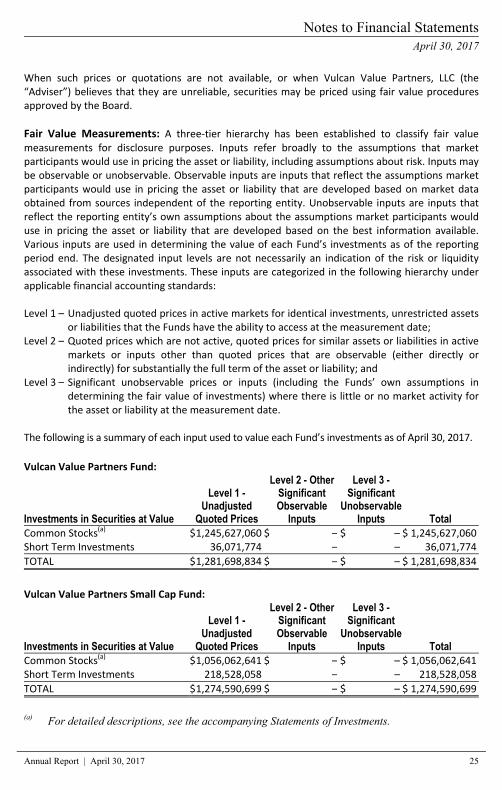
The following is a summary of each input used to value each Fund’s investments as of April 30, 2017.
Vulcan Value Partners Fund:
Investments in Securities at Value
Level 1 - Unadjusted
Quoted Prices
Level 2 - Other Significant Observable
Inputs
Level 3 - Significant
Unobservable Inputs Total
Common Stocks(a) $1,245,627,060 $ – $ – $ 1,245,627,060 Short Term Investments 36,071,774 – – 36,071,774
TOTAL $1,281,698,834 $ – $ – $ 1,281,698,834
Vulcan Value Partners Small Cap Fund:
Investments in Securities at Value
Level 1 - Unadjusted
Quoted Prices
Level 2 - Other Significant Observable
Inputs
Level 3 - Significant
Unobservable Inputs Total
Common Stocks(a) $1,056,062,641 $ – $ – $ 1,056,062,641 Short Term Investments 218,528,058 – – 218,528,058
TOTAL $1,274,590,699 $ – $ – $ 1,274,590,699
(a) For detailed descriptions, see the accompanying Statements of Investments.

Notes to Financial Statements April 30, 2017
26 www.vulcanvaluepartners.com
The Funds recognize transfers between levels as of the end of period. For the year ended April 30, 2017, the Funds did not have any transfers between Level 1 and Level 2. For the year ended April 30, 2017, the Funds did not have any securities that used significant unobservable inputs (Level 3) in determining fair value.
Investment Transactions and Investment Income: Investment transactions are accounted for on the date the investments are purchased or sold (trade date). Realized gains and losses from investment transactions are reported on an identified cost basis, which is the same basis the Funds use for federal income tax purposes. Interest income, which includes accretion of discounts and amortization of premiums, is accrued and recorded as earned. Dividend income is recognized on the ex‐dividend date or for certain foreign securities, as soon as information is available to the Funds. All of the realized and unrealized gains and losses and net investment income, are allocated daily to each class in proportion to its average daily net assets.
ReFlow Liquidity Program: Each Fund may participate in the ReFlow liquidity program, which is designed to provide an alternative liquidity source for mutual funds experiencing net redemptions of their shares. Pursuant to the program, ReFlow Fund, LLC (“ReFlow”) provides participating mutual funds with a source of cash to meet net shareholder redemptions by standing ready each business day to purchase fund shares up to the value of the net shares redeemed by other shareholders that are to settle the next business day. ReFlow will purchase shares of the Fund at net asset value and will not be subject to any investment minimums. Following purchases of Fund shares, ReFlow then generally redeems those shares when the Fund experiences net subscriptions, at the end of a maximum holding period determined by ReFlow (currently 28 days), or at other times as the Fund may request. ReFlow may choose to redeem its position in the Fund with an in‐kind transfer of securities, instead of cash, enabling the Fund to avoid a realization of capital gains on the securities it transfers. ReFlow will not be subject to any short‐term redemption fees. While ReFlow holds Fund shares, it will have the same rights and privileges with respect to those shares as any other shareholder. For use of the ReFlow service, a Fund pays a fee to ReFlow each time it purchases Fund shares, calculated by applying to the purchase amount a fee rate determined through an automated daily auction among participating mutual funds. The current minimum fee rate is 0.20% of the value of the Fund shares purchased by ReFlow although the Fund may submit a bid at a higher fee rate if it determines that doing so is in the best interest of Fund shareholders. In accordance with federal securities laws, ReFlow is prohibited from acquiring more than 3% of the outstanding voting securities of a Fund. There is no assurance that ReFlow will have sufficient funds available to meet the Funds’ liquidity needs on a particular day. During the fiscal year ended April 30, 2017, the Funds did not participate in ReFlow.
Real Estate Investment Trusts (“REITs”): The Funds may invest a portion of their assets in REITs and are subject to certain risks associated with direct investment in REITs. REITs may be affected by changes in the value of their underlying properties and by defaults by borrowers or tenants. REITs depend generally on their ability to generate cash flow to make distributions to shareowners, and certain REITs have self‐liquidation provisions by which mortgages held may be paid in full and distributions of capital returns may be made at any time. In addition, the performance of a REIT may be affected by its failure to qualify for tax‐free pass‐through of income under the Internal Revenue Code of 1986, as amended (the “Code”), or its failure to maintain exemption from registration under the 1940 Act. A Fund’s investments in REITs may result in such Fund’s receipt of cash in excess of the REITs’ earnings. If the Fund receives such distributions all or a portion of these distributions will constitute a return of capital to such Fund. Receiving a return

Notes to Financial Statements April 30, 2017
Annual Report | April 30, 2017 27
of capital distribution from REITs will reduce the amount of income available to be distributed to Fund shareholders. Income from REITs generally will not be eligible for treatment as qualified dividend income. As the final character of the distributions is not known until reported by the REITs on their 1099s, the Funds utilize an average of the prior year’s reallocation information as an estimate for the current year character of distributions.
Foreign Securities: The Funds may directly purchase securities of foreign issuers. Investing in securities of foreign issuers involves special risks not typically associated with investing in securities of U.S. issuers. The risks include possible reevaluation of currencies, the inability to repatriate foreign currency, less complete financial information about companies and possible future adverse political and economic developments. Moreover, securities of many foreign issuers and their markets may be less liquid and their prices more volatile than those of securities of comparable U.S. issuers. Foreign Currency Translation: The books and records of the Funds are maintained in U.S. dollars. Investment valuations and other assets and liabilities initially expressed in foreign currencies are converted each business day into U.S. dollars based upon current exchange rates. Prevailing foreign exchange rates may generally be obtained at the close of the NYSE (normally, 4:00 p.m. Eastern Time). The portion of realized and unrealized gains or losses on investments due to fluctuations in foreign currency exchange rates is not separately disclosed and is included in realized and unrealized gains or losses on investments, when applicable. In‐Kind Redemptions: On January 6, 2017, the Vulcan Value Partners Fund distributed portfolio securities rather than cash as payment for certain redemptions of fund shares (in‐kind redemptions). The proceeds for the in‐kind redemptions, which are included in Redemption of shares in the Statements of Changes in Net Assets, were $156,578,655 and represented 12.53% of the Fund’s net assets on January 6, 2017. For financial reporting purposes, the Fund recognized gains on the in‐kind redemptions in the amount of $40,538,262. For tax purposes, the gains are not recognized.
Trust Expenses: Some expenses of the Trust can be directly attributed to the Funds. Expenses which cannot be directly attributed are apportioned among all funds in the Trust based on average net assets of each fund.
Fund Expenses: Expenses that are specific to a Fund are charged directly to that Fund.
Federal Income Taxes: Each Fund complies with the requirements under Subchapter M of the Internal Revenue Code of 1986, as amended, applicable to regulated investment companies and intends to distribute substantially all of its net taxable income and net capital gains, if any, each year so that it will not be subject to excise tax on undistributed income and gains. The Funds are not subject to income taxes to the extent such distributions are made. As of and during the year ended April 30, 2017, the Funds did not have a liability for any unrecognized tax benefits. The Funds file U.S. federal, state, and local tax returns as required. The Fund’s tax returns are subject to examination by the relevant tax authorities until expiration of the applicable statute of limitations, which is generally three years after the filing of the tax return for

Notes to Financial Statements April 30, 2017
28 www.vulcanvaluepartners.com
federal purposes and four years for most state returns. Tax returns for open years have incorporated no uncertain tax positions that require a provision for income taxes.
Distributions to Shareholders: Each Fund normally pays dividends and distributes capital gains, if any, on an annual basis. Income dividend distributions are derived from dividends and other income each Fund receives from its investments, including short‐term capital gains. Long term capital gain distributions are derived from gains realized when each Fund sells a security it has owned for more than a year. Each Fund may make additional distributions and dividends at other times if the portfolio manager believes doing so may be necessary for each Fund to avoid or reduce taxes.
3. TAX BASIS INFORMATION
Reclassifications: As of April 30, 2017, permanent differences in book and tax accounting were
reclassified. These differences had no effect on net assets and were primarily attributed to foreign currency transactions and in‐kind redemptions. The reclassifications were as follows:
Fund Paid-in Capital
Accumulated Net Investment
Income
Accumulated Net Realized
Gain/(Loss) on Investments
Vulcan Value Partners Fund $ 40,523,870 $ (260,152) $ (40,263,718) Vulcan Value Partners Small Cap Fund – 166,425 (166,425)
Tax Basis of Investments: As of April 30, 2017, the aggregate cost of investments, gross unrealized appreciation/ (depreciation) and net unrealized appreciation for federal tax purposes was as follows:
Vulcan Value Partners
Fund Vulcan Value Partners
Small Cap Fund Gross appreciation
(excess of value over tax cost) $ 256,298,879 $ 245,193,969 Gross depreciation
(excess of tax cost over value) (124,358,200) (91,844,553) Net appreciation of foreign currency and
derivatives 25,068 30,468
Net unrealized appreciation $ 131,965,747 $ 153,379,884
Cost of investments for income tax purposes $ 1,149,758,155 $ 1,121,241,283
Notes to Financial Statements April 30, 2017
Annual Report | April 30, 2017 29
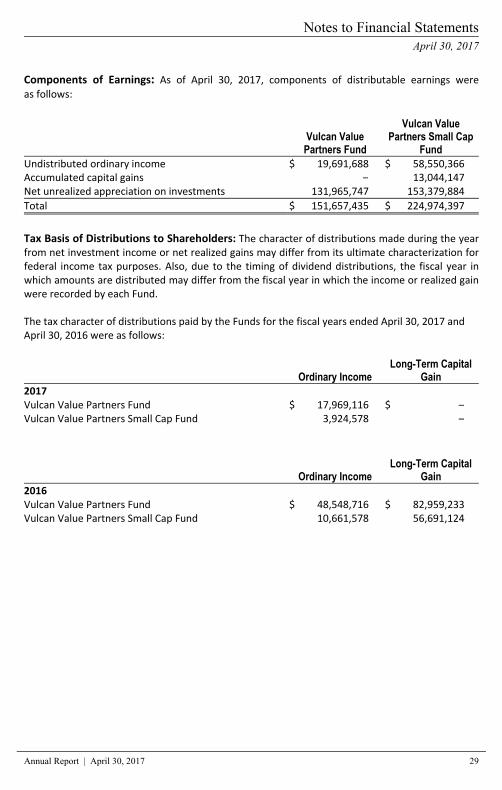
Components of Earnings: As of April 30, 2017, components of distributable earnings were
as follows:
Vulcan Value Partners Fund
Vulcan Value Partners Small Cap
Fund Undistributed ordinary income $ 19,691,688 $ 58,550,366 Accumulated capital gains – 13,044,147 Net unrealized appreciation on investments 131,965,747 153,379,884
Total $ 151,657,435 $ 224,974,397
Tax Basis of Distributions to Shareholders: The character of distributions made during the year from net investment income or net realized gains may differ from its ultimate characterization for federal income tax purposes. Also, due to the timing of dividend distributions, the fiscal year in which amounts are distributed may differ from the fiscal year in which the income or realized gain were recorded by each Fund. The tax character of distributions paid by the Funds for the fiscal years ended April 30, 2017 and April 30, 2016 were as follows:
Ordinary Income Long-Term Capital
Gain 2017 Vulcan Value Partners Fund $ 17,969,116 $ – Vulcan Value Partners Small Cap Fund 3,924,578 –
Ordinary Income Long-Term Capital
Gain 2016 Vulcan Value Partners Fund $ 48,548,716 $ 82,959,233 Vulcan Value Partners Small Cap Fund 10,661,578 56,691,124
Notes to Financial Statements April 30, 2017
30 www.vulcanvaluepartners.com
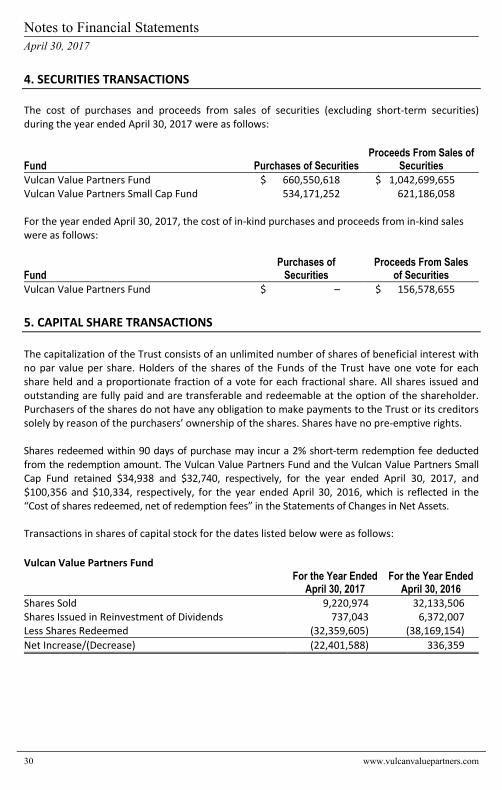
4. SECURITIES TRANSACTIONS The cost of purchases and proceeds from sales of securities (excluding short‐term securities) during the year ended April 30, 2017 were as follows:
Fund Purchases of Securities Proceeds From Sales of
Securities Vulcan Value Partners Fund $ 660,550,618 $ 1,042,699,655 Vulcan Value Partners Small Cap Fund 534,171,252 621,186,058 For the year ended April 30, 2017, the cost of in‐kind purchases and proceeds from in‐kind sales were as follows:
Fund Purchases of
Securities Proceeds From Sales
of Securities Vulcan Value Partners Fund $ – $ 156,578,655
5. CAPITAL SHARE TRANSACTIONS
The capitalization of the Trust consists of an unlimited number of shares of beneficial interest with no par value per share. Holders of the shares of the Funds of the Trust have one vote for each share held and a proportionate fraction of a vote for each fractional share. All shares issued and outstanding are fully paid and are transferable and redeemable at the option of the shareholder. Purchasers of the shares do not have any obligation to make payments to the Trust or its creditors solely by reason of the purchasers’ ownership of the shares. Shares have no pre‐emptive rights. Shares redeemed within 90 days of purchase may incur a 2% short‐term redemption fee deducted from the redemption amount. The Vulcan Value Partners Fund and the Vulcan Value Partners Small Cap Fund retained $34,938 and $32,740, respectively, for the year ended April 30, 2017, and $100,356 and $10,334, respectively, for the year ended April 30, 2016, which is reflected in the “Cost of shares redeemed, net of redemption fees” in the Statements of Changes in Net Assets. Transactions in shares of capital stock for the dates listed below were as follows:
Vulcan Value Partners Fund
For the Year Ended
April 30, 2017 For the Year Ended
April 30, 2016 Shares Sold 9,220,974 32,133,506 Shares Issued in Reinvestment of Dividends 737,043 6,372,007 Less Shares Redeemed (32,359,605) (38,169,154)
Net Increase/(Decrease) (22,401,588) 336,359

Notes to Financial Statements April 30, 2017
Annual Report | April 30, 2017 31
Vulcan Value Partners Small Cap Fund
For the Year Ended
April 30, 2017 For the Year Ended
April 30, 2016 Shares Sold 15,271,480 20,302,249 Shares Issued in Reinvestment of Dividends 125,989 3,358,435 Less Shares Redeemed (22,299,640) (15,350,234)
Net Increase/(Decrease) (6,902,171) 8,310,450
6. MANAGEMENT AND RELATED‐PARTY TRANSACTIONS
The Adviser, subject to the authority of the Board, is responsible for the overall management and administration of the Funds’ business affairs. The Adviser manages the investments of the Funds in accordance with each Fund’s investment objective, policies and limitations and investment guidelines established jointly by the Adviser and the Board. Pursuant to the Investment Advisory Agreement (the “Advisory Agreement”), the Funds pay the Adviser an annual management fee of 1.00% and 1.15% for Vulcan Value Partners Fund and Vulcan Value Partners Small Cap Fund, respectively, based on each Fund’s average daily net assets. The management fee is paid on a monthly basis. The Adviser has contractually agreed to limit the Fund’s total annual fund operating expenses (exclusive of acquired fund fees and expenses, brokerage expenses, interest expense, taxes and extraordinary expenses) to 1.25% of each Fund’s average daily net assets. This agreement (the “Expense Agreement”) is in effect from September 1, 2016 through August 31, 2017. The prior Expense Agreement was in effect from June 10, 2015 through August 31, 2016. The Adviser will be permitted to recover, on a class‐by‐class basis, expenses it has borne through the Expense Agreement to the extent that a Fund’s expenses in later periods fall below the expense cap in effect at the time of waiver or reimbursement. Notwithstanding the foregoing, the Funds will not be obligated to pay any such fees and expenses more than three years after the end of the fiscal year in which the fees or expenses were foregone or reimbursed. The Adviser may not discontinue or modify this waiver prior to August 31, 2017 without the approval by the Funds’ Board. For the year ended April 30, 2017, the fee waivers and/or reimbursements and recoupment amounts were as follows:
Fund Fees Waived/Reimbursed
By Adviser Recoupment of Previously
Waived Fees by Adviser Vulcan Value Partners Fund $ – $ – Vulcan Value Partners Small Cap Fund 3,407 88,403
As of April 30, 2017, the balances of recoupable expenses for each Fund were as follows:
Fund Expires 2018 Expires 2019 Expires 2020 Total Vulcan Value Partners Fund $ – $ – $ – $ – Vulcan Value Partners Small Cap Fund 79,989 – 3,407 83,396

Notes to Financial Statements April 30, 2017
32 www.vulcanvaluepartners.com
Fund Administrator Fees and Expenses: ALPS Fund Services, Inc. (“ALPS”) serves as administrator to the Funds and the Funds have agreed to pay expenses incurred in connection with their administrative activities. Pursuant to an Administration Agreement, ALPS provides operational services to the Funds including, but not limited to fund accounting and fund administration and generally assist in each Fund’s operations. Officers of the Trust are employees of ALPS. The Funds’ administration fee is accrued on a daily basis and paid monthly. Administration fees paid by the Funds for the year ended April 30, 2017 are disclosed in the Statements of Operations. ALPS is reimbursed by the Funds for certain out‐of‐pocket expenses.
Transfer Agent: ALPS serves as transfer, dividend paying and shareholder servicing agent for the Funds. ALPS receives an annual minimum fee, a fee based upon the number of shareholder accounts, and is also reimbursed by the Funds for certain out‐of‐pocket expenses. Transfer agent fees paid by the Funds for the year ended April 30, 2017 are disclosed in the Statements of Operations.
Compliance Services: ALPS provides services that assist the Trust’s chief compliance officer in monitoring and testing the policies and procedures of the Trust in conjunction with requirements under Rule 38a‐1 under the 1940 Act and receives an annual base fee. ALPS is reimbursed for certain out‐of‐pocket expenses by the Funds. Vulcan pays this fee on behalf of the Funds.
Principal Financial Officer: ALPS Fund Services, Inc. (“ALPS” and the “Administrator”) (an affiliate of ADI) receives an annual fee for providing principal financial officer services to the Funds. Principal financial officer fees paid by the Fund for the year ended April 30, 2017 are disclosed in the Statements of Operations.
Distributor: ALPS Distributors, Inc. (“ADI” or the “Distributor”) (an affiliate of ALPS Fund Services, Inc.) acts as the distributor of each Fund’s shares pursuant to a Distribution Agreement with the Trust. Shares are sold on a continuous basis by ADI as agent for the Funds, and ADI has agreed to use its best efforts to solicit orders for the sale of each Fund’s shares, although it is not obliged to sell any particular amount of shares. ADI is not entitled to any compensation for its services as Distributor. ADI is registered as a broker‐dealer with the U.S. Securities and Exchange Commission. Certain intermediaries may charge networking, omnibus account or other administrative fees with respect to transactions in shares of the Funds. Transactions may be processed through the National Securities Clearing Corporation (“NSCC”) or similar systems or processed on a manual basis. These fees are paid by the Funds to the Distributor, which uses such fees to reimburse intermediaries. In the event an intermediary receiving payments from the Distributor on behalf of the Funds converts from a networking structure to an omnibus account structure or otherwise experiences increased costs, fees borne by the Funds may increase. Fees are disclosed on the Statements of Operations as “Delegated transfer agent equivalent services fees”.
7. INDEMNIFICATIONS
Under the Trust’s organizational documents, its Officers and Trustees are indemnified against certain liability arising out of the performance of their duties to the Trust. Additionally, in the normal course of business, the Trust enters into contracts with service providers that may contain
Notes to Financial Statements April 30, 2017
Annual Report | April 30, 2017 33
general indemnification clauses which may permit indemnification to the extent permissible under applicable law. The Trust’s maximum exposure under these arrangements is unknown, as this would involve future claims that may be made against the Trust that have not yet occurred.
8. RECENT ACCOUNTING PRONOUNCEMENT On October 13, 2016, the SEC amended Regulation S‐X, which will require standardized, enhanced disclosure about derivatives in investment company financial statements, as well as other amendments. The compliance date for the amendments to Regulation S‐X is August 1, 2017. Management is currently evaluating the impact to the financial statements and disclosures.
Report of Independent Registered Public Accounting Firm
34 www.vulcanvaluepartners.com
To the Shareholders and Board of Trustees of Financial Investors Trust: We have audited the accompanying statements of assets and liabilities, including the statements of investments, of Vulcan Value Partners Fund and Vulcan Value Partners Small Cap Fund (the “Funds”), two of the portfolios constituting Financial Investors Trust, as of April 30, 2017, and the related statements of operations for the year then ended, the statements of changes in net assets for each of the two years in the period then ended, and the financial highlights for each of the five years in the period then ended. These financial statements and financial highlights are the responsibility of the Funds’ management. Our responsibility is to express an opinion on these financial statements and financial highlights based on our audits. We conducted our audits in accordance with the standards of the Public Company Accounting Oversight Board (United States). Those standards require that we plan and perform the audit to obtain reasonable assurance about whether the financial statements and financial highlights are free of material misstatement. The Funds are not required to have, nor were we engaged to perform, an audit of their internal control over financial reporting. Our audits included consideration of internal control over financial reporting as a basis for designing audit procedures that are appropriate in the circumstances, but not for the purpose of expressing an opinion on the effectiveness of the Funds’ internal control over financial reporting. Accordingly, we express no such opinion. An audit also includes examining, on a test basis, evidence supporting the amounts and disclosures in the financial statements, assessing the accounting principles used and significant estimates made by management, as well as evaluating the overall financial statement presentation. Our procedures included confirmation of securities owned as of April 30, 2017, by correspondence with the custodian and brokers; when replies were not received from brokers, we performed other auditing procedures. We believe that our audits provide a reasonable basis for our opinion. In our opinion, the financial statements and financial highlights referred to above present fairly, in all material respects, the financial position of Vulcan Value Partners Fund and Vulcan Value Partners Small Cap Fund of Financial Investors Trust as of April 30, 2017, the results of their operations for the year then ended, the changes in their net assets for each of the two years in the period then ended, and the financial highlights for each of the five years in the period then ended, in conformity with accounting principles generally accepted in the United States of America. DELOITTE & TOUCHE LLP Denver, Colorado June 27, 2017

Disclosure Regarding Approval of Fund Advisory Agreements April 30, 2017 (Unaudited)
Annual Report | April 30, 2017 35
Vulcan Value Partners Fund Vulcan Value Partners Small Cap Fund On December 13, 2016, the Trustees met in person to discuss, among other things, the approval of the investment advisory agreement between the Trust and the Adviser (the “Investment Advisory Agreement”), in accordance with Section 15(c) of the 1940 Act. In renewing and approving the Investment Advisory Agreement, the Trustees, including the Independent Trustees, considered the following factors with respect to the Funds:
Investment Advisory Fee Rate: The Trustees reviewed and considered the contractual annual advisory fee paid by the Trust, on behalf of the Funds, to the Adviser of 1.00% of the Vulcan Value Partners Fund’s daily average net assets and 1.15% of the Vulcan Value Partners Small Cap Fund’s daily average net assets, in light of the extent and quality of the advisory services provided by the Adviser to the Funds. The Board received and considered information including a comparison of each of the Fund’s contractual and actual advisory fees and overall expenses with those of funds in the peer groups and universes of funds provided by an independent provider of investment company data (the “Data Provider”). The Trustees noted that the contractual advisory fee rates for both Funds were above the respective Data Provider peer group median contractual advisory fee rates.
Total Expense Ratios: Based on such information, the Trustees further reviewed and considered the total expense ratios (after waivers) of 1.08% for the Vulcan Value Partners Fund and 1.25% for the Vulcan Value Partners Small Cap Fund. The Trustees noted that each of the Fund’s total expense ratios (after waivers) were above the Data Provider peer group median total expense ratios (after waivers).
Nature, Extent, and Quality of the Services under the Investment Advisory Agreement: The Trustees received and considered information regarding the nature, extent, and quality of services to be provided to the Funds under the Investment Advisory Agreement. The Trustees reviewed certain background materials supplied by the Adviser in its presentation, including its Form ADV. The Trustees reviewed and considered the Adviser’s investment advisory personnel, its history as an asset manager, and its performance and the amount of assets currently under management by the Adviser and its affiliated entities. The Trustees also reviewed the research and decision‐making processes utilized by the Adviser, including the methods adopted to seek to achieve compliance with the investment objectives, policies, and restrictions of the Funds. The Trustees considered the background and experience of the Adviser’s management in connection with the Funds, including reviewing the qualifications, backgrounds, and responsibilities of the management team primarily responsible for the day‐to‐day portfolio management of the Funds and the extent of the resources devoted to research and analysis of actual and potential investments. The Trustees also reviewed, among other things, the Adviser’s insider trading policies and procedures and its Code of Ethics.
Disclosure Regarding Approval of Fund Advisory Agreements April 30, 2017 (Unaudited)
36 www.vulcanvaluepartners.com
Performance: The Trustees reviewed performance information for each of the Funds for the 3‐month, 1‐year, 3‐year, and 5‐year periods ended September 30, 2016. That review included a comparison of each Fund’s performance to the performance of a group of comparable funds selected by the Data Provider. The Trustees noted that the performance of each Fund was above its respective Data Provider peer group median performance for the 3‐month and 5‐year periods ended September 30, 2016. The Trustees also considered the Adviser’s discussion of each Fund’s underlying portfolio diversification categories, its top contributors and top detractors, as well as the Adviser’s performance and reputation generally and its investment techniques, risk management controls, and decision‐making processes.
Comparable Accounts: The Trustees noted certain information provided by the Adviser regarding fees charged to its other clients utilizing a strategy similar to that employed by the Funds.
Profitability: The Trustees received and considered a retrospective and projected profitability analysis prepared by the Adviser based on the fees payable under the Investment Advisory Agreement with respect to each Fund. The Trustees considered the profits, if any, anticipated to be realized by the Adviser in connection with the operation of each Fund. The Board then reviewed the Adviser’s audited financial statements for the years ended December 31, 2015 and 2014 in order to analyze the financial condition and stability and profitability of the Adviser.
Economies of Scale: The Trustees considered whether economies of scale in the provision of services to the Funds will be passed along to the shareholders under the proposed agreements.
Other Benefits to the Adviser: The Trustees reviewed and considered any other incidental benefits derived or to be derived by the Adviser from its relationship with the Funds, including whether soft dollar arrangements were used. In renewing the Adviser as the Funds’ investment adviser and renewing the Investment Advisory Agreement and the fees charged under the Investment Advisory Agreement, the Trustees concluded that no single factor reviewed by the Trustees was identified by the Trustees to be determinative as the principal factor in whether to renew the Investment Advisory Agreement. Further, the Independent Trustees were advised by separate independent legal counsel throughout the process. The Trustees, including all of the Independent Trustees, concluded that:
each Fund’s contractual advisory fee rate was above its Data Provider peer group median contractual advisory fee rate;
each Fund’s total expense ratio (after waivers) was above, but within an acceptable range of, its Data Provider peer group median total expense ratio (after waivers);
the nature, extent and quality of services rendered by the Adviser under the Investment Advisory Agreement with respect to the Funds were adequate;
the performance of each Fund was above its Data Provider median peer group performance for the 3‐month and 5‐year periods ended September 30, 2016;
bearing in mind the limitations of comparing different types of managed accounts and the different levels of service typically associated with such accounts, the fee structures
Disclosure Regarding Approval of Fund Advisory Agreements April 30, 2017 (Unaudited)
Annual Report | April 30, 2017 37
applicable to the Adviser’s other clients employing a comparable strategy to one or more of the Funds were not indicative of any unreasonableness with respect to the advisory fees proposed to be payable by the Funds;
the profit, if any, realized by the Adviser in connection with the operation of each Fund is not unreasonable to such Fund; and
there were no material economies of scale or other incidental benefits accruing to the Adviser in connection with its relationship with the Funds.
Based on the Trustees’ deliberations and their evaluation of the information described above, the Trustees, including all of the Independent Trustees, concluded that the Adviser’s compensation for investment advisory services is consistent with the best interests of the Funds and their shareholders.

Additional Information April 30, 2017 (Unaudited)
38 www.vulcanvaluepartners.com
1. FUND HOLDINGS The Funds files their complete schedule of portfolio holdings with the Securities and Exchange Commission (the “SEC”) for the first and third quarters of each fiscal year on Form N-Q within 60 days after the end of the period. Copies of the Funds’ Form N-Q are available without charge on the SEC website at http://www.sec.gov. You may also review and copy the Form N-Q at the SEC’s Public Reference Room in Washington, DC. For more information about the operation of the Public Reference Room, please call the SEC at 1-800-SEC-0330.
2. FUND PROXY VOTING POLICIES, PROCEDURES AND SUMMARIES The Funds’ policies and procedures used in determining how to vote proxies and information regarding how the Fund voted proxies relating to portfolio securities during the most recent prior 12‐month period ending June 30 are available without charge, (1) upon request, by calling (toll‐free) (866)‐759‐5679 and (2) on the SEC’s website at http://www.sec.gov.
3. TAX DESIGNATIONS The Funds designate the following for federal income tax purposes for the calendar year ended December 31, 2016:
Qualified Dividend
Income Dividend Received
Deduction Vulcan Value Partners Fund 100.00% 100.00% Vulcan Value Partners Small Cap Fund 100.00% 100.00%
In early 2017, if applicable, shareholders of record received this information for the distributions paid to them by the Fund during the calendar year 2016 via Form 1099. The Fund will notify shareholders in early 2018 of amounts paid to them by the Fund, if any, during the calendar year 2017.

Trustees and Officers April 30, 2017 (Unaudited)
Annual Report | April 30, 2017 39
Additional information regarding the Fund’s trustees is included in the Statement of Additional Information, which can be obtained without charge by calling 877‐421‐5078.
INDEPENDENT TRUSTEES
Name, Address*
& Year of Birth
Position(s) Held with
Fund
Term of Office** and
Length of Time Served
Principal Occupation(s) During Past 5 Years***
Number of Funds in
Fund Complex Overseen
by Trustee****
Other Directorships
Held by Trustee During Past 5 Years***
Mary K. Anstine, 1940
Trustee and Chairman
Ms. Anstine was elected at a special meeting of shareholders held on March 21, 1997 and re‐elected at a special meeting of shareholders held on August 7, 2009. Ms, Astine was appointed Chairman of the Board at the June 6, 2017 meeting of the Board of Trustees.
Ms. Anstine was formerly an Executive Vice President of First Interstate Bank of Denver until 1994, President/Chief Executive Officer of HealthONE Alliance, Denver, Colorado, from 1994 to 2004, and has been retired since 2004. Ms. Anstine is also Trustee/Director of AV Hunter Trust and Colorado Uplift Board. Ms. Anstine was formerly a Director of the Trust Bank of Colorado (later purchased and now known as Northern Trust Bank), HealthONE and Denver Area Council of the Boy Scouts of America, and a member of the American Bankers Association Trust Executive Committee.
34 Ms. Anstine is a Trustee of ALPS ETF Trust (20 funds); ALPS Variable Investment Trust (9 funds); Reaves Utility Income Fund (1 fund); and Westcore Trust (14 funds).
Jeremy W. Deems, 1976
Trustee Mr. Deems was appointed as a Trustee at the March 11, 2008 meeting of the Board of Trustees and elected at a special meeting of shareholders held on August 7, 2009.
Mr. Deems is the Co‐Founder, Chief Operations Officer and Chief Financial Officer of Green Alpha Advisors, LLC, a registered investment advisor, and Co‐Portfolio Manager of the Shelton Green Alpha Fund. Prior to joining Green Alpha Advisors, Mr. Deems was CFO and Treasurer of Forward Management, LLC, ReFlow Management Co., LLC, ReFlow Fund, LLC, a private investment fund, and Sutton Place Management, LLC, an administrative services company, from 1998 to June 2007. From 2004 to 2005, Mr. Deems also served as Treasurer of the Forward Funds and the Sierra Club Funds.
34 Mr. Deems is a Trustee of ALPS ETF Trust (21 funds); ALPS Variable Investment Trust (10 funds); Clough Funds Trust (1 fund); Elevation ETF Trust (1 fund); and Reaves Utility Income Fund (1 fund).

Trustees and Officers April 30, 2017 (Unaudited)
40 www.vulcanvaluepartners.com
INDEPENDENT TRUSTEES (continued)
Name, Address*
& Year of Birth
Position(s) Held with
Fund
Term of Office** and
Length of Time Served
Principal Occupation(s) During Past 5 Years***
Number of Funds in
Fund Complex Overseen
by Trustee****
Other Directorships
Held by Trustee During Past 5 Years***
Jerry G. Rutledge, 1944
Trustee Mr. Rutledge was elected at a special meeting of shareholders held on August 7, 2009.
Mr. Rutledge is the President and owner of Rutledge’s Inc., a retail clothing business. Mr. Rutledge is currently Director of the American National Bank. He was from 1994 to 2007 a Regent of the University of Colorado.
34 Mr. Rutledge is a Trustee of Principal Real Estate Income Fund (1 fund) Clough Global Dividend and Income Fund (1 fund), Clough Global Equity Fund (1 fund) and Clough Global Opportunities Fund (1 fund).
Michael “Ross” Shell, 1970
Trustee Mr. Shell was elected at a special meeting of shareholders held on August 7, 2009.
Mr. Shell is Founder and CEO of Red Idea, LLC, a strategic consulting/early stage venture firm (since June 2008). From 1999 to 2009, he was a part‐owner and Director of Tesser, Inc., a brand agency. From December 2005 to May 2008, he was Director, Marketing and Investor Relations, of Woodbourne, a REIT/real estate hedge fund and private equity firm. Prior to this, from May 2004 to November 2005, he worked as a business strategy consultant; from June 2003 to April 2004, he was on the Global Client Services team of IDEO, a product design/innovation firm; and from 1999 to 2003, he was President of Tesser, Inc. Mr. Shell graduated with honors from Stanford University with a degree in Political Science.
34 None.
Trustees and Officers April 30, 2017 (Unaudited)
Annual Report | April 30, 2017 41
INTERESTED TRUSTEE
Name, Address* & Year of
Birth
Position(s) Held with
Fund
Term of Office** and
Length of Time Served
Principal Occupation(s) During Past 5 Years***
Number of Funds in
Fund Complex Overseen
by Trustee****
Other Directorships
Held by Trustee During Past 5 Years***
Edmund J. Burke, 1961
Trustee and President
Mr. Burke was elected as Trustee at a special meeting of shareholders held on August 7, 2009. Mr. Burke was elected President of the Trust at the December 17, 2002 meeting of the Board of Trustees.
Mr. Burke is President and a Director of ALPS Holdings, Inc. (“AHI”) (since 2005) and Director of Boston Financial Data Services, Inc. (“BFDS”), ALPS Advisors, Inc. (“AAI”), ALPS Distributors, Inc. (“ADI”), ALPS Fund Services, Inc. (“AFS”) and ALPS Portfolio Solutions Distributor, Inc. (“APSD”) and from 2001‐2008, was President of AAI, ADI, AFS and APSD. Because of his positions with AHI, BFDS, AAI, ADI, AFS and APSD, Mr. Burke is deemed an affiliate of the Trust as defined under the 1940 Act.
34 Mr. Burke is a Trustee of Clough Global Dividend and Income Fund (1 fund); Clough Global Equity Fund (1 fund); Clough Global Opportunities Fund (1 fund); Clough Funds Trust (1 fund); Liberty All‐Star Equity Fund (1 fund); and Director of the Liberty All‐Star Growth Fund, Inc. (1 fund).

Trustees and Officers April 30, 2017 (Unaudited)
42 www.vulcanvaluepartners.com
OFFICERS
Name, Address*
& Year of Birth
Position(s) Held with
Fund
Term of Office** and Length of Time Served Principal Occupation(s) During Past 5 Years***
Kimberly R. Storms, 1972
Treasurer Ms. Storms was elected Treasurer of the Trust at the March 12, 2013 meeting of the Board of Trustees.
Ms. Storms is Senior Vice President ‐ Director of Fund Administration of ALPS. Because of her position with ALPS, Ms. Storms is deemed an affiliate of the Trust as defined under the 1940 Act. Ms. Storms is also Treasurer of Liberty All‐Star Equity Fund, Liberty All‐Star Growth Fund, Inc., ALPS Series Trust and Elevation ETF Trust. Ms. Storms also serves as a Board member and Treasurer of The Center for Trauma & Resilience, a nonprofit agency.
Karen S. Gilomen, 1970
Secretary Ms. Gilomen was elected Secretary of the Trust at the December 13, 2016 meeting of the Board of Trustees.
Ms. Gilomen joined ALPS in August 2016 as Vice President and Senior Counsel. Prior to joining ALPS, Ms. Gilomen was Vice President ‐ General Counsel & CCO of Monticello Associates, Inc. from 2010 to 2016. Because of her position with ALPS, Ms. Gilomen is deemed an affiliate of the Trust, as defined under the 1940 Act. Ms. Gilomen is also the Secretary of Oak Associates Funds and Reaves Utility Income Fund, and the Assistant Secretary of the WesMark Funds.
Ted Uhl, 1974
Chief Compliance Officer (“CCO”)
Mr. Uhl was appointed CCO of the Trust at the June 8, 2010 meeting of the Board of Trustees.
Mr. Uhl joined ALPS in October 2006, and is currently Deputy Compliance Officer of ALPS. Prior to his current role, Mr. Uhl served as Senior Risk Manager for ALPS from October 2006 until June 2010. Before joining ALPS, Mr. Uhl served a Sr. Analyst with Enenbach and Associates (RIA), and a Sr. Financial Analyst at Sprint. Because of his position with ALPS, Mr. Uhl is deemed an affiliate of the Trust as defined under the 1940 Act. Mr. Uhl is also CCO of the Boulder Growth & Income Fund, Inc., Centre Funds, Elevation ETF Trust, Index Funds, Reality Shares ETF Trust and Reaves Utility Income Fund.
Jennell Panella, 1974
Assistant Treasurer
Ms. Panella was elected Assistant Treasurer of the Trust at the September 15, 2015 meeting of the Board of Trustees.
Ms. Panella joined ALPS in June 2012 and is currently Fund Controller of ALPS Fund Services, Inc. Prior to joining ALPS, Ms. Panella served as Financial Reporting Manager for Parker Global Strategies, LLC (2009‐2012). Because of her position with ALPS, Ms. Panella is deemed an affiliate of the Trust as defined under the 1940 Act. Ms. Panella also serves as Assistant Treasurer of James Advantage Funds.
Trustees and Officers April 30, 2017 (Unaudited)
Annual Report | April 30, 2017 43
OFFICERS (continued)
Name, Address*
& Year of Birth
Position(s) Held with
Fund
Term of Office** and Length of Time Served Principal Occupation(s) During Past 5 Years***
Alan Gattis, 1980
Assistant Treasurer
Mr. Gattis was elected Assistant Treasurer of the Trust at the September 13, 2016 meeting of the Board of Trustees.
Mr. Gattis joined ALPS in 2011 and is currently Vice President and Fund Controller of ALPS. Prior to joining ALPS, Mr. Gattis was an Auditor at Spicer Jeffries LLP (2009 through 2011) and an Auditor at PricewaterhouseCoopers LLP (2004 ‐ 2009). Because of his position with ALPS, Mr. Gattis is deemed an affiliate of the Trust as defined under the 1940 Act. Mr. Gattis is also Assistant Treasurer of ALPS Series Trust, Clough Funds Trust, Clough Global Opportunities Fund, Clough Global Dividend and Income Fund, Clough Global Equity, and Griffin Institutional Access Real Estate Fund.
Sharon Akselrod, 1974
Assistant Secretary
Ms. Akselrod was elected Assistant Secretary of the Trust at the September 15, 2015 meeting of the Board of Trustees.
Ms. Akselrod joined ALPS in August 2014 and is currently Senior Investment Company Act Paralegal of ALPS Fund Services, Inc. Prior to joining ALPS, Ms. Akselrod served as Corporate Governance and Regulatory Associate for Nordstrom fsb (2013‐2014) and Senior Legal Assistant – Legal Manager for AXA Equitable Life Insurance Company (2008‐2013). Because of her position with ALPS, Ms. Akselrod is deemed an affiliate of the Trust as defined under the 1940 Act. Ms. Akselrod is also Assistant Secretary of ALPS ETF Trust.
Jennifer Craig, 1973
Assistant Secretary
Ms. Craig was elected Assistant Secretary of the Trust at the June 8, 2016 meeting of the Board of Trustees.
Ms. Craig joined ALPS in 2007 and is currently Assistant Vice President and Paralegal Manager of ALPS. Prior to joining ALPS, Ms. Craig was Legal Manager at Janus Capital Management LLC and served as Assistant Secretary of Janus Investment Fund, Janus Adviser Series and Janus Aspen Series. Because of her position with ALPS, Ms. Craig is deemed an affiliate of the Trust as defined under the 1940 Act. Ms. Craig is also Assistant Secretary of Clough Global Dividend and Income Fund, Clough Global Equity Fund, Clough Global Opportunities Fund, Clough Funds Trust and ALPS Series Trust.
* All communications to Trustees and Officers may be directed to Financial Investors Trust c/o 1290 Broadway, Suite 1100, Denver, CO 80203.
** This is the period for which the Trustee or Officer began serving the Trust. Each Trustee serves an indefinite term, until his successor is elected. Officers are elected on an annual basis.
*** The Fund Complex includes all series of the Trust (currently 34) and any other investment companies for which any Trustee serves as trustee for and which Vulcan Value Partners, LLC provides investment advisory services (currently none).
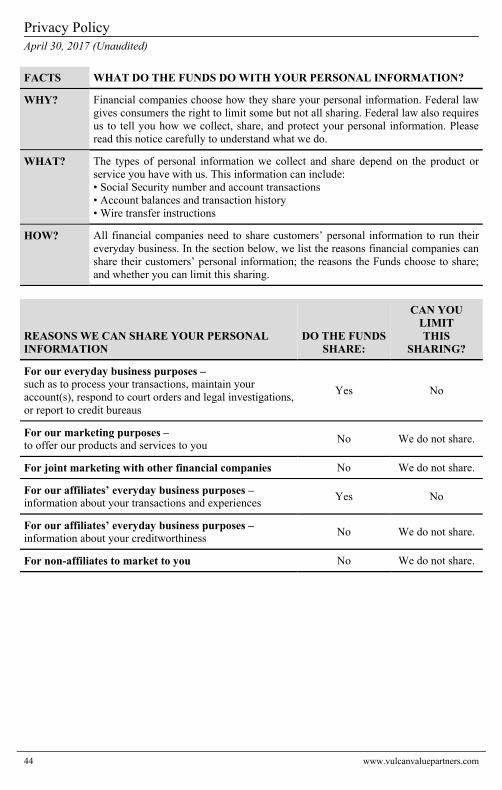
Privacy Policy April 30, 2017 (Unaudited)
44 www.vulcanvaluepartners.com
FACTS WHAT DO THE FUNDS DO WITH YOUR PERSONAL INFORMATION?
WHY? Financial companies choose how they share your personal information. Federal law gives consumers the right to limit some but not all sharing. Federal law also requires us to tell you how we collect, share, and protect your personal information. Please read this notice carefully to understand what we do.
WHAT? The types of personal information we collect and share depend on the product or service you have with us. This information can include: • Social Security number and account transactions • Account balances and transaction history • Wire transfer instructions
HOW? All financial companies need to share customers’ personal information to run their everyday business. In the section below, we list the reasons financial companies can share their customers’ personal information; the reasons the Funds choose to share; and whether you can limit this sharing.
REASONS WE CAN SHARE YOUR PERSONAL INFORMATION
DO THE FUNDS SHARE:
CAN YOU LIMIT THIS
SHARING?
For our everyday business purposes – such as to process your transactions, maintain your account(s), respond to court orders and legal investigations, or report to credit bureaus
Yes No
For our marketing purposes – to offer our products and services to you
No We do not share.
For joint marketing with other financial companies No We do not share.
For our affiliates’ everyday business purposes – information about your transactions and experiences
Yes No
For our affiliates’ everyday business purposes – information about your creditworthiness
No We do not share.
For non-affiliates to market to you No We do not share.
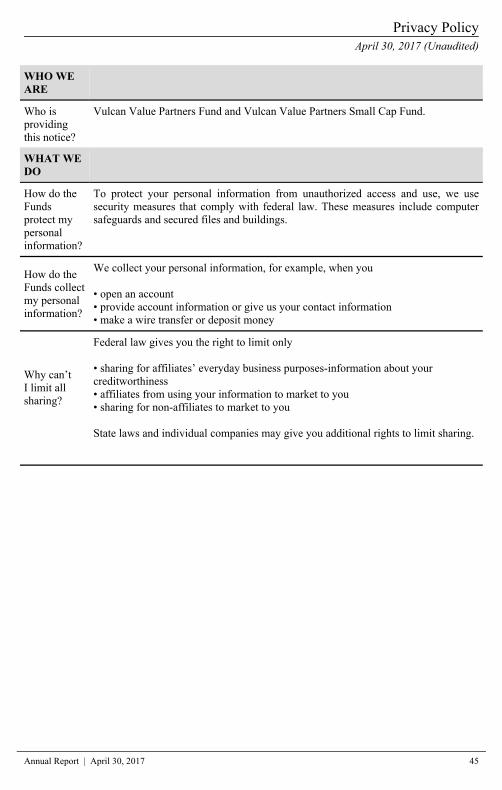
Privacy Policy April 30, 2017 (Unaudited)
Annual Report | April 30, 2017 45
WHO WE ARE
Who is providing this notice?
Vulcan Value Partners Fund and Vulcan Value Partners Small Cap Fund.
WHAT WE DO
How do the Funds protect my personal information?
To protect your personal information from unauthorized access and use, we use security measures that comply with federal law. These measures include computer safeguards and secured files and buildings.
How do the Funds collect my personal information?
We collect your personal information, for example, when you • open an account • provide account information or give us your contact information • make a wire transfer or deposit money
Why can’t I limit all sharing?
Federal law gives you the right to limit only • sharing for affiliates’ everyday business purposes-information about your creditworthiness • affiliates from using your information to market to you • sharing for non-affiliates to market to you State laws and individual companies may give you additional rights to limit sharing.

Privacy Policy April 30, 2017 (Unaudited)
46 www.vulcanvaluepartners.com
DEFINITIONS
Affiliates Companies related by common ownership or control. They can be financial and nonfinancial companies.
Non-affiliates Companies not related by common ownership or control. They can be financial and nonfinancial companies. • The Funds do not share with non-affiliates so they can market to you.
Joint marketing
A formal agreement between non-affiliated financial companies that together market financial products or services to you. • The Funds do not jointly market.
OTHER IMPORTANT INFORMATION
California Residents
If your account has a California home address, your personal information will not be disclosed to nonaffiliated third parties except as permitted by applicable California law, and we will limit sharing such personal information with our affiliates to comply with California privacy laws that apply to us.
Vermont Residents
The State of Vermont requires financial institutions to obtain your consent prior to sharing personal information that they collect about you with affiliated companies and nonaffiliated third parties other than in certain limited circumstances. Except as permitted by law, we will not share personal information we collect about you with nonaffiliated third parties or other affiliated companies unless you provide us with your written consent to share such information.

This page left intentionally blank.


The Funds are neither insured nor guaranteed by the U.S. Government, the FDIC, the Federal Reserve Board or any other governmental agency or insurer.
This material must be accompanied or preceded by a prospectus.
Managed Accounts are available only for institutional and private clients of Vulcan Value Partners, LLC, a federally registered investment advisor. Vulcan Value Partners Funds are distributed by ALPS Distributors, Inc. Separately Managed Accounts and related investment advisory services are provided by Vulcan Value Partners, LLC, a federally regulated investment advisor. ALPS Distributors, Inc. is not affiliated with Vulcan Value Partners, LLC.
VUL00379 / 0618


![VULCAN HIGH SPEED DEEP FAT FRYER (ELECTRIC) › vulcan-website...Vulcan catering equipment (ptY)ltD [ 2 ] VULCAN HIGH SPEED DEEP FAT FRYER (ELECTRIC) GENERAL DATA: MANUFACTURER: Vulcan](https://static.fdocuments.in/doc/165x107/60c05ae5c355355f26327394/vulcan-high-speed-deep-fat-fryer-electric-a-vulcan-website-vulcan-catering.jpg)