Drying of Almonds I: Single Particle1 . Drying of Almonds I: Single Particle . Amarvir G. Chilka1, 2...
21
Drying of Almonds I: Single Particle Chilka, A. G., & Ranade, V. V. (2017). Drying of Almonds I: Single Particle. Indian Chemical Enginer, 1-23. https://doi.org/10.1080/00194506.2017.1333464 Published in: Indian Chemical Enginer Document Version: Peer reviewed version Queen's University Belfast - Research Portal: Link to publication record in Queen's University Belfast Research Portal Publisher rights © 2016 Indian Institute of Chemical Engineers. This work is made available online in accordance with the publisher’s policies. Please refer to any applicable terms of use of the publisher. General rights Copyright for the publications made accessible via the Queen's University Belfast Research Portal is retained by the author(s) and / or other copyright owners and it is a condition of accessing these publications that users recognise and abide by the legal requirements associated with these rights. Take down policy The Research Portal is Queen's institutional repository that provides access to Queen's research output. Every effort has been made to ensure that content in the Research Portal does not infringe any person's rights, or applicable UK laws. If you discover content in the Research Portal that you believe breaches copyright or violates any law, please contact [email protected]. Download date:20. Feb. 2020
Transcript of Drying of Almonds I: Single Particle1 . Drying of Almonds I: Single Particle . Amarvir G. Chilka1, 2...
Drying of Almonds I: Single Particle
Chilka, A. G., & Ranade, V. V. (2017). Drying of Almonds I: Single Particle. Indian Chemical Enginer, 1-23.https://doi.org/10.1080/00194506.2017.1333464
Published in:Indian Chemical Enginer
Document Version:Peer reviewed version
Queen's University Belfast - Research Portal:Link to publication record in Queen's University Belfast Research Portal
Publisher rights© 2016 Indian Institute of Chemical Engineers.This work is made available online in accordance with the publisher’s policies. Please refer to any applicable terms of use of the publisher.
General rightsCopyright for the publications made accessible via the Queen's University Belfast Research Portal is retained by the author(s) and / or othercopyright owners and it is a condition of accessing these publications that users recognise and abide by the legal requirements associatedwith these rights.
Take down policyThe Research Portal is Queen's institutional repository that provides access to Queen's research output. Every effort has been made toensure that content in the Research Portal does not infringe any person's rights, or applicable UK laws. If you discover content in theResearch Portal that you believe breaches copyright or violates any law, please contact [email protected].
Download date:20. Feb. 2020
1
Drying of Almonds I: Single Particle
Amarvir G. Chilka1, 2 and Vivek V. Ranade*, 3
1Chemical Engineering and Process Development Division CSIR - National Chemical Laboratory
Pune 411008, INDIA
2Academy of Scientific and Innovative Research (AcSIR), CSIR-National Chemical Laboratory (CSIR-NCL) Campus, Pune 411008, INDIA
3School of Chemistry and Chemical Engineering, Queen’s University Belfast, Belfast BT9 5 AG, UK
*E-mail: [email protected]
Abstract
Drying is an essential unit operation required in food processing industries, particularly in the dry fruits
industry. Drying of almonds exhibit many characteristic features such as non-spherical shape, swelling/
shrinkage as a function of moisture content, uneven drying because of their peculiar shape and
proximity to other almond kernels and so on. In this study, we have investigated the drying of almonds
through experiments and computational modeling. In this regard, Mettler Toledo Halogen moisture
analyzer unit was used to conduct experiments for a single almond kernel. In this widely used
equipment, internal air flow patterns and therefore heat and mass transfer depend on natural circulation
of air. A detailed three dimensional computational fluid dynamics (CFD) model was used to simulate
the air flow pattern, heat and mass transfer in the drying unit. Carefully designed experiments with a
single almond kernel were carried out at different temperatures to estimate key parameters of interest
(drying kinetics and effective diffusivity). The CFD model was also used to quantify non-uniform heat
and mass transfer and therefore non-uniform drying of a single almond kernel. The presented approach,
models and results might be useful to improve the performance of drying units in industrial systems.
The results and models presented here will also provide a basis for further work on multiple almond
kernels and on tray dryer unit.
Keywords: Moisture Analyzer; CFD; Almond drying; Kinetics; Transport processes
1. Introduction
Drying is an indispensable unit operation in many food processing applications. Drying of a variety of
food product is carried out to reduce their moisture levels in order to increase the shelf life, reduce the
probability of developing fungi and to facilitate further processing to obtain the final product. In
particular most of the dry fruits are seasonal in nature, which requires appropriate post-harvest storage
for a long duration of time. Therefore it is important to understand the influence of key process
2
parameters on drying of dry fruits. There are few studies focusing on drying kinetics of dry fruits, Kaya
et. al.[1] has studied the convective drying kinetics of kiwi fruit. Togrul et. al.[2] have studied convective
drying kinetics of single apricot. Almond is one of the widely cultivated and consumed dry fruit across
the globe. It is important to ensure appropriate drying of almonds as more than desirable moisture will
increase possibility of developing fungi, and over drying will adversely impact the economics, due to
loss of weight.
Critical review of literature did not reveal availability of drying kinetics data for almonds. Taitano et.
al.[3] has studied moisture adsorption and thermodynamic properties of California grown almonds. They
have reported, variation of diffusivity with respect to temperature, and thermodynamic values for
almond kernel. Pearson [4] has studied the effect of temperature (55 °C to 110 °C) on drying of almonds
for concealed damage. Pahlevanzadeh and Yazdani [5] have determined equilibrium moisture content of
almond kernel at 15 oC, 55 oC and 75 oC. Almond dimensions, geometric mean diameter, density,
porosity and other physical properties were measured by Aydin[6], which have been used in the current
study. Widely used drying kinetics of various food products have been explained through empirical and
semi-empirical models e.g. single parameter Newton model [Ayensu[7]], two parameter Page model
[Karathanos et. al.[8]], two-term exponential models [Akpinar et. al.[9], Verma et. al.[10] and Midilli
et.al[11]].
As the drying kinetics is influenced by transport processes (heat and mass transfer) in the experimental
drying equipment, the afore-mentioned drying kinetics models are not intrinsic in nature. These models
depend on flow as well as other transport processes. Therefore it is important to understand the flow
and transport processes occurring in the drying equipment used for measuring the drying kinetics in
order to translate the results for design and operation of commercial units. In this context it is essential
to first obtain effective diffusivity from the measured moisture loss data and use this for developing
detailed computational fluid dynamics (CFD) based models. Drying process could be explained more
accurately, by using developed CFD models which simulate flow, heat and mass transport. In most of
the published studies a constant heat and mass transfer values have been used. However, in real
scenarios there could be a considerable variation in these values which needs to be accounted for. Kaya
et. al.[1], have shown the variation in heat and mass transfer coefficients for drying of kiwi fruits. In their
study two dimensional heat and mass transfer within the kiwi fruit was solved. ElGamal et. al.[12] have
coupled convective drying CFD based model with diffusion based drying kinetic model for a single rice
kernel. It shows the influence of varying heat and mass transfer coefficients over the moisture variation
in the rice kernel. Ranjbaran et. al.[13] have simulated deep-bed paddy drying by using drying kinetic
model coupled with CFD simulations. CFD simulations have been extensively used in various drying
applications like spray dryer, sprouted bed dryers, tray dryers, fluidized bed dryers etc. Jamaleddine
and Ray [14] has provided a detailed review on use of CFD for drying applications.
3
In this work, the scope is restricted to present detailed CFD model of Mettler Toledo halogen moisture
analyzer used for drying of a single almond kernel. The work was then used as a basis for extending the
model for simulating drying of multiple almonds which are arranged in the shape of a cuboid (8 particles
arranged in [2x2x2] cuboid and 27 particles arranged in [3x3x3] cuboid) as well as drying in a tray
dryer.
The present work discusses the following:
• Systematic drying experiments for single almond kernel at three different temperatures i.e. 55 oC, 65 oC and 75 oC; experimental data on moisture content as a function of time
• Experimental data on almond surface and air temperature in the Mettler Toledo unit
• Experimental data on dimensions of almond kernel during the drying process (shrinkage of
almonds with moisture content)
• Identifying an appropriate drying kinetics model to describe measured moisture variation with
time; estimation of model parameters, effective diffusion coefficient, and activation energy.
• CFD modeling to simulate flow, heat and mass transfer in Mettler Toledo unit.
• Simulated variation of heat and mass transfer coefficients over the almond surface
• Simulated moisture distribution for a single almond kernel (and partial validation by comparing
with the experimental data)
This presented experimental data, approach and models will be useful to understand the drying kinetics
of almonds in different drying units. The work will provide a firm basis for extending the approach
towards drying of multiple almonds and towards simulations of industrial drying units.
2. Experimental
Experiments were conducted using Mettler Toledo Halogen moisture analyzer (excellence plus
HX204), to study drying kinetics of single almond kernel. Based on the available data, related to almond
drying three different temperatures i.e. 55 oC, 65 oC and 75 oC were selected to conduct experiments.
Details of the unit, experimental procedure, estimation of error bars, and processing of experimental
data are described in following sections.
2.1 Halogen Moisture Analyzer (HX204)
Mettler Toledo Halogen moisture analyzer excellence plus (HX204) unit is widely used to determine
the moisture content of various substances. The unit works on the thermogravimetric principle. The
initial weight of the sample is determined at the start of the measurement, followed by heating using
halogen radiator. As the sample is being dried the instrument continuously records and displays the
weight of the sample. Halogen radiator drying technology is an advancement of the infrared drying
method. Halogen radiator has a glass pipe filled with halogen gas as the heating element which provides
maximum heating output very quickly. The time required to reach the set temperature in this instrument
4
is much smaller as compared to the traditional IR-technology. The instrument has gold-plated reflector
plates to ensure better distribution of thermal radiation over the entire sample surface.
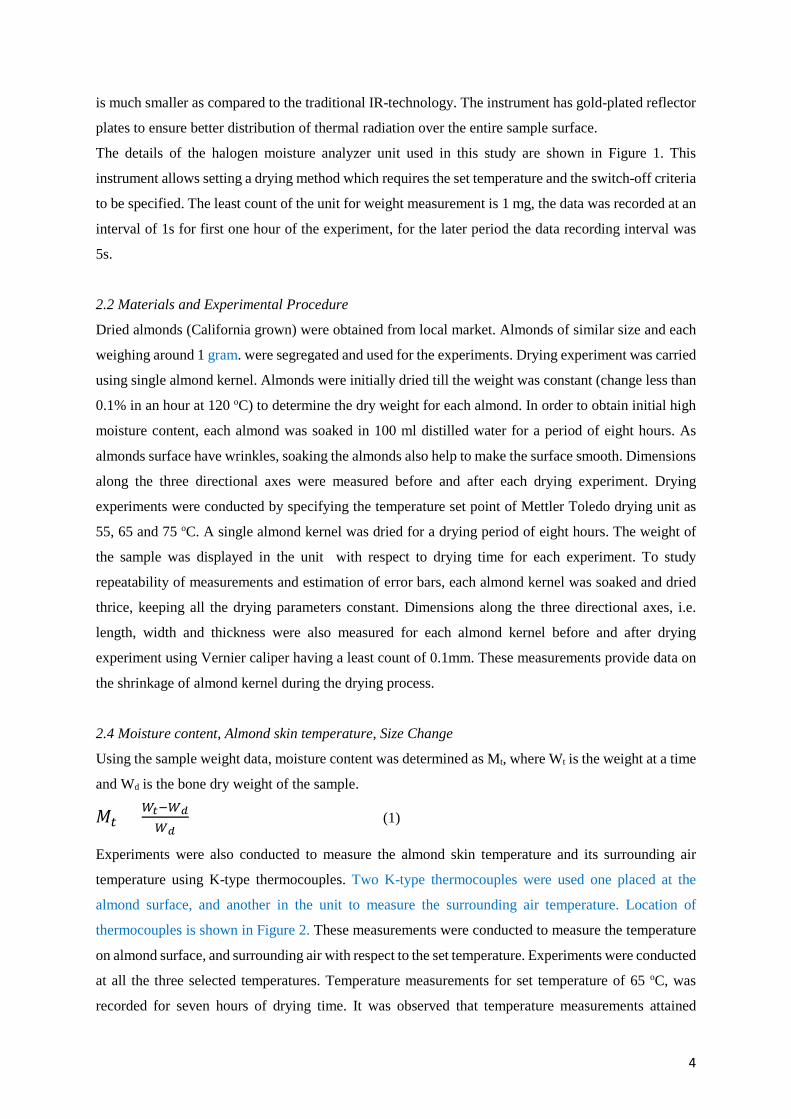
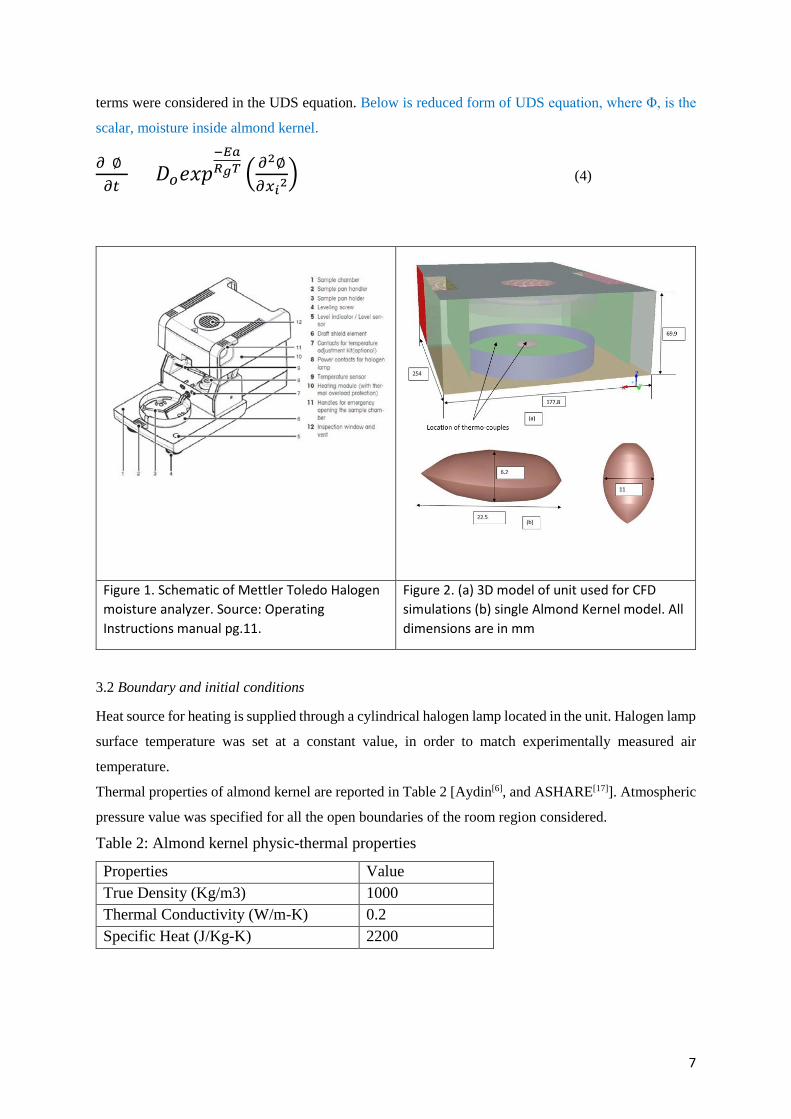
The details of the halogen moisture analyzer unit used in this study are shown in Figure 1. This
instrument allows setting a drying method which requires the set temperature and the switch-off criteria
to be specified. The least count of the unit for weight measurement is 1 mg, the data was recorded at an
interval of 1s for first one hour of the experiment, for the later period the data recording interval was
5s.
2.2 Materials and Experimental Procedure
Dried almonds (California grown) were obtained from local market. Almonds of similar size and each
weighing around 1 gram. were segregated and used for the experiments. Drying experiment was carried
using single almond kernel. Almonds were initially dried till the weight was constant (change less than
0.1% in an hour at 120 oC) to determine the dry weight for each almond. In order to obtain initial high
moisture content, each almond was soaked in 100 ml distilled water for a period of eight hours. As
almonds surface have wrinkles, soaking the almonds also help to make the surface smooth. Dimensions
along the three directional axes were measured before and after each drying experiment. Drying
experiments were conducted by specifying the temperature set point of Mettler Toledo drying unit as
55, 65 and 75 oC. A single almond kernel was dried for a drying period of eight hours. The weight of
the sample was displayed in the unit with respect to drying time for each experiment. To study
repeatability of measurements and estimation of error bars, each almond kernel was soaked and dried
thrice, keeping all the drying parameters constant. Dimensions along the three directional axes, i.e.
length, width and thickness were also measured for each almond kernel before and after drying
experiment using Vernier caliper having a least count of 0.1mm. These measurements provide data on
the shrinkage of almond kernel during the drying process.
2.4 Moisture content, Almond skin temperature, Size Change
Using the sample weight data, moisture content was determined as Mt, where Wt is the weight at a time
and Wd is the bone dry weight of the sample.
𝑀𝑀𝑡𝑡 = 𝑊𝑊𝑡𝑡−𝑊𝑊𝑑𝑑𝑊𝑊𝑑𝑑
(1)
Experiments were also conducted to measure the almond skin temperature and its surrounding air
temperature using K-type thermocouples. Two K-type thermocouples were used one placed at the
almond surface, and another in the unit to measure the surrounding air temperature. Location of
thermocouples is shown in Figure 2. These measurements were conducted to measure the temperature
on almond surface, and surrounding air with respect to the set temperature. Experiments were conducted
at all the three selected temperatures. Temperature measurements for set temperature of 65 oC, was
recorded for seven hours of drying time. It was observed that temperature measurements attained
5
constant values within two hours of drying time. Based on this observation experiments for 55 oC, and
75 oC were conducted for two hours only.
During the drying process, size of almond kernel changes as the moisture is reduced, experiments were
conducted to study the extent of shrinkage. Size of almond kernel was measured at regular interval of
30 minutes during the first 3 hours of drying. As the drying rate was low interval time was increased to
60 minutes.
2.5 Processing of acquired moisture data
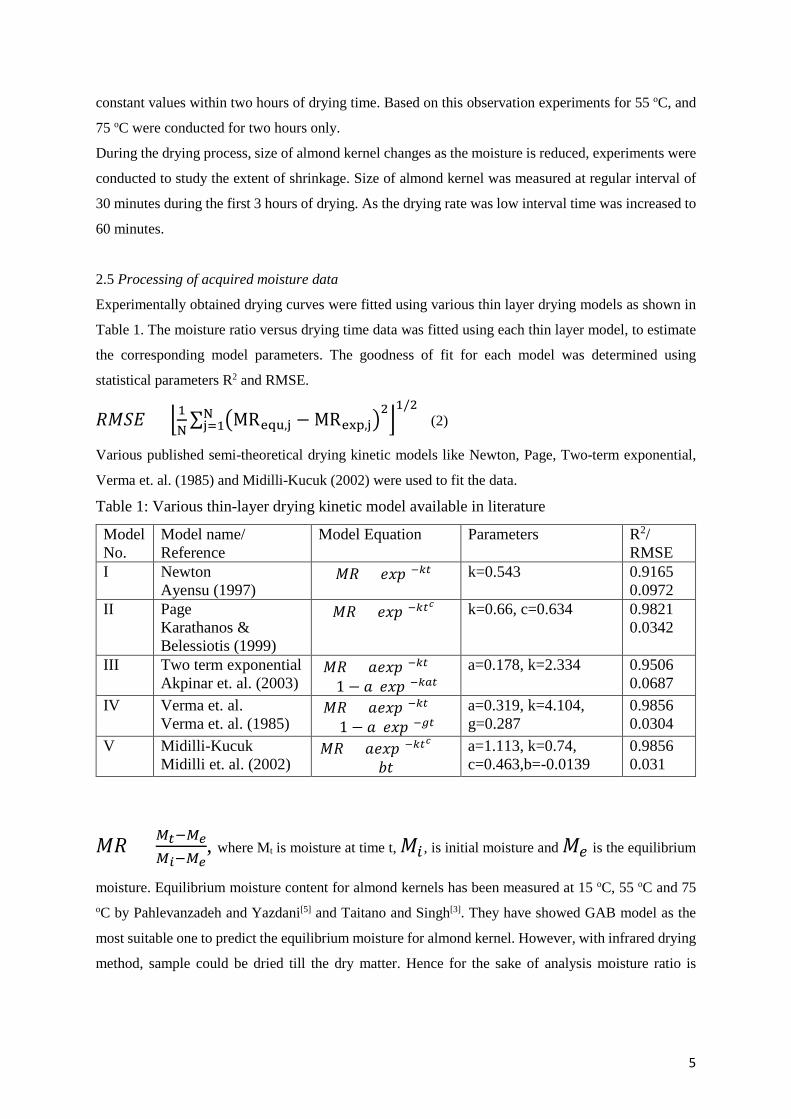
Experimentally obtained drying curves were fitted using various thin layer drying models as shown in
Table 1. The moisture ratio versus drying time data was fitted using each thin layer model, to estimate
the corresponding model parameters. The goodness of fit for each model was determined using
statistical parameters R2 and RMSE.
𝑅𝑅𝑀𝑀𝑅𝑅𝑅𝑅 = �1N∑ �MRequ,j − MRexp,j�
2Nj=1 �
1/2 (2)
Various published semi-theoretical drying kinetic models like Newton, Page, Two-term exponential,
Verma et. al. (1985) and Midilli-Kucuk (2002) were used to fit the data.
Table 1: Various thin-layer drying kinetic model available in literature
Model No.
Model name/ Reference
Model Equation Parameters R2/ RMSE
I Newton Ayensu (1997)
𝑀𝑀𝑅𝑅 = 𝑒𝑒𝑒𝑒𝑒𝑒(−𝑘𝑘𝑡𝑡) k=0.543 0.9165 0.0972
II Page Karathanos & Belessiotis (1999)
𝑀𝑀𝑅𝑅 = 𝑒𝑒𝑒𝑒𝑒𝑒(−𝑘𝑘𝑡𝑡𝑐𝑐) k=0.66, c=0.634 0.9821 0.0342
III Two term exponential Akpinar et. al. (2003)
𝑀𝑀𝑅𝑅 = 𝑎𝑎𝑒𝑒𝑒𝑒𝑒𝑒(−𝑘𝑘𝑡𝑡) + (1 − 𝑎𝑎)𝑒𝑒𝑒𝑒𝑒𝑒(−𝑘𝑘𝑘𝑘𝑡𝑡)
a=0.178, k=2.334 0.9506 0.0687
IV Verma et. al. Verma et. al. (1985)
𝑀𝑀𝑅𝑅 = 𝑎𝑎𝑒𝑒𝑒𝑒𝑒𝑒(−𝑘𝑘𝑡𝑡) + (1 − 𝑎𝑎)𝑒𝑒𝑒𝑒𝑒𝑒(−𝑔𝑔𝑡𝑡)
a=0.319, k=4.104, g=0.287
0.9856 0.0304
V Midilli-Kucuk Midilli et. al. (2002)
𝑀𝑀𝑅𝑅 = 𝑎𝑎𝑒𝑒𝑒𝑒𝑒𝑒(−𝑘𝑘𝑡𝑡𝑐𝑐) + 𝑏𝑏𝑏𝑏
a=1.113, k=0.74, c=0.463,b=-0.0139
0.9856 0.031
𝑀𝑀𝑅𝑅 = 𝑀𝑀𝑡𝑡−𝑀𝑀𝑒𝑒𝑀𝑀𝑖𝑖−𝑀𝑀𝑒𝑒
, where Mt is moisture at time t, 𝑀𝑀𝑖𝑖 , is initial moisture and 𝑀𝑀𝑒𝑒 is the equilibrium
moisture. Equilibrium moisture content for almond kernels has been measured at 15 oC, 55 oC and 75 oC by Pahlevanzadeh and Yazdani[5] and Taitano and Singh[3]. They have showed GAB model as the
most suitable one to predict the equilibrium moisture for almond kernel. However, with infrared drying
method, sample could be dried till the dry matter. Hence for the sake of analysis moisture ratio is
6
simplified as: 𝑀𝑀𝑅𝑅 = 𝑀𝑀𝑡𝑡𝑀𝑀𝑖𝑖
, by considering equilibrium moisture as zero, this approximation has been
taken from Togrul[16].
Numerical regression analysis was performed using the SOLVER tool through Microsoft Excel
spreadsheet. The SOLVER tool works on the Generalized Reduced Gradient (GRG) method of
iteration.
3. Modeling of flow, heat transfer and drying in moisture analyzer
Figure 1 shows the schematic of Mettler Toledo unit used to carry out the experiments. The unit has
high accuracy for weight measurements which was found to be 99.99% through in build internal weight
calibration of the unit. Air through natural circulation enters and leaves the unit through vent openings
located at the top. There are two flat plates on either side and two cylindrical plates on top and bottom,
which forms a closed enclosure in the unit. A circular halogen lamp is the heat source to maintain set
temperature in the unit. Due to the presence of temperature gradients buoyancy driven flow sets up in
the unit. The natural convection flow field within the unit was simulated to study the air flow
distribution around the almond kernel. The assumptions to carry out the modeling include: (i) Steady
state flow (ii) Variation in size and shape of almond has negligible influence on surrounding air flow
patterns (iii) Adiabatic operation (iv) Almond surfaces are impermeable for air flow and (v) There is no
heat generation within the almond kernel.
3.1 Model Equations
Mass continuity, Momentum, energy and radiation equations were solved to simulate the flow and
temperature distribution in the unit. As the major mode of heat transfer from halogen lamp in the unit
is radiation. Discrete Ordinate (DO) and Surface-to-surface (S2S) radiation models were used to capture
the radiation heat transfer in the unit. Equations are not being reproduced here, as the same could be
obtained from [18]. To capture the natural convection flow profile within the unit, air density was
modeled using incompressible ideal gas law equation. Steady state analysis is carried out for the flow
and heat transfer in the unit, while transient analysis is carried out for the drying simulations.
In built energy equation of Ansys Fluent is used to simulate the unsteady temperature profile inside the
almond kernel. Below is the equation used to solve the temperature distribution inside almond kernel:
𝜕𝜕(𝑇𝑇)𝜕𝜕𝑡𝑡
= 𝑘𝑘𝜌𝜌𝐶𝐶𝑝𝑝
�𝜕𝜕2𝑇𝑇
𝜕𝜕𝑥𝑥𝑖𝑖2� (3)
User defined scalar (UDS) equation of ANSYS Fluent is used to solve for the moisture content in the
almond kernel. UDS equation has an unsteady term, convective flux term and a diffusion term. The
primary mode of moisture transfer within the almond kernel is diffusion. Only unsteady and diffusion
7
terms were considered in the UDS equation. Below is reduced form of UDS equation, where Φ, is the
scalar, moisture inside almond kernel.
𝜕𝜕(∅)𝜕𝜕𝑡𝑡
= 𝐷𝐷𝑜𝑜𝑒𝑒𝑒𝑒𝑒𝑒−𝐸𝐸𝐸𝐸𝑅𝑅𝑔𝑔𝑇𝑇 �𝜕𝜕
2∅𝜕𝜕𝑥𝑥𝑖𝑖2
� (4)
Figure 1. Schematic of Mettler Toledo Halogen moisture analyzer. Source: Operating Instructions manual pg.11.
Figure 2. (a) 3D model of unit used for CFD simulations (b) single Almond Kernel model. All dimensions are in mm
3.2 Boundary and initial conditions
Heat source for heating is supplied through a cylindrical halogen lamp located in the unit. Halogen lamp
surface temperature was set at a constant value, in order to match experimentally measured air
temperature.
Thermal properties of almond kernel are reported in Table 2 [Aydin[6], and ASHARE[17]]. Atmospheric
pressure value was specified for all the open boundaries of the room region considered.
Table 2: Almond kernel physic-thermal properties
Properties Value True Density (Kg/m3) 1000 Thermal Conductivity (W/m-K) 0.2 Specific Heat (J/Kg-K) 2200
8
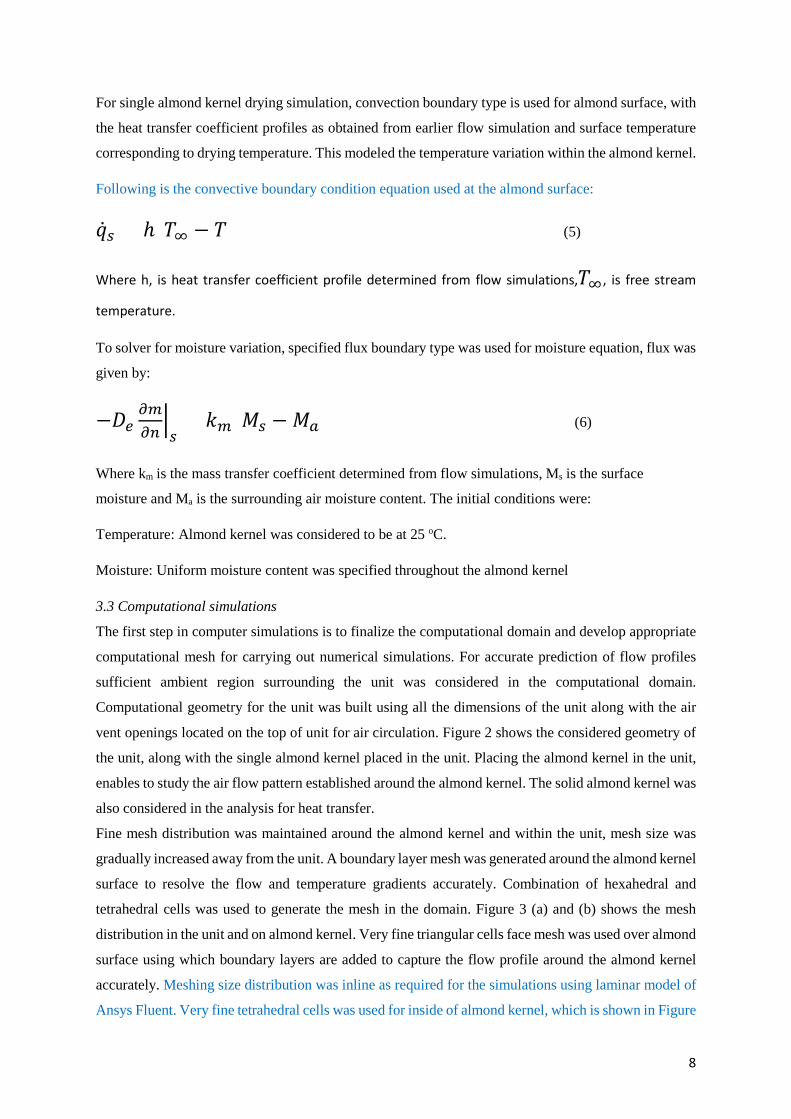
For single almond kernel drying simulation, convection boundary type is used for almond surface, with
the heat transfer coefficient profiles as obtained from earlier flow simulation and surface temperature
corresponding to drying temperature. This modeled the temperature variation within the almond kernel.
Following is the convective boundary condition equation used at the almond surface:
�̇�𝑞𝑠𝑠 = ℎ(𝑇𝑇∞ − 𝑇𝑇) (5)
Where h, is heat transfer coefficient profile determined from flow simulations,𝑇𝑇∞, is free stream
temperature.
To solver for moisture variation, specified flux boundary type was used for moisture equation, flux was
given by:
−𝐷𝐷𝑒𝑒𝜕𝜕𝜕𝜕𝜕𝜕𝜕𝜕�𝑠𝑠
= 𝑘𝑘𝜕𝜕(𝑀𝑀𝑠𝑠 − 𝑀𝑀𝑘𝑘) (6)
Where km is the mass transfer coefficient determined from flow simulations, Ms is the surface
moisture and Ma is the surrounding air moisture content. The initial conditions were:
Temperature: Almond kernel was considered to be at 25 oC.
Moisture: Uniform moisture content was specified throughout the almond kernel
3.3 Computational simulations
The first step in computer simulations is to finalize the computational domain and develop appropriate
computational mesh for carrying out numerical simulations. For accurate prediction of flow profiles
sufficient ambient region surrounding the unit was considered in the computational domain.
Computational geometry for the unit was built using all the dimensions of the unit along with the air
vent openings located on the top of unit for air circulation. Figure 2 shows the considered geometry of
the unit, along with the single almond kernel placed in the unit. Placing the almond kernel in the unit,
enables to study the air flow pattern established around the almond kernel. The solid almond kernel was
also considered in the analysis for heat transfer.
Fine mesh distribution was maintained around the almond kernel and within the unit, mesh size was
gradually increased away from the unit. A boundary layer mesh was generated around the almond kernel
surface to resolve the flow and temperature gradients accurately. Combination of hexahedral and
tetrahedral cells was used to generate the mesh in the domain. Figure 3 (a) and (b) shows the mesh
distribution in the unit and on almond kernel. Very fine triangular cells face mesh was used over almond
surface using which boundary layers are added to capture the flow profile around the almond kernel
accurately. Meshing size distribution was inline as required for the simulations using laminar model of
Ansys Fluent. Very fine tetrahedral cells was used for inside of almond kernel, which is shown in Figure
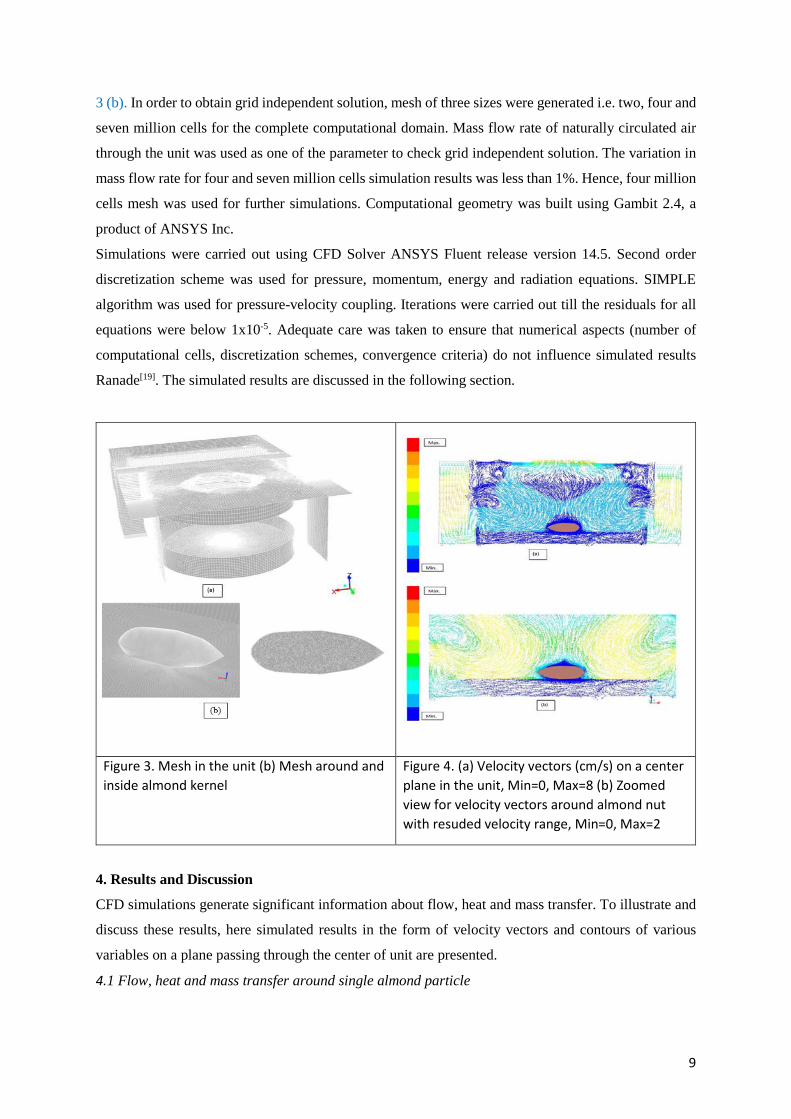
9
3 (b). In order to obtain grid independent solution, mesh of three sizes were generated i.e. two, four and
seven million cells for the complete computational domain. Mass flow rate of naturally circulated air
through the unit was used as one of the parameter to check grid independent solution. The variation in
mass flow rate for four and seven million cells simulation results was less than 1%. Hence, four million
cells mesh was used for further simulations. Computational geometry was built using Gambit 2.4, a
product of ANSYS Inc.
Simulations were carried out using CFD Solver ANSYS Fluent release version 14.5. Second order
discretization scheme was used for pressure, momentum, energy and radiation equations. SIMPLE
algorithm was used for pressure-velocity coupling. Iterations were carried out till the residuals for all
equations were below 1x10⁻⁵. Adequate care was taken to ensure that numerical aspects (number of
computational cells, discretization schemes, convergence criteria) do not influence simulated results
Ranade[19]. The simulated results are discussed in the following section.
Figure 3. Mesh in the unit (b) Mesh around and inside almond kernel
Figure 4. (a) Velocity vectors (cm/s) on a center plane in the unit, Min=0, Max=8 (b) Zoomed view for velocity vectors around almond nut with resuded velocity range, Min=0, Max=2
4. Results and Discussion
CFD simulations generate significant information about flow, heat and mass transfer. To illustrate and
discuss these results, here simulated results in the form of velocity vectors and contours of various
variables on a plane passing through the center of unit are presented.
4.1 Flow, heat and mass transfer around single almond particle
10
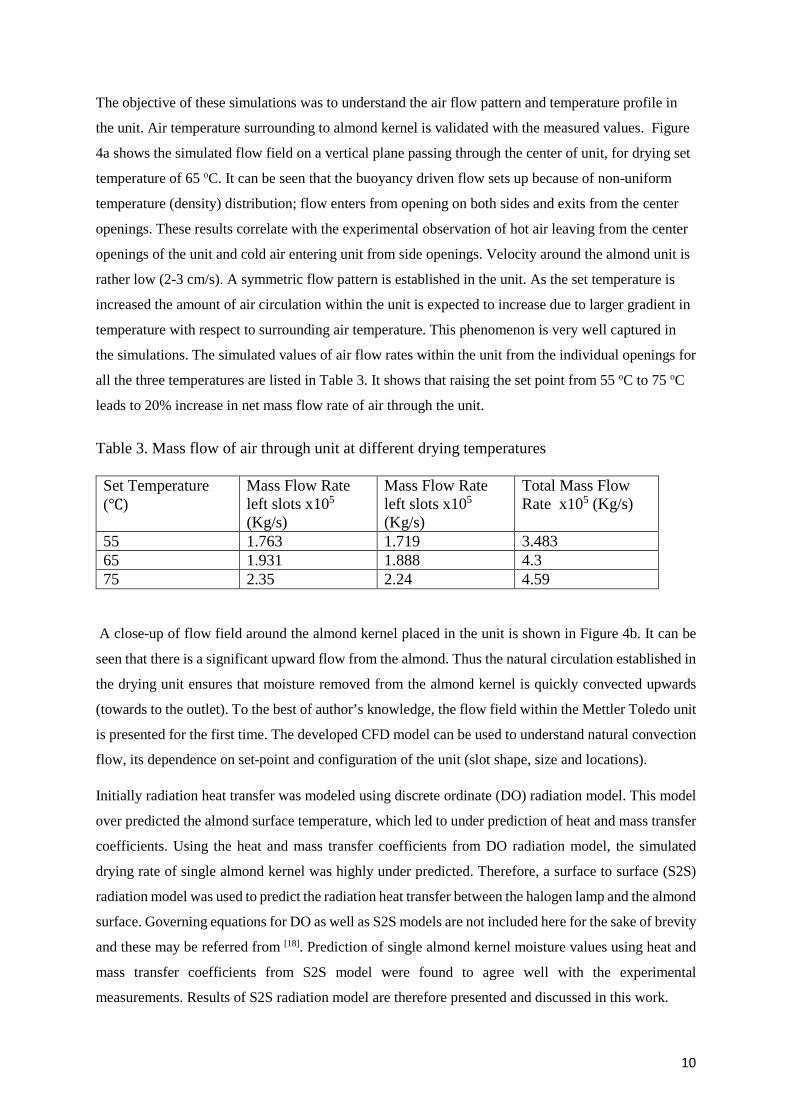
The objective of these simulations was to understand the air flow pattern and temperature profile in
the unit. Air temperature surrounding to almond kernel is validated with the measured values. Figure
4a shows the simulated flow field on a vertical plane passing through the center of unit, for drying set
temperature of 65 oC. It can be seen that the buoyancy driven flow sets up because of non-uniform
temperature (density) distribution; flow enters from opening on both sides and exits from the center
openings. These results correlate with the experimental observation of hot air leaving from the center
openings of the unit and cold air entering unit from side openings. Velocity around the almond unit is
rather low (2-3 cm/s). A symmetric flow pattern is established in the unit. As the set temperature is
increased the amount of air circulation within the unit is expected to increase due to larger gradient in
temperature with respect to surrounding air temperature. This phenomenon is very well captured in
the simulations. The simulated values of air flow rates within the unit from the individual openings for
all the three temperatures are listed in Table 3. It shows that raising the set point from 55 oC to 75 oC
leads to 20% increase in net mass flow rate of air through the unit.
Table 3. Mass flow of air through unit at different drying temperatures Set Temperature (℃)
Mass Flow Rate left slots x105 (Kg/s)
Mass Flow Rate left slots x105 (Kg/s)
Total Mass Flow Rate x105 (Kg/s)
55 1.763 1.719 3.483 65 1.931 1.888 4.3 75 2.35 2.24 4.59
A close-up of flow field around the almond kernel placed in the unit is shown in Figure 4b. It can be
seen that there is a significant upward flow from the almond. Thus the natural circulation established in
the drying unit ensures that moisture removed from the almond kernel is quickly convected upwards
(towards to the outlet). To the best of author’s knowledge, the flow field within the Mettler Toledo unit
is presented for the first time. The developed CFD model can be used to understand natural convection
flow, its dependence on set-point and configuration of the unit (slot shape, size and locations).
Initially radiation heat transfer was modeled using discrete ordinate (DO) radiation model. This model
over predicted the almond surface temperature, which led to under prediction of heat and mass transfer
coefficients. Using the heat and mass transfer coefficients from DO radiation model, the simulated
drying rate of single almond kernel was highly under predicted. Therefore, a surface to surface (S2S)
radiation model was used to predict the radiation heat transfer between the halogen lamp and the almond
surface. Governing equations for DO as well as S2S models are not included here for the sake of brevity
and these may be referred from [18]. Prediction of single almond kernel moisture values using heat and
mass transfer coefficients from S2S model were found to agree well with the experimental
measurements. Results of S2S radiation model are therefore presented and discussed in this work.
11
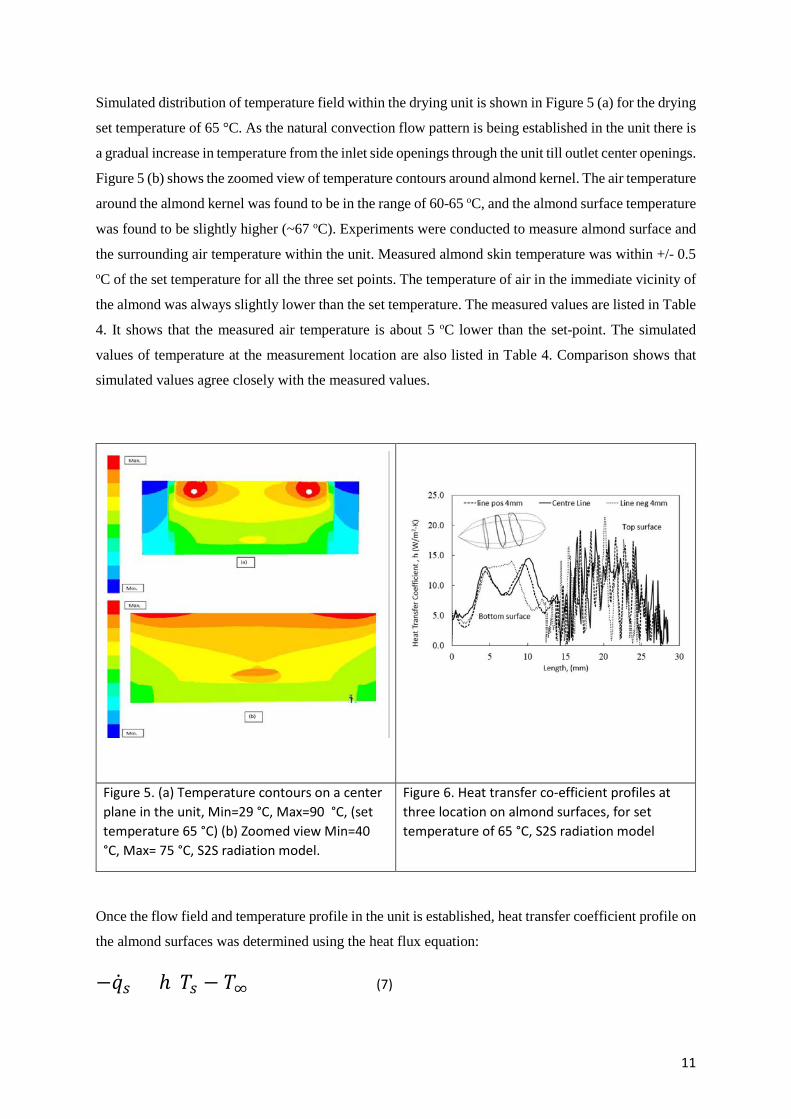
Simulated distribution of temperature field within the drying unit is shown in Figure 5 (a) for the drying
set temperature of 65 °C. As the natural convection flow pattern is being established in the unit there is
a gradual increase in temperature from the inlet side openings through the unit till outlet center openings.
Figure 5 (b) shows the zoomed view of temperature contours around almond kernel. The air temperature
around the almond kernel was found to be in the range of 60-65 oC, and the almond surface temperature
was found to be slightly higher (~67 oC). Experiments were conducted to measure almond surface and
the surrounding air temperature within the unit. Measured almond skin temperature was within +/- 0.5 oC of the set temperature for all the three set points. The temperature of air in the immediate vicinity of
the almond was always slightly lower than the set temperature. The measured values are listed in Table
4. It shows that the measured air temperature is about 5 oC lower than the set-point. The simulated
values of temperature at the measurement location are also listed in Table 4. Comparison shows that
simulated values agree closely with the measured values.
Figure 5. (a) Temperature contours on a center plane in the unit, Min=29 °C, Max=90 °C, (set temperature 65 °C) (b) Zoomed view Min=40 °C, Max= 75 °C, S2S radiation model.
Figure 6. Heat transfer co-efficient profiles at three location on almond surfaces, for set temperature of 65 °C, S2S radiation model
Once the flow field and temperature profile in the unit is established, heat transfer coefficient profile on
the almond surfaces was determined using the heat flux equation:
−�̇�𝑞𝑠𝑠 = ℎ(𝑇𝑇𝑠𝑠 − 𝑇𝑇∞) (7)
12
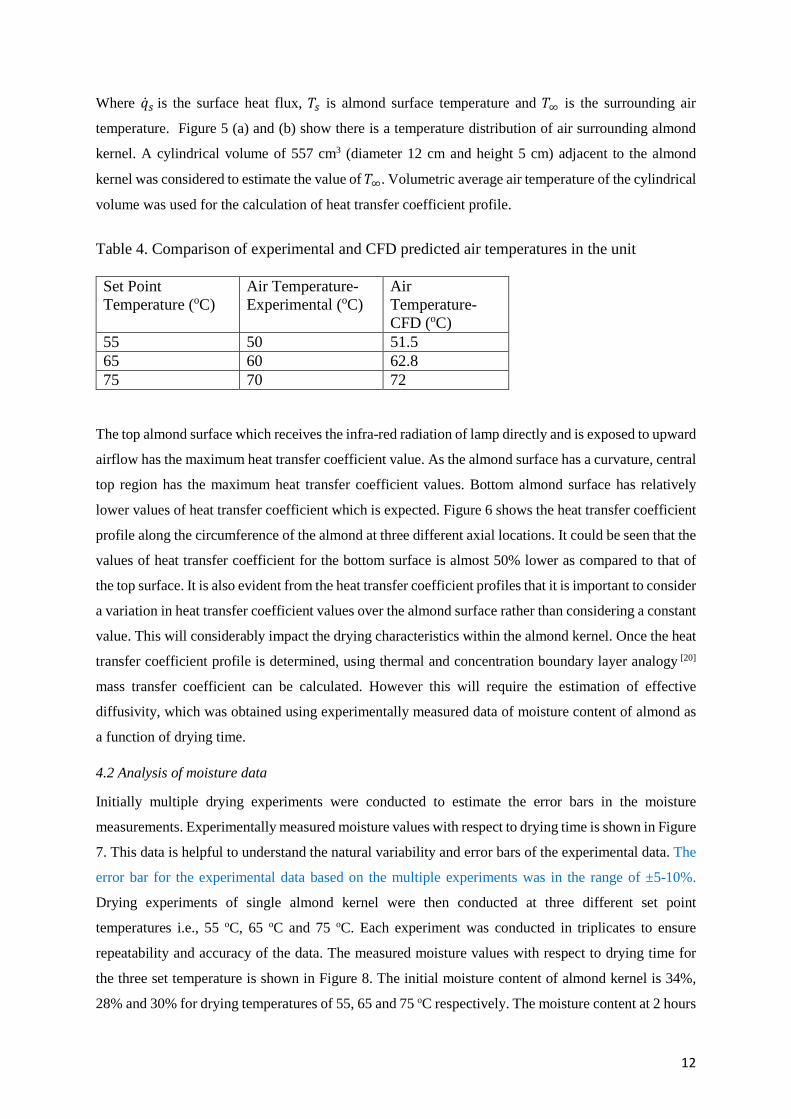
Where �̇�𝑞𝑠𝑠 is the surface heat flux, 𝑇𝑇𝑠𝑠 is almond surface temperature and 𝑇𝑇∞ is the surrounding air
temperature. Figure 5 (a) and (b) show there is a temperature distribution of air surrounding almond
kernel. A cylindrical volume of 557 cm3 (diameter 12 cm and height 5 cm) adjacent to the almond
kernel was considered to estimate the value of 𝑇𝑇∞. Volumetric average air temperature of the cylindrical
volume was used for the calculation of heat transfer coefficient profile.
Table 4. Comparison of experimental and CFD predicted air temperatures in the unit Set Point Temperature (oC)
Air Temperature-Experimental (oC)
Air Temperature-CFD (oC)
55 50 51.5 65 60 62.8 75 70 72
The top almond surface which receives the infra-red radiation of lamp directly and is exposed to upward
airflow has the maximum heat transfer coefficient value. As the almond surface has a curvature, central
top region has the maximum heat transfer coefficient values. Bottom almond surface has relatively
lower values of heat transfer coefficient which is expected. Figure 6 shows the heat transfer coefficient
profile along the circumference of the almond at three different axial locations. It could be seen that the
values of heat transfer coefficient for the bottom surface is almost 50% lower as compared to that of
the top surface. It is also evident from the heat transfer coefficient profiles that it is important to consider
a variation in heat transfer coefficient values over the almond surface rather than considering a constant
value. This will considerably impact the drying characteristics within the almond kernel. Once the heat
transfer coefficient profile is determined, using thermal and concentration boundary layer analogy [20]
mass transfer coefficient can be calculated. However this will require the estimation of effective
diffusivity, which was obtained using experimentally measured data of moisture content of almond as
a function of drying time.
4.2 Analysis of moisture data
Initially multiple drying experiments were conducted to estimate the error bars in the moisture
measurements. Experimentally measured moisture values with respect to drying time is shown in Figure
7. This data is helpful to understand the natural variability and error bars of the experimental data. The
error bar for the experimental data based on the multiple experiments was in the range of ±5-10%.
Drying experiments of single almond kernel were then conducted at three different set point
temperatures i.e., 55 oC, 65 oC and 75 oC. Each experiment was conducted in triplicates to ensure
repeatability and accuracy of the data. The measured moisture values with respect to drying time for
the three set temperature is shown in Figure 8. The initial moisture content of almond kernel is 34%,
28% and 30% for drying temperatures of 55, 65 and 75 oC respectively. The moisture content at 2 hours

13
of drying time is 15%, 10% and 8% for drying temperatures of 55, 65 and 75 oC respectively. It takes
almost another 6 hours to further reduce the moisture content of almond kernel. This shows the initial
drying rate for almond is very high for the first 2-3 hours of drying which decreases considerably for
the later stage of drying. Initially moisture transfer occurs from the outer layer of almond kernel.
Figure 7. Experimental moisture data for multiple runs and CFD prediction, for set temperature of 65 °C
Figure 8. Experimental measured moisture data for three set temperatures of 55 °C, 65 °C and 75 °C
Once the moisture in outer layer is decreased, the diffusion of moisture from the inner core of the kernel
to outer surface is essential. The data indicates that in such a later stage, internal diffusion of moisture
may control overall drying rate since it appears to be slower than the outside mass transfer coefficient.
The moisture data for almond kernel was fitted using various drying kinetics models available in
literature (listed in Table 1). Parameters for each of these models were obtained by numerical regression.
Kinetic models IV (Verma et al.) and V (Midilli-Kucuk) appear to predict the moisture pattern of
almond reasonably well as compared to other kinetic models (see Table 1). The model of Verma et al.
was used to describe the moisture variation at temperatures of 55 oC and 75 oC since it contains lesser
number of parameters.
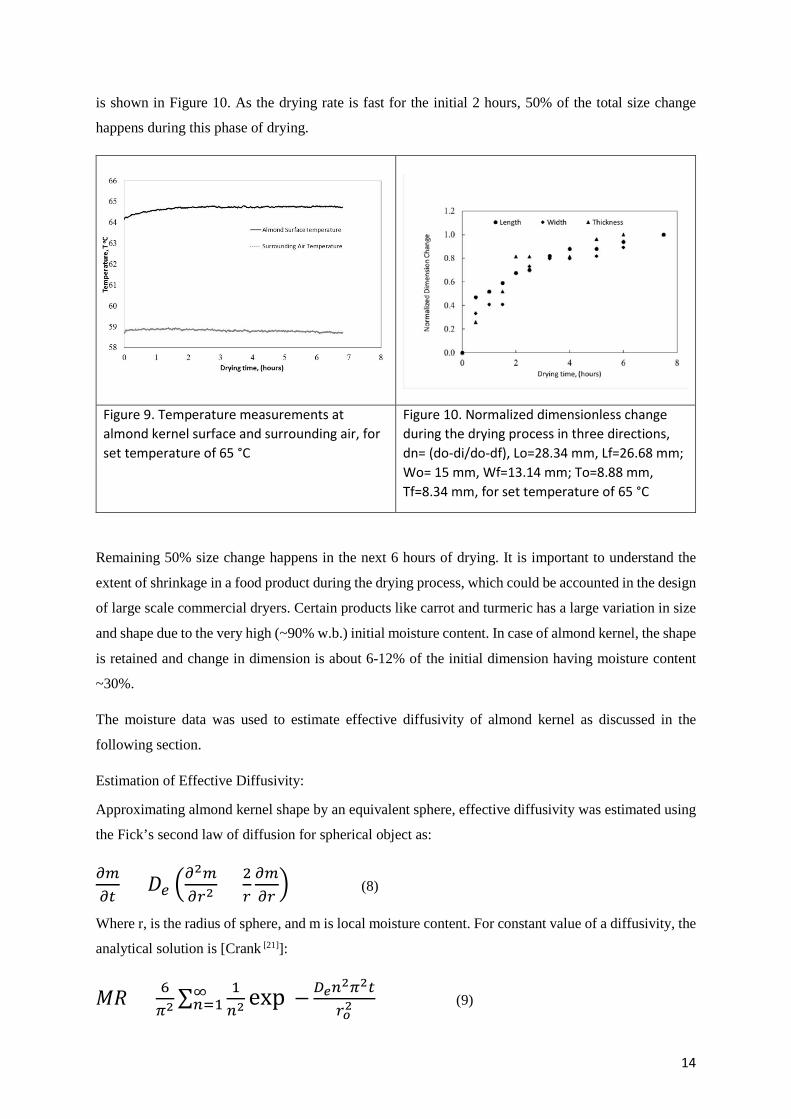
Figure 9 shows the temperature measurements for the almond surface and the surrounding air which
was measured experimentally. It shows that within a very short span of time, temperature readings for
both the sensors reach constant value.
Almond kernel shrinks slightly during the course of drying. Experiments to measure dimensional
change in almond kernel were conducted in triplicates. The total change in dimension was 1.66, 1.86
and 0.54 mm in length, width and thickness respectively. The corresponding percentage reduction in
size is 6%, 12% and 6% in length, width and thickness respectively. This data in the normalized form
14
is shown in Figure 10. As the drying rate is fast for the initial 2 hours, 50% of the total size change
happens during this phase of drying.
Figure 9. Temperature measurements at almond kernel surface and surrounding air, for set temperature of 65 °C
Figure 10. Normalized dimensionless change during the drying process in three directions, dn= (do-di/do-df), Lo=28.34 mm, Lf=26.68 mm; Wo= 15 mm, Wf=13.14 mm; To=8.88 mm, Tf=8.34 mm, for set temperature of 65 °C
Remaining 50% size change happens in the next 6 hours of drying. It is important to understand the
extent of shrinkage in a food product during the drying process, which could be accounted in the design
of large scale commercial dryers. Certain products like carrot and turmeric has a large variation in size
and shape due to the very high (~90% w.b.) initial moisture content. In case of almond kernel, the shape
is retained and change in dimension is about 6-12% of the initial dimension having moisture content
~30%.
The moisture data was used to estimate effective diffusivity of almond kernel as discussed in the
following section.
Estimation of Effective Diffusivity:
Approximating almond kernel shape by an equivalent sphere, effective diffusivity was estimated using
the Fick’s second law of diffusion for spherical object as:
𝜕𝜕𝜕𝜕𝜕𝜕𝑡𝑡
= 𝐷𝐷𝑒𝑒 �𝜕𝜕2𝜕𝜕𝜕𝜕𝑟𝑟2
+ 2𝑟𝑟𝜕𝜕𝜕𝜕𝜕𝜕𝑟𝑟� (8)
Where r, is the radius of sphere, and m is local moisture content. For constant value of a diffusivity, the
analytical solution is [Crank [21]]:
𝑀𝑀𝑅𝑅 = 6𝜋𝜋2∑ 1
𝜕𝜕2∞𝜕𝜕=1 exp (−𝐷𝐷𝑒𝑒𝜕𝜕2𝜋𝜋2𝑡𝑡
𝑟𝑟𝑜𝑜2) (9)
15
Where 𝑟𝑟𝑜𝑜 is the radius of sphere. Using above solution effective diffusivity for almond kernel was
estimated considering the first ten terms of the analytical solution given by equation 7. Nonlinear
regression analysis was done using Microsoft Excel tool SOLVER.
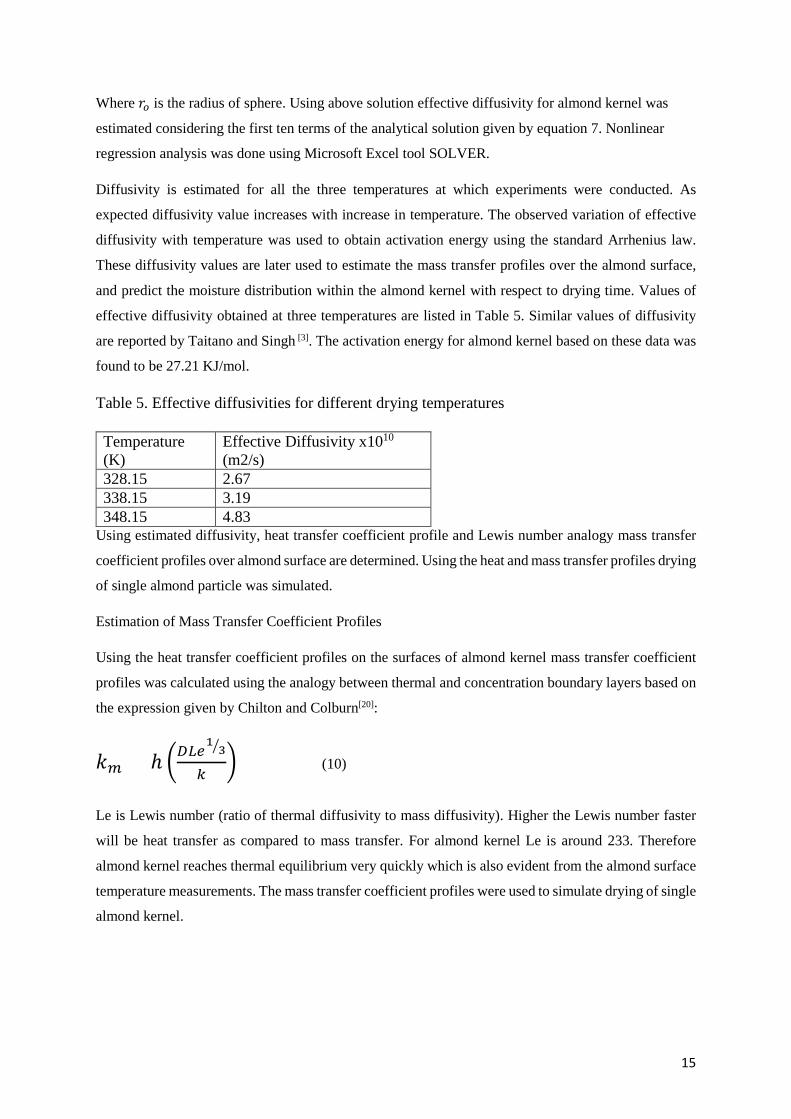
Diffusivity is estimated for all the three temperatures at which experiments were conducted. As
expected diffusivity value increases with increase in temperature. The observed variation of effective
diffusivity with temperature was used to obtain activation energy using the standard Arrhenius law.
These diffusivity values are later used to estimate the mass transfer profiles over the almond surface,
and predict the moisture distribution within the almond kernel with respect to drying time. Values of
effective diffusivity obtained at three temperatures are listed in Table 5. Similar values of diffusivity
are reported by Taitano and Singh [3]. The activation energy for almond kernel based on these data was
found to be 27.21 KJ/mol.
Table 5. Effective diffusivities for different drying temperatures
Temperature (K)
Effective Diffusivity x1010 (m2/s)
328.15 2.67 338.15 3.19 348.15 4.83
Using estimated diffusivity, heat transfer coefficient profile and Lewis number analogy mass transfer
coefficient profiles over almond surface are determined. Using the heat and mass transfer profiles drying
of single almond particle was simulated.
Estimation of Mass Transfer Coefficient Profiles
Using the heat transfer coefficient profiles on the surfaces of almond kernel mass transfer coefficient
profiles was calculated using the analogy between thermal and concentration boundary layers based on
the expression given by Chilton and Colburn[20]:
𝑘𝑘𝜕𝜕 = ℎ �𝐷𝐷𝐿𝐿𝑒𝑒13�
𝑘𝑘� (10)
Le is Lewis number (ratio of thermal diffusivity to mass diffusivity). Higher the Lewis number faster
will be heat transfer as compared to mass transfer. For almond kernel Le is around 233. Therefore
almond kernel reaches thermal equilibrium very quickly which is also evident from the almond surface
temperature measurements. The mass transfer coefficient profiles were used to simulate drying of single
almond kernel.
16
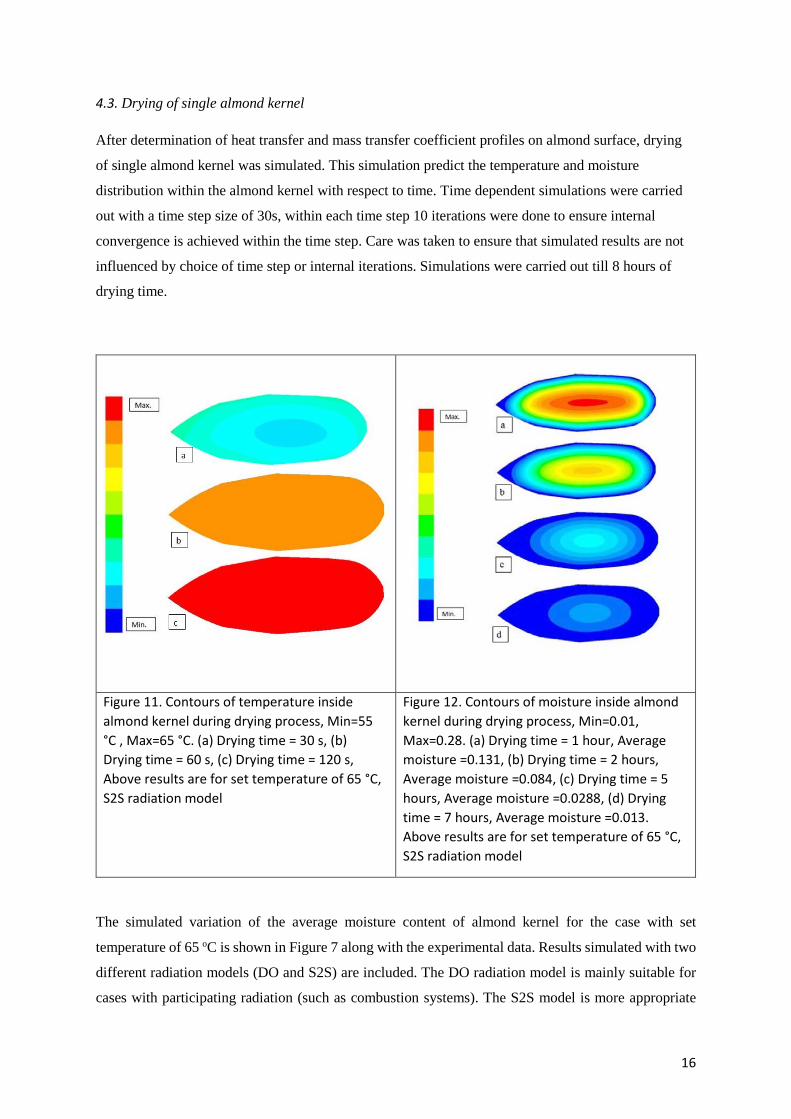
4.3. Drying of single almond kernel
After determination of heat transfer and mass transfer coefficient profiles on almond surface, drying
of single almond kernel was simulated. This simulation predict the temperature and moisture
distribution within the almond kernel with respect to time. Time dependent simulations were carried
out with a time step size of 30s, within each time step 10 iterations were done to ensure internal
convergence is achieved within the time step. Care was taken to ensure that simulated results are not
influenced by choice of time step or internal iterations. Simulations were carried out till 8 hours of
drying time.
Figure 11. Contours of temperature inside almond kernel during drying process, Min=55 °C , Max=65 °C. (a) Drying time = 30 s, (b) Drying time = 60 s, (c) Drying time = 120 s, Above results are for set temperature of 65 °C, S2S radiation model
Figure 12. Contours of moisture inside almond kernel during drying process, Min=0.01, Max=0.28. (a) Drying time = 1 hour, Average moisture =0.131, (b) Drying time = 2 hours, Average moisture =0.084, (c) Drying time = 5 hours, Average moisture =0.0288, (d) Drying time = 7 hours, Average moisture =0.013. Above results are for set temperature of 65 °C, S2S radiation model
The simulated variation of the average moisture content of almond kernel for the case with set
temperature of 65 oC is shown in Figure 7 along with the experimental data. Results simulated with two
different radiation models (DO and S2S) are included. The DO radiation model is mainly suitable for
cases with participating radiation (such as combustion systems). The S2S model is more appropriate
17
choice for modeling radiative heat transfer in enclosure, without participating media such as the Mettler
Toldeo unit considered here. It can be seen that moisture profile predicted by simulation based on S2S
model agree well with the experimental data (within experimental error bars). The results confirm that
S2S radiation model is more appropriate than the DO model for simulating heat transfer in the Mettler
Toledo halogen moisture analyzer unit.
Besides predicting drying of a single almond kernel, CFD models provide significantly more
information and insights. For example, the models also allow simulations of internal moisture and
temperature distribution (see Figure 11 & 12). The temperature variation is much faster in the almond
kernel as compared to the moisture transfer. It can be seen that reduction in moisture content of the
region near the surface is much faster than the core. Though this is obvious, CFD models provide
quantitative information about such variation. This is especially important when the drying
investigations are extended to multiple particles and to commercial drying units. In order to understand
influence of neighboring almond kernels on heat and mass transfer and therefore on drying of almond
kernel, the CFD model developed here is being extended to multi-particle system (2x2x2 block of eight
particles and 3x3x3 block of twenty-seven particles). These studies eventually allow us to build a
comprehensive model for large commercial drying units for almond kernels. The approach can be used
for other food products as well.
5. Conclusions
In this work flow field and temperature distribution within a Mettler Toledo Halogen Moisture analyzer
Excellence Plus (HX204) unit was simulated with the CFD model. Experimental data on drying of a
single almond kernel was measured at three different set temperatures, i.e. 55, 65 and 75 oC.
Experimental measurements of temperature were carried out at couple of points. The experimental data
on variation of moisture content with time was used to obtain effective drying kinetics. The data was
also used to estimate effective diffusivity of almond kernels. The CFD model was also used to simulate
variation of heat and mass transfer coefficients around almond kernel. This was then used to simulate
moisture variation within the almond kernel. The CFD model was shown to capture variation of the
average moisture content of the almond kernel quite well. The key conclusions of the work are:
• The Mettler Toledo HX204 drying unit generated reasonably up flow around the almond kernel
placed in the unit by establishing natural convection flow when the set temperature is in the
range of 55 to 75 oC.
• Net mass flow rate increases by 20% when set temperature is increased from 55 oC to 75 oC.
• Drying of a single almond kernel can be reasonably described by the drying kinetics models
reported by Verma et. al and Middili-Kucuk.

18
• CFD model based on S2S radiation model was found to capture temperature distribution within
the HX204 unit as well as variation of the average moisture content of almond kernel quite
well.
The models and approach presented here provide a firm basis for developing tools for simulating large
scale drying units for almond kernels.
Nomenclature
Mt moisture content at time t, Kg/Kg solid
(d.b)
MRequ dimensionless moisture ratio predicted
Wt weight of almond at time t, kg MRexp dimensionless moisture ratio
experimental
Wd bone dry weight of almond, kg qs surface heat flux, W/m2
h heat transfer coefficient, W/m2-K T temperature inside almond kernel, K
Ts almond surface temperature, K T∞ free stream air temperature, K
Km mass transfer coefficient, m/s Le Lewis number
k thermal conductivity, W/m-K Cp specific heat, J/kg-K
De effective diffusivity m2/s Do Arrhenius constant, m2/s
Ea Activation energy, KJ/mol Ms surface moisture content, Kg/Kg solid
Ma air moisture content, Kg/Kg dry air Me equilibrium moisture content
RMSE root mean square error R2 coefficient of determination
a,g,k,n coefficients in thin layer models ro radius of object (m)
Rg universal gas constant (8314 J/Kmol K) Φ user defined scalar
𝑒𝑒𝑖𝑖 coordinates m moisture content (Kg/Kg)
n normal to surface N number of sample points
t time (s) ρ density (Kg/m3)
19
Acknowledgements
The authors are grateful for financial support of this work by CSIR through Indus MAGIC (Innovate, develop and up-scale modular, agile, intensified and continuous processes) project [CSC 123]. The authors also gratefully acknowledge the help from Mr. Yogesh Suryawanshi in the experimental part.
References
1. Kaya, A.; Aydin, O.,; Dincer, I. Experimental and numerical investigation of heat and mass
transfer during drying of Hayward kiwi fruits. Journal of Food Engineering 2008, 88, 323-330
2. Togrul, I.T., Pehlivan, D. Modeling of drying kinetics of single apricot. Journal of Food
Engineering 2003, 58, 23–32
3. Taitano Li Z., Singh R.P., Moisture Adsorption and Thermodynamic Properties of California
Grown Almonds (Varieties: Nonpareil and Monterey). International Journal of Food Studies
2012, 1, 61-75
4. Pearson, T.C., Spectral properties and effect of drying temperature on almonds with
concealed damage. Lebensmittel-Wissenschaft und-Technologie 1999, 32 67-72.
5. Pahlevanzadeh, H.; Yazdani, M. Moisture Adsorption Isotherms and Isosteric Energy For
Almond, Journal of Food Process Engineering 2005, 28, 331-345
6. Aydin, C., Physical properties of almond nut and kernel, Journal of Food Engineering, 2003,
60, 315-320
7. Ayensu, A. Dehydration of food corps using a solar dryer with convective heat flow, Solar
Energy 1997, 59 121-126
8. Karathanos, V.T., Belessiotis, V.G. Application of a thin layer equation to drying data of
fresh and semi-dried fruits. Journal of Agricultural Engineering Research 1999, 74, 355-361
9. Akpinar, E.K., Bicer, Y., Yildiz, C., Thin layer drying of red pepper. Journal of Food
Engineering 2003, 59, 99–104.
10. Verma, L.R., Bucklin, R.A., Endan, J.B., Wratten, F.T. Effects of drying air parameters on
rice drying models. Transactions of the ASAE 1985, 28, 296–301
11. Midilli, A., Kucuk, H., Yapar, Z. A new model for single layer drying. Drying Technology
2002, 20 (7), 1503–1513
12. ElGamal, R.; Ronsse, F.; Radwan, S.M; Pieters, J. G. Coupling CFD and Diffusion Models
for Analyzing the Convective Drying Behavior of a Single Rice Kernel, Drying Technology
2014, 32 311-320
13. Ranjbaran, M., Emaid, B., Zare, D., CFD Simulation of Deep-Bed Paddy Drying Process and
Performance. Drying Technology 2014, 32, 919-934
14. Jamaleddine, T.J., Ray, M.B. Application of Computational Fluid Dynamics for Simulation of
Drying Proceses: A Review. Drying Technology 2010, 28, 120-154
20
15. Operating Instructions Manual for Moisture Analyzer Excellence Plus HX204, Mettler
Toledo
16. Togrul, H. Suitable drying model for infrared drying of carrot. Journal of Food Engineering
2006, 77, 610-619
17. ASHARE Handbook-Refrigeration SI 2006
18. Ansys® Ansys Fluent-Solver v 14.5, Theory Guide
19. Ranade, V.V., Computational flow modeling for chemical reactor engineering, Academic
Press, London. 2002
20. Chilton, T.H,; colburn, A.P. Mass Transfer (absorption) coefficients: prediction from data on
heat transfer and fluid friction. Industrial & Engineering Chemistry 1934, 26(11), 1183-1187.
21. Crank, J. The mathematics of diffusion, Clarendon Press-Oxford, Second Edition 1975