
Dry Time Kinetics Overview
79
Inkjet Dry Time Kinetics An Overview of the Mathematical Physics Bob Cornell [email protected] Print Systems Science February 17, 2012 (after April 30, 2012)
-
Upload
robert-cornell -
Category
Documents
-
view
363 -
download
0
Transcript of Dry Time Kinetics Overview

Inkjet Dry Time Kinetics An Overview of the Mathematical Physics
Bob Cornell [email protected] Print Systems Science
February 17, 2012
(after April 30, 2012)

To move into the space traditionally dominated by laser printers, the speed and
print quality of inkjet printers needs to be on par with EP. The speed and print quality
attributes have been addressed; however, along the way a new artifact has emerged.
As we move forward into even faster devices - and even more demanding customer
environments - dry time kinetics needs to be engineered into the products as
robustly as all the other features and functions.
Motivation
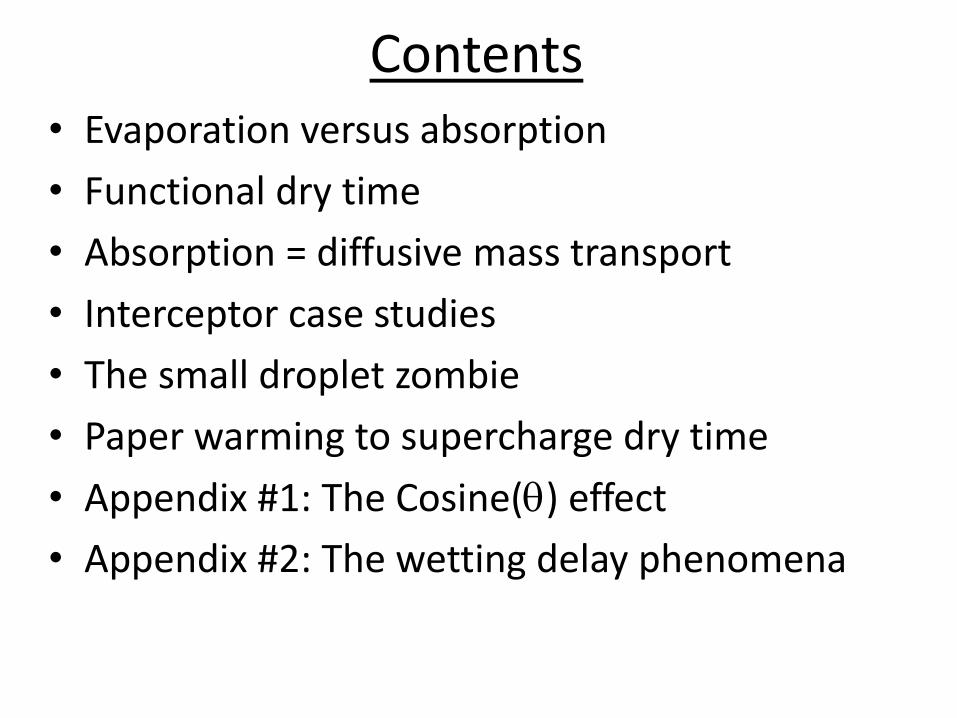
Contents • Evaporation versus absorption
• Functional dry time
• Absorption = diffusive mass transport
• Interceptor case studies
• The small droplet zombie
• Paper warming to supercharge dry time
• Appendix #1: The Cosine(q) effect
• Appendix #2: The wetting delay phenomena

Admittedly, this is a lengthy document to call an Overview. However, this document is intended to be a stand-alone epistle that does not require verbal, stand-up narration. Hopefully, it captures all of the analysis and research on this topic that has evolved over the course of this lengthy investigation, and hopefully, it presents it in a manner that is interesting and useful to future LXK investigations on this topic. Lastly, it is hoped that this document gives timely, quantitative guidance to the system and product engineers responsible for defining the architecture of our next generation product lines. The models and literature described herein are stored on the Public Drive: inkjet-data(\\lexfile15) Q: PUBLIC/Dry Time Kinetics
Preface
Let’s begin the investigation by examining just what goes on at the ink-paper and ink-air interfaces.

Paper Surface Roughness
Ink Surface at Time Zero
Evapora
tion
Absorp
tion
Time Zero - Just After Droplet Impact
The Onset of Evaporation and Absorption
Ink Layer

Water Management • Many people assume that water management implies water evaporation. Thus sizing
a drier is simply:
• In 1996, HP’s Ross Allen presented a paper at IS&T-NIP12, where he discussed his calculations for the drier requirements of a page-wide machine.
• This article stated that the drier needed to be an astonishing 4300 Watts. – Sidebar: HP’s Edgeline woes may have had their genesis with the back-of-the-envelope calculations
contained within the Ross Allen article. It is well-known that they nearly required 220V to supply power to this beast. They barely made it under the max power capability of 115V wall plugs.
• In a 1990 presentation at the SPIE Conference, Arthur Gooray, of Xerox, presented his evaporation calculations that cited a need for 3000 Watts to dry 50 ppm.
• Both of these calculations are supposedly based upon the laws of thermodynamics. • However, they are both absurd and misleading. We will show that attacking the
problem from the absorption front reduces power by an order of magnitude. • Lastly, ink may be mostly water from a mol-fraction viewpoint, but from a wt.%
viewpoint it is only ~70% water. Typical inkjet inks contain 15-20 wt.% low vapor pressure liquids from the glycol family. These liquids have a boiling point ~300C, so they are not affected by attempts to evaporate them with heated driers.
kg
JH
CT
Ckg
JC
s
kgm
HTCmP
p
pEvap
nevaporatio ofheat latent
re temperatuRoom -point Boiling Rise eTemperatur
ink theofheat specific
dryingfor available time
evaporate tomassink
(Watts) RequiredPower n Evaporatio

Water Management is Simply Evaporation, Right?
Ambient pressure = Pamb (Pa)
Ambient temperature = Tamb (C)
Relative humidity = RH (%)
Normal boiling point = Tboil (C)
Latent heat of evaporation = hfg (J/g)
Liquid molecular weight = Mliquid (g/mol)
Liquid density = rho_liquid (g/cm^3)
Air molecular weight = Mair (g/mol)
Air-water diffusivity = Dab (cm^2/s)
Absorption coefficient = Ka (mL/m^2/ms^0.5)
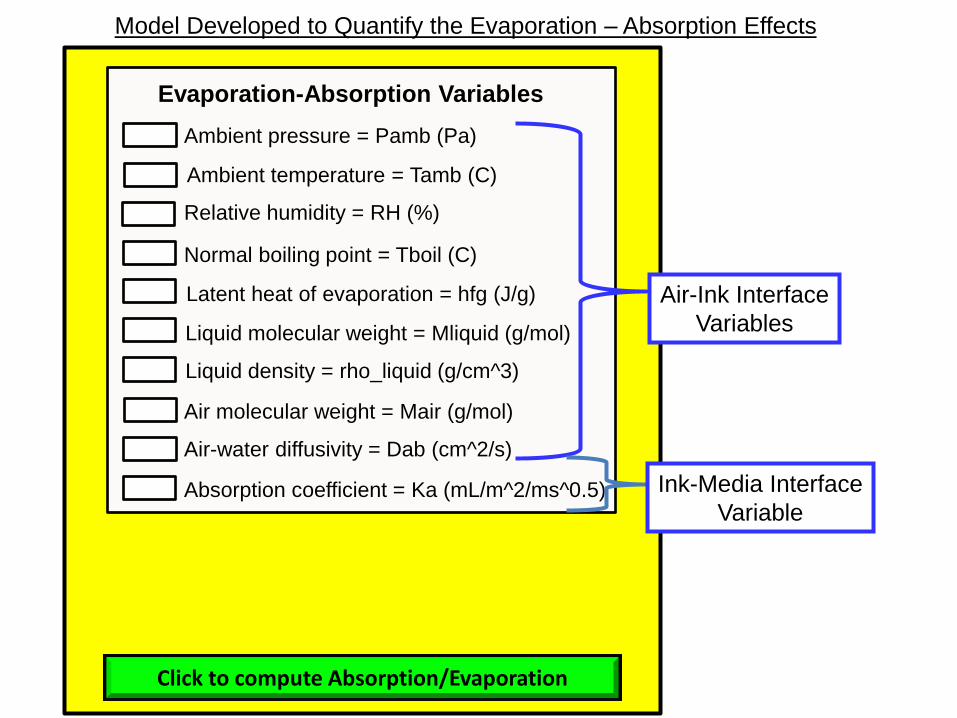
Evaporation-Absorption Variables
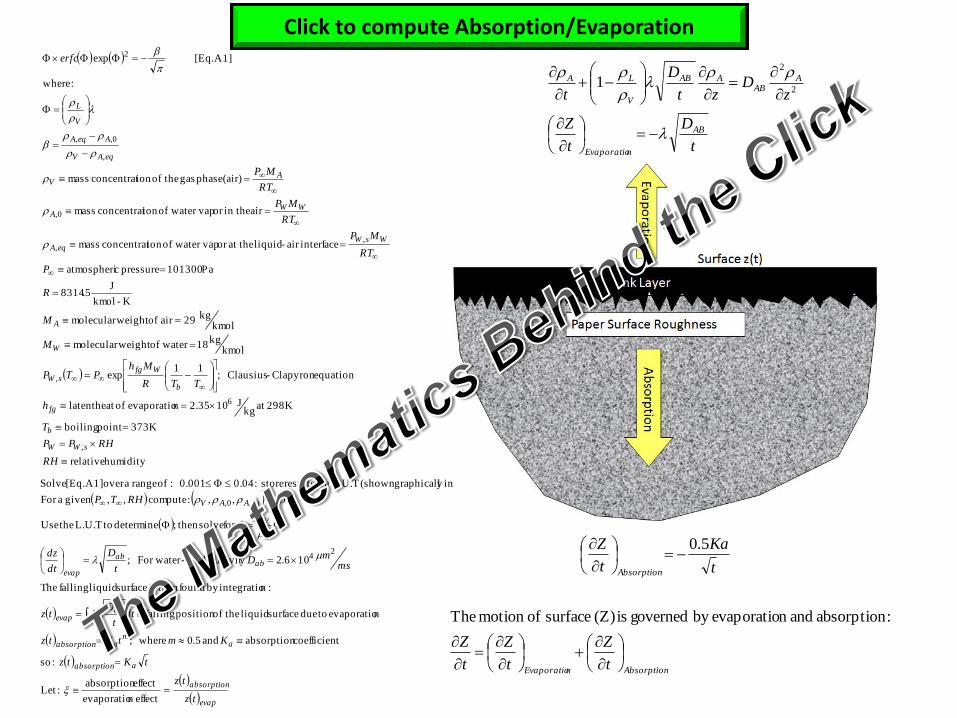
Click to compute Absorption/Evaporation
Model Developed to Quantify the Evaporation – Absorption Effects
Air-Ink Interface
Variables
Ink-Media Interface
Variable

The Air-Ink-Interface is described by the laws of thermodynamics, but how do we quantify the Ink-Media-Interface?

The Ink-Media Interface Response is Typically Measured With a Bristow Tester
Historical footnote: J.A. Bristow developed this tester while working for the Swedish Packaging
Research Institute in Stockholm (circa 1967).

Absorp
tion V
olu
me p
er
Unit S
urf
ace A
rea (
mL/m
2)
)(ms )( 0.5mstime
Vo
Vp
wetting
delay *
Vo = amount of liquid that fills the surface voids
before capillary forces drive absorption
Typical Bristow Test: Absorption Response for Paper-Ink Pair
* The wetting delay is discussed in Appendix #2

Typical Bristow Test Results*
* Selim, Yesavage, Al-Ubaidi, Sung, Drying of Water-Based Inks on Plain Paper,
Colorado School of Mines Report for IBM, (1989).
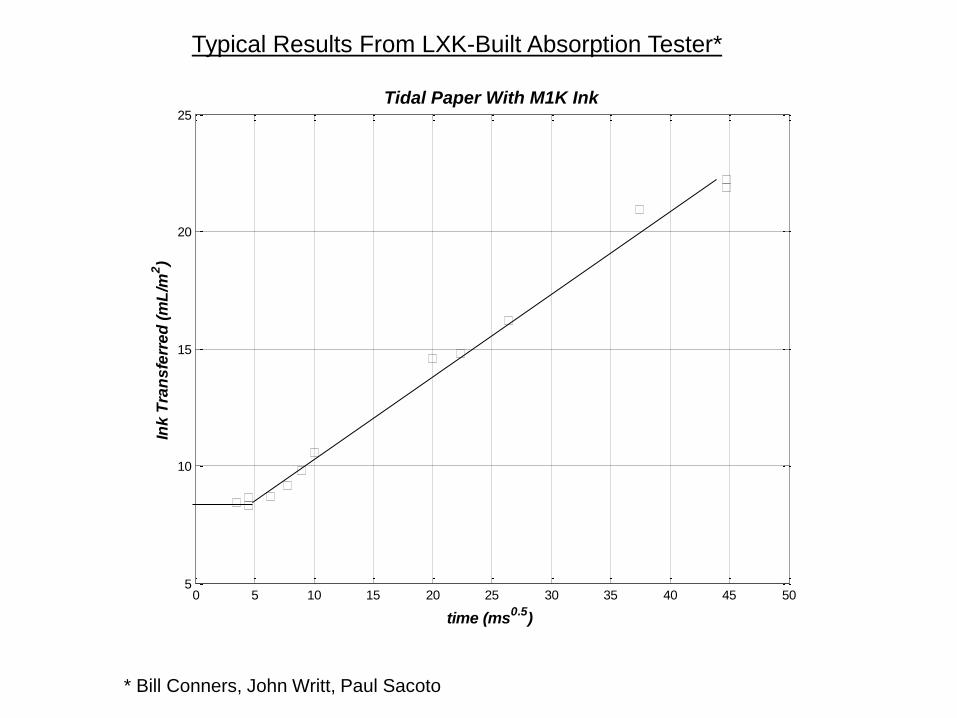
Typical Results From LXK-Built Absorption Tester*
* Bill Conners, John Writt, Paul Sacoto
0 5 10 15 20 25 30 35 40 45 505
10
15
20
25
time (ms0.5
)
Ink
Tra
ns
ferr
ed
(m
L/m
2)
Tidal Paper With M1K Ink

Ref: S. Bares, K. Rennels, Paper Compatibility With Next Generation Ink-Jet Printers, TAPPI Journal, (1990).
Common Theme in the Literature:
The Absorption Coefficient (Ka) Must be Less Than ~0.25 to Achieve Good PQ
humidity relative
K 373point boiling
298Kat kg
J10 2.35n evaporatio ofheat latent
equationClapyron -Clausius ;11
exp
kmolkg 18 waterofweight molecular
kmolkg
29air ofweight molecular
K-kmol
J5.8314
Pa 101300pressure catmospheri
interfaceair -liquid at theor water vapofion concentrat mass
air in theor water vapofion concentrat mass
(air) phase gas theofion concentrat mass
:where
A1] [Eq. exp
,
6
,
,,
0,
,
0,,
2
RH
RHPP
T
h
TTR
MhPTP
M
M
R
P
RT
MP
RT
MP
RT
MP
erfc
sWW
b
fg
b
WfgsW
W
A
WsWeqA
WWA
AV
eqAV
AeqA
V
L
evap
absorption
aabsorption
am
aabsorption
abevap
abab
evap
L
V
eqAAV
tz
tz
tKtz
KmtKtz
dtt
Dtz
msmD
t
D
dt
dz
RHTP
effectn evaporatio
effect absorption :Let
:so
tcoefficien absorption and 5.0 where;
nevaporatio todue surface liquid theofposition falling
:nintegratioby found then is surface liquid falling The
106.2y diffusivitair -For water ;
for solve then ; determine toL.U.T theUse
,, :compute ,,given aFor
below) A1 Figurein y graphicall(shown L.U.T ain results store :0.040.001 :of range aover A1] [Eq. Solve
24
,0,
t
D
t
Z
zD
zt
D
t
AB
nEvaporatio
AAB
AAB
V
LA
2
2
1
t
Ka
t
Z
Absorption
5.0
AbsorptionnEvaporatio t
Z
t
Z
t
Z
:absorption andn evaporatioby governed is (Z) surface ofmotion The
Click to compute Absorption/Evaporation

0 0.1 0.2 0.3 0.4 0.5 0.6 0.7 0.8 0.9 10
100
200
300
400
500
600 15 C
20 C
25 C
30 C
35 C
40 C
45 C
50 C 55 C 60 C 65 C 70 C 75 C 80 C
Comparison Between the Effect of Absorption and Evaporation
Relative Humidity
=
Ab
so
rpti
on
Ra
te/E
va
po
rati
on
Ra
te
Ka = 0.25 (mL/m2/ms
0.5)
Absorption/Evaporation = 96: at Tamb = 25 (C), RH = 40 %
Dry-Time-Kinetics
14-Feb-2012
Evaporation-Vs-Absorption-GUI
For typical environments and typical ink-media pairs, the absorption effect
is about two orders of magnitude more dominant than the evaporation effect.
Thus if we want to supercharge the dry time kinetics, it is best to work with
the parameter having the biggest lever - absorption.
Model Results

With this preamble finished, let us now focus upon how we may enhance absorption. It is important to note that HP8600 chose to address this problem via ink formulation. Not surprisingly, their faster penetrating ink option also resulted in very noticeable PQ degradation with an L* value reminiscent of process black (on non-color lock media). Trading PQ for speed would be a step backwards for LXK after our hard fought (and won) multi-year battle to produce PQ at speed.

Ambient pressure = Pamb (Pa)
Ambient temperature = Tamb (C)
Relative humidity = RH (%)
Normal boiling point = Tboil (C)
Latent heat of evaporation = hfg (J/g)
Liquid molecular weight = Mliquid (g/mol)
Liquid density = rho_liquid (g/cm^3)
Air molecular weight = Mair (g/mol)
Air-water diffusivity = Dab (cm^2/s)
Absorption coefficient = Ka (mL/m^2/ms^0.5)
Evaporation-Absorption Variables
Single droplet (pL)
Solid ink coverage (pL/600 dpi) Enter a value
Click to compute Absorption/Evaporation
Select the Ink Coverage
Now Let’s Use the Model to Compute Functional Dry-Time
Air-Ink Interface
Ink-Media Interface
Ink Coverage

Paper Surface
Ink Has Dropped Below The Surface Roughness Level
Ink Penetration Front
Functional Dry-Time*
* Note: The ink is still subject to smearing if rubbed by a finger at this point
in the drying process; however, it is dry enough to prevent offset-smear, or snow-plowing
onto the next print in the queue.
According to the literature, functional dry-time is a measure of when offset smear does not occur.
The point at which this occurs is when the ink layer drops below the microscopic hill tops that
exist on all papers.

When the droplets hit the media they make a transition from sphere to pancake. Since ink impact is the genesis of the dry-time event, let us begin our quest by closely examining the physics of this event.

Pancake Formation at Droplet Impact
*Ref: A. Asai, et.al., Impact of Ink Drop on Paper, IS&T-NIP7, (1991).
This study* evaluated the droplet spreading response of various ink formulations across
a range of media types. It concluded that spreading was entirely due to dimensionless
properties of the droplet: Weber number (We), Reynolds number (Re). Media type
(copy, bond, transparent film) had no effect, nor did surface coating or roughness.
While these parameters affect the capillary response, Asai found that the spread factor
(i.e. the initial conditions for the ensuing capillary event) of any inkjet droplet are
determined solely by We and Re.

Asai’s Inertial Spreading Response
impact prior todiameter droplet
impactafter diameter pancake final*
1] [Eq. Re48.1exp48.01*
:equation regression sAsai'
21.022.0
d
D
W eW ed
D
Historical Footnote: Akria Asai is one of the world’s original pioneers in the science of thermal inkjet.
Dr. Asai authored many scientific articles during his career at Canon. I had the privilege of
meeting him at an IS&T function in 1990.

impact @locity droplet ve
impact @ tension surfacedroplet
impact @scosity droplet vi
densitydroplet
lumedroplet vo
6
impactdroplet after diameter pancake final*
2] [Eq. 5.1exp2
*
22.0
21
31
f
d
fd
fd
U
a
D
UaUaD
Asai’s equation may be re-arranged as shown below. In this form, it shows us that the
droplet’s spreading response at impact should behave somewhat like a function of
droplet volume to the 1/3 to 1/2 power. For impact velocity equal to zero, the 1/3 power
dominates, and as impact velocity increases, the ½ power term dominates.
This observation will be important when we later discuss the small droplet zombie.
D*

As droplets travel between the ejector and the media surface - aerodynamic drag effects a
non-trivial deceleration. Aerodynamic deceleration is a nonlinear function of droplet size.
Mist investigations conducted during the Newman timeframe led to an aerodynamic model* to
evaluate the forces acting upon the droplet in-flight. Using that model, we can estimate (Uf)
at impact. It can be shown that the deceleration effect may be estimated by [Eq. 3].
This equation represents a regression on the simulation results for droplets ranging from
1.5 to 150 picoliters (pL) traversing a media gap of 1.65 mm.
Sidebar: For typical droplets during typical inkjet flight time, it can be shown that droplet
evaporation is negligible – on the order of 1%. Therefore, it is reasonable to ignore the
in-flight evaporation effect.
(pL) lumedroplet vo
locitydroplet ve initial
ocityimpact veldroplet
3] [Eq. log85.0
0
2.010
0
d
f
df
U
U
U
U
*Ref. R. Cornell, Misting Analysis.ppt (6/2009).
Accounting for Aerodynamic Drag in the Spread Factor Droplet Velocity Term (Uf)

It has been this author’s experience that ink-media spread does tend to behave in a
fashion somewhat like a (Vol)1/2 power. Others have reported similar results.
On the occasions that droplet size-spot size experiments have been run, it has been
the collective LXK experience that ink-media spread does tend to follow a response curve
that is described by a regression equation to the ~ 1/2 power.
A particular example is illustrated below, along with the response predicted by [Eq. 2-3]
0 5 10 15 20 25 30 350
20
40
60
80
100
120
Droplet Volume (pL)
Sp
ot
Dia
me
ter
on
th
e M
ed
ia (
m
)
Typical Droplet Impact Response
[Eq. 2-3]
LXK-JP/RG Experiment
Dry-Time-Kinetics
20-Jan-2012
Plot-Impact-Spread
[Eq. 2-3]
Ink-media spread factor regression result:
D* = 18.8(pL)0.5
Ref: Jim Powers & Rich Goin 1/29/2001
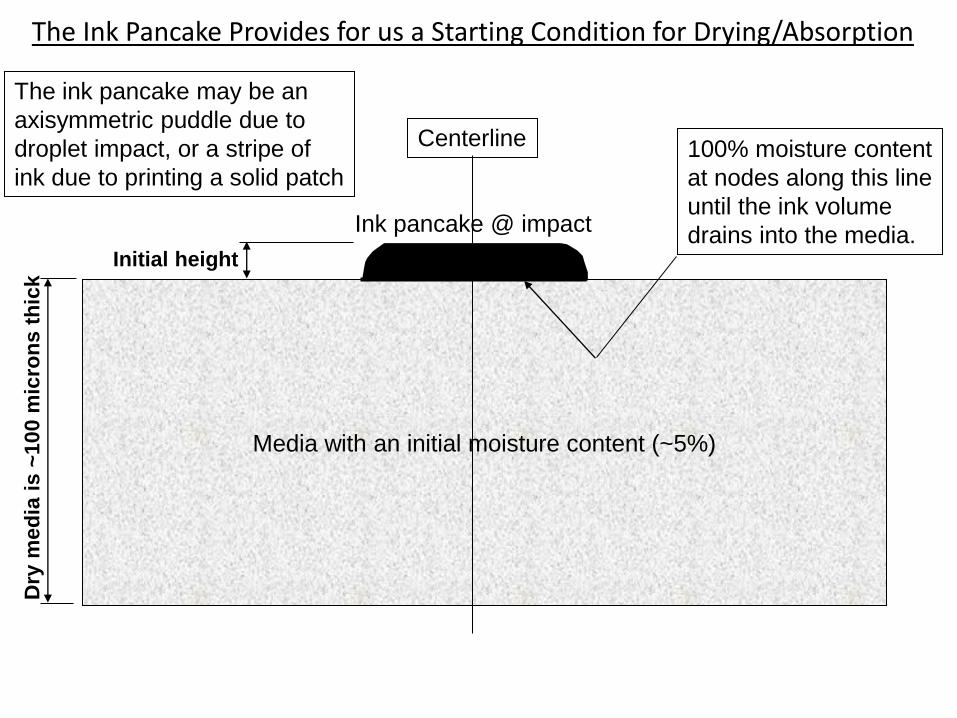
The Ink Pancake Provides for us a Starting Condition for Drying/Absorption
Media with an initial moisture content (~5%)
Ink pancake @ impact
Centerline 100% moisture content
at nodes along this line
until the ink volume
drains into the media. Initial volume
The ink pancake may be an
axisymmetric puddle due to
droplet impact, or a stripe of
ink due to printing a solid patch
Initial height
Dry
med
ia i
s ~
10
0 m
icro
ns t
hic
k

When one studies the literature, a common variable keeps popping up that
others use to describe the ink-media penetration mechanics.
It is Ka --- the Absorption coefficient.
Indeed the determination of Ka is the primary objective of Bristow Testers.
The variable Ka is always reported in units of mL/m2/ms0.5
With a small amount of manipulation it becomes apparent that Ka2 has units
of m2/s. This is important because all diffusion equations have a m2/s term.
Thermal diffusivity has units of m2/s. Mass diffusivity has units of m2/s.
Viscous diffusivity has units of m2/s. Even charge carrier flow per volt in a
semiconductor has units of m2/s.
This m2/s observation is important because it says that if we can measure Ka
experimentally – which we can – we may then solve the diffusion equation to
quantitatively determine the ink-media penetration behavior. This will allow us
to estimate functional dry time a-priori – just from the Ka experiment . Having a
means of predicting dry-time from an offline piece of test equipment, will avert
the late-DVT smear surprises like we had on Interceptor.
The Absorption Coefficient (Ka)
3610 : mmLNote

Diffusive Mass Transport Ink Absorption Mechanism
time
ionconcentrat species
t coefficiendiffusion
:Law 2nd sFick'
22
2
2
2
2
2
2
2
t
Ks
mD
Dtzyx
D
aa
aa
We can solve this equation by any convenient numerical means.
The most powerful and flexible method of solving any given p.d.e.
is arguably – the finite element method.
Historical Footnote:
Adolf Fick (Germany 1829-1901) was studying to become a physician, but he was also very
interested in mathematics and physics. Fick’s laws of diffusion were similar to Fourier’s laws of
heat transfer. Fourier (1768-1830) showed that heat transfer was a function temperature gradient,
while Fick showed that mass transport was a function of concentration gradient. Fick’s laws were
experimentally validated 25 years after he posed it theoretically.
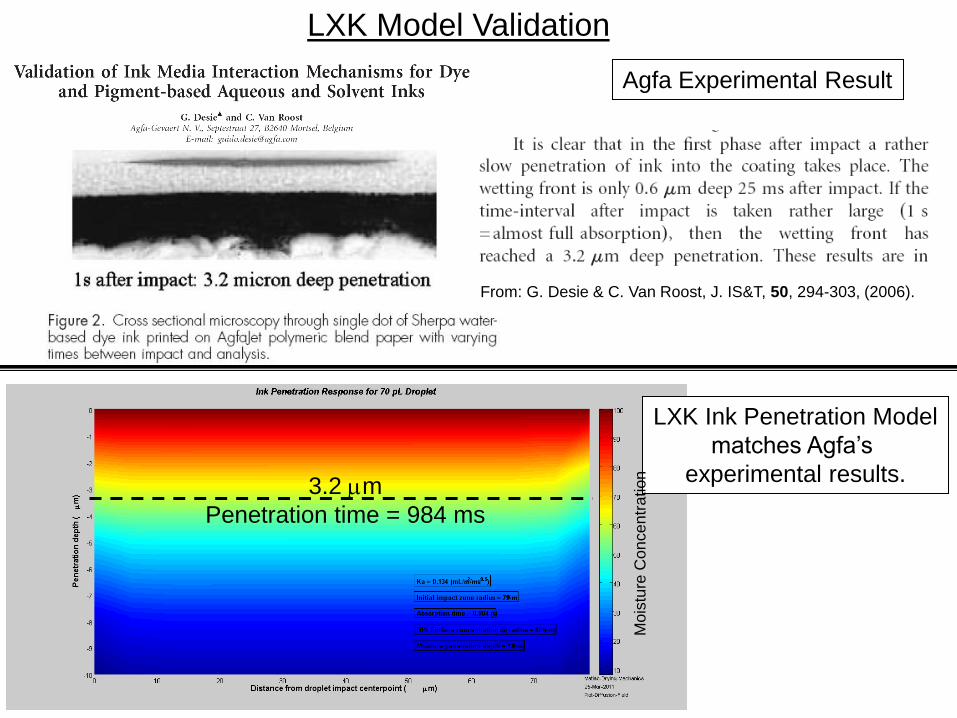
LXK Ink Penetration Model
matches Agfa’s
experimental results.
Agfa Experimental Result
3.2 m
Penetration time = 984 ms
Mo
istu
re C
on
ce
ntr
ation
LXK Model Validation
From: G. Desie & C. Van Roost, J. IS&T, 50, 294-303, (2006).

Dry Time Examples

Already printed
Colu
mn 1
Colu
mn 2
Colu
mn 3
Colu
mn 4
30 in/s
18 KHz 1/600”
1/600” 1/600”
1/1800”
1/1800”
1/1800”
pixel dpi 600
pL5.22
dot
pL5.7
in 600
21800
3
dots 6 Coverage
2
Mariner Mono Ink Coverage
22.5 pL / 600 dpi
During full swath printing
the chip warms and actually
jets ~8 pL/fire, so the solid
fill coverage may actually
be closer to 24 pL/600 dpi.

Typical L* Versus Coverage Response Yellowstone Mono Dot Size vs. L* Study; Hammermill Laser Print
20
22
24
26
28
30
32
34
36
38
5.00 15.00 25.00 35.00 45.00 55.00 65.00 75.00 85.00
Ink Area Density [ ng / (1/600 in.)² ]
L*
7-9 ng 10-11 ng 12-13 ng 18-20 ng 21-23.5 ng 24-26 ng
Interceptor 7.5 pL droplet(2012)
Babbage 28 pL droplet (1997)
Monet 112 pL droplet (1995)
Picasso 135 pL droplet (1992)
Over a 20 year time frame, mono-droplet size has changed by ~20X; however, the solid fill
ink-volume per unit area has changed very little…because customers want black, not gray.
Solid Fill Ink Coverage (pL per 600 dpi pixel)
Representative L* versus coverage data from Colin Maher
Solid Fill for Mono Inkjet
Canon and HP’s inkjet history maps into this envelope as well

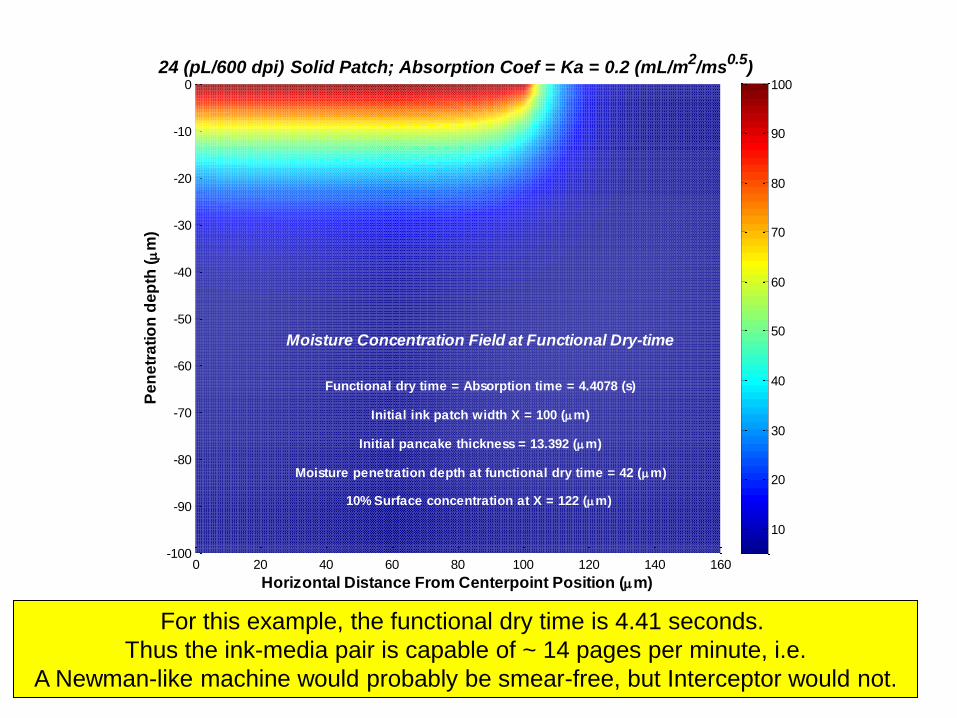
Example 1: Hot Interceptor Head 24 pL/600 dpi Pixel Solid Patch of Ink
24
0 20 40 60 80 100 120 140 160-100
-90
-80
-70
-60
-50
-40
-30
-20
-10
0
Horizontal Distance From Centerpoint Position (m)
24 (pL/600 dpi) Solid Patch; Absorption Coef = Ka = 0.2 (mL/m2/ms
0.5)
Pe
ne
tra
tio
n d
ep
th (
m
)
10
20
30
40
50
60
70
80
90
100
Moisture Concentration Field at Functional Dry-time
Functional dry time = Absorption time = 4.4078 (s)
Moisture penetration depth at functional dry time = 42 (m)
Initial pancake thickness = 13.392 (m)
10% Surface concentration at X = 122 (m)
Initial ink patch width X = 100 (m)
For this example, the functional dry time is 4.41 seconds.
Thus the ink-media pair is capable of ~ 14 pages per minute, i.e.
A Newman-like machine would probably be smear-free, but Interceptor would not.

Example 2: Nominal Interceptor Head 22.5 pL/600 dpi Pixel
Solid Patch of Ink
22.5

For this example, the functional dry time is 3.93 seconds.
Thus the ink-media pair is capable of ~ 15 pages per minute, i.e.
A Newman-like machine would probably be smear-free, but Interceptor would not.
0 20 40 60 80 100 120 140 160-100
-90
-80
-70
-60
-50
-40
-30
-20
-10
0
Horizontal Distance From Centerpoint Position (m)
22.5 (pL/600 dpi) Solid Patch; Absorption Coef = Ka = 0.2 (mL/m2/ms
0.5)
Pe
ne
tra
tio
n d
ep
th (
m
)
10
20
30
40
50
60
70
80
90
100
Moisture Concentration Field at Functional Dry-time
Functional dry time = Absorption time = 3.9345 (s)
Moisture penetration depth at functional dry time = 39 (m)
Initial pancake thickness = 12.555 (m)
10% Surface concentration at X = 120 (m)
Initial ink patch width X = 100 (m)
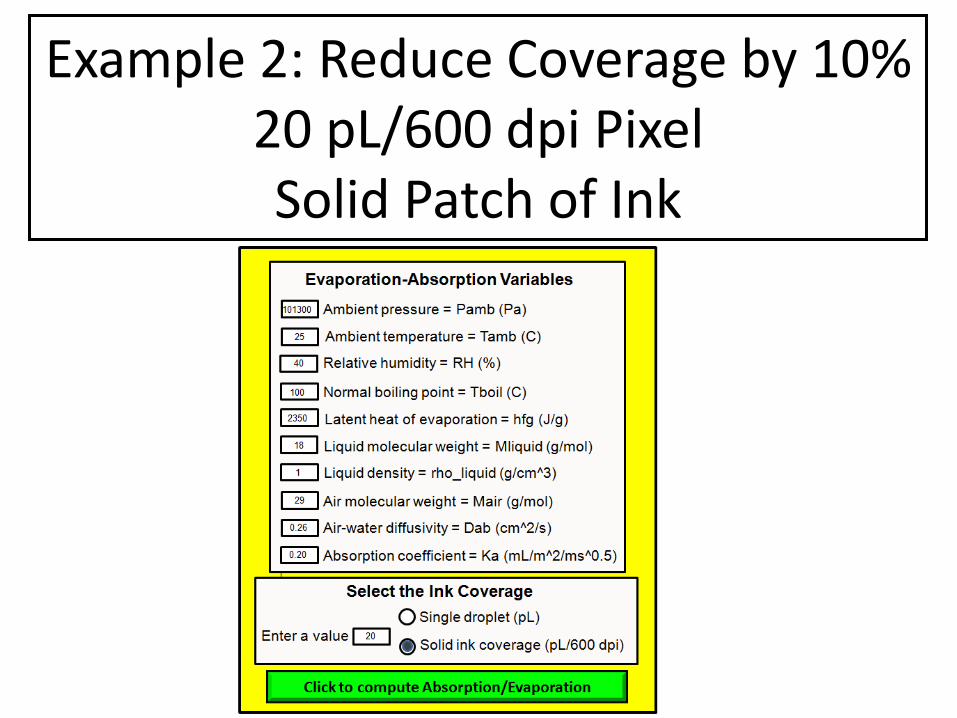
Example 2: Reduce Coverage by 10% 20 pL/600 dpi Pixel Solid Patch of Ink

0 20 40 60 80 100 120 140 160-100
-90
-80
-70
-60
-50
-40
-30
-20
-10
0
Horizontal Distance From Centerpoint Position (m)
20 (pL/600 dpi) Solid Patch; Absorption Coef = Ka = 0.2 (mL/m2/ms
0.5)
Pe
ne
tra
tio
n d
ep
th (
m
)
10
20
30
40
50
60
70
80
90
100
Moisture Concentration Field at Functional Dry-time
Functional dry time = Absorption time = 3.1656 (s)
Moisture penetration depth at functional dry time = 35 (m)
Initial pancake thickness = 11.16 (m)
10% Surface concentration at X = 117 (m)
Initial ink patch width X = 100 (m)
Reducing the solid ink fill by 10% reduces the functional dry time to 3.17 seconds.
So this ink-media pair is capable of ~19 pages per minute. While, not quite
smear-free at 20 ppm, reducing solid fill by 10% is a big improvement.

Obviously, Reducing Coverage is not a Sustainable Strategy to Address Dry Time Kinetics on Even Faster Machines
Yellowstone Mono Dot Size vs. L* Study; Hammermill Laser Print
20
22
24
26
28
30
32
34
36
38
5.00 15.00 25.00 35.00 45.00 55.00 65.00 75.00 85.00
Ink Area Density [ ng / (1/600 in.)² ]
L*
7-9 ng 10-11 ng 12-13 ng 18-20 ng 21-23.5 ng 24-26 ng
100%
Interceptor
90%
Interceptor
Visibly lighter print
Representative L* versus coverage data from Colin Maher
So reducing coverage by 10% effects 1-2 L* units of variation. Is this important?
Thus it may be asked: “How much L* variation is needed to be detectable by humans?”
The answer is that our vision system can detect ~ 0.4 L* units of change in solid-fill black regions.
So, the answer is – yes – reducing solid fill coverage is detectable by the human vision system.

What about the effect of droplet size? -------------------------------------------------- Doesn’t Memjet state that smaller droplets are their key to dry prints at 60ppm? -------------------------------------------------- Let us use the model to put their statement to the test.
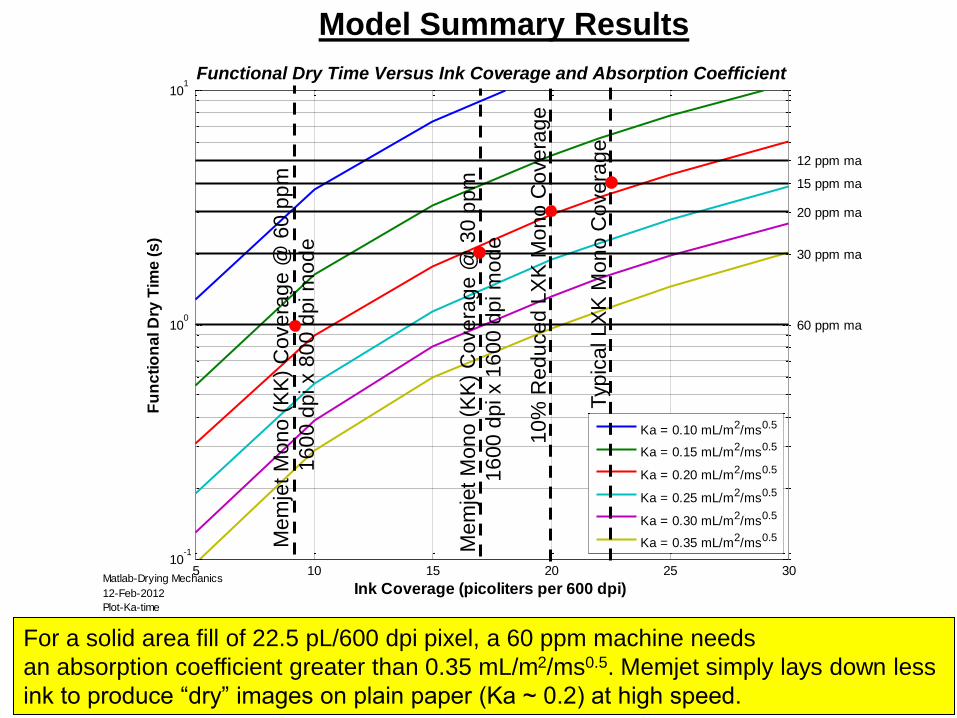
5 10 15 20 25 3010
-1
100
101
Ink Coverage (picoliters per 600 dpi)
Fu
nc
tio
na
l D
ry T
ime
(s
)
Functional Dry Time Versus Ink Coverage and Absorption Coefficient
60 ppm max
30 ppm max
20 ppm max
15 ppm max
12 ppm max
Ka = 0.10 mL/m2/ms0.5
Ka = 0.15 mL/m2/ms0.5
Ka = 0.20 mL/m2/ms0.5
Ka = 0.25 mL/m2/ms0.5
Ka = 0.30 mL/m2/ms0.5
Ka = 0.35 mL/m2/ms0.5
Matlab-Drying Mechanics
12-Feb-2012
Plot-Ka-time
Model Summary Results
For a solid area fill of 22.5 pL/600 dpi pixel, a 60 ppm machine needs
an absorption coefficient greater than 0.35 mL/m2/ms0.5. Memjet simply lays down less
ink to produce “dry” images on plain paper (Ka ~ 0.2) at high speed.
Typic
al LX
K M
ono C
overa
ge
Mem
jet
Mono (
KK
) C
overa
ge @
60 p
pm
16
00
dp
i x 8
00
dp
i m
od
e
Mem
jet
Mono (
KK
) C
overa
ge @
30 p
pm
16
00
dp
i x 1
60
0 d
pi m
od
e
10%
Reduced L
XK
Mono C
overa
ge

The plot on the previous page illustrates that Memjet’s dry time has nothing to do with their droplet size choice. Rather it is simply the expected result of putting down far less ink than we do (which manifests itself in gamut an OD deficiencies). ------------------------------------------------------------------------------- Still, there is a persistent belief that smaller droplets should be faster drying than larger droplets. This leads to the widely held postulate that 60 ppm dry time can only be achieved with small, Memjet-like droplets. -------------------------------------------------------------------------------- Let us examine this postulate from yet another quantitative viewpoint.
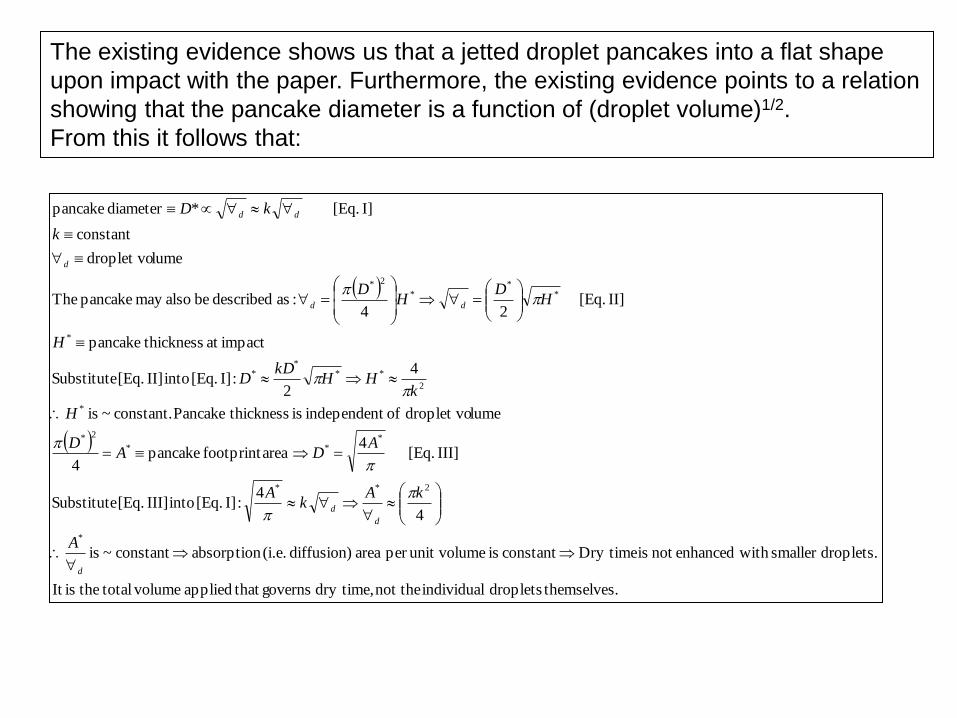
The existing evidence shows us that a jetted droplet pancakes into a flat shape
upon impact with the paper. Furthermore, the existing evidence points to a relation
showing that the pancake diameter is a function of (droplet volume)1/2.
From this it follows that:
s. themselvedroplets individual not the dry time, governs that applied volume total theisIt
droplets.smaller with enhancednot is Dry timeconstant is eunit volumper area diffusion) (i.e. absorptionconstant~ is
4
4 :I] [Eq. into III] [Eq. Substitute
III] [Eq. 4
areafootprint pancake4
lumedroplet vo oft independen is thicknessPancake constant. ~ is
4
2 :I] [Eq. into II] [Eq. Substitute
impactat thicknesspancake
II] [Eq. 24
:as described be alsomay pancake The
lumedroplet vo
constant
I] [Eq. *diameter pancake
*
2**
***
2*
*
2
***
*
*
**
*
2*
d
d
d
dd
d
dd
A
kAk
A
ADA
D
H
kHH
kDD
H
HD
HD
k
kD

Undoubtedly, some will still insist that smaller droplets are the key to dry time improvements. Unfortunately, LXK mythology is harder to kill than zombies. To this, I offer no further analysis, and simply advise the purchase of this survival kit.
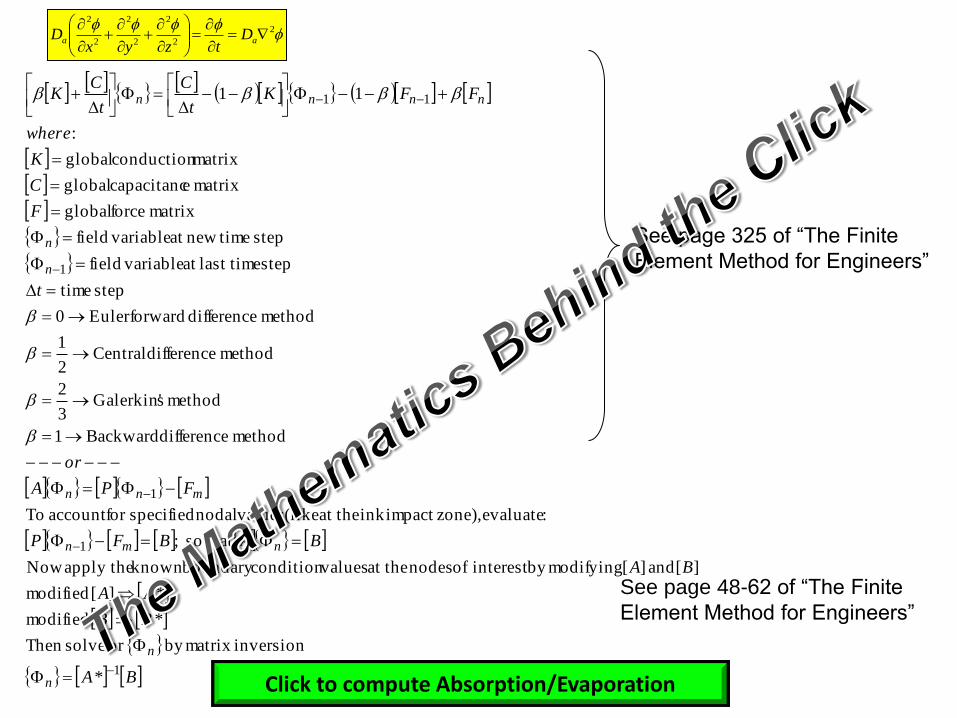
BA
BB
AA
BA
BABFP
FPA
or
t
F
C
K
where
FFKt
C
t
CK
n
n
nmn
mnn
n
n
nnnn
1
1
1
1
11
*
inversionmatrix by for solveThen
* modified
*][ modified
][ and ][ modifyingby interest of nodes at the valuescondition boundary known apply the Now
that so ;
:evaluate zone),impact ink at the (like valuesnodal specifiedfor account To
method difference Backward1
method sGalerkin'3
2
method difference Central2
1
method difference forwardEuler 0
step time
step last timeat variablefield
step timenewat variablefield
matrix force global
matrix ecapacitanc global
matrix conduction global
:
11
See page 325 of “The Finite
Element Method for Engineers”
See page 48-62 of “The Finite
Element Method for Engineers”
Click to compute Absorption/Evaporation
2
2
2
2
2
2
2
aa D
tzyxD

Using Paper Warming to Effect Increased Absorption
Motivation: Absorption is several orders of magnitude more effective
than brute force evaporation.

10 20 30 40 50 60 70 80 90 10010
20
30
40
50
60
70
80
90
100
Temperature (C)
Su
rface T
en
sio
n/V
isco
sit
y (
m/s
)
M1K-Mono Ink (/)
media theof size pore sticcharacteri
interface media-ink at the anglecontact
ink theof viscositydynamic
ink theof tension surface
cost coefficien Absorption
: thatknow We
c
ca
r
rK
q
q
Postulate: We may increase absorption (Ka) by taking advantage of the response shown below.
It can be shown that that the response of (/) to temperature is 400X stronger than the response of cos(q) to temperature. The cos(q) effect is discussed more fully in Appendix #1.

20 30 40 50 60 70 801
1.5
2
2.5
Media Temperature at the Print Zone (C)
Ab
so
rpti
on
Co
eff
icie
nt
Mu
ltip
lie
r
Absorption Coefficient Multiplier as a Function of Media Warming
Thus we should expect ink to absorb ~2X faster if printed onto a 70 C media surface

Lexmark Confidential 9
Smear Score of Tidal Paper
Off the chart
Experiments have validated this approach.
Ref. Chad Young & Jancy Bonewits

Ambient temperature (C)
Fuser control temperature (C)
Fuser OD (mm)
Fuser wall thickness (mm)
Fuser roll length (mm)
Maximum fuser power (W)
Fuser wrap angle (10 - 170 degrees)
Paper speed (in/s)
Fuser Roll Input Parameters
Click to compute Paper Feed and Warming
Fuser warm-up time (s)
Paper temperature at the print zone (C)
Average power (W)
Heat flux at the fuser inside wall (W/m2)
Contact length (mm)
Contact time (ms)
System Outputs
Select the MATLAB Workspace Dry-Time-Kinetics
Then enter on the command line:
Fuser_Paper_Warming_GUI
The GUI shown here will appear. It will be loaded with
default values, but you can change them to suit
your simulation needs. Once you have entered the
values of interest click the green button to execute
the calculations.
Paper thickness (mm)
20
110
30.3
1.0
236
550
80
24483
12
0.1
21
69
-50 0 50
-40
-30
-20
-10
0
10
20
30
40
50
60
x-coordinate (not to scale)
Temperature Field
y-c
oo
rdin
ate
(n
ot
to s
ca
le)
20 30 40 50 60 70 80 90 100 110
328
12.2
74

0 20 40 60 80 100 120 140 160 1800
0.1
0.2
0.3
0.4
0.5
0.6
0.7
0.8
Wrap Angle (degrees)
He
at
Tra
ns
fer
Fa
cto
r (
)
Paper speed = 5 in/s
Paper speed = 10 in/s
Paper speed = 15 in/s
Paper speed = 20 in/s
Paper speed = 25 in/s
Ambient
Fuser
PZ
AmbientFuser
AmbientPZ
T
T
T
TT
TT
eTemperaturAmbient
eTemperatur ControlFuser
Print Zone in the eTemperaturPaper
1] [Eq. FactorTransfer Heat
Generic Temperature Response at the Print Zone for All Conditions

0 20 40 60 80 100 120 140 160 1800
0.1
0.2
0.3
0.4
0.5
0.6
0.7
0.8
Wrap Angle (degrees)
He
at
Tra
ns
fer
Fa
cto
r (
)
Paper speed = 5 in/s
Paper speed = 10 in/s
Paper speed = 15 in/s
Paper speed = 20 in/s
Paper speed = 25 in/s
0 20 40 60 80 100 120 140 160 1800
0.1
0.2
0.3
0.4
0.5
0.6
0.7
0.8
Wrap Angle (degrees)
He
at
Tra
ns
fer
Fa
cto
r (
)
Paper speed = 5 in/s
Paper speed = 10 in/s
Paper speed = 15 in/s
Paper speed = 20 in/s
Paper speed = 25 in/s
Exclusion Zone for 110C Fuser No wrap angle solutions exist in the
red zone that effect a print zone temperature of 70C
Exclusion Zone for 130C Fuser No wrap angle solutions exist in the
red zone that effect a print zone temperature of 70C
Example #1: For a fuser temperature of 110C, we can achieve a 70C paper temperature in the print zone with: 5 in/s paper speed and wrap greater than 25o
10 in/s paper speed and wrap greater than 55o
15 in/s paper speed and wrap greater than 95o
Example #2: For a fuser temperature of 130C, we can achieve a 70C paper temperature in the print zone with: 5 in/s paper speed and wrap greater than 15o
10 in/s paper speed and wrap greater than 35o
15 in/s paper speed and wrap greater than 55o

BA
BB
AA
BA
BABFP
FPA
or
t
F
C
K
where
FFKt
C
t
CK
n
n
nmn
mnn
n
n
nnnn
1
1
1
1
11
*
inversionmatrix by for solveThen
* modified
*][ modified
][ and ][ modifyingby interest of nodes at the valuescondition boundary known apply the Now
that so ;
:evaluate inlet),paper at the (like valuesnodal specifiedfor account To
method difference Backward1
method sGalerkin'3
2
method difference Central2
1
method difference forwardEuler 0
step time
step last timeat variablefield
step timenewat variablefield
matrix force global
matrix ecapacitanc global
matrix conduction global
:
11
See page 325 of “The Finite
Element Method for Engineers”
See page 48-62 of “The Finite
Element Method for Engineers”
Click to compute Paper Feed and Warming
t
TCQQQ
y
TK
yx
TK
xpConvectionRadiationFuseryx
Appendix #1
The cosine(q) effect
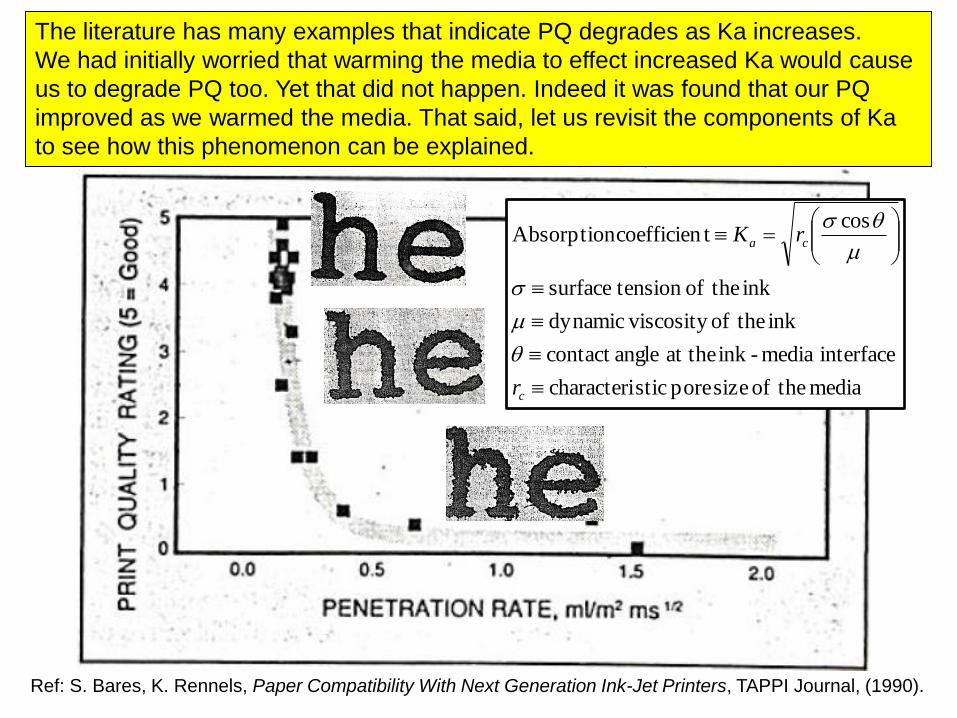
Ref: S. Bares, K. Rennels, Paper Compatibility With Next Generation Ink-Jet Printers, TAPPI Journal, (1990).
The literature has many examples that indicate PQ degrades as Ka increases.
We had initially worried that warming the media to effect increased Ka would cause
us to degrade PQ too. Yet that did not happen. Indeed it was found that our PQ
improved as we warmed the media. That said, let us revisit the components of Ka
to see how this phenomenon can be explained.
media theof size pore sticcharacteri
interface media-ink at the anglecontact
ink theof viscositydynamic
ink theof tension surface
cost coefficien Absorption
c
ca
r
rK
q
q
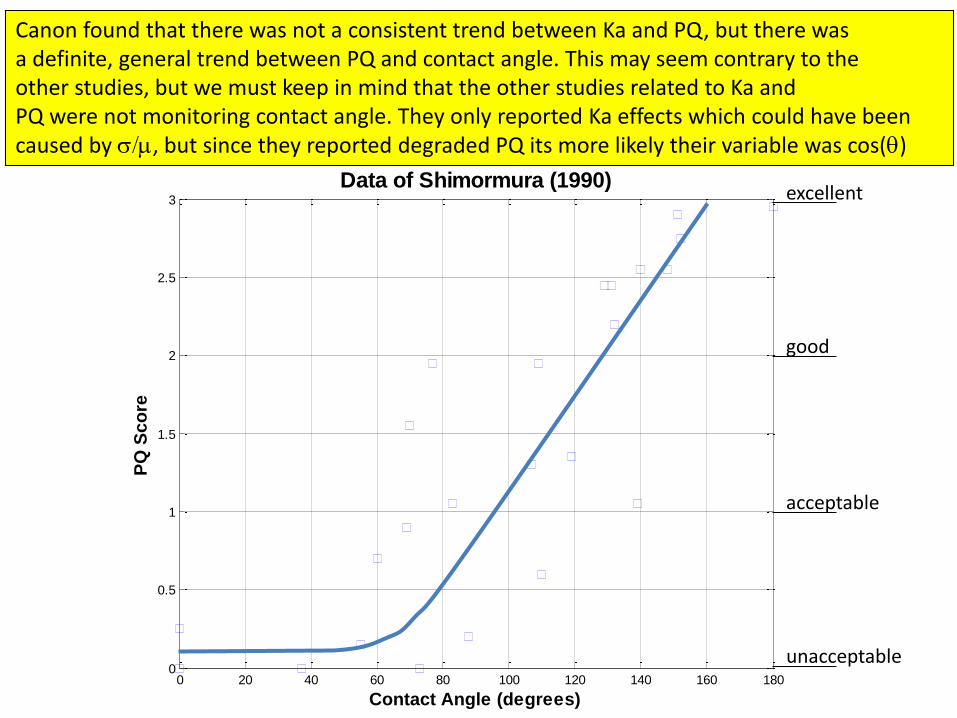
0 20 40 60 80 100 120 140 160 1800
0.5
1
1.5
2
2.5
3
Contact Angle (degrees)
PQ
Sco
re
Data of Shimormura (1990)
Canon found that there was not a consistent trend between Ka and PQ, but there was a definite, general trend between PQ and contact angle. This may seem contrary to the other studies, but we must keep in mind that the other studies related to Ka and PQ were not monitoring contact angle. They only reported Ka effects which could have been caused by /, but since they reported degraded PQ its more likely their variable was cos(q)
excellent
good
acceptable
unacceptable
q
LG
LG
q
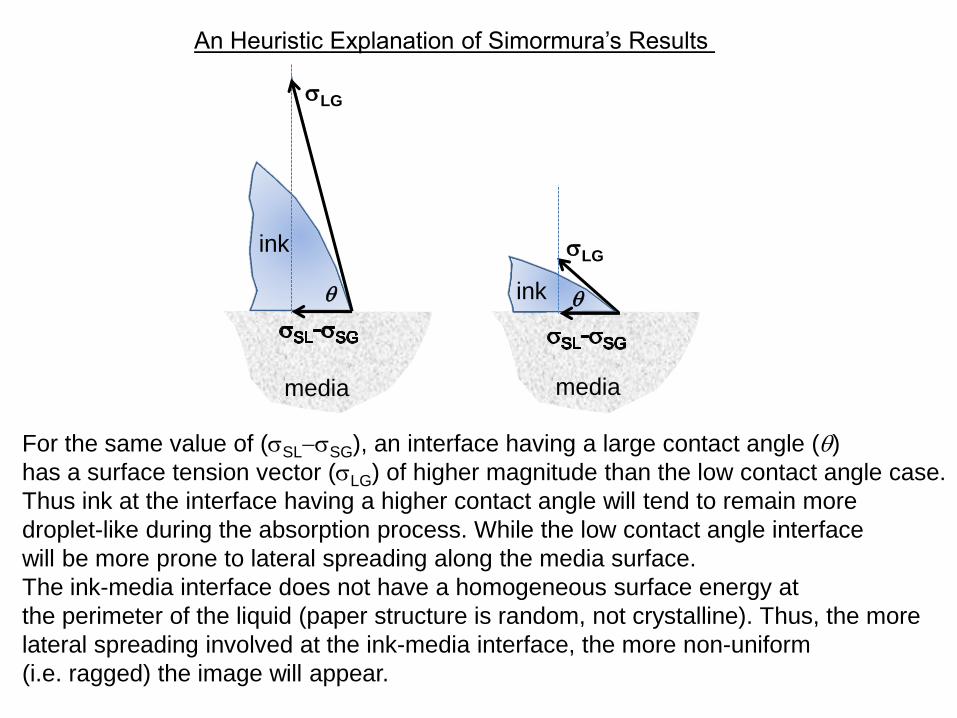
For the same value of (SLSG), an interface having a large contact angle (q)
has a surface tension vector (LG) of higher magnitude than the low contact angle case.
Thus ink at the interface having a higher contact angle will tend to remain more
droplet-like during the absorption process. While the low contact angle interface
will be more prone to lateral spreading along the media surface.
The ink-media interface does not have a homogeneous surface energy at
the perimeter of the liquid (paper structure is random, not crystalline). Thus, the more
lateral spreading involved at the ink-media interface, the more non-uniform
(i.e. ragged) the image will appear.
An Heuristic Explanation of Simormura’s Results
media media
ink
ink

The characteristic pore size of the media is in the hands of the paper manufacturers. That leaves us two components to work with in our attempt to effect increased absorption by media warming. - / - cos(q There is evidence in the literature that PQ is more directly correlated to cos(q than it is to Ka. As contact angle decreases so does PQ. We have demonstrated that dry time is enhanced when we take advantage of the d(//dT effect. We have also seen that PQ does not degrade when we increase Ka by warming the media. This begs the question: What is the effect of temperature on contact angle? If we can show that d(cosq)/dT is flat over our temperature range then we will be able to show that our anomaly is not an anomaly at all – physics will tell us that it is an expected outcome.
LG
SG
SL
q
q
cos
interface liquid-solid at the tension surface
interface gas-solid at the tension surface
interface gas-liquid at the tension surface
anglecontact
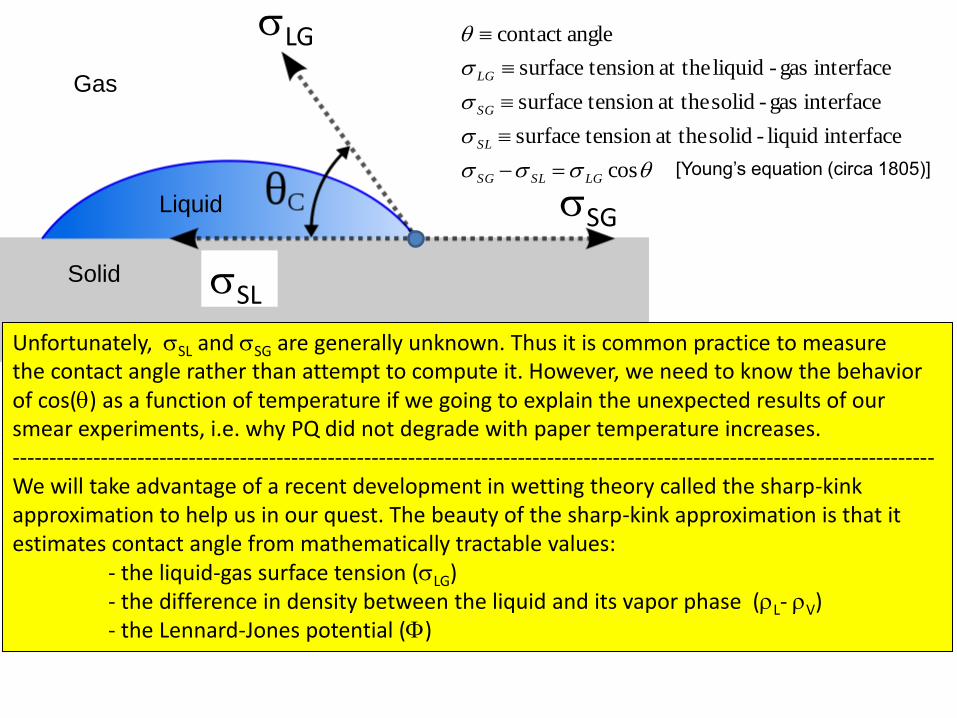
LGSLSG
SL
SG
LG
Unfortunately, SL and SG are generally unknown. Thus it is common practice to measure the contact angle rather than attempt to compute it. However, we need to know the behavior of cos(q) as a function of temperature if we going to explain the unexpected results of our smear experiments, i.e. why PQ did not degrade with paper temperature increases. ------------------------------------------------------------------------------------------------------------------------------ We will take advantage of a recent development in wetting theory called the sharp-kink approximation to help us in our quest. The beauty of the sharp-kink approximation is that it estimates contact angle from mathematically tractable values: - the liquid-gas surface tension (LG) - the difference in density between the liquid and its vapor phase (L- V) - the Lennard-Jones potential ()
Gas
Liquid
Solid
[Young’s equation (circa 1805)]

2 4 6 8 10 12 14 16-1000
-500
0
500
1000
1500
Intermolecular Spacing (Angstroms)
Po
ten
tial E
nerg
y (
Jo
ule
s/m
ol)
Well depth (e)
Characteristic diameter of the molecule ()
Molecules repel each other
Molecules attract each other
Exclu
ded R
egio
n
zmin
When envisioning the physics at the ink-media interface we need to consider the fact
that atoms cannot approach each other closer than (zmin).
The sharp-kink approximation takes advantage of this fact.
Z
For the wetting problem at hand, describes
the preference of the adsorbing molecule to
adhere to the surface instead of forming a droplet.
Typical Lennard-Jones Potential

Gas
Gas
Liquid
Solid
Z
zmin
The sharp-kink approximation assumes that the solid has an adsorbed layer of gas
at the surface. Since the liquid cannot enter the excluded region, the closest that the
liquid can be to the solid is zmin, at the well-depth, just beyond the van der Waals
radius. By setting the derivative of the Lennard-Jones function to zero, we may
compute the closest approach distance zmin.
The region contained in the red block above can be considered having three regimes:
(1) solid-gas surface tension, (2) liquid-gas surface tension, (3) a term that accounts
for the van der Waals attraction of the liquid to the solid substrate.

Given the heuristic explanation on the previous page, the sharp-kink approximation
provides for the following mathematical description of the liquid-gas-solid interface.
Rearranging:
When combined with Young’s equation yields*
We know how liquid and vapor density vary with temperature, and we also
know how liquid-gas surface tension varies with temperature. This just leaves
us with the integral of the potential energy function to determine.
* Ref: Gatica, Zhao, Johnson, Cole, J. Phys. Chem. B., 2004, 108.
In the vicinity of the contact line, it is assumed that the fluid regime
consists of saturated liquid and vapor.
(in the vicinity of zmin, density varies from that of gas to liquid – thus the term)
sharp-kink equation*

Lennard-Jones Potential Energy Function:
= characteristic diameter of the molecule
e = maximum energy of attraction = well depth
Wetting is a function of molecular
kinetics. Ink is mostly water at
the molecular level (mfH20 > 0.9).
So let:
= 2.7 Angstroms
e = 650 Joules/mol
zmin = 3.5 Angstroms

20 40 60 80 100
1080
1100
1120
1140
1160
Temperature (C)
Liq
uid
De
ns
ity
(k
g/m
3)
20 40 60 80 100
0.1
0.2
0.3
0.4
0.5
Temperature (C)
Va
po
r D
en
sit
y (
kg
/m3)
20 40 60 80 100
20
40
60
80
Temperature (C)
Su
rfa
ce
Te
ns
ion
/Vis
co
sit
y (
m/s
)
Misc PlotsPlot-M1K-Properties
M1K-Mono Ink Properties
These were computed in FEAJET for the mixture:
Water 74.68 wt.%
Triethylene glycol 5.0 wt.%
1,3-Propylene glycol 5.0 wt.%
Glycerol 10.0 wt.%
Surfactant 0.2 wt.%
Pigment+dispersant = 5.0 wt.%
L V
/

10 20 30 40 50 60 70 80 90 100
0.35
0.4
0.45
0.5
0.55
0.6
Temperature (C)
co
sin
e( q
)
We can now solve the sharp-kink equation

10 20 30 40 50 60 70 80 90 10010
20
30
40
50
60
70
80
90
100
Temperature (C)
Su
rface T
en
sio
n/V
isco
sit
y (
m/s
)
M1K-Mono Ink (/)
10 20 30 40 50 60 70 80 90 100
0.35
0.4
0.45
0.5
0.55
0.6
Temperature (C)
co
sin
e( q
)
We are now at a point where we can separate the contributions of (/)
and cosine(q) to the absorption coefficient (Ka) versus temperature.
/

Cosine (q) Summary • The absorption coefficient is a function of (/) and cosine(q).
• There is evidence in the literature that PQ is a stronger function of cosine(q) than Ka. As contact angle decreases – so does PQ.
• We achieve increased absorption by warming the paper to increase the (/) effect. Yet we see no degradation in PQ with higher media temperatures.
• Using the sharp-kink approximation, we have shown that cosine(q) varies negligibly over our temperature range of interest.
• Since cosine(q) is relatively invariant over our temperature range of interest we should not expect PQ to degrade with warmed media.
• Therefore when we quantitatively examine the fundamental physics of wetting at the atomic level, we do not expect PQ to degrade when we warm the media to effect an increased absorption coefficient (Ka).

Appendix #2 What about the wetting delay?

We have already discussed the absorption coefficient Ka and how it can be enhanced via warming the paper. We know that this
is well founded in theory as well as in practice. However, what about wetting delay?
If the wetting delay becomes a dominant fraction of the available dry-time, do we also need to figure out how to control it too?
What drives this phenomenon? The answer follows.
Discussion on the wetting delay
After the droplet impacts the paper, it flattens into a pancake-like puddle. This is an inertial event - not dictated by the contact angle.
According to Asai, et.al., this stage of the event is dictated by the Weber and Reynolds numbers. However, after the pancake
oscillations dampen out (microseconds), the wetting-capillary-spreading motion (milliseconds) of the pancake along the paper
surface becomes strongly dependent upon contact angle. While static contact angle is interesting, it is the dynamic contact angle
that actually governs this stage of the ink-media event. So how does the wetting delay, shown in the typical Bristow tester plots,
relate to dynamic contact angle?
I was looking thru one of my books (Capillary Flows With Forming Interfaces, by Y.D. Shikhumurzaev). On page 123 he shows the
following plot. The significance of this plot is that it shows a nice relationship between advancing-dynamic contact angle (qd) and the
capillary number (Ca). The data clusters together nicely across a wide range of water-glycerol mixtures. Since the capillary number
for a system is equal to [viscosity x velocity/surface tension] = (U/) this captured my attention - because as we've seen - Ka is a
function of (/). This implies that wetting delay is probably related to /; therefore, wetting delay should be inversely related to
Ka since Ka follows /, in other words, we should expect wetting delay to decrease when we warm the paper.

Wetting delay (cont.)
Anyway, that was the postulate that appeared in my head when I saw this plot relating dynamic (advancing) contact angle to Ca.
Postulates and hypothesis are easily created and destroyed, so how can we determine whether this postulate is on the right track?
Luckily we can find the validation within the literature.
The study by Selim, et.al. showed the plot (next page). Their data shows Bristow test results for various mixtures of water and
ethylene glycol. They show a similar plot for mixtures of water-diethylene glycol. Notice that some of their ink mixtures reduced
the wetting time and some increased it. There is also an obvious relationship between the mixtures and the absorption
coefficient (Ka = the slope of the line past the wetting delay). While Selim did mention that the Ka effect was probably due
to the / relationship, he had no explanation for the wetting delay effect.
This is where the relationship identified in Shikhmurzaev's book helps us.
Plot from: Y.D. Shikhmurzaev, Capillary Flows With Forming Interfaces, Chapman-Hall/CRC, Boca Raton, (2008).

Wetting delay (cont.)
As d
e-g
lyco
l go
es fro
m
30
60%
ab
so
rptio
n in
cre
ases
As d
e-g
lyco
l go
es fro
m
20
%
10
% a
bso
rptio
n
decre
ases
Wetting delay is clearly
affected by formulation
The effect of diethylene glycol
on absorption coefficient
* Selim, Yesavage, Al-Ubaidi, Sung, Drying of Water-Based Inks on Plain Paper,
Colorado School of Mines Report for IBM, (1989).
This
behavio
r suggests
an in
flectio
n p
oin
t

010
20 30 40 50 60DEG Concentration (%)
Wetting delay (cont.)
Using FEAJET to simulate the characteristics of water-EG and water-DEG mixtures, we see that indeed we should see
an inflection point for both absorption and wetting delay. This is exactly what is shown in Selim’s data.
Interestingly, the simulations shown above illustrate the expected inverse relationship between absorption and wetting delay.
Thus we may feel confident that as we use temperature to increase Ka, the same temperature rise will tend to decrease
the wetting delay; therefore, warming the paper gives us two levers by which dry time is enhanced.

Given this, we may use the FEAJET model to simulate various ink formulations to examine this effect.
The plot above illustrates those results.
This suggests that wetting delay can be positively (or negatively) affected by ink formulation. Since we want wetting delay to go
down and Ka to go up, we need to ensure that our ink formulations place us on the right hand side of these response curves.
Wetting delay falls off rapidly once we get past the peak. For enhancing Ka (increasing absorption) and minimizing wetting delay,
these plots suggest that we desire an ink formulation having a ratio of viscosity/surface tension greater than 0.03, and ideally
greater than 0.04 (the units of this metric are in seconds per meter.....i.e. the inverse of velocity).
Wetting delay (cont.)

The plot below shows some data from an old Xerox study (ca. 1992). If one looks at it in light of this discussion, it provides
validation of the postulate relating wetting delay to /. Xerox ran a Bristow-like test on a heated platen. They found that
indeed Ka increased with temperature - and - if you look at their plot below it is evident that wetting delay decreases with
temperature. So warming increases absorption - and - it reduces wetting delay for all the reasons cited in this document.
Wetting delay (cont.)
Ref: Carriera, Agbezuge & Gooray, Rates of Aqueous Ink Penetration into Papers and Their Effects on
Printability, IS&T-NIP8, (1992).

Appendix #3
Miscellaneous
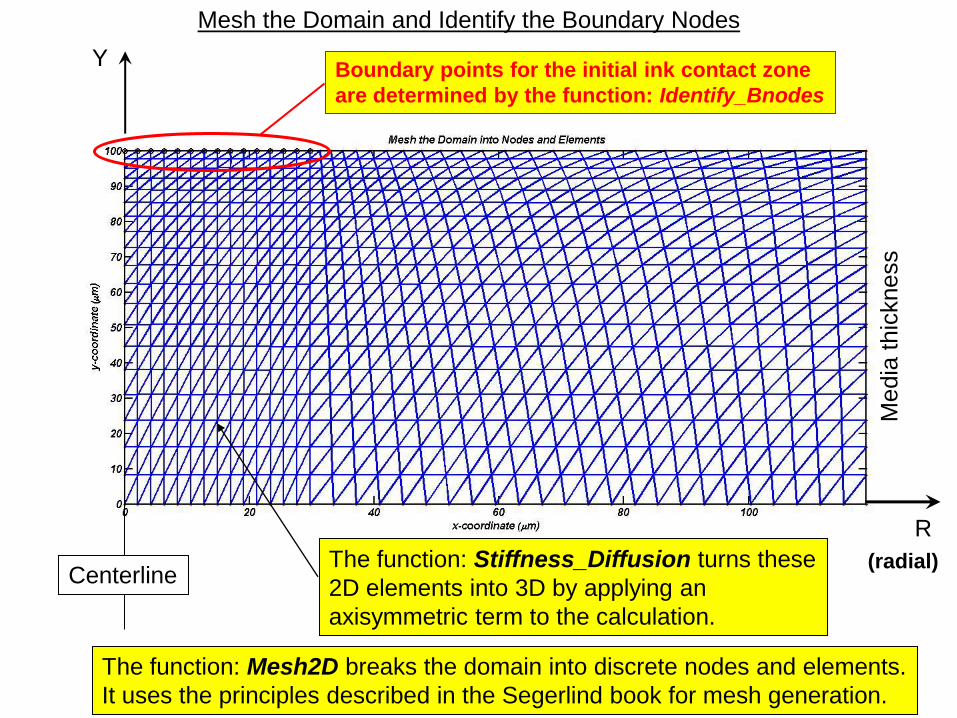
Boundary points for the initial ink contact zone
are determined by the function: Identify_Bnodes
Mesh the Domain and Identify the Boundary Nodes
The function: Mesh2D breaks the domain into discrete nodes and elements.
It uses the principles described in the Segerlind book for mesh generation.
Y
R
(radial) Centerline
The function: Stiffness_Diffusion turns these
2D elements into 3D by applying an
axisymmetric term to the calculation.
Media
thic
kness

X (not to scale)
Y (
no
t to
scale
)
Heat Flux Input Nodes
Are on the Inside Surface
of the Fuser Roll
Radiation and
Convection Surfaces
Functions:
Mesh_Fuser2
Mesh2D
Identify_F_Nodes2
Identify_Paper_Nodes2
Translation_Nodes2

X (not to scale)
Y (
no
t to
scale
)
Paper Outlet
These nodes
are set to
Tambient
Each time step involves computing the transient temperature field with [Eq. 1] and
rotating/translating the paper and fuser nodes.
Functions:
Solve_Fuser_Tfield2
Stiffness_Tfield_Fuser2
Force_Fuser2
1] [Eq. t
TCQQQ
y
TK
yx
TK
xpConvectionRadiationFuseryx
Solve


