Drug Overdose Morbidity and Mortality in Kentucky … Overdose Morbidity and Mortality in Kentucky,...
71
Drug Overdose Morbidity and Mortality in Kentucky, 2000 - 2010 An examination of statewide data, including the rising impact of prescription drug overdose on fatality rates, and the parallel rise in associated medical costs. KENTUCKY INJURY PREVENTION AND RESEARCH CENTER December 1, 2012 Authored by: Terry Bunn, Ph.D., Svetla Slavova, Ph.D.
Transcript of Drug Overdose Morbidity and Mortality in Kentucky … Overdose Morbidity and Mortality in Kentucky,...

Drug Overdose Morbidity and Mortality in Kentucky, 2000 - 2010
An examination of statewide data, including the rising impact of prescription drug overdose on fatality rates, and the parallel
rise in associated medical costs.
KENTUCKY INJURY PREVENTION AND RESEARCH CENTER
December 1, 2012 Authored by: Terry Bunn, Ph.D., Svetla Slavova, Ph.D.

i | Drug Overdose Morbidity and Mortality in Kentucky, 2000 - 2010
Table of Contents
Forward……………………………………………………………………………………….. vii
Major Findings……………………………………………………………..……….............. viii
Recommendations for Prevention and Control xi
About this Report………………………………...…………………………..………………xii Emergency Department Drug Overdose Visits for Kentucky Residents, 2008 - 2010………………………………………………………………………………….. 1
Emergency Department Visits 2 Emergency Department Visits by Intent 3 Emergency Department Visits by Gender 4 Emergency Department Visits, Gender by Intent 5 Emergency Department Visits by Age 6 Emergency Department Visits by Race 7 Emergency Department Discharges 8 Emergency Department Charges 9 Emergency Department Visits by Payer 10 Medicare and Medicaid Emergency Department Visits by Intent 11 Emergency Department Drug Overdose Cases by Substance 12
Inpatient Hospitalizations among Kentucky Residents Treated in Kentucky Acute Care Hospitals 2000 - 2010........................................................13
Hospitalizations 14 Hospitalizations by Intent 15 Hospitalizations by Gender 17 Hospitalizations by Gender and Intent 18 Hospitalizations by Age 20 Hospitalizations by Race 22 Hospitalization Discharges 23 Hospitalization Discharges by Intent 24 Hospitalization Charges 25 Hospitalizations by Payer 26

ii | Drug Overdose Morbidity and Mortality in Kentucky, 2000 - 2010
Table of Contents, cont.
Hospitalizations by Length of Stay 27 Medicare and Medicaid Hospitalizations by Intent 28 Medicare and Medicaid Hospitalizations by Age and Intent 30 Hospitalization Overdose Cases by Drug 32
Drug Overdose Fatalities among Kentucky Residents, 2000 - 2010…........................................................................................................................................33
Fatalities 34 Fatalities by Intent 35 Fatalities by Gender 36 Fatalities by Gender and Intent 37 Fatalities by Age 38 Fatalities by Race 39 Fatalities by County 40 Fatalities in the Workplace 43 Fatalities by Intent, Prescription Drug 44 Fatalities by Type of Drug 46
Conclusions……………………………………………………………………........................48 Acronyms and Glossary……………………………………………………..……………... 50 Appendix…………………………………………………………………………..…………… a

iii | Drug Overdose Morbidity and Mortality in Kentucky, 2000 - 2010
List of Figures
Figure 1: Age-adjusted drug overdose rates for Kentucky residents, 2000 – 2010 Figure 2: Drug overdose ED visits for Kentucky residents, 2008 - 2010 Figure 3: Age-adjusted drug overdose ED visit rates for Kentucky residents, 2008 - 2010 Figure 4: Drug overdose ED visits by intent, Kentucky residents, 2008 – 2010 Figure 5: Drug overdose ED visits by gender, Kentucky residents, 2008 - 2010 Figure 6: Drug overdose ED rates by gender, Kentucky residents, 2008 - 2010 Figure 7: Drug overdose ED visits by gender and intent, Kentucky residents, 2008 –2010 Figure 8: Drug overdose ED rates by gender and intent, Kentucky residents, 2008 - 2010 Figure 9: Drug overdose ED visits by age, Kentucky residents, 2008 - 2010 Figure 10: Drug overdose ED rates by age, Kentucky residents, 2008 - 2010 Figure 11: Total charges for drug overdose ED visits, Kentucky, 2008 - 2010 Figure 12: Total charges for drug overdose ED visits, Kentucky, 2010 Figure 13: Drug overdose ED visits by payer, Kentucky, 2008 – 2010 Figure 14: Medicare drug overdose ED visits by intent, Kentucky, 2008 – 2010 Figure 15: Medicaid drug overdose ED visits by intent, Kentucky, 2008 – 2010 Figure 16: Substances present in drug overdose ED visits, Kentucky, 2008 - 2010 Figure 17: Drug overdose inpatient hospitalizations for Kentucky residents treated in
Kentucky acute care hospitals, 2000 - 2010 Figure 18: Age-adjusted drug overdose inpatient hospitalization rates for Kentucky residents
treated in Kentucky acute care hospitals, 2000 – 2010 Figure 19: Drug overdose inpatient hospitalizations by intent, Kentucky residents treated in
Kentucky acute care hospitals, 2000 – 2010 Figure 20: Drug overdose inpatient hospitalization rates by intent, Kentucky residents
treated in Kentucky acute care hospitals, 2000 - 2010 Figure 21: Drug overdose inpatient hospitalizations by gender, Kentucky residents treated in
Kentucky acute care hospitals, 2000 – 2010 Figure 22: Drug overdose inpatient hospitalization rates by gender, Kentucky residents
treated in Kentucky acute care hospitals, 2000 – 2010 Figure 23: Drug overdose inpatient hospitalizations by gender and intent, Kentucky residents
treated in Kentucky acute care hospitals, 2000 - 2010 Figure 24: Drug overdose inpatient hospitalization rates by gender and intent, Kentucky
residents treated in Kentucky acute care hospitals, 2000 - 2010 Figure 25: Drug overdose inpatient hospitalizations by age group, Kentucky residents treated
in Kentucky acute care hospitals, 2000 – 2010

iv | Drug Overdose Morbidity and Mortality in Kentucky, 2000 - 2010
List of Figures, continued
Figure 26: Drug overdose inpatient hospitalization rates by age group, Kentucky
residents treated in Kentucky acute care hospitals, 2000 – 2010 Figure 27: Total charges billed for drug overdose inpatient hospitalizations,
Kentucky residents treated in Kentucky acute care hospitals, 2000 – 2010 Figure 28: Drug overdose inpatient hospitalizations by payer, Kentucky residents
treated in Kentucky acute care hospitals, 2000 - 2010 Figure 29: Drug overdose inpatient hospitalizations by percentage of total charges,
Kentucky residents treated in Kentucky acute care hospitals, 2010 Figure 30: Drug overdose inpatient hospitalizations by total length of stay, Kentucky
residents treated in Kentucky acute care hospitals, 2010 Figure 31: Drug overdose inpatient hospitalizations by average length of stay,
Kentucky residents treated in Kentucky acute care hospitals, 2000 - 2010 Figure 32: Medicare and Medicare Managed Care drug overdose inpatient
hospitalizations by intent, Kentucky residents treated in Kentucky acute care hospitals, 2000 – 2010
Figure 33: Medicaid and Passport Medicaid Managed Care drug overdose inpatient hospitalizations by intent, Kentucky residents treated in Kentucky acute care hospitals, 2000 - 2010
Figure 34: Medicare and Medicare Managed Care drug overdose inpatient hospitalizations by age and intent, Kentucky residents treated in Kentucky acute care hospitals, 2000 - 2010
Figure 35: Medicaid and Medicaid Managed Care drug overdose inpatient hospitalizations by age and intent, Kentucky residents treated in Kentucky acute care hospitals, 2000 - 2010
Figure 36: Drug overdose inpatient hospitalizations with opiates and benzodiazepines present, Kentucky residents treated in Kentucky acute care hospitals, 2000 - 2010
Figure 37: Drug overdose fatalities for Kentucky residents, 2000 - 2010 Figure 38: Age-adjusted drug overdose death rates among Kentucky residents, 2000
– 2010 Figure 39: Drug overdose fatalities by intent, Kentucky residents, 2000 - 2010 Figure 40: Drug overdose fatality rates by intent, Kentucky residents, 2000 - 2010 Figure 41: Drug overdose fatalities by gender, Kentucky residents, 2000 - 2010 Figure 42: Drug overdose fatality rates by gender, Kentucky residents, 2000 - 2010

v | Drug Overdose Morbidity and Mortality in Kentucky, 2000 - 2010
List of Figures, continued Figure 43: Drug overdose fatalities by gender and intent, Kentucky residents, 2000 - 2010 Figure 44: Drug overdose fatality rates by gender and intent, Kentucky residents, 2000 -
2010 Figure 45: Drug overdose fatalities by age group, Kentucky residents, 2000 - 2010 Figure 46: Drug overdose fatality rates by age group, Kentucky residents, 2000 - 2010 Figure 47: Annual average rate of drug overdose deaths among Kentucky residents (per
100,000 population), 2008 - 2010 Figure 48: Prescription drug overdose fatalities by intent, Kentucky residents, 2002 - 2010 Figure 49: Prescription drug overdose fatalities by intent, Kentucky residents, 2010 Figure 50: Drug overdose deaths involving prescription and illicit drugs, Kentucky residents,
2002 - 2010 Figure 51: Drug overdose deaths involving benzodiazepines, opioids and illicit drugs,
Kentucky residents, 2002 - 2010 Figure 52: Drug overdose deaths by type of drug involved, Kentucky residents, 2002 - 2010

vi | Drug Overdose Morbidity and Mortality in Kentucky, 2000 - 2010
List of Tables
Table 1: Drug overdose ED visits by race and ethnicity, Kentucky 2008 – 2010 Table 2: Discharge status for drug overdose ED visits, Kentucky residents, 2008 - 2010 Table 3: Discharge status for drug overdose ED visits by intent, Kentucky residents 2008 - 2010 Table 4: Drug overdose inpatient hospitalizations by race and ethnicity, Kentucky residents
treated in Kentucky acute care hospitals, 2000 – 2010 Table 5: Drug overdose inpatient hospitalization discharges from Kentucky acute care hospitals,
2000 - 2010 Table 6: Drug overdose inpatient hospitalization discharges from Kentucky acute care hospitals,
by intent, 2000 - 2010 Table 7: Drug overdose fatalities by race, Kentucky residents, 2000 – 2010
Table 8: Top 5 Kentucky counties by annual rate of drug overdose fatalities Table 9: Top 20 Kentucky counties by number of total drug overdose deaths Table 10: Drug overdose deaths in the workplace for Kentuckians, 2000 - 2010, excluding 2007
– 2009 Table 11: Drug overdose inpatient hospitalizations by gender and intent, Kentucky residents
treated in Kentucky acute care hospitals, 2000 – 2010 Table 12: Drug overdose inpatient hospitalization rates per 100,000 population by gender and
intent, Kentucky residents treated in Kentucky acute care hospitals, 2000 – 2010 Table 13: Drug overdose hospitalizations by age group, Kentucky residents treated in Kentucky
acute care hospitals, 2000 – 2010 Table 14: Drug overdose inpatient hospitalization rates per 100,000 population by age group,
Kentucky residents treated in Kentucky acute care hospitals 2000 – 2010 Table 15: Drug overdose inpatient hospitalization charges, Kentucky residents treated in
Kentucky acute care hospitals, 2010 Table 16: Drug overdose fatalities by intent, Kentucky residents, 2000 – 2010 Table 17: Drug overdose fatality rates per 100,000 population by intent, Kentucky residents,
2000 – 2010 Table 18: Drug overdose fatalities by gender and intent, Kentucky residents, 2000 – 2010 Table 19: Drug overdose fatality rates per 100,000 population by gender and intent, Kentucky
residents, 2000 – 2010 Table 20: Drug overdose fatalities by age group, Kentucky residents, 2000 – 2010 Table 21: Drug overdose fatality rates per 100,000 population by age group, Kentucky residents
2000 – 2010 Table 22: Drug overdose deaths involving benzodiazepines, opioids and illicit drugs, Kentucky
residents, 2002 – 2010 Table 23: Drug overdose deaths by type of drug involved, Kentucky residents 2002 - 2010

vii | Drug Overdose Morbidity and Mortality in Kentucky, 2000 - 2010
Forward
Kentucky has seen an explosion in fatal poisonings, particularly prescription drug related fatalities, in the last decade. In 2009, Kentucky had the 5th highest drug overdose rate in the US, increased from the 6th highest drug overdose fatality rate determined in 2008 (CDC WONDER). Kentucky also had the 5th highest nonmedical use of opioid pain relievers, and 11th highest for opioid pain reliever sales in the nation (CDC, MMWR Report November 4, 2011). These drug overdose mortality statistics are extremely startling and only begin to reveal the devastating mental, emotional, and economic toll and pain on families who will forever grieve for their lost loved one.
This report was designed to gain a comprehensive understanding of the drug overdose problem in Kentucky through the analysis of multiple statewide public health data sets-- emergency department admissions of Kentucky residents in Kentucky healthcare facilities, inpatient hospitalizations of Kentucky residents in Kentucky non-federal acute care hospitals, and deaths of Kentucky residents within and outside the Commonwealth of Kentucky.
The operational definitions for the underlying and multiple causes coding of drug overdose mortality within death certificates were modeled on the CDC method of Dr. Leonard Paulozzi (Morbidity and Mortality Weekly Report, Vital Signs: Overdoses of Prescription Opioid Pain Relievers – United States, 1999 - 2008). Drug overdose morbidity definition was based on a new Safe States publication entitled “Consensus Recommendations for National and State Poisoning Surveillance”, recently produced by the Safe States Injury Surveillance Workgroup on Poisoning in April 2012.
The information contained within this report is intended to inform and assist practitioners, lawmakers, and public health professionals in the development of targeted interventions for multi-pronged approaches to reduce the heavy burden of prescription drug abuse in Kentucky. It is hoped that public health professionals and lawmakers armed with the data and recommendations contained within this report on drug overdoses can better target those populations with the greatest need for substance abuse services, prevention programs, and legislation.
Terry Bunn, PhD Director, Kentucky Injury Prevention and Research Center

viii | Drug Overdose Morbidity and Mortality in Kentucky, 2000 - 2010
Major Findings
Drug Overdose Morbidity and Mortality in Kentucky, 2000 – 2010, is a publication of the Kentucky Injury Prevention and Research Center (KIPRC), which is a unique collaboration between the Kentucky Department for Public Health and the University of Kentucky. The data sources for this report include death certificate files, emergency department records and hospital billing records, all of which are described in detail in the section titled “About this Report”. The term “drug overdose” refers to poisoning from prescription drugs, over the counter drugs and illicit drugs.
Datasets collected and analyzed for this report provide a perspective on drug overdoses in the state of Kentucky and their impact on medical costs, including:
• Rates- From 2000 to 2010, drug overdose mortality rates among Kentuckians increased 282%, from a rate of 6 overdose deaths per 100,000 residents in 2000 to a rate of 22.9 deaths per 100,000 residents in 2010. During the same time period, Kentucky drug overdose hospitalization rates increased 68% from 59.9/100,000 in 2000 to 100.7/100,000 in 2010. From 2008 to 2010, Kentucky drug overdose emergency department visit rates increased 18% from 95.4/100,000 in 2008 to 113/100,000 in 2010. See Figure 1.
• Numbers- In 2010, 522 Kentuckian deaths (53% of all drug overdose deaths) involved prescription drugs. There were 4,348 Kentuckian inpatient hospitalizations and 4,770 Kentuckian emergency department visits involving drug overdoses in 2010.
• Charges- Kentucky drug overdose- related inpatient hospitalization charges
totaled $68,572,368 in 2010; Medicaid alone was charged $18,741,534. Kentucky drug overdose- related emergency department charges totaled $9,570,045 in 2010; Medicaid alone was charged $2,576,647.
• Gender- In 2010, Kentucky females accounted for the highest number of
the drug overdose- related emergency department visits (n=2,541) and inpatient hospitalizations (n=2,455). The highest number of Kentucky drug overdose fatalities occurred among males (n=605).

ix | Drug Overdose Morbidity and Mortality in Kentucky, 2000 - 2010
• Intent- In 2010, the highest number of drug overdose emergency department
visits were for unintentional drug overdoses (n=2,273) in Kentucky. The highest number and rate of drug overdose inpatient hospitalizations were for intent to self-harm (n= 1,973) in Kentucky. The highest number of drug overdose deaths were due to unintentional drug overdoses (n=857) in Kentucky.
• Gender by Intent- In 2010, Kentucky females treated for unintentional drug overdoses accounted for the highest number of drug overdose- related emergency department visits. Kentucky females hospitalized for intent to self-harm accounted for the highest number of drug overdose- related inpatient hospitalizations. Kentucky males who died from unintentional drug overdoses accounted for the highest number of drug overdose deaths.
• Age groups- In 2010, the highest number and rate of emergency department visits for drug overdoses were among Kentucky residents aged 25-34 years old. The highest number and rate of inpatient hospitalizations for drug overdoses were among Kentucky residents aged 35-44 years old. Drug overdose deaths occurred primarily among Kentucky residents aged 45-54 years old.
• Substances- In 2010, the highest numbers of Kentucky drug overdose emergency visits involved opiates (n=697) and benzodiazepines (n=693). The highest number of Kentucky drug overdose inpatient hospitalizations involved benzodiazepine-based tranquilizers (n=1,335). The highest number of Kentucky drug overdose deaths involved opioids (n=443).
• Workplace- For the 2000-2010 time period, 20 drug overdose-related
emergency department visits in Kentucky were billed to Kentucky workers’ compensation. There were 75 drug overdose hospitalizations in Kentucky billed to Kentucky workers’ compensation for the same time period.

x | Drug Overdose Morbidity and Mortality in Kentucky, 2000 - 2010
Figure 1: Age-adjusted drug overdose rates for Kentucky residents, 2000 - 2010
6.0 8.1 10.6 13.2 12.6 14.8 16.8 15.8 17.5 17.4 22.9
59.9 71.4 75.9 79.1 82.6 81.7
90.7 94.0 92.1 95.7 100.7
95.4 102.9
113
0
20
40
60
80
100
120
2000 2001 2002 2003 2004 2005 2006 2007 2008 2009 2010
Rate
per
100
,000
KY
resi
dent
s
Year
drug overdose deaths drug overdose hospitalizations
drug overdose ED visits

xi | Drug Overdose Morbidity and Mortality in Kentucky, 2000 - 2010
Recommendations for Prevention and Control
• The elevated percentage of Medicaid drug overdose hospitalizations due to suicide attempts should be used to raise awareness in the Kentucky Department for Medicaid Services for education and the enhancement of suicide prevention programs.
• The high percentage of females who were hospitalized in Kentucky for prescription drug overdoses due to intent to self-harm should be used to raise awareness in Kentucky suicide prevention programs for enhanced targeting of prevention programs and education efforts.
• The high number of drug overdose inpatients and emergency department patients discharged to cancer centers or hospice care due to intent to self-harm suggests the need for enhanced crisis prevention efforts and suicide prevention interventions directed to cancer patients.
• Because of the overwhelmingly high number of inpatient hospitalizations and emergency department admissions due to drug overdoses in the Commonwealth of Kentucky, it is recommended that the number of substance abuse treatment programs be substantially increased.
• Standardized emergency department opioid prescribing guidelines should be developed for the Commonwealth of Kentucky.
• The number of local communities with prescription drug take-back programs that operate on a continual basis in Kentucky should be increased.
• The number of Operation UNITE- sponsored prescription drug take-back programs in Kentucky should be increased.
• The number of controlled substance prescribers who have completed formal training on prescription drug abuse and addiction should be increased.

xii | Drug Overdose Morbidity and Mortality in Kentucky, 2000 - 2010
About this Report This report presents morbidity and mortality data from a variety of sources. The morbidity statistics are based on Kentucky inpatient hospital discharge (HD) uniform
billing electronic records, 2000 -2010, and the electronic emergency department (ED) visit records, 2008-2010. All personal identifiers were removed from the data sets by the maintaining agency before receipt, therefore, prevalence and incidence rates could not be calculated. Reported frequencies reflect the number of visits/hospitalizations because follow-up visits or re-admissions for one and the same injury could not be identified.
The HD and ED data are coded according to the International Classification of Diseases, 9th revision, Clinical Modification (ICD-9-CM, www.icd9cm.chrisendres.com). The ICD system describes an injury using diagnosis codes and E-codes.
The Kentucky HD and ED data systems allow the collection of up to 25 diagnosis code fields per case. The first diagnosis code is called the principal diagnosis code. The principal diagnosis for a hospitalized patient is the main reason for the patient’s hospital stay and is based on the clinical findings during the patient’s stay. For ED data, the primary diagnosis code is the diagnosis established to be the main reason for the visit to the emergency room. Other conditions/diagnoses that exist at the time of the hospitalization/ED visit and affect the diagnosis, treatment, or length of stay in the health facility, are also coded in the remaining 24 diagnosis code fields in the HD/ED datasets and are called secondary diagnoses.
Injury diagnoses (especially principal injury diagnosis) should be supplemented (when circumstances of the injury are known) with additional codes called E-codes. The E-codes are separated into three groups: external-cause-of-injury codes, place-of-injury codes, and activity codes. The external-cause-of-injury code is a single code that describes the external cause and the intent of injury. Based on the external-cause-of-injury code, a drug poisoning can be classified as accidental (unintentional, E850 – E858), intentional (self-harm, E950.0 – E 950.5 or assault, E962.0), or undetermined, E980 – E980.5. A medical record coder in a medical facility would assign an E-code in the range E980.0 – E980.5 when based on insufficient documentation in the medical chart, it could not be determined whether the drug overdose was accidental or intentional. Some injury records in the HD or ED datasets, however, are not supplemented with E codes at all. We treat such records as a separate category and refer to them as “information on intent was missing”, meaning external-code-of-injury was not included on the patient record. The Kentucky HD and ED electronic record systems currently support up to three E-codes. In recent years, on average, about 85 percent of the Kentucky HD and ED cases with injury diagnoses are supplemented with valid external-cause-of-injury codes.
For the purpose of this report an injury hospitalization or emergency department visit was considered a drug overdose if: 1) the principal diagnosis code was in the range 960-979 (poisonings by drugs, medicinal and biological substances), or 2) the first valid external cause of injury code was in the range E850-E858, E950.0-E950.5, E962.0, E980.0-E980.5. The

xiii | Drug Overdose Morbidity and Mortality in Kentucky, 2000 - 2010
methodology follows the Consensus Recommendations for National and State Poisoning Surveillance on acute poisonings due to the effect of drugs (Injury Surveillance Workgroup 7. Consensus recommendations for national and state poisoning surveillance. The Safe States Alliance. Atlanta, GA. 2012. April 2012, pg.22.) The principal and the secondary diagnoses codes in the range 960-979 were used to identify substances involved in the drug overdose case.
Only records for KY residents treated in Kentucky acute care hospitals or Kentucky emergency departments are included in this report. Data for Kentucky residents treated in the neighboring states were not available and not included. Therefore, the presented counts and rates may underestimate the extent of the drug overdose problem in the state.
The source for mortality data is the Kentucky vital statistics death certificate database, 2000 – 2010. The 2009 and 2010 files were provisional at the time work on this report began. Each death certificate contains one underlying cause of death and additional multiple causes of death. The underlying and contributing causes of death are coded according to the International Classification of Diseases, 10th revision (ICD-10, www.who.int/classifications/icd10/). The underlying cause of death is defined as the reason that initiated the chain of events leading directly to death. Drug overdose deaths were identified as those with an underlying cause of death in the range X40-X44 (unintentional), X60-X64 (intentional, self-harm), X85 (intentional, assault), and Y10-Y14 (undetermined). Among deaths with drug overdose as the underlying cause, the types of drugs involved were classified according to the CDC approach (Paulozzi, L. 2011. Vital Signs: Overdoses of Prescription Opioid Pain Relievers – United States, 1999 – 2008. MMWR 60(43);1487-1492): prescription drugs – supplementary causes of death in the range T36-T39, T40.2-T40.4, T41-T43.5, T43.7-T50.8; prescription opioid pain relievers – T40.2-T40.4; illicit drugs – T40.1, T40.5, T40.7-T40.9, T43.6; unspecified drugs –T50.9 alone. The prescription drug category includes some over-the-counter medications. For deaths that have both prescription and illicit drugs listed, the deaths were counted in both categories.
Age-adjusted morbidity and mortality rates were based on 2000 U.S. standard population. For each of the three data sets, the number of cases classified as assault was low (19 ED visits from 2008 – 2010, 19 hospitalizations from 2000 – 2010 and six fatalities from 2000 – 2010) and so are not included in the figures or discussed in this report.
Requests for copies of this publication and any other inquiries should be directed to: Kentucky Injury Prevention and Research Center
333 Waller Avenue Lexington, Kentucky 40504-2915
(859) 257-4954 office (859) 257-3909 fax
This report is posted on our website: http://www.kiprc.uky.edu/publications

1 | Drug Overdose Morbidity and Mortality in Kentucky, 2000 - 2010
Emergency Department Drug Poisoning Visits for Kentucky Residents, 2008 - 2010
2 | Drug Overdose Morbidity and Mortality in Kentucky, 2000 - 2010
Emergency Department Visits
Emergency Department (ED) data has been collected in Kentucky since January 2008. Note that during this time, the number of drug overdose visits has increased by 20% (Figure 2). Age-adjusted rates for Kentucky residents show a similar increase (Figure 3).
Figure 2: Drug overdose ED visits for Kentucky residents, 2008 - 2010
Figure 3: Age-adjusted drug overdose ED visit rates for Kentucky residents, 2008 - 2010
3,967
4,357
4,770
3,500
3,700
3,900
4,100
4,300
4,500
4,700
4,900
2008 2009 2010
Num
ber
Year
95.4
102.9
113
80
85
90
95
100
105
110
115
120
2008 2009 2010
Rate
per
100
,000
KY
resi
dent
s
Year

3 | Drug Overdose Morbidity and Mortality in Kentucky, 2000 - 2010
Emergency Department Visits by Intent
Figure 4 illustrates that the number of unintentional drug overdose ED visits has steadily increased for Kentuckians from 2008 through 2010. Of the total number of ED drug overdose cases for the time period shown below, 48% were unintentional poisonings, 29% were intended to cause self-harm and 14% were undetermined. However, since 14% of all cases were coded as “intent undetermined” and an additional 9% of the cases had missing information for the intent, the percentage of unintentional poisonings could be higher.
Figure 4: Drug overdose ED visits by intent, Kentucky residents, 2008 – 2010 *
*Information on intent was missing in 9% of cases.
1,239 1,252 1,339
511 564 723
1,830
2,110 2,273
0
500
1,000
1,500
2,000
2,500
2008 2009 2010
Num
ber
Year
Self Harm Undetermined Unintentional
4 | Drug Overdose Morbidity and Mortality in Kentucky, 2000 - 2010
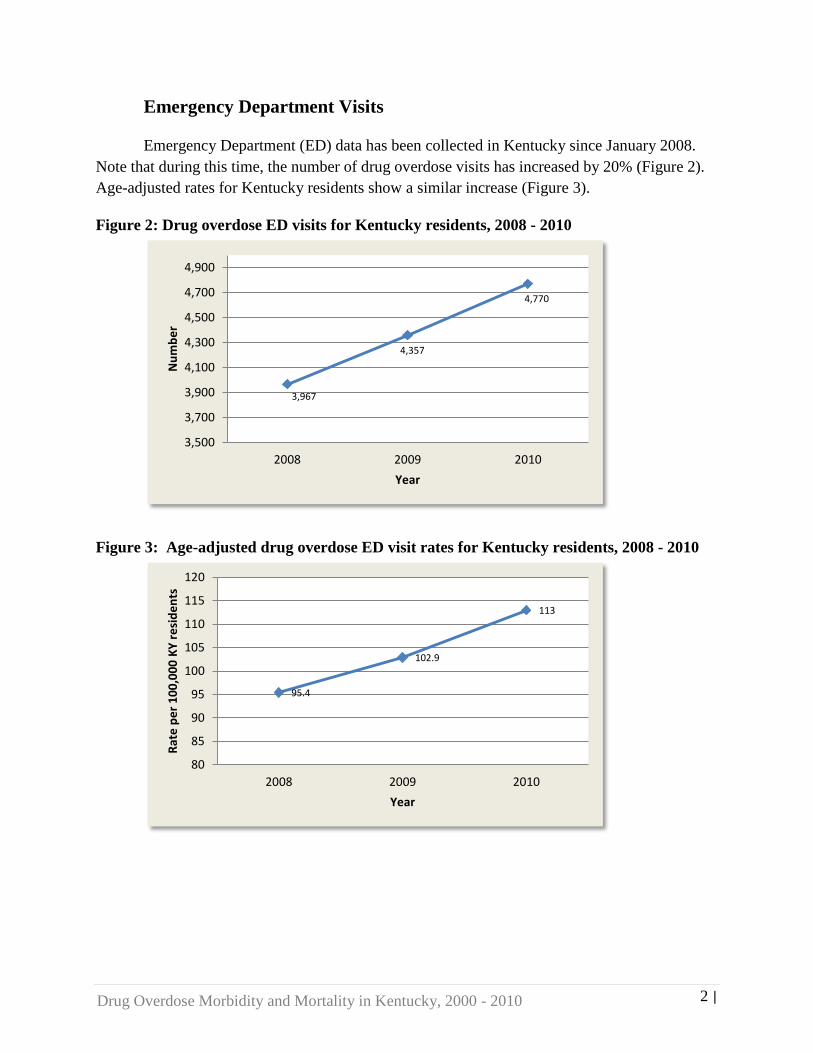
Emergency Department Visits by Gender
Visits for both genders climbed during the time period shown in Figure 5. Of the total number of drug overdose cases, 54% were female. Population-based rates of drug overdose ED visits by gender also increased (Figure 6).
Figure 5: Drug overdose ED visits by gender, Kentucky residents, 2008 - 2010
Figure 6: Drug overdose ED rates by gender, Kentucky residents, 2008 - 2010
2,192 2,341
2,541
1,775
2,016
2,229
1,0001,2001,4001,6001,8002,0002,2002,4002,6002,800
2008 2009 2010
Num
ber
Year
Female Male
100.2 106.6
115.3
84.5 95.2
104.4
0
20
40
60
80
100
120
2008 2009 2010
Rate
per
100
,000
KY
resi
dent
s
Year
Female Male

5 | Drug Overdose Morbidity and Mortality in Kentucky, 2000 - 2010
Emergency Department Visits, Gender by Intent
During the three years shown, the number of unintentional drug poisonings increased for both genders in Kentucky (Figure 7). In 2010, the number of female overdoses with intent to cause self-harm was higher than the number of male overdoses (805 female self-harm cases compared to 534 male self-harm cases). Population-based rates also show an increase in unintentional drug poisonings for both male and female Kentuckians (Figure 8).
Figure 7: Drug overdose ED visits by gender and intent, Kentucky residents, 2008 –2010
Figure 8: Drug overdose ED rates by gender and intent, Kentucky residents, 2008 - 2010
962 1076
1158
868 1034
1115
768 769 805
471 483 534
0
200
400
600
800
1000
1200
1400
2008 2009 2010
Num
ber
Female-Unintentional Male-Unintentional
Female-Self Harm Male-Self Harm
44 49
52.5
41.3 48.8
52.2
35.1 35 36.5
22.4 22.8 25
0
10
20
30
40
50
60
2008 2009 2010
Rate
per
100
,000
KY
resi
dent
s
Female-Unintentional Male-Unintentional
Female-Self Harm Male-Self Harm

6 | Drug Overdose Morbidity and Mortality in Kentucky, 2000 - 2010
Emergency Department Visits by Age
Figure 9 shows that Emergency Department visits among Kentuckians in all age groups rose steadily over the three year period. Figure 10 shows a similar increase in population based rates.
Figure 9: Drug overdose ED visits by age, Kentucky residents, 2008 - 2010
Figure 10: Drug overdose ED rates by age, Kentucky residents, 2008 - 2010
667
768 820
523 570
663
413 451
536
205 263
300
0100200300400500600700800900
2008 2009 2010
Num
ber
25-34 35-44 45-54 55-64
113.7
132.6 144.8
88.2 97.7
115.0
65.4 71.0
83.3
40.8 51.0 55.7
0.0
20.0
40.0
60.0
80.0
100.0
120.0
140.0
160.0
2008 2009 2010
Rate
per
100
,000
KY
resi
dent
s
25-34 35-44 45-54 55-64

7 | Drug Overdose Morbidity and Mortality in Kentucky, 2000 - 2010
Emergency Department Visits by Race Sorting the data by race revealed that 86% of all ED drug overdose cases from 2008 to
2010 were white, and 99% were of non-Hispanic ethnicity.
Table 1: Drug overdose ED visits by race and ethnicity, Kentucky 2008 – 2010 Race Year 2008 2009 2010 Total (n) American Indian or Alaska Native * 0 * * Asian 10 5 8 23 Black or African American 273 345 352 970 Native Hawaiian or Pacific Islander 0 * * * White 3,422 3,597 4,275 11,294 Other 261 409 133 803 Total 3,967 4,357 4,770 13,094
Ethnicity Year 2008 2009 2010 Total (n) Hispanic or Latino Ethnicity 36 39 52 127 Non-Hispanic or Latino Ethnicity 3,931 4,318 4,718 12,967 Total 3,967 4,357 4,770 13,094
*Counts less than 5 were suppressed by state data management policy.

8 | Drug Overdose Morbidity and Mortality in Kentucky, 2000 - 2010
Emergency Department Discharges From 2008 to 2010, 285 (2.2%) Kentucky residents who visited the emergency
department for drug overdose were discharged to cancer centers or hospice care. Discharges to psychiatric care were reported for 836 (6.4%) Kentucky residents, and 10,283 visits resulted in routine discharge (Table 2). Of the total number of emergency department drug overdose patients released to cancer centers from 2008 - 2010, 199 (72%) intended self-harm (Table 3). Among emergency department drug overdose patients transferred to psychiatric care during the same time period, 716 (89%) intended self-harm.
Table 2: Discharge status for drug overdose ED visits, Kentucky residents, 2008 – 2010
Year
Discharge status 2008 2009 2010 Total (n)
Cancer center/Hospice 70 74 141 285
Discharge/transfer to psychiatric hospital/unit
267 282 287 836
Discharge/transfer to hospital/facility 358 429 512 1,299
Expired * 8 8 *
Left/discontinued care AMA 84 99 104 287
Other 0 18 66 84
Routine discharge 3,184 3,447 3,652 10,283 *Counts less than 5 were suppressed by state data management policy. Table 3: Discharge status for drug overdose ED visits by intent, Kentucky residents 2008 – 2010
Intenta
Discharge status Self Harm Undetermined Unintentional Total (n)
Cancer center/Hospice 199 28 50 277
Discharge/transfer to psychiatric hospital/unit
716 54 37 807
Discharge/transfer to hospital/facility
655 187 277 1,119
Expired * 10 * *
Left/discontinued care AMA 55 76 120 251
Other 31 36 15 82
Routine discharge 2,171 1,407 5,710 9,288 *Counts less than 5 were suppressed by state data management policy. a ED visits with missing information on intent are not included in the table.

9 | Drug Overdose Morbidity and Mortality in Kentucky, 2000 - 2010
Emergency Department Charges The total charges incurred for emergency department visits relating to drug overdose rose
steadily from approximately six million dollars in 2008, to approximately nine and a half million dollars in 2010 (Figure 11). Figure 11: Total charges for drug overdose ED visits, Kentucky, 2008 - 2010
Medicare and Medicaid incurred nearly four million dollars worth of charges for ED drug overdose visits in 2010, 41% of the total charges in 2010 (Figure 12).
Figure 12: Total charges for drug overdose ED visits, Kentucky, 2010
$6,195,499
$7,560,088
$9,570,045
$0
$2,000,000
$4,000,000
$6,000,000
$8,000,000
$10,000,000
$12,000,000
2008 2009 2010
Char
ges
Year
$2,109,422
$11,348
$1,332,974
$2,576,647
$2,494,985
$127,921
$95,804 $820,944
Self Pay
Workers Compensation
Medicare
Medicaid
Commercial
CHAMPUS
Other
Charity

10 | Drug Overdose Morbidity and Mortality in Kentucky, 2000 - 2010
Emergency Department Visits by Payer
Medicare and Medicaid were primary payers billed for 43% of the ED drug overdose visits from 2008 through 2010 (Figure 13).
Figure 13: Drug overdose ED visits by payer, Kentucky, 2008 - 2010
2,617
20
1,645
4,051 305
3,739
197
501
Number of Visits
Self Pay
Workers Compensation
Medicare
Medicaid
Other
Commercial - Unknown
CHAMPUS
Charity

11 | Drug Overdose Morbidity and Mortality in Kentucky, 2000 - 2010
Medicare and Medicaid Emergency Department Visits by Intent The number of unintentional drug overdose ED visits for Medicare has climbed over the
three year period (Figure 14). Of the total number of Medicare drug overdose ED visits, 57% of the visits were coded as unintentional overdoses. The number of unintentional drug overdose visits for Medicaid has also increased (Figure 15). Of the total number of Medicaid visits, 55% were coded as unintentional. These percentages could be higher because of cases where intent was undetermined, or information on intent was missing.
Figure 14: Medicare drug overdose ED visits by intent, Kentucky, 2008 – 2010*
*Information on intent was missing in 13% of Medicare cases
Figure 15: Medicaid drug overdose ED visits by intent, Kentucky, 2008 – 2010*
∗ Information on intent was missing in 8% of Medicaid cases
91 88 109
65 58 85
252
321
362
050
100150200250300350400
2008 2009 2010
Num
ber
Year
Self Harm Undetermined Unintentional
297 285 330
156 161 227
704 722 823
0100200300400500600700800900
2008 2009 2010
Num
ber
Year
Self Harm Undetermined Unintentional

12 | Drug Overdose Morbidity and Mortality in Kentucky, 2000 - 2010
Emergency Department Drug Overdose Cases by Substance
The number of emergency department drug overdose cases with opiates and related narcotics present has climbed since 2008. Kentucky emergency departments are also experiencing a rise in the number of cases involving benzodiazepine-based tranquilizers. In 2010, 697 cases involved opiates and related narcotics, and 693 cases involved benzodiazepine-based tranquilizers (Figure 16).
Figure 16: Substances present in drug overdose ED visits, Kentucky, 2008 - 2010
441
532
697
560
636
693
400
450
500
550
600
650
700
750
2008 2009 2010
Num
ber
Year
Opiates and relatednarcotics (965.0)
Benzodiazepine-basedtranquilizers (969.4)

13 | Drug Overdose Morbidity and Mortality in Kentucky, 2000 - 2010
Inpatient Hospitalizations among Kentucky Residents Treated in Kentucky Acute Care
Hospitals, 2000 - 2010

14 | Drug Overdose Morbidity and Mortality in Kentucky, 2000 - 2010
Hospitalizations The number of inpatient hospitalizations for drug overdoses in Kentucky climbed 78%
from 2000 to 2010, from 2,447 hospitalizations in 2000 to 4,348 hospitalizations in 2010. (Figure 17). Rates of hospitalized drug overdoses have likewise increased 68%, and Kentucky rates remained consistently above the national average since 2001 (Figure 18). The numbers in Figures 17 and 18 and all subsequent figures in this section of the report are based on hospital discharge (HD) billing records from acute care hospitals in Kentucky. Records from rehabilitation facilities and long term care facilities were not counted.
Figure 17: Drug overdose inpatient hospitalizations for Kentucky residents treated in Kentucky acute care hospitals, 2000 - 2010
Figure 18: Age-adjusted drug overdose inpatient hospitalization rates for Kentucky residents treated in Kentucky acute care hospitals, 2000 – 2010*
*The crude US rates are based on weighted national estimates from Healthcare Cost and Utilization Project (HCUP) National Inpatient Sample, Agency for Healthcare Research and Quality.
2,447
2,925 3,119
3,275 3,440
3,432
3,824
3,983
3,935 4,137
4,348
2,000
2,500
3,000
3,500
4,000
4,500
5,000
2000 2001 2002 2003 2004 2005 2006 2007 2008 2009 2010
Num
ber
Year
59.9
71.4
75.9 79.1
82.6 81.7
90.7 94.0 92.1 95.7
100.7
64.7 69.1 70.1 71.4
77.4 77.3
82.3 82.8 88.8
88.8 93.3
50
60
70
80
90
100
110
2000 2001 2002 2003 2004 2005 2006 2007 2008 2009 2010
Rate
per
100
,000
resi
dent
s
Kentucky USA

15 | Drug Overdose Morbidity and Mortality in Kentucky, 2000 - 2010
Hospitalizations by Intent
While the number of cases with intent toward self-harm increased 48% between 2000 and 2010, the number of hospitalizations due to unintentional drug overdose increased 180% during the same time period, from 527 cases in 2000 to 1,472 cases in 2010 (Figure 19). In Figures 19 and 20, 3,423 records (about 9%) did not have E-codes available, so intent was not classified for those cases. Cases with missing information on intent (i.e., missing E-codes) decreased from 11.2% in 2000, to 5.7% in 2010.
Figure 19: Drug overdose inpatient hospitalizations by intent, Kentucky residents treated in Kentucky acute care hospitals, 2000 – 2010*
*Information on intent was missing in 9% of drug overdose hospitalization cases.
1,335 1,507
1,687 1,721 1,801 1,726 1,888 1,967 1,975
1,885 1,973
307 368 399 376 420 438 488 532 523 551 653
527 752 701 787 859
948 1,071 1,108
1,233 1,445 1,472
0
500
1,000
1,500
2,000
2000 2001 2002 2003 2004 2005 2006 2007 2008 2009 2010
Num
ber
Year
Self-harm Undetermined Unintentional

16 | Drug Overdose Morbidity and Mortality in Kentucky, 2000 - 2010
Population based rates show a 161% rise in unintentional drug overdose hospitalizations, from a rate of 13.0 in 2000, to a rate of 33.9 in 2010.
Figure 20: Drug overdose inpatient hospitalization rates by intent, Kentucky residents treated in Kentucky acute care hospitals, 2000 – 2010*
*Information on intent was missing in 9% of drug overdose hospitalization cases.
33.0 37.0
41.2 41.8 43.4 41.3
44.7 46.2 46.0 43.7 45.5
7.6 9.0 9.8 9.1 10.1 10.5 11.6 12.5 12.2 12.8
15.0 13.0
18.5 17.1 19.1 20.7 22.7
25.4 26.0 28.7
33.5 33.9
0
10
20
30
40
50
2000 2001 2002 2003 2004 2005 2006 2007 2008 2009 2010Rate
per
100
,000
KY
resi
dent
s
Year
Self-harm Undetermined Unintentional

17 | Drug Overdose Morbidity and Mortality in Kentucky, 2000 - 2010
Hospitalizations by Gender
Figure 21 shows that the number of drug overdose hospitalizations was higher for female Kentuckians, with 2,455 female cases in 2010, and 1,893 male cases that same year. Though the numbers are lower for male Kentuckians, there has been an 83% increase in the number of male cases over the time period shown, from 1,034 hospitalizations in 2000 to 1,893 hospitalizations in 2010. Figure 22 shows a similar increase in drug overdose hospitalizations for both genders over time, in population-based rates.
Figure 21: Drug overdose inpatient hospitalizations by gender, Kentucky residents treated in Kentucky acute care hospitals, 2000 – 2010
Figure 22: Drug overdose inpatient hospitalization rates by gender, Kentucky residents treated in Kentucky acute care hospitals, 2000 – 2010
1,034 1,189
1,269 1,366 1,463 1,520 1,671
1,672 1,640 1,791 1,893
1,413
1,736 1,850 1,909 1,977
1,912 2,153
2,311 2,295 2,346 2,455
0
500
1,000
1,500
2,000
2,500
3,000
2000 2001 2002 2003 2004 2005 2006 2007 2008 2009 2010
Num
ber
Male Female
52.3 59.7 63.4 67.8 72.0 74.1
80.8 80.1 78.1 84.6 88.7 68.4
83.5 88.5 90.7 93.5 89.7
100.1 106.6 104.9 106.8 111.4
0.0
20.0
40.0
60.0
80.0
100.0
120.0
140.0
2000 2001 2002 2003 2004 2005 2006 2007 2008 2009 2010
Rate
per
100
,000
pop
ulat
ion
Male Female

18 | Drug Overdose Morbidity and Mortality in Kentucky, 2000 - 2010
Hospitalizations by Gender and Intent From 2000 to 2010, female Kentuckians with intent to cause self-harm accounted for
34% of all drug overdose hospitalizations, given available information on the intent of injury. The number of female self-harm cases increased from 849 cases in 2000 to 1,181 cases in 2010. Of the self-harm drug overdose cases reported, females accounted for 61% (Figure 23).
Figure 23: Drug overdose inpatient hospitalizations by gender and intent, Kentucky residents treated in Kentucky acute care hospitals, 2000 - 2010 (For additional data, see Appendix, Table 11)ab
aInformation on intent was missing in 9% of cases. b7% of female cases were coded as intent undetermined, and 7% of male cases were coded as intent undetermined.
849 951
1,046 1,052 1,097 1,032
1,154 1,231 1,201
1,135 1,181
0
200
400
600
800
1,000
1,200
1,400
2000 2001 2002 2003 2004 2005 2006 2007 2008 2009 2010
Num
ber
Year
Female-Unintentional Male-Unintentional
Female-Self-harm Male-Self-harm

19 | Drug Overdose Morbidity and Mortality in Kentucky, 2000 - 2010
Population-based rates of drug overdose hospitalizations by gender (Figure 24) mirror the trends in Figure 23.
Figure 24: Drug overdose inpatient hospitalization rates by gender and intent, Kentucky residents treated in Kentucky acute care hospitals, 2000 - 2010 (For additional data, see Appendix, Table 12)ab
aInformation on intent was missing in 9% of cases. b7% of female cases were coded as intent undetermined, and 7% of male cases were coded as intent undetermined.
41.1 45.8
50.1 50.0 51.9 48.4
53.6 56.8 54.9
51.7 53.6
0
10
20
30
40
50
60
2000 2001 2002 2003 2004 2005 2006 2007 2008 2009 2010
Rate
per
100
,000
KY
resi
dent
s
Year
Female -Unintentional Male-Unintentional
Female-Self-harm Male-Self-harm
20 | Drug Overdose Morbidity and Mortality in Kentucky, 2000 - 2010
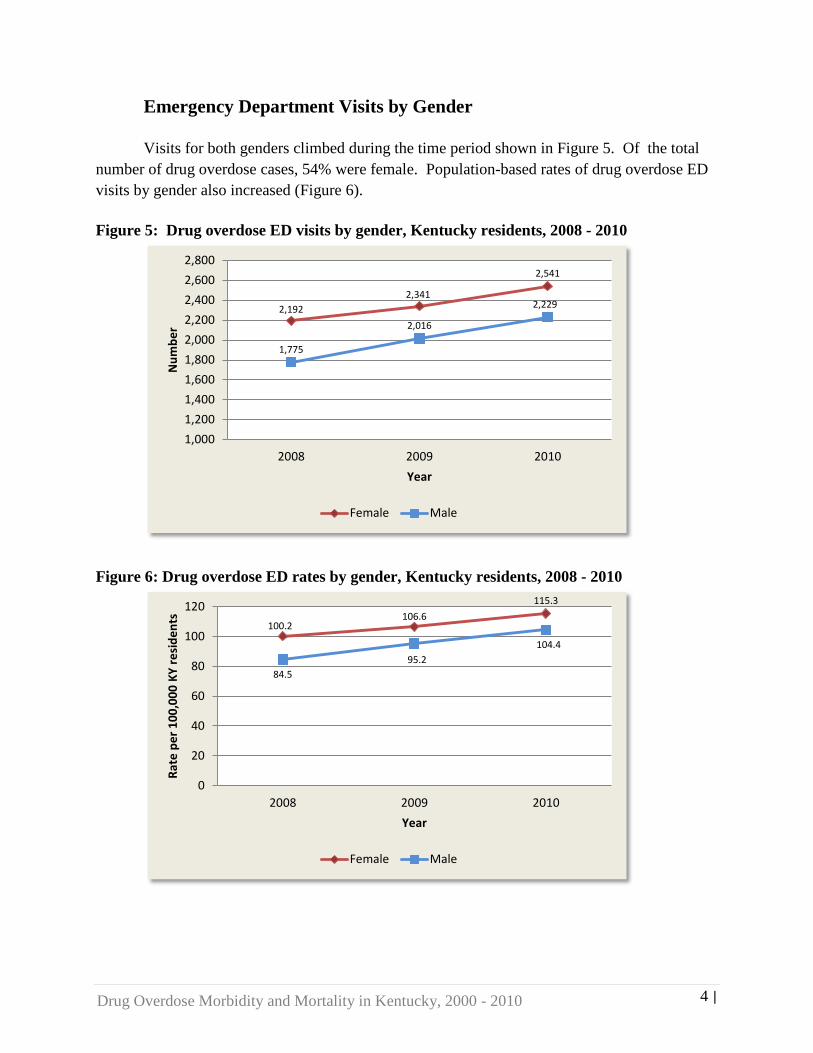
Hospitalizations by Age While the number of Kentucky residents admitted for drug overdose hospitalizations
remains fairly steady for residents ages 15 – 24 years, admissions for residents between the ages of 45 and 54 are on the rise (Figure 25). In the 45 to 54 year age bracket, the number of drug overdose hospitalizations has increased by 165% since 2000. In the 55 to 64 year age bracket, the number of drug overdose hospitalizations has increased 217%.
Figure 25: Drug overdose inpatient hospitalizations by age group, Kentucky residents treated in Kentucky acute care hospitals, 2000 - 2010 (For data, see Appendix, Table 13)
0
200
400
600
800
1,000
1,200
2000 2001 2002 2003 2004 2005 2006 2007 2008 2009 2010
Num
ber
Year
15-24 25-34 35-44 45-54 55-64
21 | Drug Overdose Morbidity and Mortality in Kentucky, 2000 - 2010
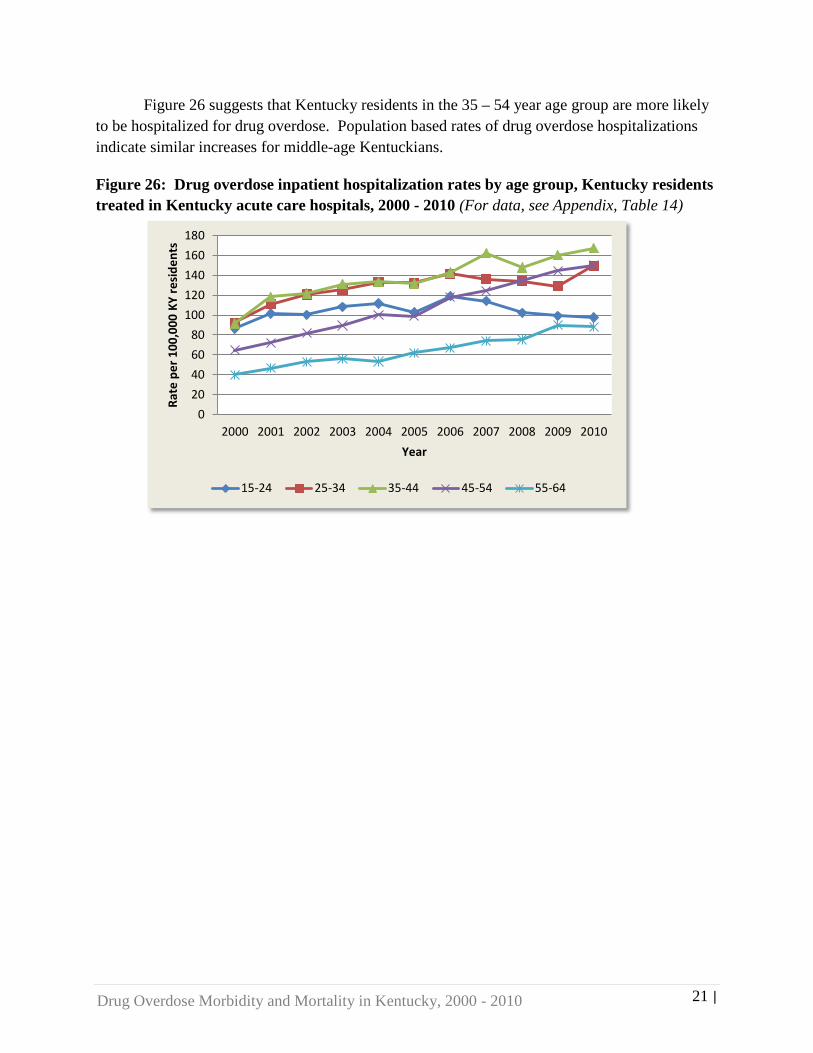
Figure 26 suggests that Kentucky residents in the 35 – 54 year age group are more likely to be hospitalized for drug overdose. Population based rates of drug overdose hospitalizations indicate similar increases for middle-age Kentuckians.
Figure 26: Drug overdose inpatient hospitalization rates by age group, Kentucky residents treated in Kentucky acute care hospitals, 2000 - 2010 (For data, see Appendix, Table 14)
020406080
100120140160180
2000 2001 2002 2003 2004 2005 2006 2007 2008 2009 2010
Rate
per
100
,000
KY
resi
dent
s
Year
15-24 25-34 35-44 45-54 55-64

22 | Drug Overdose Morbidity and Mortality in Kentucky, 2000 - 2010
Hospitalizations by Race Racial statistics revealed that 91% of all acute care drug hospitalization cases in 2010
were white, and 99% were of non-Hispanic ethnicity. Note that race and ethnicity data was not collected before 2008.
Table 4: Drug overdose inpatient hospitalizations by race and ethnicity, Kentucky residents treated in Kentucky acute care hospitals, 2000 – 2010
Race Year
2000 2001 2002 2003 2004 2005 2006 2007 2008 2009 2010 Total (n)
Uncoded 2,447 2,925 3,119 3,275 3,440 3,432 3,824 3,983 0 0 0 26,445
American Indian or Alaska Native 0 0 0 0 0 0 0 0 3 * 0 *
Asian 0 0 0 0 0 0 0 0 * 9 8 *
Black or African American 0 0 0 0 0 0 0 0 153 198 164 515
Native Hawaiian or Pacific Islander 0 0 0 0 0 0 0 0 0 * * *
White 0 0 0 0 0 0 0 0 3,554 3,527 3,975 11,056
Other 0 0 0 0 0 0 0 0 221 401 200 822
Total 2,447 2,925 3,119 3,275 3,440 3,432 3,824 3,983 3,935 4,137 4,348 38,865
Ethnicity Year
2000 2001 2002 2003 2004 2005 2006 2007 2008 2009 2010 Total (n)
Uncoded 2,447 2,925 3,119 3,275 3,440 3,432 3,824 3,983 0 0 0 26,445
Hispanic or Latino Ethnicity 0 0 0 0 0 0 0 0 17 13 20 50
Non-Hispanic or Latino Ethnicity 0 0 0 0 0 0 0 0 3,918 4,124 4,328 12,370
Total 2,447 2,925 3,119 3,275 3,440 3,432 3,824 3,983 3,935 4,137 4,348 38,865 *Counts less than 5 were suppressed by state data management policy.

23 | Drug Overdose Morbidity and Mortality in Kentucky, 2000 - 2010
Hospitalization Discharges From 2000 to 2010, 4,066 Kentuckians admitted to Kentucky acute care hospitals for
drug overdose were released to cancer centers or hospice care, and 4,032 Kentuckians were released to psychiatric care. Table 5 shows the number of discharges to cancer centers or Hospice is decreasing, but the number of discharges to psychiatric hospitals is increasing.
Table 5: Drug overdose inpatient hospitalization discharges from Kentucky acute care hospitals, 2000 - 2010
Year
Discharge status 2000 2001 2002 2003 2004 2005 2006 2007 2008 2009 2010 Total
(n)
Cancer center/Hospice
348 390 452 534 640 431 439 406 182 156 88 4,066
Discharge/transfer to psychiatric hospital/unit
- - - - 140 373 511 591 790 815 812 4,032
Discharge/transfer to hospital/facility
168 204 307 330 299 245 236 231 258 281 303 2,862
Expired 29 24 26 33 27 29 44 54 60 73 64 463
Home health 58 111 100 116 86 83 85 112 125 132 168 1,176
Left/discontinued care AMA
136 182 164 190 181 152 196 158 144 177 219 1,899
Other 120 98 58 75 42 - - - - 16 45 455
Routine discharge 1,588 1,916 2,012 1,997 2,025 2,119 2,313 2,431 2,376 2,487 2,649 23,912
Total 2,447 2,925 3,119 3,275 3,440 3,432 3,824 3,983 3,935 4,137 4,348 38,865

24 | Drug Overdose Morbidity and Mortality in Kentucky, 2000 - 2010
Hospitalization Discharges by Intent
Note that from 2000 to 2010, 3,062 drug overdose hospitalization cases with an E-code indicating intent toward self-harm were discharged to hospice care or cancer centers. During the same time period, 3,210 drug overdose hospitalization cases were released to psychiatric care as a result of attempt toward self-harm. However, most drug overdose hospitalization patients with intent to cause self-harm were given a routine discharge (Table 6).
Table 6: Drug overdose inpatient hospitalization discharges from Kentucky acute care hospitals, by intent, 2000 - 2010
Intent
Discharge status Self-harm Undetermined Unintentional
Cancer center/Hospice 3,062 332 373
Discharge/transfer to psychiatric hospital/unit
3,210 307 346
Discharge/transfer to hospital/facility 1,436 303 753
Expired 144 148 111
Home health 196 137 683
Left/discontinued care AMA 695 482 518
Other 355 44 37
Routine discharge 10,367 3,302 8,082
Total (n) 19,465 5,055 10,903

25 | Drug Overdose Morbidity and Mortality in Kentucky, 2000 - 2010
Hospitalization Charges
In the year 2000, hospital charges incurred as a result of drug overdose were $14,334,554. In 2010, charges billed were $68,572,368 (Figure 27).
Figure 27: Total charges billed for drug overdose inpatient hospitalizations, Kentucky residents treated in Kentucky acute care hospitals, 2000 - 2010
$14,334,554 $17,741,265
$23,179,726 $31,383,022
$35,493,286 $36,755,914
$45,454,827 $51,871,170
$54,719,388 $61,229,637
$68,572,368
$0
$10,000,000
$20,000,000
$30,000,000
$40,000,000
$50,000,000
$60,000,000
$70,000,000
$80,000,000
2000 2001 2002 2003 2004 2005 2006 2007 2008 2009 2010
Total Charges Billed

26 | Drug Overdose Morbidity and Mortality in Kentucky, 2000 - 2010
Hospitalizations by Payer Medicare and Medicaid were the providers billed for 48% of the drug overdose
hospitalization cases over the eleven-year period (Figure 28).
Figure 28: Drug overdose inpatient hospitalizations by payer, Kentucky residents treated in Kentucky acute care hospitals, 2000 - 2010
Medicare and Medicaid incurred 57% of the total charges for all drug overdose
hospitalizations in Kentucky during 2010 (Figure 29).
Figure 29: Drug overdose inpatient hospitalizations by percentage of total charges, Kentucky residents treated in Kentucky acute care hospitals, 2010 (For charges, see Appendix, Table 15)
Self Pay 19%
Workers' Compensation
0%
Medicare 23%
Medicaid 25%
Other 8%
Commercial 23%
CHAMPUS 1%
Charity 1%
Self Pay
Workers' Compensation
Medicare
Medicaid
Other
Commercial
CHAMPUS
Charity
Self Pay 15%
Workers' Compensation
<1%
Medicare 30%
Medicaid 27%
Commercial 20%
CHAMPUS 1%
Other 1% Charity
6% Self Pay
Workers' Compensation
Medicare
Medicaid
Commercial
CHAMPUS
Other
Charity

27 | Drug Overdose Morbidity and Mortality in Kentucky, 2000 - 2010
Hospitalizations by Length of Stay
In correlation with the increasing number of admissions over the years shown, the total number of days of hospital stay due to drug overdose has been on the rise since the year 2000 (Figure 30).
Figure 30: Drug overdose inpatient hospitalizations by total length of stay, Kentucky residents treated in Kentucky acute care hospitals, 2010
The average length of stay for a drug overdose hospitalization is between 2.5 and 3 days
(Figure 31).
Figure 31: Drug overdose inpatient hospitalizations by average length of stay, Kentucky residents treated in Kentucky acute care hospitals, 2000 - 2010
6,405
7,430
8,415
9,562
9,488
9,520
10,815
12,306
11,780
12,467
12,544
5,000
6,000
7,000
8,000
9,000
10,000
11,000
12,000
13,000
14,000
2000 2001 2002 2003 2004 2005 2006 2007 2008 2009 2010
Days
Year
2.62 2.54 2.7
2.92 2.76 2.77 2.83 3.09 2.99 3.01 2.89
0
0.5
1
1.5
2
2.5
3
3.5
4
2000 2001 2002 2003 2004 2005 2006 2007 2008 2009 2010
Days
Year
28 | Drug Overdose Morbidity and Mortality in Kentucky, 2000 - 2010
Medicare and Medicaid Hospitalizations by Intent
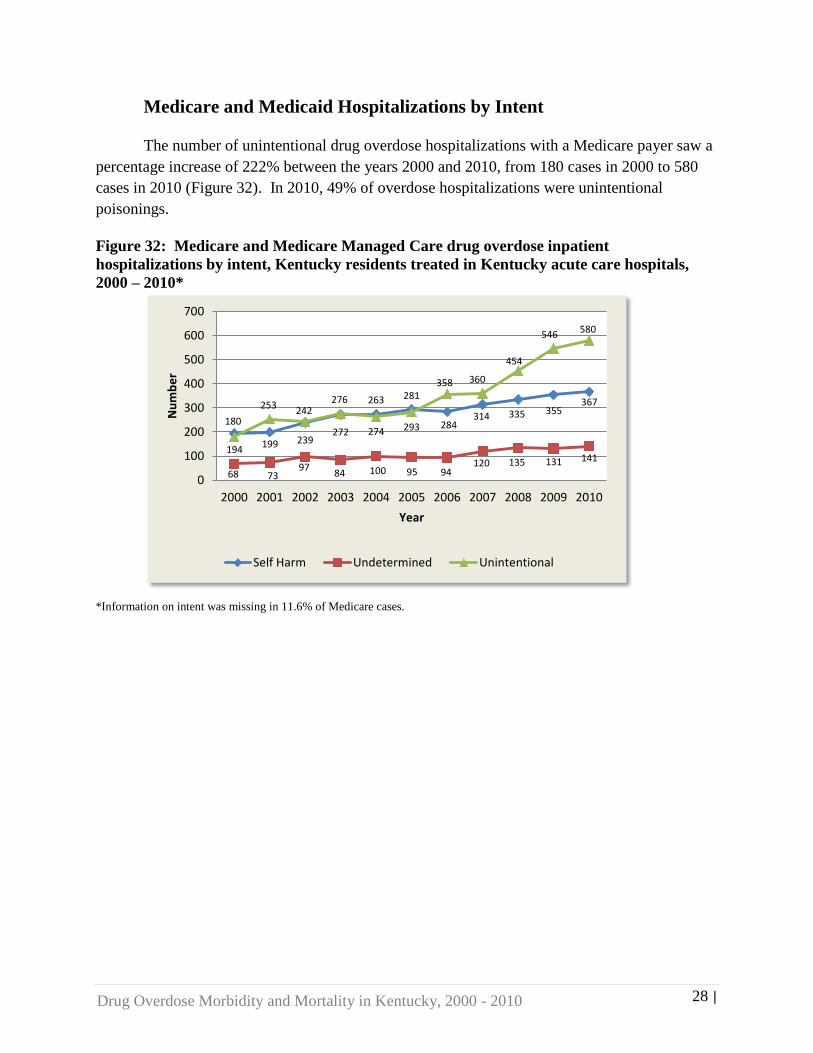
The number of unintentional drug overdose hospitalizations with a Medicare payer saw a percentage increase of 222% between the years 2000 and 2010, from 180 cases in 2000 to 580 cases in 2010 (Figure 32). In 2010, 49% of overdose hospitalizations were unintentional poisonings.
Figure 32: Medicare and Medicare Managed Care drug overdose inpatient hospitalizations by intent, Kentucky residents treated in Kentucky acute care hospitals, 2000 – 2010*
*Information on intent was missing in 11.6% of Medicare cases.
194 199 239 272 274 293 284
314 335 355 367
68 73 97 84 100 95 94
120 135 131 141
180 253 242
276 263 281 358 360
454
546 580
0
100
200
300
400
500
600
700
2000 2001 2002 2003 2004 2005 2006 2007 2008 2009 2010
Num
ber
Year
Self Harm Undetermined Unintentional

29 | Drug Overdose Morbidity and Mortality in Kentucky, 2000 - 2010
Medicaid (Figure 33) also saw a slight rise in the number of unintentional drug overdose hospitalizations. Cases coded as intent to cause self-harm accounted for 50% of the Medicaid drug overdose hospitalizations in the past 11 years. Cases with missing information on intent (11.6% for Medicare and 8% for Medicaid) are not shown on the figures. Figure 33: Medicaid and Passport Medicaid Managed Care drug overdose inpatient hospitalizations by intent, Kentucky residents treated in Kentucky acute care hospitals, 2000 – 2010*
*Information on intent was missing in 8% of Medicaid cases.
364 396
453 429 478
445
507 460 469
410
475
89 98 119 105 123 138 165 156 153 152
216 119 165 154 151
244 236 267 273 278
345
361
0
100
200
300
400
500
600
2000 2001 2002 2003 2004 2005 2006 2007 2008 2009 2010
Num
ber
Year
Self Harm Undetermined Unintentional
30 | Drug Overdose Morbidity and Mortality in Kentucky, 2000 - 2010
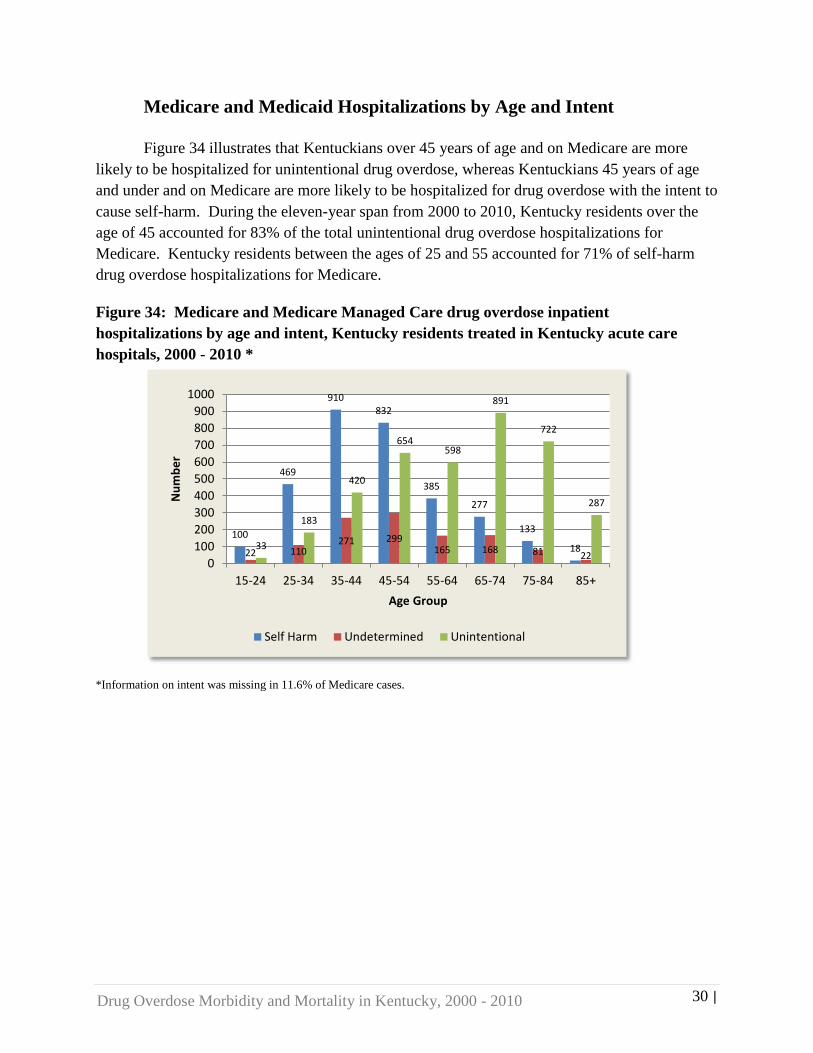
Medicare and Medicaid Hospitalizations by Age and Intent
Figure 34 illustrates that Kentuckians over 45 years of age and on Medicare are more likely to be hospitalized for unintentional drug overdose, whereas Kentuckians 45 years of age and under and on Medicare are more likely to be hospitalized for drug overdose with the intent to cause self-harm. During the eleven-year span from 2000 to 2010, Kentucky residents over the age of 45 accounted for 83% of the total unintentional drug overdose hospitalizations for Medicare. Kentucky residents between the ages of 25 and 55 accounted for 71% of self-harm drug overdose hospitalizations for Medicare.
Figure 34: Medicare and Medicare Managed Care drug overdose inpatient hospitalizations by age and intent, Kentucky residents treated in Kentucky acute care hospitals, 2000 - 2010 *
*Information on intent was missing in 11.6% of Medicare cases.
100
469
910 832
385
277
133
18 22 110 271 299
165 168 81 22 33
183
420
654 598
891
722
287
0100200300400500600700800900
1000
15-24 25-34 35-44 45-54 55-64 65-74 75-84 85+
Num
ber
Age Group
Self Harm Undetermined Unintentional

31 | Drug Overdose Morbidity and Mortality in Kentucky, 2000 - 2010
Figure 35 illustrates that Kentuckians on Medicaid, under the age of 44 are more likely to be hospitalized for drug overdose with the intent to cause self-harm. Of all Medicaid drug overdose hospitalizations coded as self-harm, Kentuckians between the ages of 15 and 45 accounted for 77% of the cases.
Figure 35: Medicaid and Medicaid Managed Care drug overdose inpatient hospitalizations by age and intent, Kentucky residents treated in Kentucky acute care hospitals, 2000 – 2010*
*Information on intent was missing in 8% of Medicaid cases.
189
1265 1218 1290
707
207
9 52 276 322 414 295 130 10 86
312
463 590
515
293
24
0
200
400
600
800
1,000
1,200
1,400
5-14 15-24 25-34 35-44 45-54 55-64 65+
Num
ber
Age Group
Self Harm Undetermined Unintentional
32 | Drug Overdose Morbidity and Mortality in Kentucky, 2000 - 2010
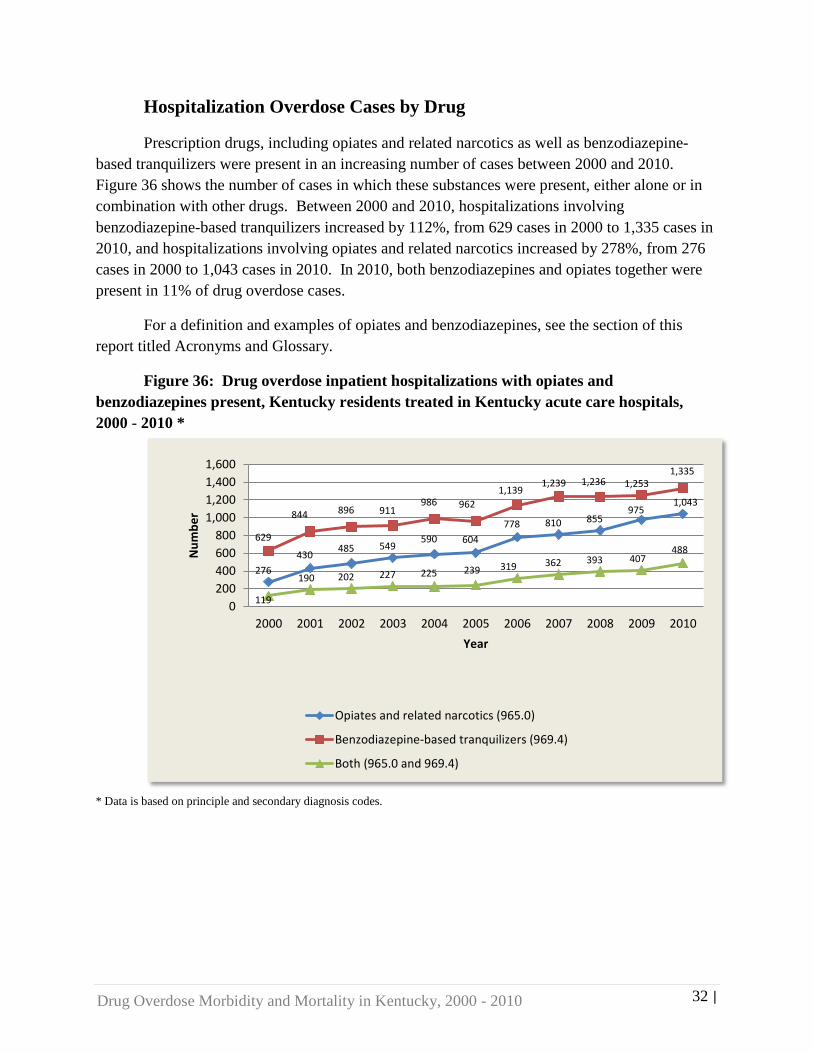
Hospitalization Overdose Cases by Drug
Prescription drugs, including opiates and related narcotics as well as benzodiazepine-based tranquilizers were present in an increasing number of cases between 2000 and 2010. Figure 36 shows the number of cases in which these substances were present, either alone or in combination with other drugs. Between 2000 and 2010, hospitalizations involving benzodiazepine-based tranquilizers increased by 112%, from 629 cases in 2000 to 1,335 cases in 2010, and hospitalizations involving opiates and related narcotics increased by 278%, from 276 cases in 2000 to 1,043 cases in 2010. In 2010, both benzodiazepines and opiates together were present in 11% of drug overdose cases.
For a definition and examples of opiates and benzodiazepines, see the section of this report titled Acronyms and Glossary.
Figure 36: Drug overdose inpatient hospitalizations with opiates and benzodiazepines present, Kentucky residents treated in Kentucky acute care hospitals, 2000 - 2010 *
* Data is based on principle and secondary diagnosis codes.
276 430 485 549
590 604 778 810 855
975 1,043
629
844 896 911 986 962
1,139 1,239 1,236 1,253
1,335
119
190 202 227 225 239 319 362 393 407 488
0200400600800
1,0001,2001,4001,600
2000 2001 2002 2003 2004 2005 2006 2007 2008 2009 2010
Num
ber
Year
Opiates and related narcotics (965.0)
Benzodiazepine-based tranquilizers (969.4)
Both (965.0 and 969.4)

33 | Drug Overdose Morbidity and Mortality in Kentucky, 2000 - 2010
Drug Overdose Fatalities among Kentucky Residents, 2000 - 2010

34 | Drug Overdose Morbidity and Mortality in Kentucky, 2000 - 2010
Fatalities
Between the years 2000 and 2010, the number of drug overdose fatalities increased 296%, from 247 cases in 2000 to 979 cases in 2010 (Figure 37). From 2009 to 2010 alone, there was a 31% increase in the number of fatalities. Figure 38, which shows rates adjusted to the 2000 census population, reflects the findings in Figure 37.
Figure 37: Drug overdose fatalities for Kentucky residents, 2000 - 2010
Figure 38: Age-adjusted drug overdose death rates among Kentucky residents, 2000 – 2010*
* The U.S. and Kentucky rates are standard age-adjusted rates using 2000 U.S. Standard Population. The U.S. death rates are based on the National Vital Statistics System multiple cause of death files and were obtained from the CDC Wide-ranging Online Data for Epidemiologic Research (WONDER) system, with the most recent year available data for 2009.
247 333
435
549 525
621
711
673
747 746
979
0
200
400
600
800
1,000
1,200
2000 2001 2002 2003 2004 2005 2006 2007 2008 2009 2010
Num
ber
Year
6.0 8.1 10.6
13.2 12.6
14.8
16.8
15.8
17.5 17.4
22.9
6.2 6.8 8.1 8.9 9.3 10
11.4 11.8 11.9 12
0.0
5.0
10.0
15.0
20.0
25.0
2000 2001 2002 2003 2004 2005 2006 2007 2008 2009 2010
Rate
per
100
,000
Year
KY age-adjusted drug overdose fatality rate
US age-adjusted drug overdose fatality rate

35 | Drug Overdose Morbidity and Mortality in Kentucky, 2000 - 2010
Fatalities by Intent The majority of drug overdose deaths among Kentuckians were coded as unintentional.
In 2010, unintentional overdoses accounted for 88% of all drug overdoses (Figure 39). The rate of unintentional drug overdose deaths increased by 39% from 2009 to 2010, to a record high rate of 20 deaths per 100,000 population (Figure 40).
Figure 39: Drug overdose fatalities by intent, Kentucky residents, 2000 - 2010 (For additional data, see Appendix, Table 16)
Figure 40: Drug overdose fatality rates by intent, Kentucky residents, 2000 - 2010 (For additional data, see Appendix, Table 17)
205 260
355
470 443
533 590
546 620 612
857
0100200300400500600700800900
2000 2001 2002 2003 2004 2005 2006 2007 2008 2009 2010
Num
ber
Year
Suicide Undetermined Unintentional
5.1 6.4
8.7
11.4 10.7 12.7
14.0 12.8
14.5 14.2
19.7
0
5
10
15
20
2000 2001 2002 2003 2004 2005 2006 2007 2008 2009 2010
Rate
per
100
,000
KY
resi
dent
s
Year
Suicide Undetermined Unintentional
36 | Drug Overdose Morbidity and Mortality in Kentucky, 2000 - 2010
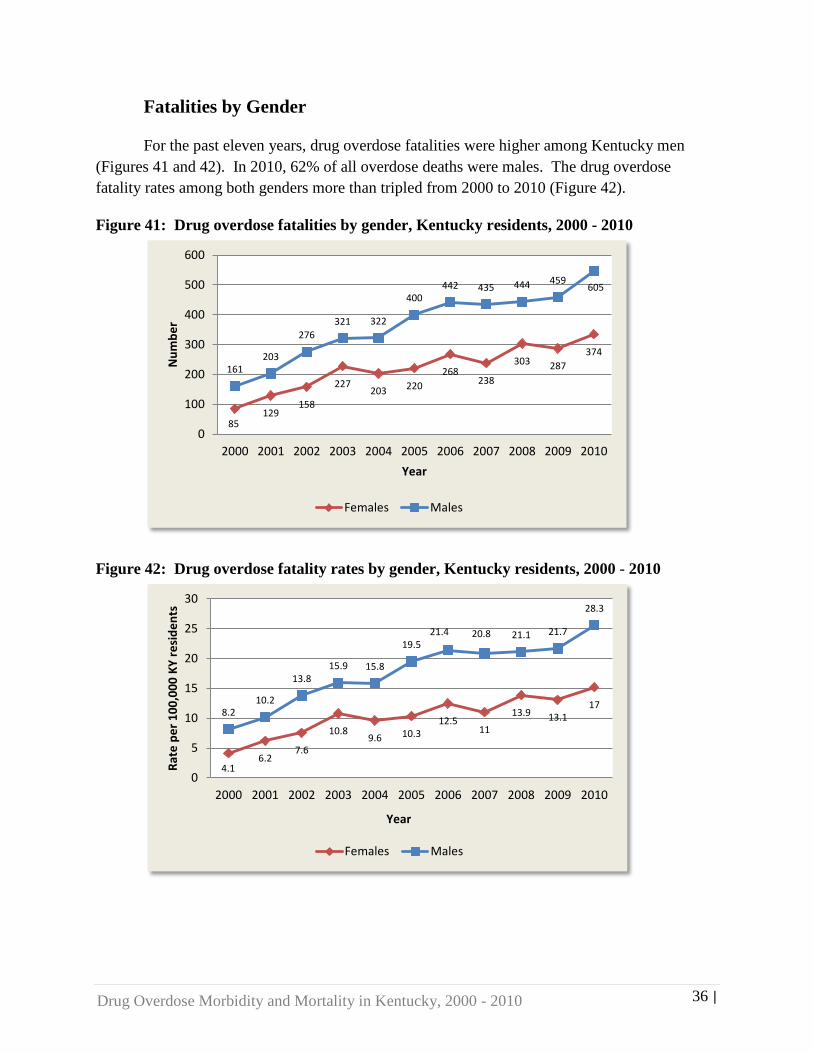
Fatalities by Gender
For the past eleven years, drug overdose fatalities were higher among Kentucky men (Figures 41 and 42). In 2010, 62% of all overdose deaths were males. The drug overdose fatality rates among both genders more than tripled from 2000 to 2010 (Figure 42).
Figure 41: Drug overdose fatalities by gender, Kentucky residents, 2000 - 2010
Figure 42: Drug overdose fatality rates by gender, Kentucky residents, 2000 - 2010
85 129
158
227 203 220
268 238
303 287 374
161 203
276 321 322
400 442 435 444 459
605
0
100
200
300
400
500
600
2000 2001 2002 2003 2004 2005 2006 2007 2008 2009 2010
Num
ber
Year
Females Males
4.1 6.2
7.6
10.8 9.6 10.3
12.5 11
13.9 13.1 17
8.2 10.2
13.8 15.9 15.8
19.5 21.4 20.8 21.1 21.7
28.3
0
5
10
15
20
25
30
2000 2001 2002 2003 2004 2005 2006 2007 2008 2009 2010
Rate
per
100
,000
KY
resi
dent
s
Year
Females Males

37 | Drug Overdose Morbidity and Mortality in Kentucky, 2000 - 2010
Fatalities by Gender and Intent
Figures 43 and 44 show that unintentional drug overdose fatalities rose in both genders. Overall, 65% of the unintentional drug overdose deaths were among men. Among suicides, 57% were female.
Figure 43: Drug overdose fatalities by gender and intent, Kentucky residents, 2000 - 2010 (For data, see Appendix, Table 18)
Figure 44: Drug overdose fatality rates by gender and intent, Kentucky residents, 2000 - 2010 (For data, see Appendix, Table 19)
0
100
200
300
400
500
600
2000 2001 2002 2003 2004 2005 2006 2007 2008 2009 2010
Num
ber
Year
Female-Unintentional Male-Unintentional
Female-Suicide Male-Suicide
0.0
5.0
10.0
15.0
20.0
25.0
30.0
2000 2001 2002 2003 2004 2005 2006 2007 2008 2009 2010
Rate
per
100
,000
KY
resi
dent
s
Year
Female-Unintentional Male-Unintentional
Female-Suicide Male-Suicide
38 | Drug Overdose Morbidity and Mortality in Kentucky, 2000 - 2010
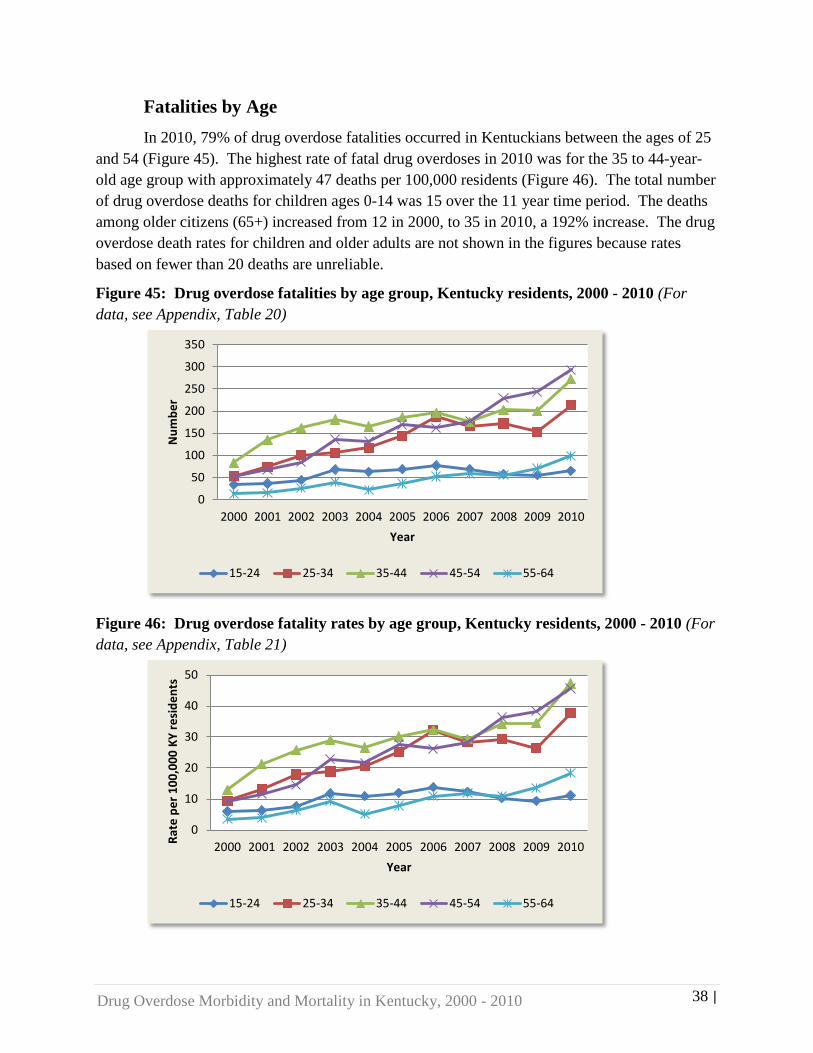
Fatalities by Age In 2010, 79% of drug overdose fatalities occurred in Kentuckians between the ages of 25
and 54 (Figure 45). The highest rate of fatal drug overdoses in 2010 was for the 35 to 44-year-old age group with approximately 47 deaths per 100,000 residents (Figure 46). The total number of drug overdose deaths for children ages 0-14 was 15 over the 11 year time period. The deaths among older citizens (65+) increased from 12 in 2000, to 35 in 2010, a 192% increase. The drug overdose death rates for children and older adults are not shown in the figures because rates based on fewer than 20 deaths are unreliable.
Figure 45: Drug overdose fatalities by age group, Kentucky residents, 2000 - 2010 (For data, see Appendix, Table 20)
Figure 46: Drug overdose fatality rates by age group, Kentucky residents, 2000 - 2010 (For data, see Appendix, Table 21)
0
50
100
150
200
250
300
350
2000 2001 2002 2003 2004 2005 2006 2007 2008 2009 2010
Num
ber
Year
15-24 25-34 35-44 45-54 55-64
0
10
20
30
40
50
2000 2001 2002 2003 2004 2005 2006 2007 2008 2009 2010Rate
per
100
,000
KY
resi
dent
s
Year
15-24 25-34 35-44 45-54 55-64

39 | Drug Overdose Morbidity and Mortality in Kentucky, 2000 - 2010
Fatalities by Race
Over the last 11 years, 96% of all drug overdose fatalities were among white Kentucky residents, as seen in the data reported from death certificates (Table 7).
Table 7: Drug overdose fatalities by race, Kentucky residents, 2000 – 2010
Race Year Total
(n) 2000 2001 2002 2003 2004 2005 2006 2007 2008 2009 2010 Black 12 13 10 13 21 20 30 19 17 17 31 203 Other . . * * . 6 * 7 12 17 * 48 White 235 320 424 534 504 595 680 647 718 712 946 6,315
*Counts less than 5 were suppressed by state data management policy.

40 | Drug Overdose Morbidity and Mortality in Kentucky, 2000 - 2010
Fatalities by County The counties with the largest annual fatality rates for drug overdose are mostly located in the eastern region of Kentucky. Figure 47 shows the distribution of drug overdose deaths by county across the state of Kentucky.
Figure 47: Annual average rate of drug overdose deaths among Kentucky residents (per 100,000 population), 2008 - 2010
41 | Drug Overdose Morbidity and Mortality in Kentucky, 2000 - 2010
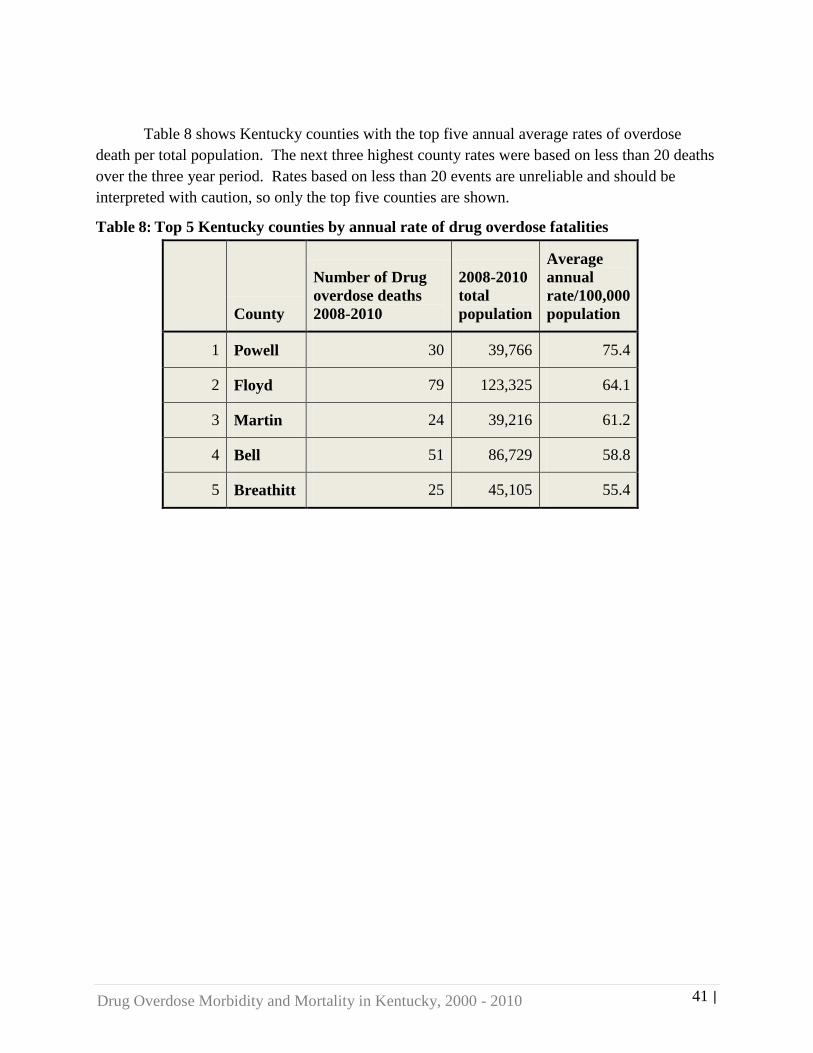
Table 8 shows Kentucky counties with the top five annual average rates of overdose death per total population. The next three highest county rates were based on less than 20 deaths over the three year period. Rates based on less than 20 events are unreliable and should be interpreted with caution, so only the top five counties are shown.
Table 8: Top 5 Kentucky counties by annual rate of drug overdose fatalities
County
Number of Drug overdose deaths 2008-2010
2008-2010 total population
Average annual rate/100,000 population
1 Powell 30 39,766 75.4
2 Floyd 79 123,325 64.1
3 Martin 24 39,216 61.2
4 Bell 51 86,729 58.8
5 Breathitt 25 45,105 55.4

42 | Drug Overdose Morbidity and Mortality in Kentucky, 2000 - 2010
Table 7 lists the 20 counties with the highest number of drug overdose fatalities in Kentucky.
Table 9: Top 20 Kentucky counties by number of total drug overdose deaths
County
Number of drug overdose deaths 2008-2010
1 Jefferson 288
2 Kenton 143
3 Fayette 124
4 Pike 86
5 Floyd 79
6 Boone 72
7 Campbell 67
8 Boyd 62
9 Bell 51
10 Madison 45
11 Jessamine 41
12 Carter 39
13 Knox 39
14 Whitley 39
15 Daviess 39
16 Perry 38
17 Hardin 38
18 Clark 37
19 Johnson 36
20 Harlan 32

43 | Drug Overdose Morbidity and Mortality in Kentucky, 2000 - 2010
Fatalities in the Workplace Sixteen drug overdose deaths were coded as injuries at work for the study period from
2000-2010; there were five fatality cases alone for 2010. While only 16 cases were coded as a fatal injury at work, it should be noted that 2,103 of the 6,566 drug overdose death certificates did not have a completed “injury at work” variable. Therefore, the number is likely to be an underestimate of the true number of worker deaths due to drug overdoses in the workplace (Table 10).
Table 10: Drug overdose deaths in the workplace for Kentuckians, 2000 - 2010, excluding 2007 - 2009
Injury at Work Box Marked on Death Certificate Frequency Percent
Yes 16 0.2
No 4,447 67.7
Not Classifiable 2,103 32.0
Total 6,566 100.0
44 | Drug Overdose Morbidity and Mortality in Kentucky, 2000 - 2010
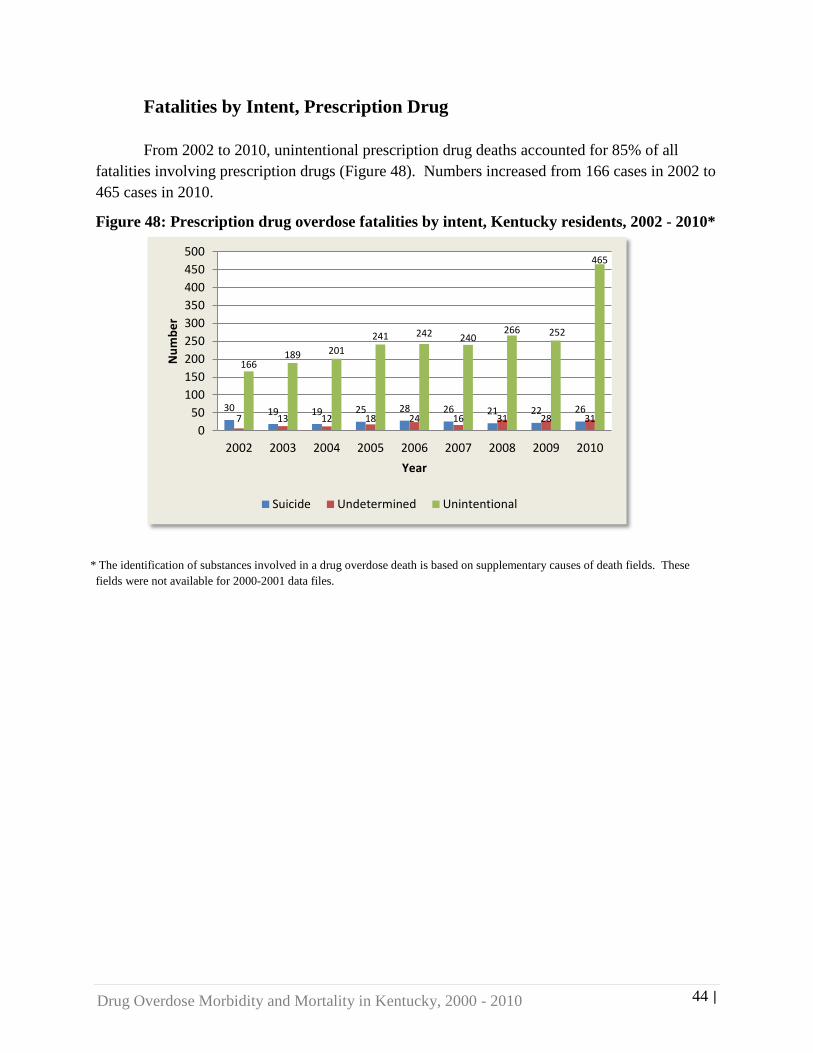
Fatalities by Intent, Prescription Drug
From 2002 to 2010, unintentional prescription drug deaths accounted for 85% of all fatalities involving prescription drugs (Figure 48). Numbers increased from 166 cases in 2002 to 465 cases in 2010.
Figure 48: Prescription drug overdose fatalities by intent, Kentucky residents, 2002 - 2010*
* The identification of substances involved in a drug overdose death is based on supplementary causes of death fields. These fields were not available for 2000-2001 data files.
30 19 19 25 28 26 21 22 26 7 13 12 18 24 16 31 28 31
166 189 201
241 242 240 266 252
465
050
100150200250300350400450500
2002 2003 2004 2005 2006 2007 2008 2009 2010
Num
ber
Year
Suicide Undetermined Unintentional

45 | Drug Overdose Morbidity and Mortality in Kentucky, 2000 - 2010
In 2010, 89% of all drug overdose fatalities involving at least one prescription drug were coded as unintentional overdoses (Figure 49).
Figure 49: Prescription drug overdose fatalities by intent, Kentucky residents, 2010
26 31
465
Number of fatalities
Suicide
Undetermined
Unintentional

46 | Drug Overdose Morbidity and Mortality in Kentucky, 2000 - 2010
Fatalities by Type of Drug The following two figures show the types of drugs involved in Kentucky drug overdose
deaths. Some deaths involve both prescription and illicit drugs and are counted in both categories. In 2010, 522 drug overdose deaths involved prescription drugs. In 2010, opioid pain relievers were reported in 443 prescription drug overdose deaths.
Figure 50: Drug overdose deaths involving prescription and illicit drugs, Kentucky residents, 2002 - 2010 *
* The identification of substances involved in a drug overdose death is based on supplementary causes of death fields. These fields were not
available for 2000-2001 data files. Figure 51: Drug overdose deaths among involving benzodiazepines, opioids and illicit drugs, Kentucky residents, 2002 - 2010 *(For additional data, see Appendix, Table 22)
* The identification of substances involved in a drug overdose death is based on supplementary causes of death fields. These fields were not available for 2000-2001 data files.
204 221 234 284 295 282
318 302
522
36 27 44 63 52 42 42 31 76
0
100
200
300
400
500
600
2002 2003 2004 2005 2006 2007 2008 2009 2010
Num
ber
Prescription drugs Illicit drugs
276
76
149 168 190
239 247 243 262 271
443
0
100
200
300
400
500
2002 2003 2004 2005 2006 2007 2008 2009 2010
Num
ber
Year
Benzodiazepines Illicit drugs Opioids
47 | Drug Overdose Morbidity and Mortality in Kentucky, 2000 - 2010
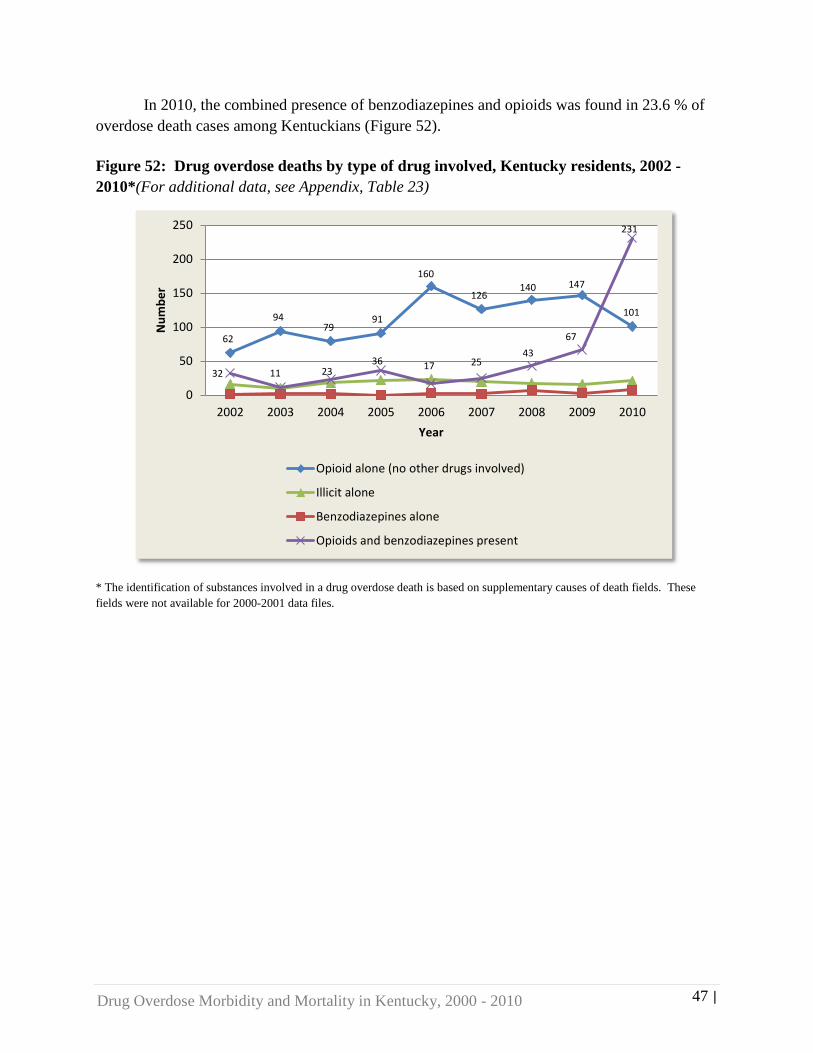
In 2010, the combined presence of benzodiazepines and opioids was found in 23.6 % of overdose death cases among Kentuckians (Figure 52).
Figure 52: Drug overdose deaths by type of drug involved, Kentucky residents, 2002 - 2010*(For additional data, see Appendix, Table 23)
* The identification of substances involved in a drug overdose death is based on supplementary causes of death fields. These fields were not available for 2000-2001 data files.
62
94 79
91
160
126 140 147
101
32 11 23 36 17 25
43 67
231
0
50
100
150
200
250
2002 2003 2004 2005 2006 2007 2008 2009 2010
Num
ber
Year
Opioid alone (no other drugs involved)
Illicit alone
Benzodiazepines alone
Opioids and benzodiazepines present

48 | Drug Overdose Morbidity and Mortality in Kentucky, 2000 - 2010
Conclusions
Analysis of multiple statewide public health injury data sets (emergency department, inpatient hospitalization, and mortality data sets) revealed that drug overdoses are an escalating problem in Kentucky affecting a number of at-risk populations. The use of mortality data alone does not provide a comprehensive understanding of the magnitude of the drug overdose problem, or the identification of further at-risk populations for drug abuse. To get the “big picture”, the analysis of multiple data sets, including emergency department, inpatient hospitalization, and mortality data, is necessary.
Emergency department data analyses showed that the age-adjusted drug overdose emergency department visit rate increased 18% from 2008-2010 resulting in 4,770 ED visits in 2010 alone. Almost half of all drug overdose ED visits were due to unintentional poisonings (47%); females visited the ED more often than men. Approximately 1,300 of the ED patients were transferred to a hospital or facility, 836 were transferred to a psychiatric hospital/unit, and 285 cases were transferred to a cancer center or to hospice care. Of the cancer center/ hospice patients, 70% had visited the ED due to self-harm, compared to 86% of the psychiatric hospital/unit patients who went to the ED due to self-harm. ED visit charges for drug overdoses totaled ten million dollars in 2010; Medicaid and Medicare were billed for approximately $3.9 million dollars. Opiates and related narcotics, and benzodiazepines were each present in approximately 700 ED patients in 2010.
Inpatient hospitalization data analyses revealed that the age-adjusted drug overdose hospitalization rates increased 68% from 2000-2010, with 4,348 drug overdose hospitalizations in 2010 alone. The highest inpatient hospitalization rates were among the 35-44 age group in 2010. Females intending to self-harm had the highest hospitalization rates for drug overdoses. Of the hospitalized patients, 4,066 were transferred to a cancer center or to hospice care, 4,032 were transferred to a psychiatric hospital/unit, and 2,862 were transferred to a hospital or facility. Of the cancer center/ hospice patients, 75% went to the hospital due to self-harm, comparable to 80% of the psychiatric hospital/unit patients who went to the hospital due to self-harm. Hospitalization charges for drug overdoses totaled $68.6 million dollars in 2010; Medicaid and Medicare incurred 57% of the total charges ($39 million dollars). Benzodiazepines were present in approximately 1,335 hospital patients in 2010; opiates and related narcotics were present in 1,043 hospital patients, and 488 patients had both drug categories present.
Death certificate analyses showed that the age-adjusted drug overdose fatality rate increased 282% from 2000-2010 with 979 deaths in 2010 alone; prescription drugs were involved in 522 of the 979 deaths (53%). The 45-54 age group had the highest number of deaths in 2010. Fatality rates were highest among males due to unintentional drug overdoses. Sixteen of the drug overdose deaths occurred in the workplace. Opioid pain relievers were involved in 85% of all prescription drug fatalities (n=443). The highest drug overdose fatality rates were observed in eastern Kentucky; Powell county had the highest drug overdose fatality rate in Kentucky and Jefferson county had the highest number of drug overdose deaths (n=288) for the period 2008-

49 | Drug Overdose Morbidity and Mortality in Kentucky, 2000 - 2010
2010. Opiates and related narcotics were present in 2,212 deaths from 2002-2010; benzodiazepines were present in 605 deaths. Both opiates and benzodiazepines were present in 485 deaths.
The scourge of drug overdoses included 10,097 distinct ED visits, hospital admissions, and deaths in 2010. This unacceptable number needs to be reduced through multiple prevention strategies including increased substance abuse treatment programs, primary prevention programs, prescription drug take-back programs, prescriber vigilance regarding controlled substances, suicide prevention efforts, education, legislation such as HB 1 passed in the Extraordinary Session of the legislature in 2012, and enforcement, among others. Additional support is also needed for families with loved ones who are abusing prescription drugs. The use of only one prevention strategy will not be enough to substantially reduce prescription drug abuse among our residents; it’s going to require multiple strategies. It will take a cooperative effort among Kentucky legislators, doctors, public health advocates, law enforcers, educators and concerned residents – a united Kentucky – to address these alarming facts and create a safer environment for all Kentucky residents.

50 | Drug Overdose Morbidity and Mortality in Kentucky, 2000 - 2010
Acronyms and Glossary
Age-Adjusted Rates---Rates that would have existed if the population under study had the same age distribution as the “standard” population. Age-adjusted rates are calculated using the U.S. 2000 standard population.
Benzodiazepines---A prescription drug class of central nervous system depressants. Includes brand name drugs such as Valium, Xanax, Soma and Klonopin.
CDC---Centers for Disease Control and Prevention.
Diagnosis Code---Standard ICD (International Classification of Diseases) system codes used to classify diseases and health problems. Kentucky hospital discharge and emergency department electronic record systems allow the collection of up to 25 codes.
E-Code---External cause of injury code. Used by hospitals and emergency departments in conjunction with diagnosis codes. E-codes describe the external cause and intent of an injury, for example, whether the injury was self-inflicted or unintentional. The Kentucky hospital discharge and emergency department electronic record systems currently support 3 E-codes.
ED---Emergency Department.
HD---Hospital Discharge.
ICD System—International Classification of Diseases. International standard diagnostic classification for all general epidemiological, many health management purposes and clinical use. It is used to classify diseases and other health problems recorded in many types of health and vital records, including death certificates and health records.
OPRs---Opioid Pain Relievers, sometimes called opioids. A psychoactive prescription drug that binds to opioid receptors in the brain to increase pain tolerance. Includes brand name drugs such as OxyContin, Vicodin, Lortab, Darvon, Roxicet, Percocet, Demerol, Lorcet, Dilaudid and Panacet.
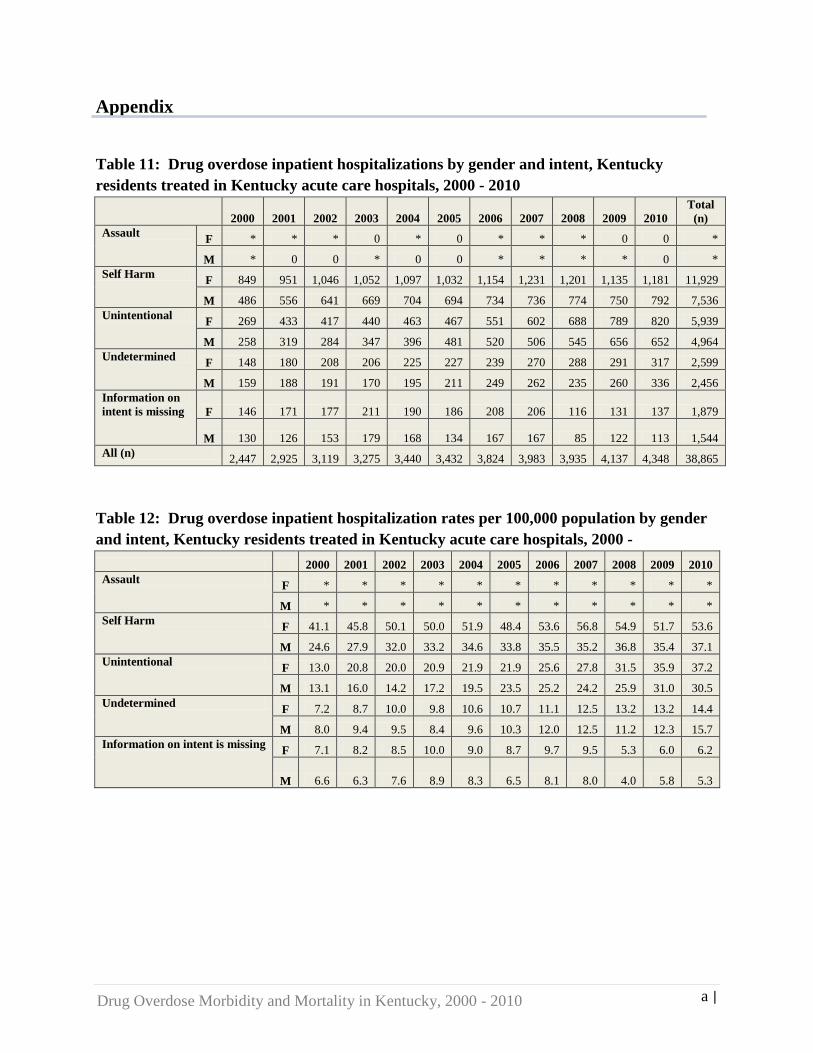
a | Drug Overdose Morbidity and Mortality in Kentucky, 2000 - 2010
Appendix
Table 11: Drug overdose inpatient hospitalizations by gender and intent, Kentucky residents treated in Kentucky acute care hospitals, 2000 - 2010
2000 2001 2002 2003 2004 2005 2006 2007 2008 2009 2010 Total
(n) Assault F * * * 0 * 0 * * * 0 0 *
M * 0 0 * 0 0 * * * * 0 * Self Harm F 849 951 1,046 1,052 1,097 1,032 1,154 1,231 1,201 1,135 1,181 11,929
M 486 556 641 669 704 694 734 736 774 750 792 7,536 Unintentional F 269 433 417 440 463 467 551 602 688 789 820 5,939
M 258 319 284 347 396 481 520 506 545 656 652 4,964 Undetermined F 148 180 208 206 225 227 239 270 288 291 317 2,599
M 159 188 191 170 195 211 249 262 235 260 336 2,456 Information on intent is missing F 146 171 177 211 190 186 208 206 116 131 137 1,879
M 130 126 153 179 168 134 167 167 85 122 113 1,544 All (n) 2,447 2,925 3,119 3,275 3,440 3,432 3,824 3,983 3,935 4,137 4,348 38,865
Table 12: Drug overdose inpatient hospitalization rates per 100,000 population by gender and intent, Kentucky residents treated in Kentucky acute care hospitals, 2000 -
2000 2001 2002 2003 2004 2005 2006 2007 2008 2009 2010 Assault F * * * * * * * * * * *
M * * * * * * * * * * * Self Harm F 41.1 45.8 50.1 50.0 51.9 48.4 53.6 56.8 54.9 51.7 53.6
M 24.6 27.9 32.0 33.2 34.6 33.8 35.5 35.2 36.8 35.4 37.1 Unintentional F 13.0 20.8 20.0 20.9 21.9 21.9 25.6 27.8 31.5 35.9 37.2
M 13.1 16.0 14.2 17.2 19.5 23.5 25.2 24.2 25.9 31.0 30.5 Undetermined F 7.2 8.7 10.0 9.8 10.6 10.7 11.1 12.5 13.2 13.2 14.4
M 8.0 9.4 9.5 8.4 9.6 10.3 12.0 12.5 11.2 12.3 15.7 Information on intent is missing F 7.1 8.2 8.5 10.0 9.0 8.7 9.7 9.5 5.3 6.0 6.2
M 6.6 6.3 7.6 8.9 8.3 6.5 8.1 8.0 4.0 5.8 5.3

b | Drug Overdose Morbidity and Mortality in Kentucky, 2000 - 2010
Table13: Drug overdose inpatient hospitalizations by age group, Kentucky residents treated in Kentucky acute care hospitals, 2000 - 2010
Age Group 2000 2001 2002 2003 2004 2005 2006 2007 2008 2009 2010
Total (n)
15-24 494 587 581 629 647 595 667 639 568 584 573 6,564
25-34 523 623 676 708 755 758 827 801 787 748 847 8,053
35-44 589 757 769 819 830 814 867 979 877 934 964 9,199
45-54 363 418 476 533 607 607 731 778 852 919 965 7,249
55-64 150 177 214 236 234 283 318 362 379 463 475 3,291
Table 14: Drug overdose inpatient hospitalization rates per 100,000 population by age group, Kentucky residents treated in Kentucky acute care hospitals, 2000 - 2010
Age Group 2000 2001 2002 2003 2004 2005 2006 2007 2008 2009 2010
15-24yr 86.1 101.5 100.3 108.5 111.6 103.0 119.2 114.2 102.2 99.1 97.7
25-34 92.2 110.9 120.6 125.6 132.9 132.7 141.4 136.2 134.1 129.1 149.6
35-44 91.6 118.3 121.8 130.9 133.6 131.9 142.7 162.4 147.9 160.2 167.2
45-54 64.7 72.2 81.5 89.6 100.3 98.7 118.0 124.4 134.8 144.7 150.1
55-64 40.1 46.4 53.1 56.0 53.3 62.0 67.2 74.2 75.4 89.8 88.1

c | Drug Overdose Morbidity and Mortality in Kentucky, 2000 - 2010
Table 15: Drug overdose inpatient hospitalization charges, Kentucky residents treated in Kentucky acute care hospitals, 2010
Self Pay $10,080,783
Workers Compensation $6,397
Medicare $20,779,203
Medicaid $18,741,534
Commercial $13,456,620
CHAMPUS $931,034
Other $536,189
Charity $4,040,607
Total $68,572,368

d | Drug Overdose Morbidity and Mortality in Kentucky, 2000 - 2010
Table 16: Drug overdose fatalities by intent, Kentucky residents, 2000 - 2010
2000 2001 2002 2003 2004 2005 2006 2007 2008 2009 2010
All (n)
Suicide 33 48 59 45 46 47 65 67 60 56 55 581
Undetermined 9 25 20 33 34 41 54 60 67 78 67 488
Unintentional 205 260 355 470 443 533 590 546 620 612 857 5,491
Table 17: Drug overdose fatality rates per 100,000 population by intent, Kentucky residents, 2000 - 2010
2000 2001 2002 2003 2004 2005 2006 2007 2008 2009 2010
Suicide 0.8 1.2 1.4 1.1 1.1 1.1 1.5 1.6 1.4 1.3 1.3
Undetermined 0.2 0.6 0.5 0.8 0.8 1 1.3 1.4 1.6 1.8 1.5
Unintentional 5.1 6.4 8.7 11.4 10.7 12.7 14.0 12.8 14.5 14.2 19.7
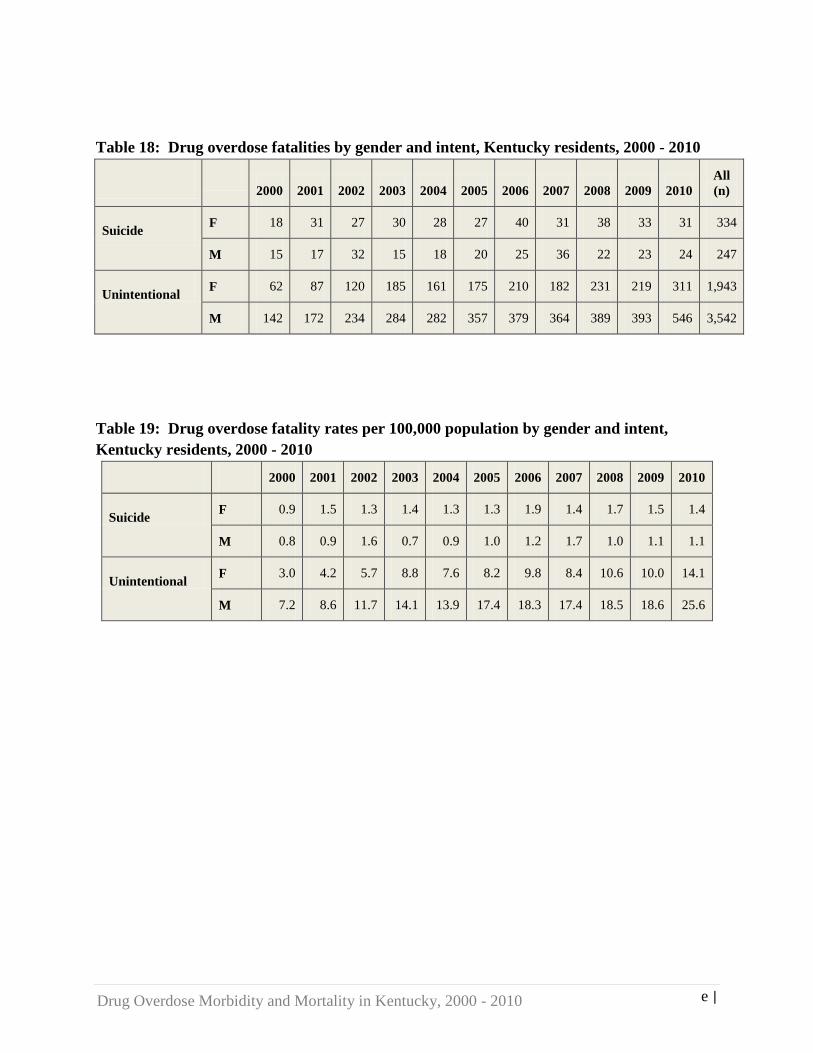
e | Drug Overdose Morbidity and Mortality in Kentucky, 2000 - 2010
Table 18: Drug overdose fatalities by gender and intent, Kentucky residents, 2000 - 2010
2000 2001 2002 2003 2004 2005 2006 2007 2008 2009 2010
All (n)
Suicide F 18 31 27 30 28 27 40 31 38 33 31 334
M 15 17 32 15 18 20 25 36 22 23 24 247
Unintentional F 62 87 120 185 161 175 210 182 231 219 311 1,943
M 142 172 234 284 282 357 379 364 389 393 546 3,542
Table 19: Drug overdose fatality rates per 100,000 population by gender and intent, Kentucky residents, 2000 - 2010
2000 2001 2002 2003 2004 2005 2006 2007 2008 2009 2010
Suicide F 0.9 1.5 1.3 1.4 1.3 1.3 1.9 1.4 1.7 1.5 1.4
M 0.8 0.9 1.6 0.7 0.9 1.0 1.2 1.7 1.0 1.1 1.1
Unintentional F 3.0 4.2 5.7 8.8 7.6 8.2 9.8 8.4 10.6 10.0 14.1
M 7.2 8.6 11.7 14.1 13.9 17.4 18.3 17.4 18.5 18.6 25.6

f | Drug Overdose Morbidity and Mortality in Kentucky, 2000 - 2010
Table 20: Drug overdose fatalities by age group, Kentucky residents, 2000 - 2010
Age 2000 2001 2002 2003 2004 2005 2006 2007 2008 2009 2010 Total
(n)
15-24 34 36 44 68 63 69 77 69 57 55 65 637
25-34 53 74 100 106 117 144 188 166 172 153 213 1,486
35-44 83 135 162 181 165 186 196 176 203 201 272 1,960
45-54 52 67 85 136 131 170 162 177 229 243 293 1,745
55-64 13 15 26 39 22 36 52 58 55 70 99 485
Table 21: Drug overdose fatality rates per 100,000 population by age group, Kentucky residents, 2000 - 2010
Age 2000 2001 2002 2003 2004 2005 2006 2007 2008 2009 2010
15-24 5.9 6.2 7.6 11.7 10.9 12.0 13.8 12.3 10.3 9.3 11.1
25-34 9.3 13.2 17.8 18.8 20.6 25.2 32.1 28.2 29.3 26.4 37.6
35-44 12.9 21.1 25.7 28.9 26.6 30.1 32.3 29.2 34.2 34.5 47.2
45-54 9.3 11.6 14.6 22.9 21.7 27.7 26.2 28.3 36.2 38.3 45.6
55-64 3.5 3.9 6.4 9.3 5.0 7.9 11.0 11.9 10.9 13.6 18.4

g | Drug Overdose Morbidity and Mortality in Kentucky, 2000 - 2010
Table 22: Drug overdose deaths involving benzodiazepines, opioids and illicit drugs, Kentucky residents, 2002 - 2010
Contributing Causes 2002 2003 2004 2005 2006 2007 2008 2009 2010 All (n)
Prescription drugs - opioid pain relievers 149 168 190 239 247 243 262 271 443 2,212
Prescription drugs - Benzodiazepines 44 19 31 41 23 33 54 84 276 605
Illicit drugs 36 27 44 63 52 42 42 31 76 413
Table 23: Drug overdose deaths by type of drug involved, Kentucky residents 2002 - 2010
Contributing Causes 2002 2003 2004 2005 2006 2007 2008 2009 2010 All (n)
Opioids alone (no other drugs involved) 62 94 79 91 160 126 140 147 101 1,000
Benzodiazepines alone * * * 0 * * 7 * 8 28
Illicit alone 16 10 18 22 23 20 17 16 21 163
Opioids and benzodiazepines present 32 11 23 36 17 25 43 67 231 485