Drug Offenses: Trends and Offenders
18
1 | Page Drug Offenses 11-5-14 Briefing Report Drug Offenses: Trends and Offenders (November 5, 2014) Prepared by: Michael Baglivio, Ph.D. DJJ Research and Planning Issue: To date there is limited knowledge of the latest trends in official juvenile drug offending and how juvenile drug offenders differ from other juvenile offenders arrested in Florida. The basic questions are: “What percent of juvenile arrests are drug offenses?” and “How do drug offenders differ from offenders without drug charges?” Highlighted Results: The following bullets provide a brief synopsis of the analyses. Methodology, comprehensive results, and detailed explanations follow below the bullets: 10.6% of all arrests within the five year period were for drug offenses, with 3.1% of all arrests being felony drug offenses and 7.5% being misdemeanor drug offenses; Misdemeanor offenses are 71% of all drug arrests, with marijuana possession not over 20 grams being the most prevalent drug offense charge at 61% of all drug arrests; Overall, the percent of all arrests that are misdemeanor and felony drug offenses have both fluctuated less than 1% over the entire five year period meaning the rates are substantively stable; The vast majority of arrests of both males and females are for non-drug offenses; The proportion for males arrested for drug offenses is two times the rate for females, with 12% of all male arrests being for drug offenses compared to 6% of all female arrests; For individual males arrested, 25% were for drug offenses, compared to 10% of the individual females arrested. Over 70% of the arrests where a drug offense was the most serious charge were arrests of low risk youth; Only 6.2% of the arrests of Serious, Violent, and Chronic (SVC) offenders are for drug offenses and only 6.7% of the arrests for drug offenses were of an SVC offender; Drug offenders were 1.5 times more likely to self-report past alcohol use and 220% more likely to report past drug use; For males, drug offenders had lower trauma/abuse histories, while female youth arrested for drug offenses had higher trauma/abuse histories than female non-drug offending youth. The prevalence of sexual abuse history among female drug offenders is 13 times (1,300% higher) the prevalence for male drug offenders.
Transcript of Drug Offenses: Trends and Offenders

1 | P a g e D r u g O f f e n s e s
11-5-14
Briefing Report Drug Offenses: Trends and Offenders (November 5, 2014)
Prepared by: Michael Baglivio, Ph.D. DJJ Research and Planning
Issue:
To date there is limited knowledge of the latest trends in official juvenile drug offending and how juvenile drug offenders differ from other juvenile offenders arrested in Florida. The basic questions are: “What percent of juvenile arrests are drug offenses?” and “How do drug offenders differ from offenders without drug charges?”
Highlighted Results:
The following bullets provide a brief synopsis of the analyses. Methodology, comprehensive results, and detailed explanations follow below the bullets:
10.6% of all arrests within the five year period were for drug offenses, with 3.1% of all arrestsbeing felony drug offenses and 7.5% being misdemeanor drug offenses;
Misdemeanor offenses are 71% of all drug arrests, with marijuana possession not over 20grams being the most prevalent drug offense charge at 61% of all drug arrests;
Overall, the percent of all arrests that are misdemeanor and felony drug offenses have bothfluctuated less than 1% over the entire five year period meaning the rates are substantivelystable;
The vast majority of arrests of both males and females are for non-drug offenses;
The proportion for males arrested for drug offenses is two times the rate for females, with12% of all male arrests being for drug offenses compared to 6% of all female arrests;
For individual males arrested, 25% were for drug offenses, compared to 10% of the individualfemales arrested.
Over 70% of the arrests where a drug offense was the most serious charge were arrests oflow risk youth;
Only 6.2% of the arrests of Serious, Violent, and Chronic (SVC) offenders are for drug offensesand only 6.7% of the arrests for drug offenses were of an SVC offender;
Drug offenders were 1.5 times more likely to self-report past alcohol use and 220% morelikely to report past drug use;
For males, drug offenders had lower trauma/abuse histories, while female youth arrested fordrug offenses had higher trauma/abuse histories than female non-drug offending youth. Theprevalence of sexual abuse history among female drug offenders is 13 times (1,300% higher)the prevalence for male drug offenders.

2 | P a g e D r u g O f f e n s e s
11-5-14
Methodology: We examine data from July 1, 2008 through June 30, 2013, which encompasses the most recent five fiscal years. Every referral received by the FDJJ that was non-administrative was included. Contempt of court, non-criminal infractions, pick-up orders, interstate compacts (transfers from other states), re-opened cases, transfers between counties, court ordered detention orders, and administrative “referrals” were excluded. Violations of probation were retained/included in the analysis. The current study used these arrest data for fiscal year 2008-09 (FY 08-09) to fiscal year 2012-13 (FY 12-13), and matched them to the corresponding C-PACT assessment closest to the date of the referral (arrest). The C-PACT assessment captures the youth’s overall risk to re-offend and rank orders the youth’s top risk factors. The C-PACT assessment has been validated across multiple samples of Florida DJJ youth, published in multiple peer-reviewed journals and independent research agency reports (Baglivio, 2009; Baglivio & Jackowski, 2013; Winokur-Early, Hand, & Blankenship, 2012). The closest C-PACT assessment to the arrest date was used in order to capture the youth’s risk to re-offend level at time of arrest. This process resulted in a final sample of 449,267 referrals/arrests of 190,562 individual youth (many youth were arrested multiple times during the five year period). These arrest numbers may not match those reported elsewhere due to the exclusion of administrative referrals and the necessitation of an available C-PACT assessment. Each arrest was classified as to whether the most serious charge of the referral was a drug offense or not. Both felony and misdemeanor drug offenses were included; with the only criteria being the drug charge must have been the most serious of the arrest. Charges were further examined as to whether the charge was a possession charge, a selling/trafficking/distribution/manufacturing charge, or a “miscellaneous” drug charge not falling into one of the other two categories. This briefing outlines the latest five year trend in drug offense arrests, and compares youth arrested for drug offenses to other juvenile offenders on a myriad of risk/need factors as assessed by the validated C-PACT.
Comprehensive Results: Drug Offenses- The number of arrests for drug offenses has declined each year over the five year period. This holds true for overall drug arrests, as well as both misdemeanor and felony arrests (see Table 1). Table 1. Drug Offenses per Year Over a Five Year Period
FY08-09 FY09-10 FY10-11 FY11-12 FY12-13 Total
Misdemeanor Drug Offenses 7,660 7,412 6,920 6,317 5,603 33,912
Felony Drug Offenses 3,942 3,332 2,627 2,137 1,878 13,916
All Drug Offenses 11,602 10,744 9,547 8,454 7,481 47,828

3 | P a g e D r u g O f f e n s e s
11-5-14
However, the number of juvenile arrests in general has also been declining over this period. Therefore, it is informative to examine the prevalence of arrests for drug offenses as a percent of all arrests over the five year period. These proportions are reported in Table 2 and further illustrated in Figure 1. Table 2. Drug Offenses as Proportion of Total Arrests Over Five Years
FY08-09 FY09-10 FY10-11 FY11-12 FY12-13 Total N
Felony Drug Offenses 3.5% 3.4% 3.0% 2.7% 2.7% 3.1% 13,916
Misdemeanor Drug Offenses 6.8% 7.5% 7.8% 8.0% 8.0% 7.5% 33,912
All Drug Offenses 10.3% 10.9% 10.7% 10.7% 10.7% 10.6% 47,828
The total number of arrests over the five year period for each category is indicated in the far right column (labeled as “N”) to provide context. The total proportion of all arrests that were drug offenses over the five year period is indicated in the column labeled “Total”. Over the five fiscal years examined, drug offenses accounted for 10.6% of the arrests (or 47,828 arrests), with 3.1% of all arrests being felony drug offenses and 7.5% of all arrests being misdemeanor drug offenses. As indicated in Table 2 and Figure 1, the percent of arrests for drug offenses was the lowest in FY 08-09, peaked in FY 09-10 and has remained stable the last three fiscal years (FY 10-11 through FY 12-13). One-way ANOVA indicate the rate in FY 08-09 was significantly lower than FY 09-10 (p<.05). The next four years (FY 09-10 through FY 12-13) are statistically equivalent. Figure 1. Five Year Trend in Arrests for Drug Offenses
Examining offenses by severity, we see the percent of all arrests that are for felony drug offenses have declined the first four years and remained stable the last two years, while the percent of arrests for misdemeanor drug offenses increased from 6.8% in FY 08-09 to 8% for the most recent two years
0%
2%
4%
6%
8%
10%
12%
FY08-09 FY09-10 FY10-11 FY11-12 FY12-13
Proportion of All Arrests That Are Drug Offenses
All Drug Offenses Felony Drug Offenses
Misdemeanor Drug Offenses
4 | P a g e D r u g O f f e n s e s
11-5-14
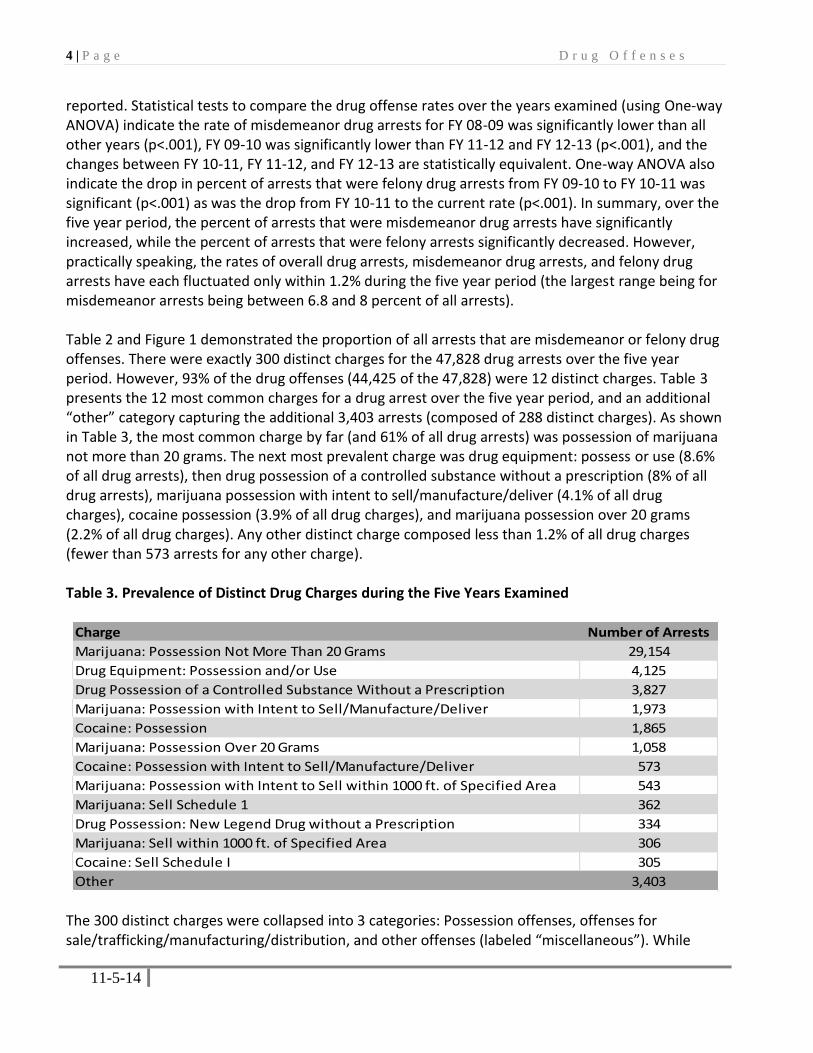
reported. Statistical tests to compare the drug offense rates over the years examined (using One-way ANOVA) indicate the rate of misdemeanor drug arrests for FY 08-09 was significantly lower than all other years (p<.001), FY 09-10 was significantly lower than FY 11-12 and FY 12-13 (p<.001), and the changes between FY 10-11, FY 11-12, and FY 12-13 are statistically equivalent. One-way ANOVA also indicate the drop in percent of arrests that were felony drug arrests from FY 09-10 to FY 10-11 was significant (p<.001) as was the drop from FY 10-11 to the current rate (p<.001). In summary, over the five year period, the percent of arrests that were misdemeanor drug arrests have significantly increased, while the percent of arrests that were felony arrests significantly decreased. However, practically speaking, the rates of overall drug arrests, misdemeanor drug arrests, and felony drug arrests have each fluctuated only within 1.2% during the five year period (the largest range being for misdemeanor arrests being between 6.8 and 8 percent of all arrests). Table 2 and Figure 1 demonstrated the proportion of all arrests that are misdemeanor or felony drug offenses. There were exactly 300 distinct charges for the 47,828 drug arrests over the five year period. However, 93% of the drug offenses (44,425 of the 47,828) were 12 distinct charges. Table 3 presents the 12 most common charges for a drug arrest over the five year period, and an additional “other” category capturing the additional 3,403 arrests (composed of 288 distinct charges). As shown in Table 3, the most common charge by far (and 61% of all drug arrests) was possession of marijuana not more than 20 grams. The next most prevalent charge was drug equipment: possess or use (8.6% of all drug arrests), then drug possession of a controlled substance without a prescription (8% of all drug arrests), marijuana possession with intent to sell/manufacture/deliver (4.1% of all drug charges), cocaine possession (3.9% of all drug charges), and marijuana possession over 20 grams (2.2% of all drug charges). Any other distinct charge composed less than 1.2% of all drug charges (fewer than 573 arrests for any other charge). Table 3. Prevalence of Distinct Drug Charges during the Five Years Examined
The 300 distinct charges were collapsed into 3 categories: Possession offenses, offenses for sale/trafficking/manufacturing/distribution, and other offenses (labeled “miscellaneous”). While
Charge Number of Arrests
Marijuana: Possession Not More Than 20 Grams 29,154
Drug Equipment: Possession and/or Use 4,125
Drug Possession of a Controlled Substance Without a Prescription 3,827
Marijuana: Possession with Intent to Sell/Manufacture/Deliver 1,973
Cocaine: Possession 1,865
Marijuana: Possession Over 20 Grams 1,058
Cocaine: Possession with Intent to Sell/Manufacture/Deliver 573
Marijuana: Possession with Intent to Sell within 1000 ft. of Specified Area 543
Marijuana: Sell Schedule 1 362
Drug Possession: New Legend Drug without a Prescription 334
Marijuana: Sell within 1000 ft. of Specified Area 306
Cocaine: Sell Schedule I 305
Other 3,403

5 | P a g e D r u g O f f e n s e s
11-5-14
most charges fit obviously into one of the three categories, several charges are more vague and indicate the possibility of possession or sale. For example, charges for different substances have “possess or witness sell” in the charge description. In each of these instances, the charge was classified as a possession charge rather than a sale charge. While this process may inflate the percent of charges classified as possession, trends are still informative, as the same strategy is used across each of the five years examined. Table 4 and Figure 2 show the percent of drug offenses that were for possession, sale/trafficking/manufacture/distribution, or were “miscellaneous”. There were only 15 arrests for offenses classified as “miscellaneous” over the entire period examined (see note 1 at the end of this brief for a breakdown of those 15 arrests and their 8 distinct charges). Table 4. Type of Drug Offense as Proportion of Total Drug Arrests Over Five Years
FY08-09 FY09-10 FY10-11 FY11-12 FY12-13 Total N
Possession Offenses 86.6% 87.8% 88.7% 89.6% 89.6% 88.3% 42,230
Sale/Traffic/Manufacture Offenses 13.4% 12.2% 11.3% 10.3% 10.3% 11.7% 5,579
Miscellaneous Drug Offenses 0.0% 0.1% 0.0% 0.0% 0.0% 0.0% 19
As shown in Table 4, possession offenses compose over 85% of drug arrests for each fiscal year. Over the five year period, possession offenses composed 88% of all drug arrests with more serious selling/trafficking/manufacturing/distributing composing fewer than 12% of the drug arrests (see also Figure 2). Figure 2 reports only possession and sale charges as the “miscellaneous” category encompassed less than 1% of all drug arrests. Figure 2.
88%
12%
Drug Offenses by Type
Possession Offense Sale/Traffic/Maufacture/Distribute Offense

6 | P a g e D r u g O f f e n s e s
11-5-14
As shown above in Table 1, 47,828 arrests for drug offenses were made during the five years examined. Figure 3 illustrates the proportion of drug offenses, non-drug offenses, and all offenses that were committed by males and females. As shown, males were responsible for 75.2% of all arrests over the five year period. Males were 73.9% of the non-drug offense arrests, and 86.1% of the drug offense arrests. The proportion of arrests of males for drug offenses is significantly higher than the proportion of females arrested for drug offenses (p<.001; Cohen’s d=.54 indicating a moderate effect size). Figure 3 demonstrates males are disproportionately responsible for drug offenses. Figure 3.
Figure 4.
Figure 4 presents gender differences in drug offending in a slightly different way. Of all the female juvenile arrests, 6% were for a drug offense. In comparison, of all the male juvenile arrests, 12.2%
Not A Drug Offense Drug Offense All Offenses
26.1%
13.9%24.8%
73.9%
86.1%75.2%
Proportion of Arrests by Gender
Female Male
Not A Drug Offense
Drug Offense
94.0%
6.0%
87.8%
12.2%
Gender Differences in Drug Offending
Male Female

7 | P a g e D r u g O f f e n s e s
11-5-14
were for a drug offense. While the vast majority of arrests of both males and females are for non-drug offenses, the proportion of arrests that are for drug offenses for males is two times the rate for females. Similar to analyses by gender, the proportion of arrests of each race/ethnicity for drug offenses is examined in Figure 5. As shown, for example, 13.8% of the arrests of a White juvenile offender were for a drug offense. One-way ANOVA examined whether these proportions differed between race/ethnic subgroups (all significant differences reported are at p<.001). Results show the White proportion of arrests for drug offenses is significantly higher than the Black and the Hispanic proportions. The proportion of all arrests that were drug offenses by youth classified as “Other” is significantly higher than the White, the Black, and the Hispanic proportions (though these youth composed less than 0.5% of all arrests and less than 1% of all drug arrests). The group classified as “Unknown” is statistically equivalent to all other race/ethnic subgroups’ drug arrest proportions (of note, the “Unknown” category classified only 15 youth). The proportion for Black youth is lower than the White and Hispanic proportions, and the Hispanic proportion is lower than the White and the “Other” proportions. To “rank” the proportions by race/ethnicity, one could state that “Other” youth have the highest proportion of all of their arrests being for drug offenses, followed by Whites, then Hispanics, with Blacks having the lowest proportion of their arrests being for drug offenses. Figure 5.
Alternatively, we examined the proportion of each type of arrest (non-drug offense and drug offense) that was composed of each race/ethnic subgroup. Figure 6 shows White youth compose 37.3% of all the arrests over the five year period, yet make up 36% of the non-drug offense arrests and over 48% of the drug offense arrests. This demonstrates White youth are arrested for a disproportionate share of drug offenses, relative to their percent of the arrested population. In contrast, Black youth are under-represented in drug offending, based on their percent of the arrested population, being 47.5%
Total
Unknown
Other
Hispanic
Black
White
89.4%
93.3%
84.1%
86.8%
92.7%
86.2%
10.6%
6.7%
15.9%
13.2%
7.3%
13.8%
Race/Ethnicity Differences in Drug Offending
Drug Offense Not A Drug Offense

8 | P a g e D r u g O f f e n s e s
11-5-14
of all the arrests and only 32.7% of the drug offense arrests. Hispanic youth more closely follow the results of the White youth being overrepresented relative to their percent of the arrested population (14.6% of all arrests and 18.2% of drug offense arrests). Figure 6.
Figure 7.
One avenue to examine whether youth arrested for drug offenses are some of the more serious youthful offenders is to examine the percent of arrests for which the youth was a Serious, Violent, and Chronic (SVC) offender. SVC offenders are 8.3% of all the individual youth arrested during the five year period, and were responsible for 11.5% of all of the arrests over this time. Figure 7 shows the proportion of non-drug arrests, all drug arrests, possession arrests, sale/trafficking arrests, and all
Not A Drug Offense Drug Offense All Offenses
36.0%
48.3%
37.3%
49.3%
32.7%
47.5%
14.2%18.2% 14.6%
Proportion of Arrests by Race/Ethnicity
White Black Hispanic
Not A DrugOffense
DrugOffense
Possession Sell/Traffic All Offenses
87.9% 93.3% 93.7% 90.2% 88.5%
12.1% 6.7% 6.3% 9.8% 11.5%
Serious, Violent, & Chronic Proportion of Arrests
Not SVC SVC

9 | P a g e D r u g O f f e n s e s
11-5-14
arrests for which an SVC offender was responsible over the five year period examined. For discussion of the prevalence of SVC offenders and their proportion of all offenses, see prior briefing sheets at http://www.djj.state.fl.us/research/fast-facts/delinquency-briefings and Baglivio, Jackowski, Greenwald, and Howell (2014). As discussed and as shown in Figure 7, 11.5% of all arrests over the five years were of youth classified as SVC offenders (far right column in Figure 7). Of all arrests for drug offenses over the five years, only 6.7% were of an SVC offender. 6.3% of the arrests for possession were of an SVC offender, compared to 9.8% of the arrests for sales/trafficking/manufacturing/distribution charges (meaning SVC offenders are over 1.5 times more likely to get arrested for selling drugs than possession of drugs). Figure 7 also shows that youth getting arrested for drug offenses (possession or sale/trafficking) are overwhelmingly not SVC offenders. In fact, SVC offenders make up less of this group than they do for a myriad of other offenses (SVC youth are 12.1% of non-drug offenses). Only 6.2% of the arrests of SVC offenders have a drug offense as the most serious charge (result not shown). If one were interested in targeting SVC offenders, examining drug offenses would not be the most fruitful approach. Figure 8.
A second method to examine the seriousness of youth arrested for drug offenses is examination of the overall risk to re-offend level as assessed by the validated C-PACT. Figure 8 illustrates the proportion of low, moderate, moderate-high, and high risk offender arrests for drug offenses. As shown, low risk youth composed 59.4% of all arrests and 71.2% of the arrests for drug offenses. In contrast, high risk youth composed 11.2% of all arrests, and only 7.1% of those arrested for drug offenses. One-way ANOVA indicate low risk youth have a significantly higher proportion of their arrests being drug offenses than all other risk levels of youth. Moderate risk youth have higher proportions of their arrests being from drug offenses than mod-high and high risk youth. The proportion of arrests for drug offenses for mod-high risk youth and for high risk youth are statistically equivalent. Furthermore, independent samples t-tests indicate the mean risk score for arrests of
0%
10%
20%
30%
40%
50%
60%
70%
80%
Low Moderate Mod-High High
Proportion of Arrests By Risk Level and Crime Type
Not A Drug Offense
Drug Offense
Total

10 | P a g e D r u g O f f e n s e s
11-5-14
non-drug offenses is significantly higher than that of those arrested for drug offenses (p<.001; Cohen’s d=.48 indicating an approximately moderate effect size). These results, in conjunction with those shown for SVC offenders illustrate the vast majority of drug-related arrests involve lower risk youth.
Drug Offenders- Up to this point, this brief has examined the 47,828 arrests for drug offenses in comparison to the 401,439 arrests for non-drug offenses. Analyses now switch to the individual youth responsible for these offenses. As mentioned in the methods section above, the 449,267 arrests were of 190,562 individual youth over the five year period. There were 39,256 individual youth arrested for a drug offense during this period. This brief now examines how these 39,256 youth differ from the 151,306 arrested youth not arrested for a drug offense. First, self-reported peer association of drug offenders and non-drug offenders was examined. Figure 9 shows youth arrested for drug offenses are more likely to report having antisocial peers and more likely to report associating with or having been a gang member/associate. Drug offenders are 1.36 times more likely to self-report having been or associating with a gang member/associate. Though independent samples t-tests confirm both these differences are significant, the effect size for having antisocial peers (Cohen’s d=.39) is small to moderate but for gang affiliation is very small (Cohen’s d=.08 gang affiliation). This indicates drug offenders may be more likely to have had antisocial friends than non-drug offenders, but the result of differences in gang association should be interpreted with caution. Though the difference in gang association is statistically significant, it does not have any real-world substantive value based on the small effect size found. Figure 9.
Gang Affiliation
Antisocial Peers
2.5%
65.1%
3.4%
77.4%
Self-Reported Peer Association by Offense Type
Drug Offender Non-Drug Offender

11 | P a g e D r u g O f f e n s e s
11-5-14
Self-reported past use of alcohol and past use of drugs was examined between drug offenders and non-drug offenders (see Figure 10). 42.6% of the full sample of 190,562 youth reported past drug use and 29.7% reported past alcohol use. As expected, the two offender groups (drug and non-drug) differed on both substance use measures with drug offenders 1.5 times more likely to report past alcohol use and 2.2 times more likely to report past drug use. Independent samples t-tests confirm these differences both significant (both at p<.001) with effect size approaching moderate (Cohen’s d=.45) for past alcohol use and large effect size (Cohen’s d=1.31) for past drug use. These effects are substantive and meaningful. Figure 10.
In the first documented analysis of Serious, Violent, and Chronic (SVC) offenders, Snyder (1998) identified that SVC offenders were much more likely to begin offending at young ages. Studies have since shown this relationship holds regardless of race and gender (Loeber, Farrington, and Petechuk, 2003) and have demonstrated early onset offenders have a two to three times higher risk of later violence, serious offenses, chronic offending, are more likely to carry weapons, become gang members, and engage in substance use (Howell, 2009, 2012; Krohn, Thornberry, Rivera, and Le Blanc, 2001; Loeber & Farrington, 2001; Loeber et al., 2003). Research on risk factors predictive of offending behavior has identified a history of antisocial behavior evident from a young age, in a variety of settings, and involving a variety of different acts, as one of the four strongest predictors of offending (Andrews & Bonta, 2003) and has documented the correlation between early age of onset of offending behavior and higher levels of frequency and seriousness of crime (DeLisi & Piquero, 2011; Loeber & Farrington, 1998). In light of these criminological truths, age of onset was examined comparing the age of first arrest of drug offenders and non-drug offenders in the current sample. Early age of onset is typically referenced in criminological research as twelve years old or younger at the time of first offense. Specifically, the proportion of drug offenders and non-drug offenders that were 12 years old or
Past Alcohol Use
Past Drug Use
26.7%
33.9%
41.3%
75.9%
Self-Reported Past Substance Use by Offense Type
Drug Offender Non-Drug Offender

12 | P a g e D r u g O f f e n s e s
11-5-14
younger at the age they were first arrested is examined. Results show a slightly larger proportion of non-drug offenders were twelve or under at age at first arrest than drug offenders (18.4% compared to 15.5% for drug offenders). Independent samples t-tests confirm this difference to be statistically significant (p<.001), though the effect size is small (Cohen’s d=.11) and not likely to be substantively meaningful. Next, the youth’s current school enrollment status was examined, comparing enrollment in the most recent school term (at time of assessment closest to the arrest) between drug and non-drug offenders. Figure 11 illustrates a slightly higher proportion (by 1%) of drug offenders have graduated or earned a GED, yet a much lower percentage (by 7.9%) were enrolled full time. A slightly larger percentage (by 0.6%) of drug offenders were enrolled part time, over twice the proportion of drug offenders was suspended, and a larger proportion (by 3.3%) were expelled or dropped out. Independent samples t-tests confirm the difference in average enrollment status is significant with drug offenders having more negative enrollment status (part time, suspended, expelled or dropped out) than non-drug offenders (p<.001), though the effect size again is small (Cohen’s d=.19). Figure 11.
Academic performance, in the form of grades during the most recent school term, was available for over 80% of the sample (most missing data is due to youth having been expelled or dropped out). Figure 12 compares youth arrested for a drug offense with youth arrested for non-drug offenses in terms of their school grades. As shown, there is 4.4% more missing data for drug offenders, though, as shown in Figure 11, more of these youth have been expelled, dropped out, or suspended. A larger proportion of drug offenders have Grade Point Averages (GPA) below 1.0, and between 1.0 and 2.0. Non-drug offenders earn higher grades from GPA over 2.0, to over 3.0, and being over 1.5 times more likely to earn mostly A’s. Examining youth with available grades found those with mostly A’s and those with GPA above 3.0 were significantly less likely to be drug offenders. In contrast, at every step lower in GPA (2.0 to 3.0, 1.0 to 2.0, below 1.0) youth become more and more likely to be drug
Graduated/GED
Enrolled Full Time
Enrolled Part Time
Suspended
Dropped Out/Expelled
3.3%
80.6%
2.1%
2.5%
11.4%
4.3%
72.7%
2.7%
5.6%
14.7%
Current School Enrollement by Offender Type
Drug Offender Non-Drug Offender

13 | P a g e D r u g O f f e n s e s
11-5-14
offenders. 15% of those youth who were honor’s students (mostly A’s) were drug offenders, compared to 25% of those whose GPA’s were below 1.0 (t=15.7; p<.001). Figure 12.
Figure 13.
Drug offenders are also more likely to have attendance issues in school. Examining the proportion of youth that have over 15 unexcused absences in a 90 day period (defined as “Habitual Truancy” in Florida Statute; f.s. 1003.27) shows a slightly higher proportion of drug offenders to be habitual truants (see Figure 13). This difference in habitual truancy is statistically significant (p<.001) though the effect size is very small (Cohen’s d=.08). There is only a 1.2% difference between drug and non-
Mostly A's
GPA Above 3.0
GPA 2.0 to 3.0
GPA 1.0 to 2.0
GPA Below 1.0
No Grade Information
2.6%
15.5%
41.0%
20.4%
6.1%
14.4%
1.7%
11.2%
37.7%
22.6%
8.0%
18.8%
Academic Performance by Offense Type
Drug Offender Non-Drug Offender
Non-Drug Offender
Drug Offender
4.8%
6.0%
Habitual Truant School Attendance by Offense Type

14 | P a g e D r u g O f f e n s e s
11-5-14
drug offenders in percent habitually truant, which is far from meaningful. 5.1% of all offenders were defined as habitual truants (result not shown). Finally, we examine the self-reported trauma histories of the two groups of offenders (drug and non-drug offenders). Figure 14 provides details on eight distinct forms of trauma/abuse. On all of the eight measures, drug offenders have lower prevalence of abuse/trauma history than non-drug offenders. Independent samples t-tests confirm all differences are significant (at p<.01), with the exception of having a household member with a jail/prison history which was statistically equivalent. Although seven of the eight differences in trauma/abuse exposure were significant, all effect sizes were very small (ranging from a low of Cohen’s d=.02 for neglect to a high of Cohen’s d=.16 for sexual abuse). Substantively, there is no real difference in trauma histories of drug and non-drug offenders in this analysis and any differences point to more trauma/abuse for non-drug offenders, contrary to public opinion. It should be noted over 40% of all youth examined experienced witnessing violence and over 1/3 had a household member that went to jail or prison. Figure 14.
Due to gender differences in trauma exposure reported in a plethora of prior criminological research (Zahn, Agnew, Fishbein, Miller, Winn, Dakoff, Kruttschnitt, Giordano, Gottfredson, Payne, Feld, and Chesney-Lind, 2010), the abuse/trauma exposure of male and female offenders was examined separately. Figure 15 illustrates the same eight forms of trauma/abuse as Figure 14 separately for male and female drug and non-drug offenders. Of the 190,562 youth, 130,870 were male (69%). 33,218 (25%) of the males were drug offenders. 6,038 (10%) of the females were drug offenders. For males, drug offenders have a lower prevalence of each trauma/abuse with the exception of a history of running away, and household members with a jail/prison history (neither of which differ significantly). The six trauma/abuse types where drug offending males have a lower prevalence than
Prior DCF Placement
History of Running Away
Jail/Prison History of Household Members
History of Physical Abuse
History of Witnessing Violence
History of Sexual Abuse
History of Neglect
History of Suicidal Ideation
8.9%
18.6%
33.1%
9.2%
45.6%
4.7%
4.2%
9.0%
6.8%
17.6%
33.2%
6.8%
43.2%
2.6%
3.8%
7.3%
Trauma History by Offense Type
Drug Offender Non-Drug Offender

15 | P a g e D r u g O f f e n s e s
11-5-14
non-drug offending males are all significant (p<.01), though all have small effect sizes (physical abuse has the largest effect size at Cohen’s d=.10). The differences in trauma/abuse between male drug and male non-drug offenders were therefore not especially substantively meaningful. Figure 15.
For females, prior DCF placements and a history of physical abuse were statistically equivalent between drug and non-drug female offenders. Female youth arrested for drug offenses had a significantly higher prevalence of a history of running away, household members with a jail/prison
0.0% 10.0% 20.0% 30.0% 40.0% 50.0%
Prior DCF Placement
History of Running Away
Jail/Prison History of Household Members
History of Physical Abuse
History of Witnessing Violence
History of Sexual Abuse
History of Neglect
History of Suicidal Ideation
Prior DCFPlacement
History ofRunning
Away
Jail/PrisonHistory ofHouseholdMembers
History ofPhysicalAbuse
History ofWitnessing
Violence
History ofSexualAbuse
History ofNeglect
History ofSuicidalIdeation
Female Drug Offender 10.1% 26.8% 35.9% 11.8% 43.9% 11.7% 6.1% 16.7%
Female Non-Drug Offender 10.4% 23.6% 34.2% 11.8% 45.8% 10.0% 5.0% 12.9%
Male Drug Offender 6.2% 15.9% 32.7% 5.9% 43.1% 0.9% 3.4% 5.6%
Male Non-Drug Offender 8.1% 15.8% 32.5% 7.8% 45.6% 1.8% 3.7% 6.8%
Trauma History by Gender and Offense Type

16 | P a g e D r u g O f f e n s e s
11-5-14
history, history of sexual abuse, history of neglect, and history of suicidal ideation (all significant at p<.01, though all with small effect sizes ranging from Cohen’s d=.06 to .18). Female drug offenders had significantly lower prevalence of history of witnessing violence than female non-drug offenders (p<.01, Cohen’s d=.07, which is hardly substantively meaningful). These results highlight the necessity to examine trauma/abuse histories separately for males and females. The findings were opposite one another. For males, drug offenders had lower trauma/abuse histories, while female drug offenders had higher trauma/abuse histories than their female non-drug offender counterparts. The simple comparison of males and females overall is more informative than comparing drug and non-drug offenders within a gender. Females taken as whole have higher rates of every type of abuse examined, with the exception of witnessing violence. The proportion of females that have run away is 1.5 times that of males, as is the histories of physical abuse and neglect. The history of suicidal ideation is double the male rate for female non-drug offenders and the history of suicidal ideation for female drug offenders is 3 times the rate for male drug offenders. The prevalence of sexual abuse among female drug offenders is 13 times the prevalence for male drug offenders.
Implications: This brief has attempted to shed light on the proportion of youth referrals to FDJJ that are drug offense arrests. 11% of all arrests over the five year period involved a drug offense as the most serious charge. 71% of all drug arrests over the five year period were for misdemeanor offenses. Though the actual number of drug arrests has declined, misdemeanor drug arrests as a percentage of all arrests have increased over the period examined, while felony drug arrests as a percent of all arrests have declined. However, the percent of all arrests for which both misdemeanor and felony drug offenses are responsible have both fluctuated less than 1.5% over the entire five year period meaning the rates are substantively stable. 12% of all the arrests of a male were for drug offenses, compared to 6% of all arrests of a female. A larger proportion of White youth are arrested for drug offenses than that proportion for Hispanics or Black youth. Drug offenders are more likely to be low risk offenders and less likely to be Serious, Violent, and Chronic (SVC) offenders. Drug offenders evidence more problems with school, including increased rates of dropping out, expulsion, suspension, lower GPA, and higher rates of truancy. With respect to a history of trauma and/or abuse, there are very important gender differences. Male drug offenders have lower histories of such abuse, while for females, the trend is reversed. Females arrested for drug offenses have higher rates of five of the eight abuses examined than females arrested for non-drug offenses. The gender-specific differences in the relationship between trauma/abuse and drug offending indicate there may be different “drivers” of the offending behavior. Though an empirical question at this point, perhaps males are driven to drug offending by delinquent peer association, low self-control, or weak bonds to school, and females driven more as an effort to escape their present abusive situations. Future research should attempt to further elaborate on “gendered pathways” (Chesney-Lind, 1997; Daly, 1992) and the risk/needs predictive of male versus female drug offending. These results indicate male and female drug offenders may require different interventions or interventions that are multimodal to address several different risk factors at once in order to optimize effectiveness.

17 | P a g e D r u g O f f e n s e s
11-5-14
NOTES: 1. Charges classified as “miscellaneous” with the number of arrests (n) in parenthesis: Own/Operate pharmacy
without license (n=1); Forgery: make/alter prescription first offense (n=1); Fraud: conceal information to obtain a prescription (n=5); Failure to report theft or loss of schedule III, IV, V drug (n=2); Marijuana: Use under 18 year old to avoid detection (n=3); Marijuana: Sentencing provision only (n=1); Keep shop or vehicle etc. for drugs subsequent violation (n=2); Keep shop or vehicle etc. for drugs first violation (n=4).
References: Andrews, D. A., & Bonta, J. (2003). The psychology of criminal conduct (3rd ed.). Cincinnati, OH:
Anderson. Baglivio, M. T. (2009). The assessment of risk to recidivate among a juvenile offending population.
Journal of Criminal Justice, 37, 596-607. Baglivio, M. T., & Jackowski, K. (2013). Examining the validity of a juvenile offending risk assessment
instrument across gender and race/ethnicity. Youth Violence and Juvenile Justice, 11, 26-43. Baglivio, M. T., Jackowski, K., Greenwald, M., & Howell, J. C. (2014). Serious, Violent, and Chronic
Juvenile Offenders: A Statewide Analysis of Prevalence and Prediction of Subsequent Recidivism Using Risk and Protective Factors. Criminology and Public Policy, 13: 83-116.
Chesney-Lind, M. (1997). The female offender: Girls, women, and crime. Thousand Oaks, CA: Sage. Daly, K. (1992). Women’s pathway to felony court: Feminist theories of law-breaking and problems of
representation. Review of Law and Women’s Studies, 2, 11-52. DeLisi, M., & Piquero, A. R. (2011). New frontiers in criminal careers research, 2001-2011: A state-of-
the-art review. Journal of Criminal Justice, 39, 289-301. Howell, J. C. (2009). Preventing and reducing juvenile delinquency: A comprehensive framework.
Thousand Oaks, CA: Sage. Howell, J. C. (2012). Gangs in America’s communities. Thousand Oaks, CA: Sage.
Krohn, M. D., Thornberry, T. P., Rivera, C., & Le Blanc, M. (2001). Later careers of very young offenders. In R. Loeber & D. P. Farrington (Eds.), Child delinquents: Development, intervention, and service needs (pp. 67-94). Thousand Oaks, CA: Sage.
Lipsey, M.W. (2009). The Primary Factors that Characterize Effective Interventions with Juvenile
Offenders: A Meta-Analytic Overview. Victims and Offenders, 4: 124-147. Lipsey, M.W., Howell, J.C., Kelly, M.R., Chapman, G., & Carver, D. (2010). Improving the Effectiveness
of Juvenile Justice Programs: A New Perspective on Evidence-based Practice. Center for Juvenile Justice Reform; Georgetown Public Policy Institute, Georgetown University.

18 | P a g e D r u g O f f e n s e s
11-5-14
Loeber, Rolf and David P. Farrington. 1998. Serious & Violent Juvenile Offenders: Risk Factors and
Successful Interventions. Thousand Oaks, CA: Sage. Loeber, R., & Farrington, D. P. (2001). Executive summary. In R. Loeber & D. P. Farrington (Eds.), Child
delinquents: Development, intervention, and service needs (pp. xix-xxxi). Thousand Oaks, CA: Sage.
Loeber, Rolf and David P. Farrington. 2012. From juvenile delinquency to adult crime: Criminal
careers, justice policy, and prevention. New York, NY: Oxford University Press. Loeber, Rolf, David P. Farrington, and David Petechuk. 2003. Child delinquency: Early intervention
and prevention. Child Delinquency Bulletin Series. Washington, DC: Office of Juvenile Justice and Delinquency Prevention.
Snyder, Howard N. (1998). Serious, violent, and chronic juvenile offenders: An assessment of the
extent of and trends in officially recognized serious criminal behavior in a delinquent population. In R. Loeber, and D. P. Farrington (Eds.), Serious & violent juvenile offenders: Risk factors and successful interventions (pp.428-444). Thousand Oaks, CA: Sage.
Winokur-Early, K., Hand, G. A., & Blankenship, J. L. (2012). Validity and Reliability of the Florida
Positive Achievement Change Tool (PACT) Risk and Needs Assessment Instrument: A Three-Phase Evaluation (Validation Study, Factor Analysis, Inter-Rater Reliability). Tallahassee, FL: Justice Research Center.
Zahn, M. A., Agnew, R., Fishbein, D., Miller, S., Winn, D., Dakoff, G., Kruttschnitt, C., Giordano, P.,
Gottfredson, D. C., Payne, A. A., Feld, B. C., and Chesney-Lind, M. (2010). Causes and correlates of girls’ delinquency. Office of Justice Programs, Office of Juvenile Justice and Delinquency Prevention, Girls Study Group Series, Bulletin.

![Offenses Offendel:~ Drug L21W Vlloli21[Q]Ir§9](https://static.fdocuments.in/doc/165x107/61ded5a47963de09f21087f4/offenses-offendel-drug-l21w-vlloli21qir9.jpg)