Drug Discovery Today'c2d2.colostate.edu/assets/files/oral_solubility_hydrophobicity.pdf · Drug...
8
Alan P.HiII 1 and Robert J. Young 2 1 Department of Analytical Chemistry, GlaxosmithKline Medicines Research Centre, Steven age, Hertfordshire sGl 2NY, UK 2 Department of CSC Medicinal Chemistry, GlaxosmithKline Medicines Research Centre, Stevenaqe, Hertfordshire sGl 2NV; UK Suboptimal physical properties have been identified as a particular shortcoming of compounds in contemporary drug discovery, contributing to high attrition levels. An analysis of the relationship between hydrophobicity (calculated and measured) and ~100 k measured kinetic solubility values has been undertaken. In line with the General Solubility Equation, estimates of hydrophobicity, particularly ACD clog D pH7 . 4 , give a useful indication of the likely solubility classification of particular molecules. Taking ACD clog D pH7 . 4 values together with the number of aromatic rings in a given molecule provides enhanced prediction. The 'Solubility Forecast Index' (SFI = clog D pH7 . 4 + #Ar) is proposed as a simple, yet effective, guide to predicting solubility. Moreover, analysis of measured distribution/partition coefficient values highlighted statistically significant shortcomings in the applicability of octanol/water as a model system for hydrophobicity determination with poorly soluble compounds. Introduction The optimization of physical properties is fundamental to suc- cessful drug discovery [1). Aqueous solubility is a desirable prop- erty to have in a drug molecule, facilitating delivery to and subsequent interaction with the pharmacological target [2,3). The hydrophobicity (the commonly used etymological synonym of lipophilicity) of a compound is a measure of the preference of a compound to reside in lipid over an aqueous environment; this has an implied inverse link to aqueous solubility and is funda- mental to many other interactions vital to achieving a potent and selective pharmacological action. The crux of successful drug discovery is almost invariably the achievement of a balance between hydrophobicity-driven potency and hydrophilicity-dri- ven pharmacokinetic and/or pharmacodynamic action. An esti- mation of hydrophobicity is perhaps the key descriptor in the design of potential drug molecules (4); it is fundamental to establishing structure-property relationships and to the many predictive models of pharmacokinetic parameters used in med- icinal chemistry [5,6]. In spite of the availability of high-through- put methods for both the measurement and the prediction of hydrophobicity, there is growing evidence that clinical candi- Corresponding authors:. Hill, A.P. ([email protected]), Young, R.J. ([email protected]) dates are generally somewhat overly hydrophobic, which is impli- cated as an important factor in continuing high rates of attrition in the drug development process [7). The established model for measuring hydrophobicity involves the partition or distribution of a compound between octanol and aqueous buffers. Thus, intrinsic hydrophobicity (log P, IOglOof the partition coefficient) describes the partition of non-ionizable or unionized forms of molecules between octanol and buffer; log P is a constant for any given compound. Effective hydrophobicity (log D pH , loglOof the distribution coefficient at a given pH) reflects the distribution of all species present between the phases for a given buffer pH (typically log DPH7.4 is quoted, i.e. at physiological pH, 7.4). If a molecule has no ionizable centre then intrinsic and effective hydrophobicity are equivalent, regardless of pH. Of course, for ionizable compounds as pH varies, the relative propor- tion of species will be dependent on the pKa of the basic and/or acid centres. There are many in silico packages that predict log P and, in conjunction with pKa values, log D can additionally be estimated for any given pH. log P is the important factor in determining binding being im plicated in the promiscuity of overly lipophilic molecules largely owing to entropy-driven non-specific binding (7), whereas log D pH7 . 4 is implicated as a key descriptor in modelling of absorption and metabolism properties [4-6). 648 www.drugdiscoverytoday.com 1359·6446/06/$ - see front matter © 2010 Elsevier Ltd. All rights reserved. doi:1O.1016/j.drudis.201O.05.016
Transcript of Drug Discovery Today'c2d2.colostate.edu/assets/files/oral_solubility_hydrophobicity.pdf · Drug...

Alan P. HiII1 and Robert J. Young2
1 Department of Analytical Chemistry, GlaxosmithKline Medicines Research Centre, Steven age, Hertfordshire sGl 2NY, UK2 Department of CSC Medicinal Chemistry, GlaxosmithKline Medicines Research Centre, Stevenaqe, Hertfordshire sGl 2NV; UK
Suboptimal physical properties have been identified as a particular shortcoming of compounds incontemporary drug discovery, contributing to high attrition levels. An analysis of the relationshipbetween hydrophobicity (calculated and measured) and ~100 k measured kinetic solubility values hasbeen undertaken. In line with the General Solubility Equation, estimates of hydrophobicity, particularlyACD clog DpH7.4, give a useful indication of the likely solubility classification of particular molecules.Taking ACD clog DpH7.4 values together with the number of aromatic rings in a given molecule providesenhanced prediction. The 'Solubility Forecast Index' (SFI= clog DpH7.4 + #Ar) is proposed as a simple, yeteffective, guide to predicting solubility. Moreover, analysis of measured distribution/partitioncoefficient values highlighted statistically significant shortcomings in the applicability of octanol/wateras a model system for hydrophobicity determination with poorly soluble compounds.
IntroductionThe optimization of physical properties is fundamental to suc-cessful drug discovery [1). Aqueous solubility is a desirable prop-erty to have in a drug molecule, facilitating delivery to andsubsequent interaction with the pharmacological target [2,3).The hydrophobicity (the commonly used etymological synonymof lipophilicity) of a compound is a measure of the preference of acompound to reside in lipid over an aqueous environment; thishas an implied inverse link to aqueous solubility and is funda-mental to many other interactions vital to achieving a potent andselective pharmacological action. The crux of successful drugdiscovery is almost invariably the achievement of a balancebetween hydrophobicity-driven potency and hydrophilicity-dri-ven pharmacokinetic and/or pharmacodynamic action. An esti-mation of hydrophobicity is perhaps the key descriptor in thedesign of potential drug molecules (4); it is fundamental toestablishing structure-property relationships and to the manypredictive models of pharmacokinetic parameters used in med-icinal chemistry [5,6]. In spite of the availability of high-through-put methods for both the measurement and the prediction ofhydrophobicity, there is growing evidence that clinical candi-
Corresponding authors:. Hill, A.P. ([email protected]), Young, R.J. ([email protected])
dates are generally somewhat overly hydrophobic, which is impli-cated as an important factor in continuing high rates of attritionin the drug development process [7).
The established model for measuring hydrophobicity involvesthe partition or distribution of a compound between octanol andaqueous buffers. Thus, intrinsic hydrophobicity (log P, IOglOof thepartition coefficient) describes the partition of non-ionizable orunionized forms of molecules between octanol and buffer; log P isa constant for any given compound. Effective hydrophobicity(log DpH, loglOof the distribution coefficient at a given pH) reflectsthe distribution of all species present between the phases for agiven buffer pH (typically log DPH7.4 is quoted, i.e. at physiologicalpH, 7.4). If a molecule has no ionizable centre then intrinsic andeffective hydrophobicity are equivalent, regardless of pH. Ofcourse, for ionizable compounds as pH varies, the relative propor-tion of species will be dependent on the pKa of the basic and/oracid centres. There are many in silico packages that predict log Pand, in conjunction with pKa values, log D can additionally beestimated for any given pH. log P is the important factor indetermining binding being im plicated in the promiscuity of overlylipophilic molecules largely owing to entropy-driven non-specificbinding (7), whereas log DpH7.4 is implicated as a key descriptor inmodelling of absorption and metabolism properties [4-6).
648 www.drugdiscoverytoday.com 1359·6446/06/$ - see front matter © 2010 Elsevier Ltd. All rights reserved. doi:1O.1016/j.drudis.201O.05.016

Drug Discovery Today' Volume 15,Numbers 15/16'August 2010
TABLE 1
REVIEWS
Predicted log 5 (molar solubility) as a function of clog P and melting point combinations, calculated using the General SolubilityEquation.
50
100
~ 150
~ 200
250
300
Colouration by the aqueous solubility categories widely used within GSK (these classifications are used throughout).Red, poorly soluble (<30 fJ.M).
D Yellow, intermediate solubility (30-200 fJ.M).
[J Green, good solubility (>200 fJ.M).
The precise interplay between solubility and other molecularproperties has been at the hub of physical chemistry in drug dis-covery and open to debate. Indeed, recent literature [8-10] and thesolubility challenge [11,12] have seen many diverse solubility mod-els proposed, generally based on hydrophobicity in combinationwith other descriptors. The molecular descriptors of hydrophobi-city, molecular weight and polar surface area are interrelated; thus,care needs to be taken in interpreting data sets in which each of thesemight be represented. The particular interrelationship betweenhydrophobicity and solubility is investigated in this review,
The General Solubility Equation (GSE; Eq, (1)) succinctly linkssolubility with hydrophobicity and melting point and has beendemonstrated to be a reasonable model for predicting solubility foruncharged molecules [13],
Eq. (1) General Solubility Equation
logS = -logP - 0.01 * (Mpt - 25) + 0.5 (1)
The implications of this equation are illustrated in Table 1, inwhich log S values are calculated using the GSE for particular log Pand melting point combinations pertinent to medicinal chemistry[13], coloured by solubility categories. It is clear that hydropho-bicity is the dominant parameter in solubilities predicted by the
GSE. For a medicinal chemist, it is easy to influence a change inlog P, whereas the melting point is harder to predict or influence-and, indeed, in these days of high-throughput parallel chemistry,it is very rarely measured.
The colour distribution in Table 1 highlights how fine a log P
divide there is between compounds with good and poor Solubility.It is probably not coincidental that the average drug has a clog P of2.5 [7] - this corresponds to the upper limit of where the GSEpredicts good solubility can be achieved. Likewise, poor solubilityin potential drug molecules is engendered by the trend towardsoverly hydrophobic character recognized in contemporary med-icinal chemistry [7]. Thus, it is pertinent to describe such com-pounds as insoluble grease balls rather than brick dustcharacterized by high melting lattices; this concurs with the find-ings of Bergstrom et al. [14] in a recent study of poorly solubledrugs, These values represent probable 'worst case' solubilitybecause any ionizable centres would be likely to enhance solubi-lity. The GSEcan be modified to reflect the contribution of chargeto solubility at any given pH by substituting log D for log P; this isexemplified for pH 7.4 in Eq. (2), Increased ionization reduceslog D at a given pH, which consequently increases effectiveaqueous solubility
Binned ACO logO pH?.4
(a)70006000
5000C 4000:;,00 3000
20001000
M,
0,Q)
0 N '" -e-V s £ s s A
'7 0 N
Binned OctanollogO pH?.4
Drug Discovery Today
FIGURE 1 IDistribution, by binning, of (a) measured and (b) calculated log DpH7.4 values for compounds in this review,
www.drugdiscoverytoday.com 649
REVIEWS Drug Discovery Today-Volume 15, Numbers l5/16'August 2010
4 0
0
3'"'":I:C.
2oC>..90c:ctlU0 a
-1
-2-4 -2 a 2 4 6 8
ACO logDpH7.4
Drug Discovery Today
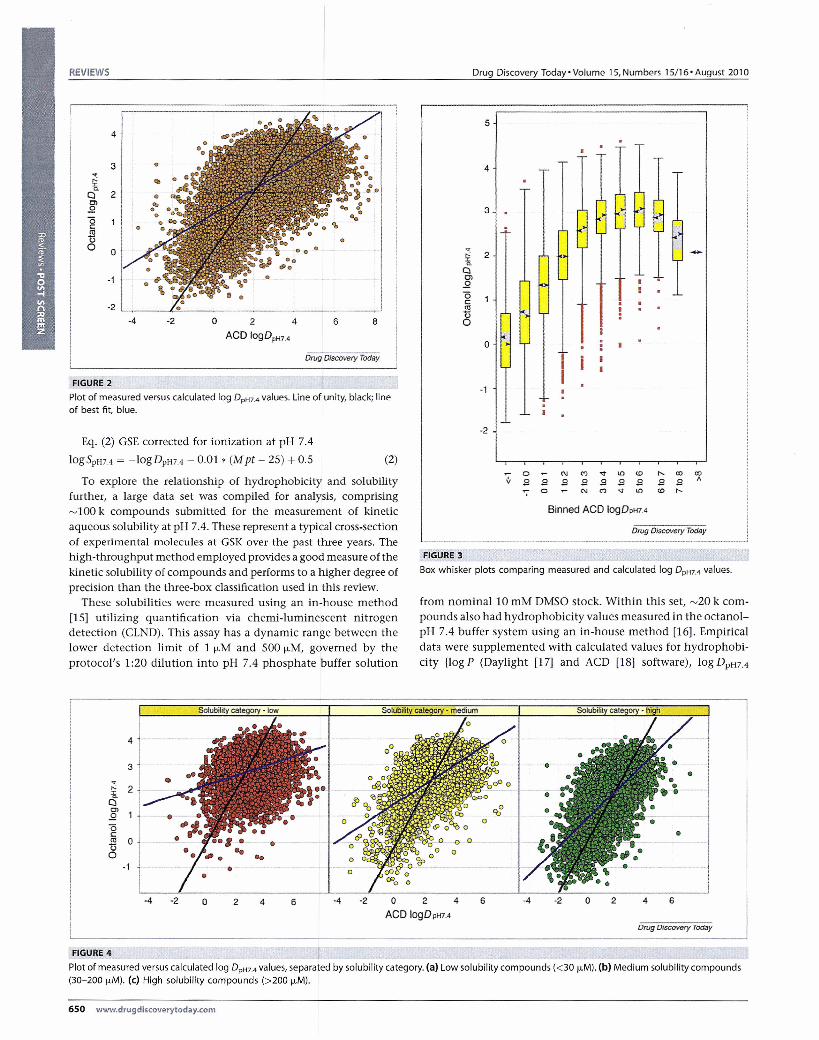
FIGURE 2
Plot of measured versus calculated log DpH7.4 values. Line of unity, black; lineof best fit, blue.
Eq. (2) GSE corrected for ionization at pH 7.4
logSpH74 = -logDpH74 - 0.01 * (M pt - 25) + 0.5
To explore the relationship of hydrophobicity and solubilityfurther, a large data set was compiled for analysis, comprising~ 100 k compounds submitted for the measurement of kineticaqueous solubility at pH 7.4. These represent a typical cross-sectionof experimental molecules at GSK over the past three years. Thehigh-throughput method employed provides a good measure of thekinetic solubility of compounds and performs to a higher degree ofprecision than the three-box classification used in this review.
These solubilities were measured using an in-house method(15) utilizing quantification via cherni-luminescent nitrogendetection (CLND). This assay has a dynamic range between thelower detection limit of 1 fLM and 500 fLM, governed by theprotocol's 1:20 dilution into pH 7.4 phosphate buffer solution
4
3
-e
'" 2~c0>..9oc:<ll auo
-1
-4 -2 4 6 -4 -2a 2
(2)
a 2 4
ACO logDpH7.4
5
4
3
'" -'" 2'E.Cl0>..90c:~o0
a
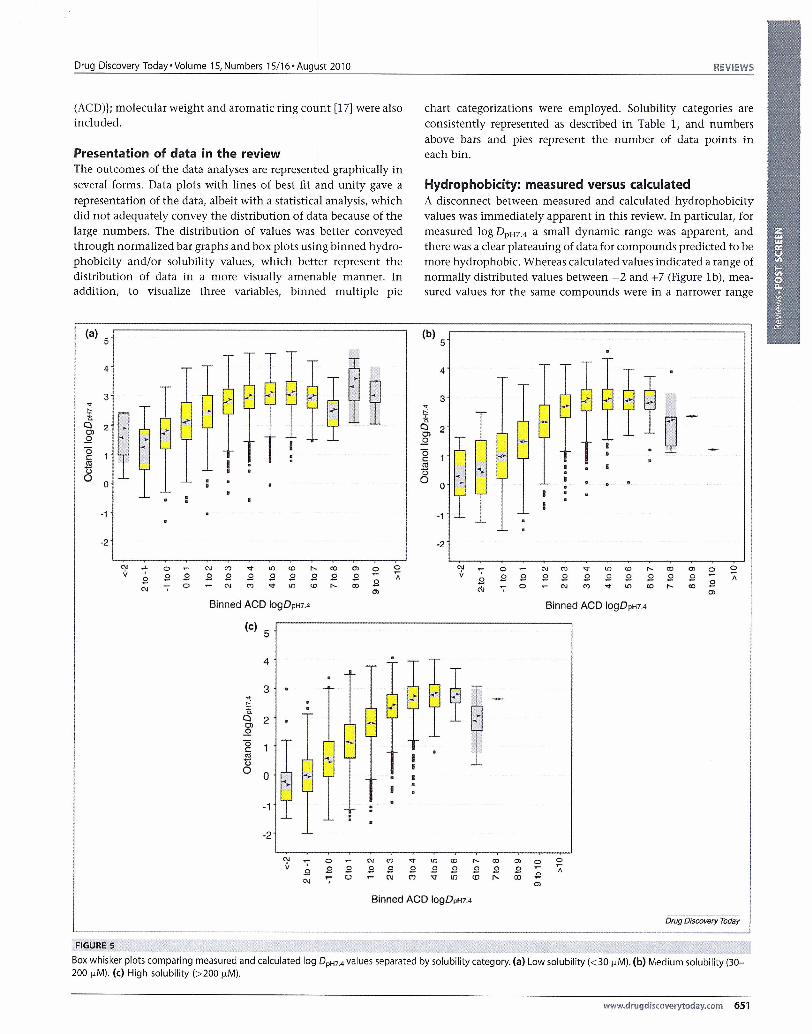
FIGURE 4
Plot of measured versus calculated log DpH7.4 values, separated by solubility category. (a) Low solubility compounds «30 fLM). (b) Medium solubility compounds(30-200 fLM). (c) High solubility compounds (>200 fLM).
-1
-2
0 N '" -e- U) <D "- eo coV .s .s .s .s .s .s .s .s .s "-r;- 0 N (') ..,. It) <D r-,
Binned ACO logDpH7.4
Drug Discovery Today
650 www.drugdiscoverytoday.com
FIGURE 3
Box whisker plots comparing measured and calculated log DpH7.4 values.
from nominal 10 mM DMSO stock. Within this set, ~20 k com-pounds also had hydrophobicity values measured in the octanol-pH 7.4 buffer system using an in-house method (16). Empiricaldata were supplemented with calculated values for hydrophobi-city {log P (Daylight (17) and ACD [18) software), log DPH7.4
6
Drug Discovery Toctay
Drug Discovery Today· Volume 15, Numbers 15/16· August 2010 REVIEWS
(ACD)}; molecular weight and aromatic ring count [17] were alsoincluded.
Presentation of data in the reviewThe outcomes of the data analyses are represented graphically inseveral forms. Data plots with lines of best fit and unity gave arepresentation of the data, albeit with a statistical analysis, whichdid not adequately convey the distribution of data because of thelarge numbers. The distribution of values was better conveyedthrough normalized bar graphs and box plots using binned hydro-phobicity and/or solubility values, which better represent thedistribution of data in a more visually amenable manner. Inaddition, to visualize three variables, binned multiple pie
chart categorizations were employed. Solubility categories areconsistently represented as described in Table 1, and numbersabove bars and pies represent the number of data points ineach bin.
Hydrophobicity: measured versus calculatedA disconnect between measured and calculated hydrophobicityvalues was immediately apparent in this review. In particular, formeasured log DPH7.4 a small dynamic range was apparent, andthere was a clear plateauing of data for compounds predicted to bemore hydrophobic. Whereas calculated values indicated a range ofnormally distributed values between -2 and +7 (Figure l b), mea-sured values for the same compounds were in a narrower range
(a)5
(b)5
4
~~~
4
~~~
3 3" .,.'"' '"'a
~
IC>
~ 2 a 201..Q .Q
~ ~
(5 (5c c.l!l .l!lo o0 00 0
-1 -1
-2 -2
'" '7 0 N co <t Ii) to •.... co OJ 0 0v E s s Sl Sl .s Sl E E .9 A.9
':" 0 (\j (') v It) to "- a:J eC\J
'"Binned AGO logDpH7.4
C)I "7 0 N '" <t III <0 r-, 00 '" ~ 0v .9 .9 .9 .9 .9 .9 s .9 s .9 A.9
0 N '" -e- III to r-, co SlN '7 '"
Binned ACD logDpH1.4
(e)5
4
3..'"'Ia 2OJ..Q
(5
~
c'"00 0
-1
-2
C)I '7 0 N '" <t III to •.... 00 '" 0 0v s s s s s s .9 s s .9 Sl A
0 N C') <t III <0 r-, eo sell '7'"
Binned AGD logDpH7.4
brug Discovery Today-..-.--~~~---.---
FIGURE 5 1Box whisker plots comparing measured and calculated log DpH7A values separated by solubility category. (a) Low solubility «30 fJ.-M).(b) Medium solubility (30-200 fJ.-M).(e) High solubility (>200 fJ.-M).
www.drugdiscoverytoday.com 651

REVIEWS Drug Discovery Today' Volume 15,Numbers 15116' August 2010
between -1 and +4, with a skewed distribution (Figure 1a). Thispoor correlation is also evident in Figure 2, which demonstratesthe disconnect between the measured and calculated hydropho-bicity, particularly for compounds with high calculated hydro-phobicity. The relative crossover between the lines of unity andbest fit clearly support this notion. This is further reinforced in thebox plot of measured versus binned predicted values (Figure 3).Starting from the most hydrophilic compounds, there is initially astatistically significant rise with increasingly hydrophobic bins;however, above clog DpH7.4 values of 3-4, there is a levelling offand then a decrease.
The physical basis behind this discrepancy in measured andcalculated hydrophobicity became apparent when the solubility ofthe compounds was considered. Poorly soluble «30 fLM) com-pounds showed a very poor correlation between predicted andmeasured log DpH7.4, as highlighted by the line of best fit(Figure 4a; R2 = 0.11, slope = 0.18) compared with the line of unity.With increasing solubility, however, the correlation clearlyimproves; for intermediate solubility compounds (30-200 fLM),there was a marked improvement in the correlation between
measured and calculated values (Figure 4bj R2 = 0.32, slope = 0.36).Although still statistically poor, the best correlation (Figure 4c;R2 = 0.46, slope = 0.54) was obtained for highly soluble com-pounds (>200 fLM). These trends are further exemplified in thesolubility-categorized box plots of Figure 5. Indeed, for poorlysoluble compounds (Figure Sa), if log DpH7.4 is predicted between3 and 7, there is no statistical difference between the averagemeasured values in each bin. These observations suggest thatfactors contributing to poor aqueous solubility are somehowperturbing the octanol/water system and preventing a true equili-brium from being obtained. A possible explanation for this is thetendency of poorly soluble compounds to form aggregates; thishas caused issues in other systems [19].
These data strongly suggest that any measured log D valueshould be used only in the context of the solubility of the moleculein question. Paradoxically, they also indicate that for poorlysoluble compounds, a calculated log D (or log P) is probably abetter indicator of true hydrophobicity than a measured value.Historically, predictive models of hydrophobicity have been builton databases of measured values, so one could surmise that better
(a)100%
80%
60%C:>oo
400/0
20%
~ 0 N C') <:l- ll) <0•.... CD CD
it .8 .8 .8 .8 .8 .8 .8 .8 ".8';- 0 N C') <:l- ll) <0 r-,
Binned ACO clogP
(e) 100%
80%
(b)100%
C 60%:>0o
40%
20%
0%
80%
Binned ACD logDpH7.4
.8o
Binned OetanollogDpH7.4
C 60%:>0<J
40%
20%
0%
Drug Discovery Today
FIGURE 6 IBar charts showing distribution of solubility category as a function of binned hydrophobicity. (a) ACD log P. (b) ACD log DpH7.4' (e) Measured log DpH7.4'
652 www.drugdiscoverytoday.com

Drug DiscoveryToday-Volume 15,Numbers 15/16- August 2010 REVIEWS
~l'l :!;
100%~ ~ ~ fj-~-
90%
80% i
170% ~ - -j60% '
C i:l j0 50% .o i
40% i i
30% t,
I
20% I10% I
0% 1
------------
2 3 4 5 6 7Aromatic rings
Drug Discovery Today
(which, as the following sections demonstrate, will be likely tohave increased hydrophobicity).
Hydrophobicity and measured solubilityThe distributions of measured solubility categories as a function ofvarious hydrophobicity descriptors are displayed in Figure 6. Theseclearly display the expected trends of decreasing solubility withincreasing hydrophobicity as predicted by the GSE, as representedin Table 1. The clearer stepped differentiation within the bands isapparent when log DpH7.4 rather than log P is used, which reflectsthe conisderable contribution of ionization to solubility.
Looking at solubility classifications by means of measuredlog DPH7.4 bins (Figure 6c), a similar trend is observed to that withcalculated values: however, the discrimination between hydro-phobicity bins is reflective of the limitations of the octanol/watersystem as described above. In particular, the limited population ofthe most hydrophobic bin should be noted.
Solubility and aromaticity: solubility Forecast IndexIn recent publications, the negative impact of aromaticity on solu-bility has been highlighted. The effect has been quantified usingthree related descriptors: proportion of Sp3 atoms [20], aromaticproportion [21] and, more simply, the number of aromatic rings in astructure [22]. This impact has been rationalized by complementaryexplanations, invoking either an increase in lattice energy (and thushigher melting point) owing to the -r-stacking of the flat rings or thereduced entropic contribution to the free energy of solvation andmelting owing to the inherently more rigid molecules [23,24].
FIGURE 7
Distributionof measured kineticsolubilitycategories, binned by the numberof aromatic rings in each structure.
models would be derived if only data from more soluble com-pounds were incorporated. The octanol-aqueous buffer system hasbeen the hydrophobicity gold standard for many years, but it hasclear shortcomings in assessing compounds with lesser solubility
(j)
C> 4C.'"o
'"5jE 3o~
2 :iCle• I
2 10 29 60 123 120 120tftct __~t _3\ 1 Sb5 1i44 1,120 169S 511O 243 81
f~ t~QtQt-~~_~tI • ' Ie ~- ~ di ~ i 672 ~
1812 3662 8568 5499 2284 684 150~~ ~Ct __~~2761 4391 2489 71J2 167 23fI~ ~~ __
152 17
~ ~()147 102 62 3 2 1
fI " e ~- e 0
7
146
5 11 8e84
6
5
1447
2
874 1248
89
0 N M ..•. on <D •.... coB B B B B B B B B
0 N M ..•. on <D r-,V
Binned AGO logDpH7.4
94
o
Drug Discovery Today
FIGURE 8Pie chart matrix representation of solubilitycategory as a function of ACDlog DpH7.4 and aromatic ring count.
www.drugdiscovE!rytoday.com 653

REVIEWS
100%
90%
80%
70%
C 60%:::J0 50%0
40%
30%
20%
10%
0%IiV
Drug DiscoveryToday-Volume 15, Numbers 15/16' August 2010
.9 B .90> 0~
Binned ACD logDpH7.4SFI
Drug Discovery Today
FIGURE 9
Distribution of solubilitycategory as function of ACD log DpH7.4 SFI.
As demonstrated in the review by Ritchie and MacDonald [22],several aromatic rings were associated with reduced solubility; thistrend was very clear in this analysis, too (Figure 7). The finding thatbinned clog DpH7.4 showed enhanced resolution of solubilityclasses (Figure 6) suggested a logical extension. Thus, the pie plotwith binned clog DPH7.4 and #Ar (Figure 8) clearly shows a morepronounced solubility differentiation than using clog P and #Ar,as employed in the earlier analysis [22]. In any given row orcolumn of Figure 8, the proportion of poorly soluble compoundsincreases as either hydrophobicity or #Ar increases. This com-pounding effect is further emphasized by the diagonal splitbetween regions of predominantly high and low solubility inFigure 8. In fact, the division between these regions can reasonablybe described by the diagonal of clog DPH7.4 + #Ar = 5. This obser-vation led to the formulation of the simplistic Solubility ForecastIndex, which supports the notion that if clog DpH7.4 + #Ar< 5 then there is a reasonable chance of having good solubility.
Alternatively, the absolute SF! value can be related to a particularbin, which indicates the probability of having poor, intermediateor good solubility (Figure 9). This graded bar graph (Figure 9) canbe compared with that shown in Figure 6b to show an increase in
References
1 Van de Waterbeemd, H. (2009) Improving compound quality through ill vitro and ill
silica physicochemical profiling. Chern, Biodivers. 6, 1760-17662 Stegemann, S. (2007) When poor solubility becomes an issue: from early stage to
proof of concept. Eur. f. Phann. Sci. 31, 249-2613 Lipinski, C.A. (2000) Drug-like properties and the causes of poor solubility and poor
permeability. f. Pharmacol. Toxieol. Methods 44, 235-2494 Gleeson, M.P. (2008) Generation of a set of simple, interpretable ADMET rules of
thumb. f. Med. Chem. 51, 817-8345 Muresan, S. and Sadowski, J. (2008) Properties guiding drug- and lead-likeness. In
Methods and Principles in Medicinal Chemistry. Wiley InterScience pp. 439-461
resolution when considering binned SFl versus binned clog DpH7.4
alone. It is thus implicit that each aromatic ring in a molecule has asolubility penalty equivalent to an extra log unit of hydrophobi-city in addition to its intrinsic hydrophobicity value [and this isthe Daylight definition of #Ar, in which each aromatic ring(benzenoid or heterocyclic) is counted and fused systems (e.g.indole, naphthalene and purine) count as two rings].
In conclusion, the interrelationship of hydrophobicity andsolubility has been investigated with ~100 k compounds withmeasured CLND solubility and ~20 k compounds with measuredoctanol-pH 7.4 buffer hydrophobicity values. Most notably, ithas been demonstrated that the octanol-aqueous buffer modelfor measuring hydrophobicity does not work well for poorlysoluble compounds. The octanol-buffer system works well formore hydrophilic compounds with fewer aromatic rings, but thisclearly has shortcomings for more lipophilic and aromatic com-pounds, which, implicitly, have lesser solubility. It is note-worthy to consider that for molecules with hydrophobicity inproximity to the median values for marketed drugs (c log P = 2.5or clog DpH7.4 = 0.8) [7], these analyses strongly suggest thatthey are likely to be soluble and have reliable measured hydro-phobicity values. Furthermore, the effect of aromatic rings onsolubility was over and above their contributions to hydropho-bicity, which led to simplistic concept of summing clog DPH7.4
and the number of aromatic rings (Solubility Forecast Index = -clog DPH7.4 + #Ar). The SF! value provides a simplistic and read-ily calculated indicator of the likely solubility category, impliedby the distribution of measured values in that particular bin;conceptually, keeping SFI < 5 should be a powerful guide forcompound design in drug discovery, which gives a high prob-ability of securing good physical properties. Given that theaverage number of aromatic rings in oral drugs is 1.6 [22], theiraverage SFI would thus be 2.4. Finally, it is clear that solubility isprofoundly influenced by the hydrophobicity of a molecule,thus the limits of the GSE or any other solubility predictor mustbe governed by the quality of hydrophobicity estimates. Asdemonstrated here, the octanol-aqueous buffer model forhydrophobicity might not always be reliable.
AcknowledgementsWe thank Pat McDonough for the experimental determination ofoctanol distribution coefficients and, in conjunction with lainReid, Silvia Bardoni, Patrick Day and Musundi Wabuyele, theCLND solubility measurements; Simon MacDonald, SimonReadshaw and the reviewers for their constructive criticalcomments on this manuscript.
6 Lipinski, C.A. et al. (2001) Experimental and computational approaches to estimatesolubility and permeability in drug discovery and development settings. Adv. Drug
Deliv. Rev. 46, 3-267 Leeson, P.D. and Springthorpe, B. (2007) The influence of drug-like
concepts on decision-making in medicinal chemistry. Nat. Rev. Drug Discov. 6,881-890
8 Dearden,j.C. (2006) In silico prediction of aqueous solubility. Exp. Opin. Drug Discov.1, 31-52
9 Delaney, J.S. (2005) Predicting aqueoussolubility from structure. Drug Discov. Today10,289-295
654 www.drugdiscoverytoday.com

Drug Discovery Today-Volume 15, Numbers 15/16- August 2010 REVIEWS
10 Kramer, C. et al. (2009) A consistent dataset of kinetic solubilities for early-phasedrug discovery. ChemMedChem 4, 1529-1536
11 Llinas, A. et al. (2008) Solubility challenge: can you predict solubility of 32molecules using a database of 100 reliable measurements. f. Chern. Inf. Model. 48,1289-1303
12 Hopfinger, A.]. et al. (2009) Findings of the challenge to predict aqueous solubility. f.Chem. lnf. Model. 49, 1-5
13 Jain, N. and Yalkowsky, 5.H. (2001) Estimation of the aqueous solubility. I.Application to organic non-electrolytes. 1. Pharm. Sci. 90, 2314-252
14 Bergstrom, C.A. etal. (2007) Poorly soluble marketed drugs display solvation limitedsolubility. l, Med. Chern. 50, 5858--5862
15 G5K in-house kinetic solubility assay: 5 ,...1of 10 mM DM50 stock solution diluted to100,...1 with pH 7.4 phosphate buffered saline, equilibrated for 1 h at RT, filteredthrough Millipore MultiscreenHlYPCF filter plates (MSSL BPC). The eluent isquantified by suitably calibrated flow injection CLND.
16 GSK in-house hydrophobicity assay: 10 ,...1of 10 mM DMSO stock solution diluted to750,...1 with octanol saturated pH 7.4 phosphate buffer and 160,...1 buffer saturatedoctanol in a 96 well deep well block. Block sealed and inverted for 3 sets of SOinversions, then centrifuged at 300 g for 20 min. Both phases are then quantifiedusing generic gradient UV·HPLC.
17 Daylight software v4.9. Daylight Chemical Information Systems, Inc. Aliso Viejo,CA, USA (http://www.daylight.coml).
18 Log D suite verslon l L Advanced Chemistry Development, Inc. Toronto, Ontario,Canada (http://www.acdlabs.coml).
19 jadhav, A. et al. (2010) Quantitative analyses of aggregation, autofluorescence,and reactivity artefacts in a screen for inhibitors of a thiol protease. f. Med. Chern.53,37-51
20 Lovering, F. et al. (2009) Escape from flatland: increasing saturation as an approachto improving clinical success. f. Med. Chern, 52, 6752-6756
21 Lamanna, C. etal. (2008) Straightforward recursive partitioning model for discardinginsoluble compounds in the drug discovery process. f. Med. Chem. 51,2891-2897
22 Ritchie, T.). and Macdonald, S.J.F. (2009) The impact of aromatic ring count oncompound developability - are too many aromatic rings a liability in drug design?Drug Discov. Today 14, 10 11-1020
23 Sanghvt, H. et al. (2003) Estimation of aqueous solubility by the General SolubilityEquation (GSE) the easy way. QSAR Comb. Sci. 22, 258-262
24 Delaney, J.5. (2004) ESOL: estimating aqueous solubility directly from molecularstructure. I, Chern. Inf. Comput. Sci. 44, 1000-1005
Alan Hill is currently head of the Physico-chemical properties group atStevenage and has more than 35 years experience of physical chemistryin GlaxoSmithKline legacy companies after joining Wellcome in 1974.He has contributed notable physical insight across many programmes. inparticular developing a physico-chemical model of oral absorption usedin the discovery of Zolmitriptan.
Rob Young has 20 years of broad medicinal chemistry experienceacross several therapeutic areas at Wellcome. GlaxoWelicome andGSK. He has expertise in the application of physical methods andproperty-based design in medicinal chemistry. having derived andutilised structure property relationships to great effect in antic-oagulant programmes in particular.
www.drugdiscoverytoday.com 655