DRUG DISCOVERY - NIH Clinical Centerclinicalcenter.nih.gov/.../slides/Discovery08-09oneslide.pdf ·...
113
DRUG DISCOVERY Edward A. Sausville, M.D., Ph.D. Professor of Medicine Associate Director for Clinical Research Marlene & Stewart Greenebaum Cancer Center University of Maryland at Baltimore March 19, 2009
-
Upload
nguyendieu -
Category
Documents
-
view
215 -
download
0
Transcript of DRUG DISCOVERY - NIH Clinical Centerclinicalcenter.nih.gov/.../slides/Discovery08-09oneslide.pdf ·...

DRUG DISCOVERY
Edward A. Sausville, M.D., Ph.D.Professor of Medicine
Associate Director for Clinical ResearchMarlene & Stewart Greenebaum Cancer Center
University of Maryland at BaltimoreMarch 19, 2009

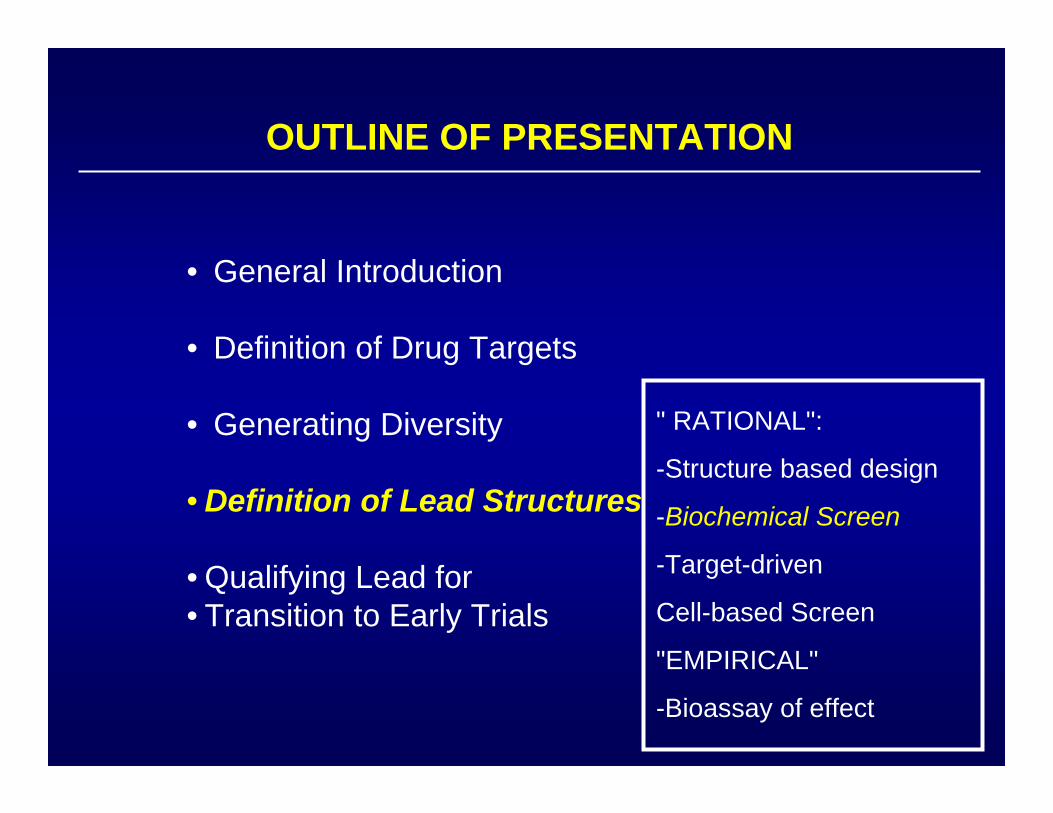
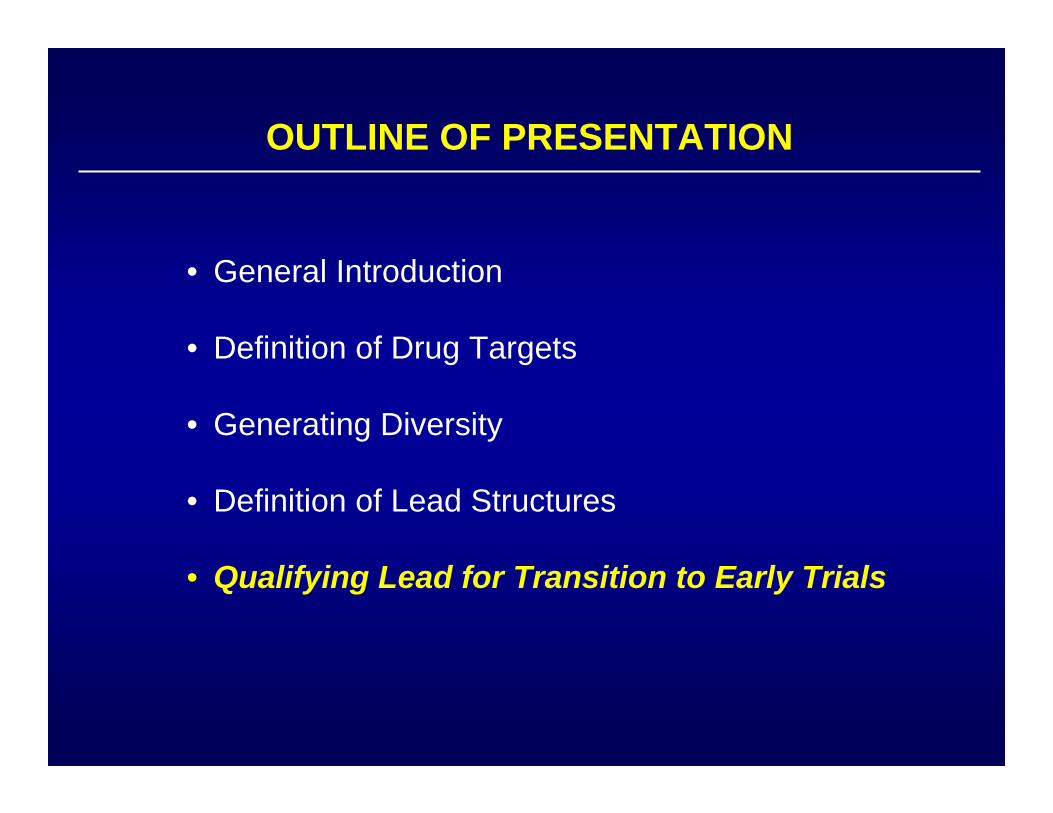
OUTLINE OF PRESENTATION
• General Introduction
• Definition of Drug Targets
• Generating Diversity
• Definition of Lead Structures
• Qualifying Leads for Transition to Early Trials

DRUG DISCOVERY:WHERE HAS IT WORKED?
Nature 384 suppl 11:5, 1996
Majority of Drug Targets:
- G-Protein Coupled Receptors- Nuclear (Hormone) Receptors- Ion Channels- Enzymes
% Top Sales
181016
~50
Problem:How to choose target likely to succeedespecially if directed at new target(e.g. protein-protein interactions)?
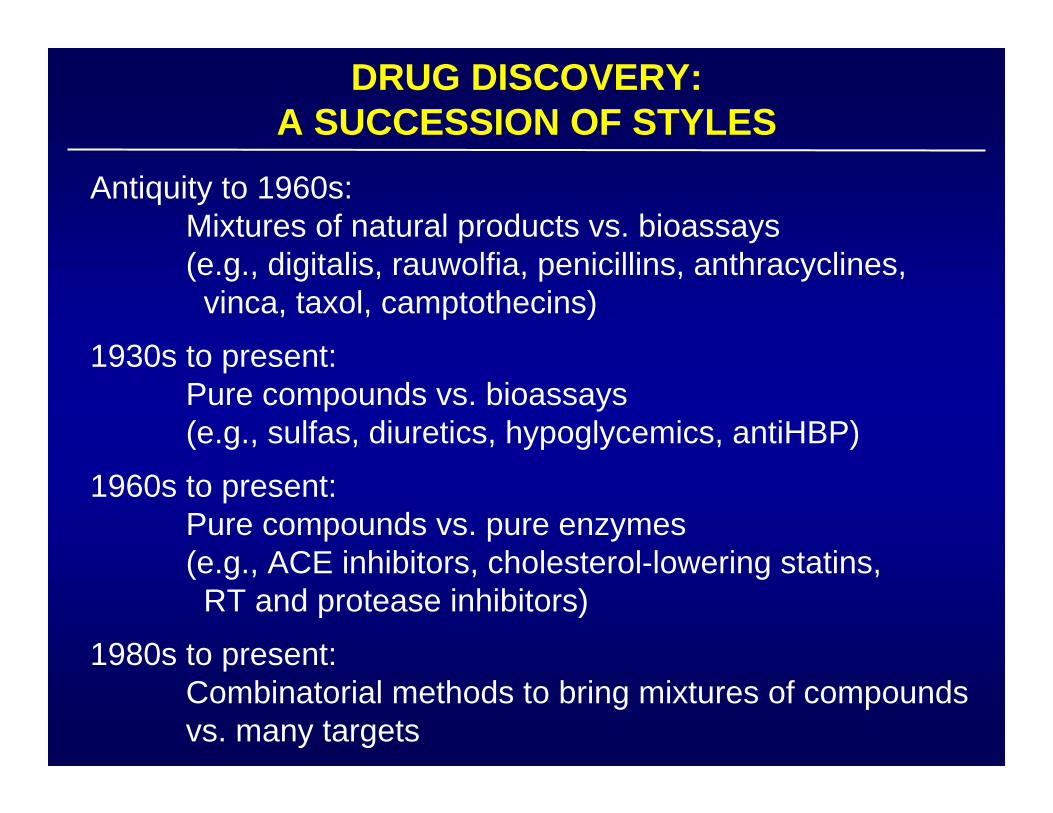
DRUG DISCOVERY:A SUCCESSION OF STYLES
Antiquity to 1960s:Mixtures of natural products vs. bioassays(e.g., digitalis, rauwolfia, penicillins, anthracyclines,vinca, taxol, camptothecins)
1930s to present:Pure compounds vs. bioassays(e.g., sulfas, diuretics, hypoglycemics, antiHBP)
1960s to present:Pure compounds vs. pure enzymes(e.g., ACE inhibitors, cholesterol-lowering statins,RT and protease inhibitors)
1980s to present:Combinatorial methods to bring mixtures of compoundsvs. many targets
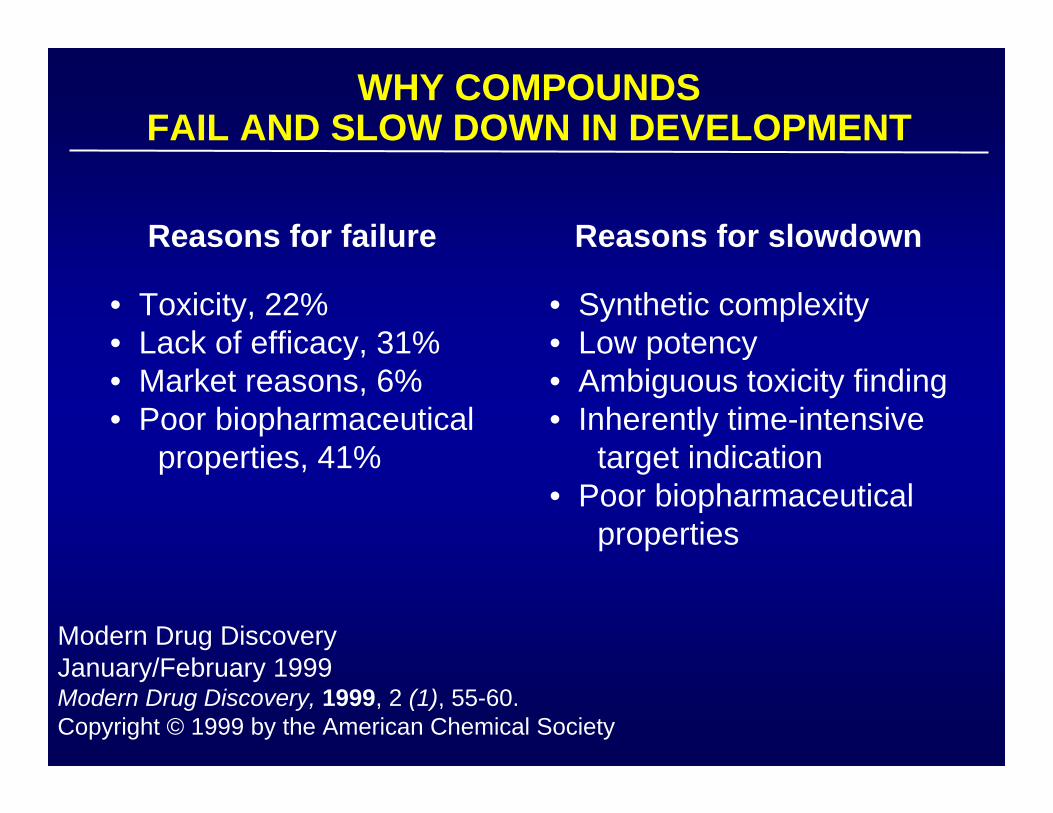
WHY COMPOUNDSFAIL AND SLOW DOWN IN DEVELOPMENT
Modern Drug DiscoveryJanuary/February 1999Modern Drug Discovery, 1999, 2 (1), 55-60.Copyright © 1999 by the American Chemical Society
Reasons for failure Reasons for slowdown
• Toxicity, 22%• Lack of efficacy, 31%• Market reasons, 6%• Poor biopharmaceutical
properties, 41%
• Synthetic complexity• Low potency• Ambiguous toxicity finding• Inherently time-intensive
target indication• Poor biopharmaceutical
properties
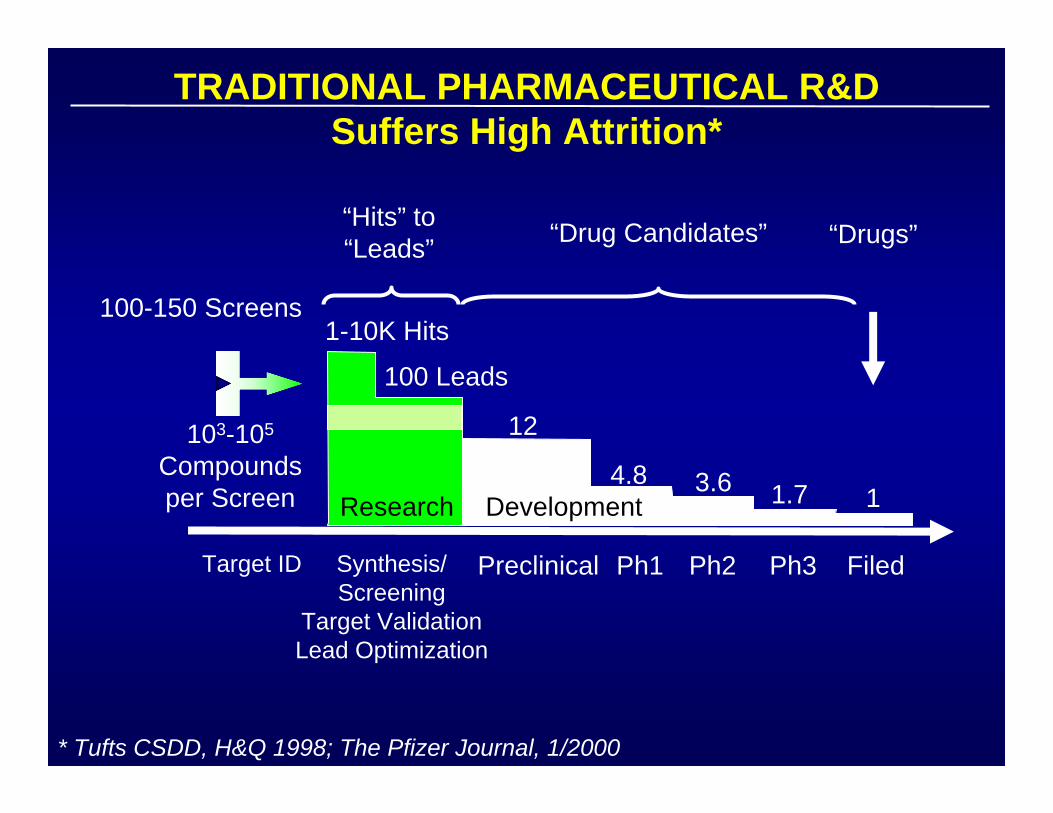
TRADITIONAL PHARMACEUTICAL R&DSuffers High Attrition*
* Tufts CSDD, H&Q 1998; The Pfizer Journal, 1/2000
Target ID Synthesis/Screening
Target ValidationLead Optimization
Preclinical Ph1 Ph2 Ph3 Filed
100-150 Screens
103-105
Compoundsper Screen
“Hits” to“Leads” “Drugs”“Drug Candidates”
1-10K Hits
100 Leads
12
4.8 3.6 1.7 1Research Development
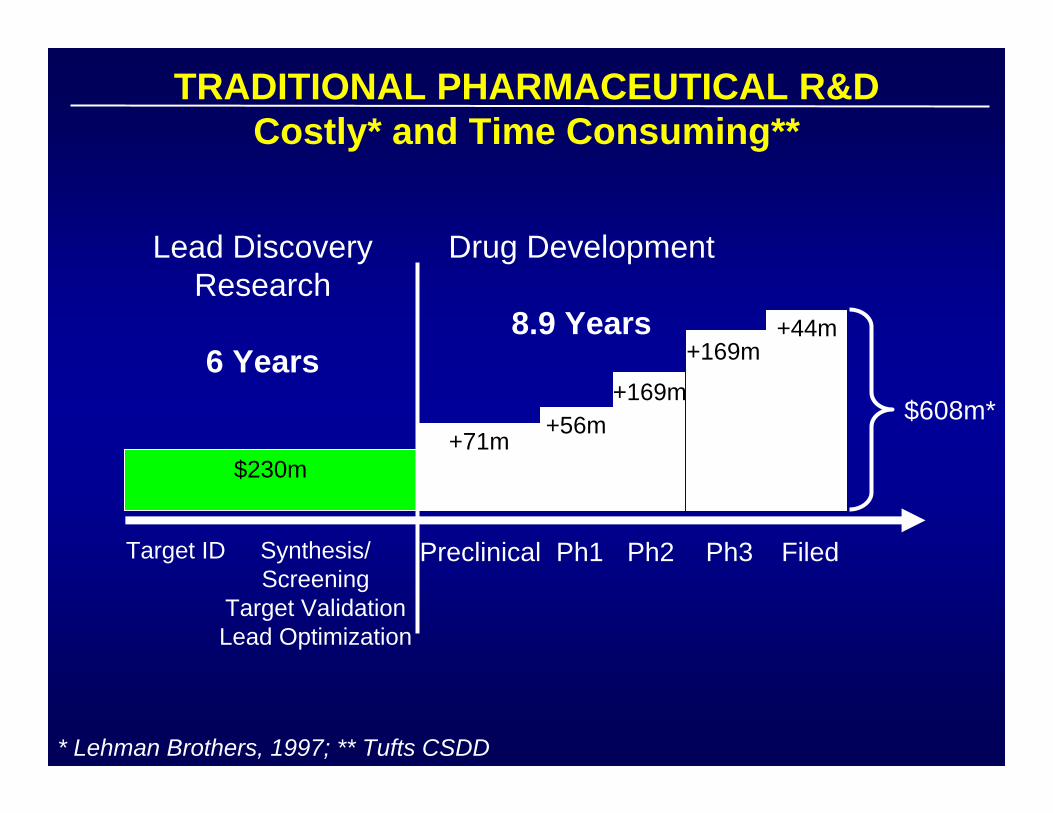
TRADITIONAL PHARMACEUTICAL R&DCostly* and Time Consuming**
* Lehman Brothers, 1997; ** Tufts CSDD
Target ID Synthesis/Screening
Target ValidationLead Optimization
Preclinical Ph1 Ph2 Ph3 Filed
Lead DiscoveryResearch
6 Years
Drug Development
8.9 Years
$230m+71m
+56m+169m
+169m+44m
$608m*
OUTLINE OF PRESENTATION
• General Introduction
• Definition of Drug Targets
• Generating Diversity
• Definition of Lead Structures
• Qualifying Lead for Transition to Early Trials
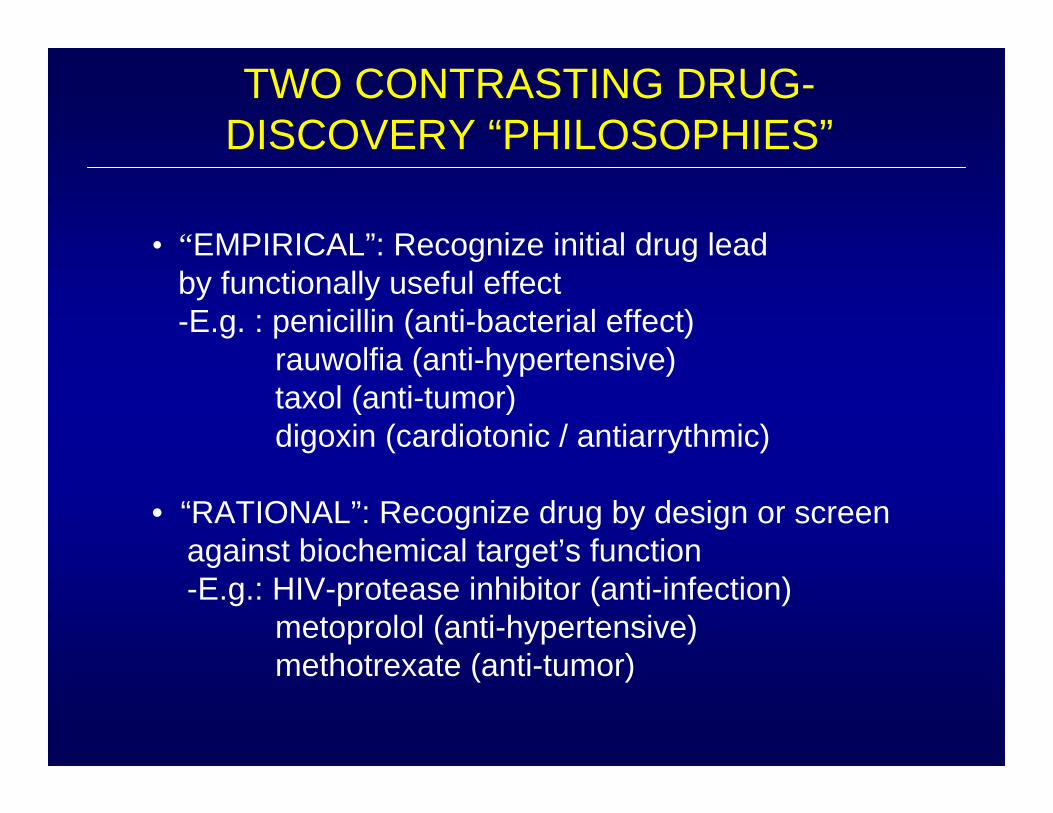
TWO CONTRASTING DRUG-DISCOVERY “PHILOSOPHIES”
• “EMPIRICAL”: Recognize initial drug leadby functionally useful effect-E.g. : penicillin (anti-bacterial effect)
rauwolfia (anti-hypertensive)taxol (anti-tumor)digoxin (cardiotonic / antiarrythmic)
• “RATIONAL”: Recognize drug by design or screenagainst biochemical target’s function-E.g.: HIV-protease inhibitor (anti-infection)
metoprolol (anti-hypertensive)methotrexate (anti-tumor)
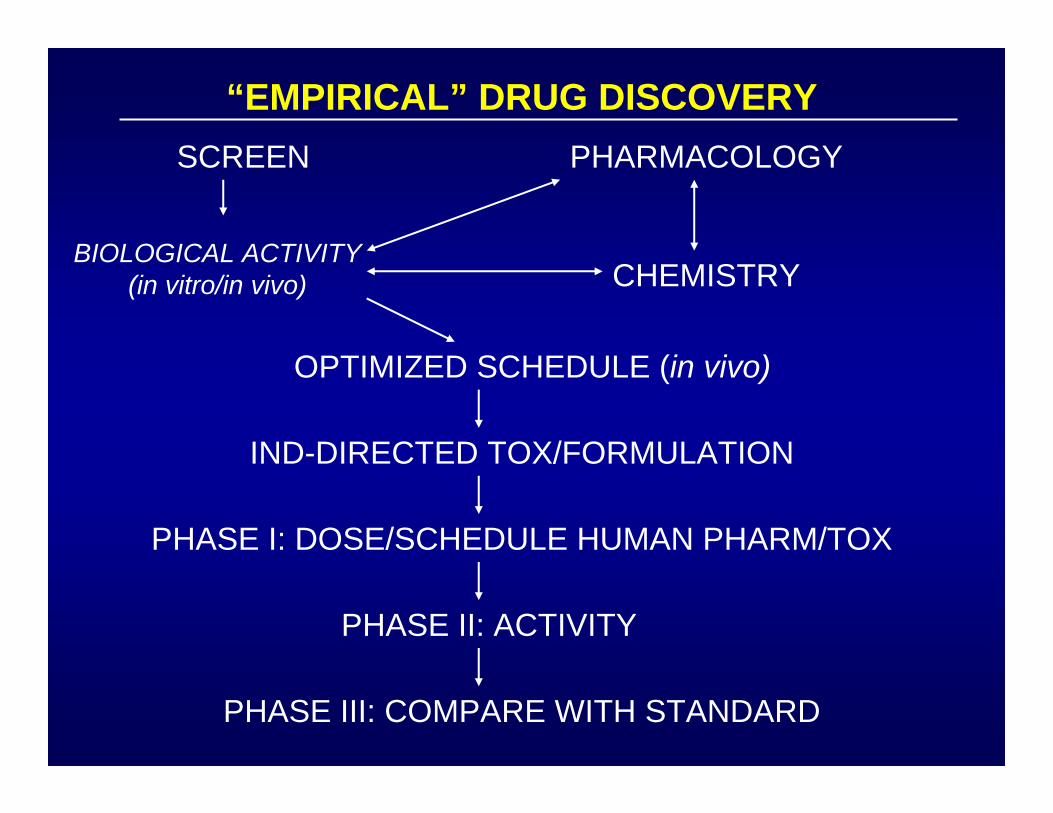
“EMPIRICAL” DRUG DISCOVERYSCREEN
BIOLOGICAL ACTIVITY(in vitro/in vivo)
PHARMACOLOGY
CHEMISTRY
OPTIMIZED SCHEDULE (in vivo)
IND-DIRECTED TOX/FORMULATION
PHASE I: DOSE/SCHEDULE HUMAN PHARM/TOX
PHASE II: ACTIVITY
PHASE III: COMPARE WITH STANDARD
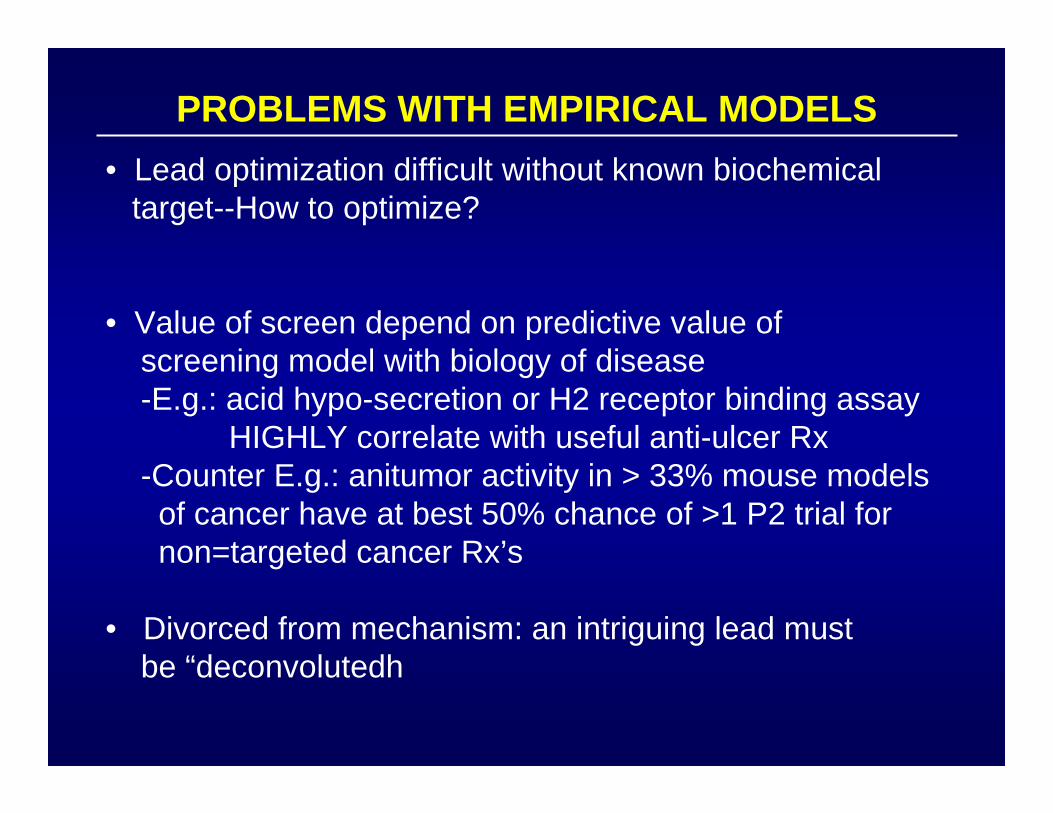
PROBLEMS WITH EMPIRICAL MODELS• Lead optimization difficult without known biochemical
target--How to optimize?
• Value of screen depend on predictive value ofscreening model with biology of disease-E.g.: acid hypo-secretion or H2 receptor binding assay
HIGHLY correlate with useful anti-ulcer Rx-Counter E.g.: anitumor activity in > 33% mouse modelsof cancer have at best 50% chance of >1 P2 trial fornon=targeted cancer Rx’s
• Divorced from mechanism: an intriguing lead mustbe “deconvolutedh
N
N
N
NH
O
OHHO
NHHOOH
Me( CH2)8CH=CHCH=CHC(O)NHCH2C(O)NH
N
N
N
NH
O
OHHO
NHHOOH
Me( CH2)8CH=CHCH=CHC(O)NHCH2C(O)NH
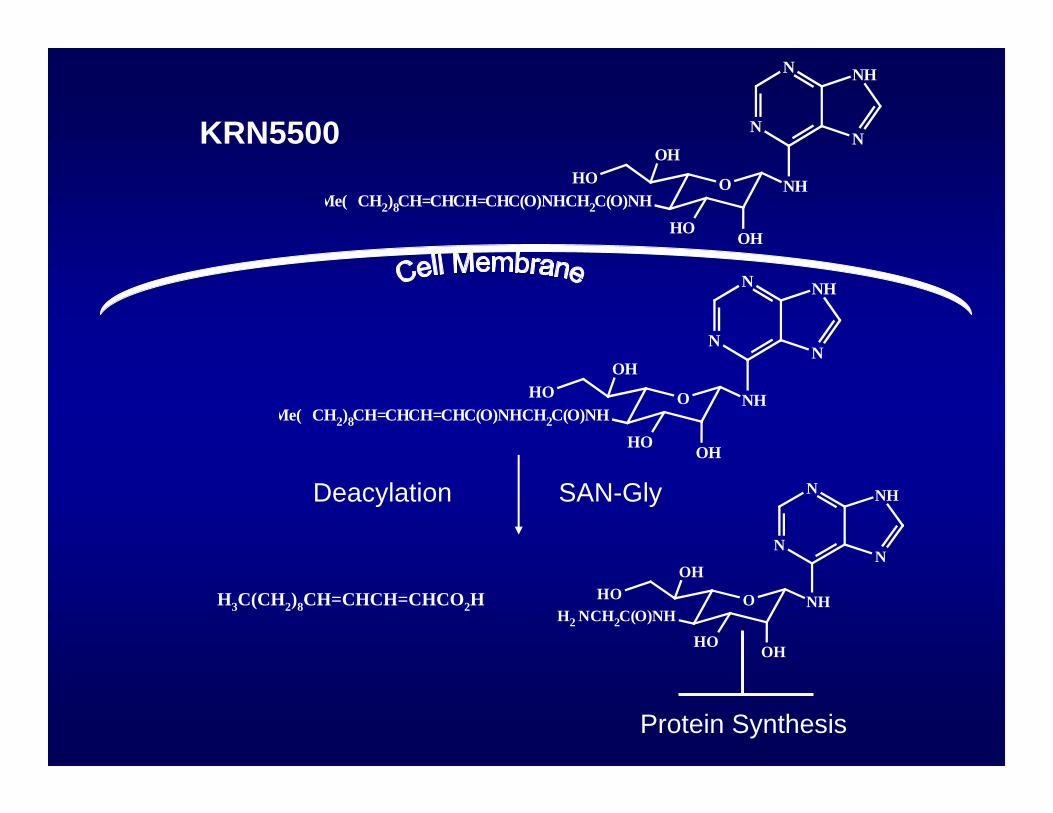
KRN5500
N
N
N
NH
O
OHHO
NHHOOH
H2 NCH2C(O)NHH3C(CH2)8CH=CHCH=CHCO2H
Deacylation SAN-Gly
Protein Synthesis
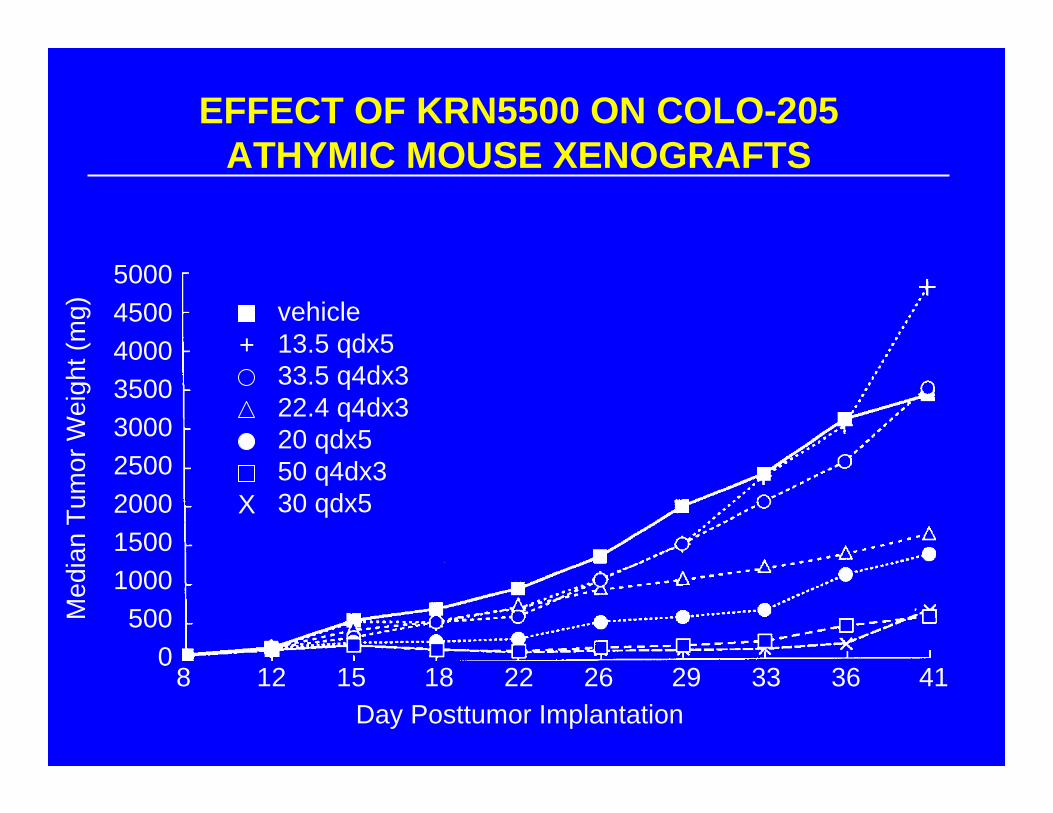
EFFECT OF KRN5500 ON COLO-205 ATHYMIC MOUSE XENOGRAFTS
Med
ian
Tum
or W
eigh
t (m
g)
Day Posttumor Implantation
500045004000350030002500200015001000500
08 12 15 18 22 26 29 33 36 41
vehicle13.5 qdx533.5 q4dx322.4 q4dx320 qdx550 q4dx330 qdx5
+
X
0.1
1
10
0 1 2 3 4 5
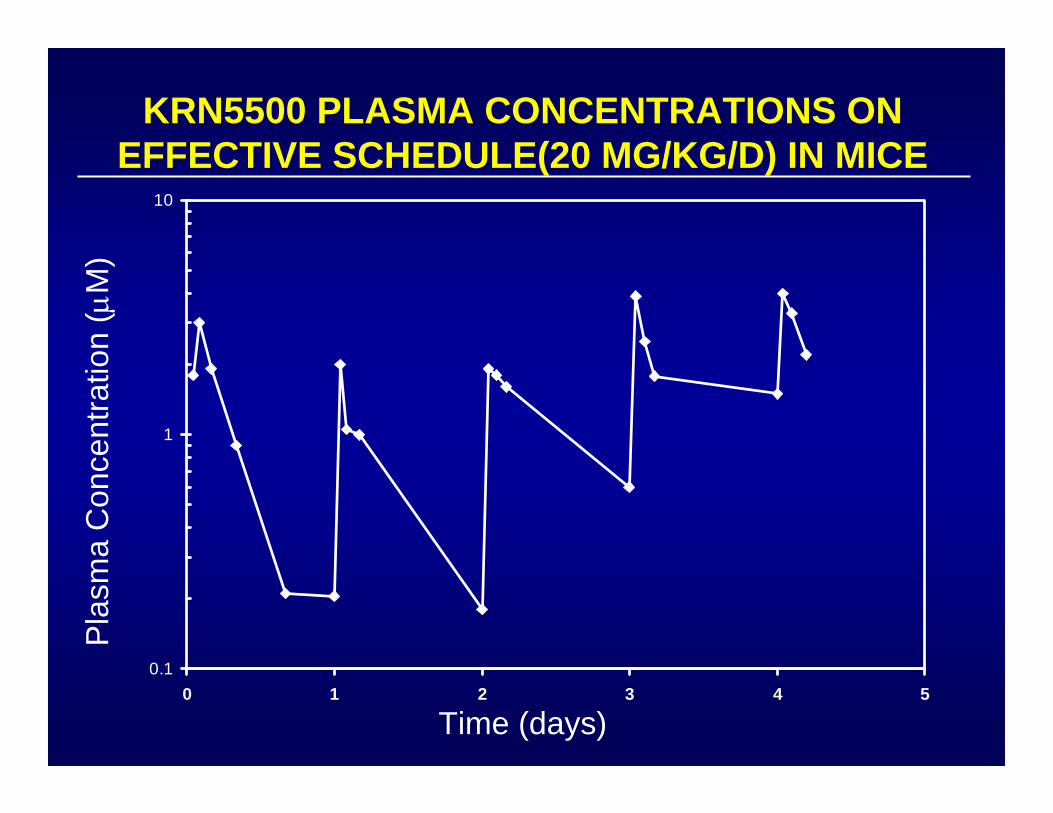
KRN5500 PLASMA CONCENTRATIONS ON EFFECTIVE SCHEDULE(20 MG/KG/D) IN MICE
Pla
sma
Con
cent
ratio
n (μ
M)
Time (days)

SUMMARY OF KRN-5500 PHASE I
• 26 patients as IV once per day over 5 days
• Dose limiting toxicity = interstitial pneumonitis
• MTD = 2.9 mg/M2/d x 5
• Achieve only 0.75 - 1 μM at 3.7 mg/M2/d x 5
• 4/6 patients with >25% incr Cmax havegrade 4 toxicity
Data of J. P. Eder, DFCI
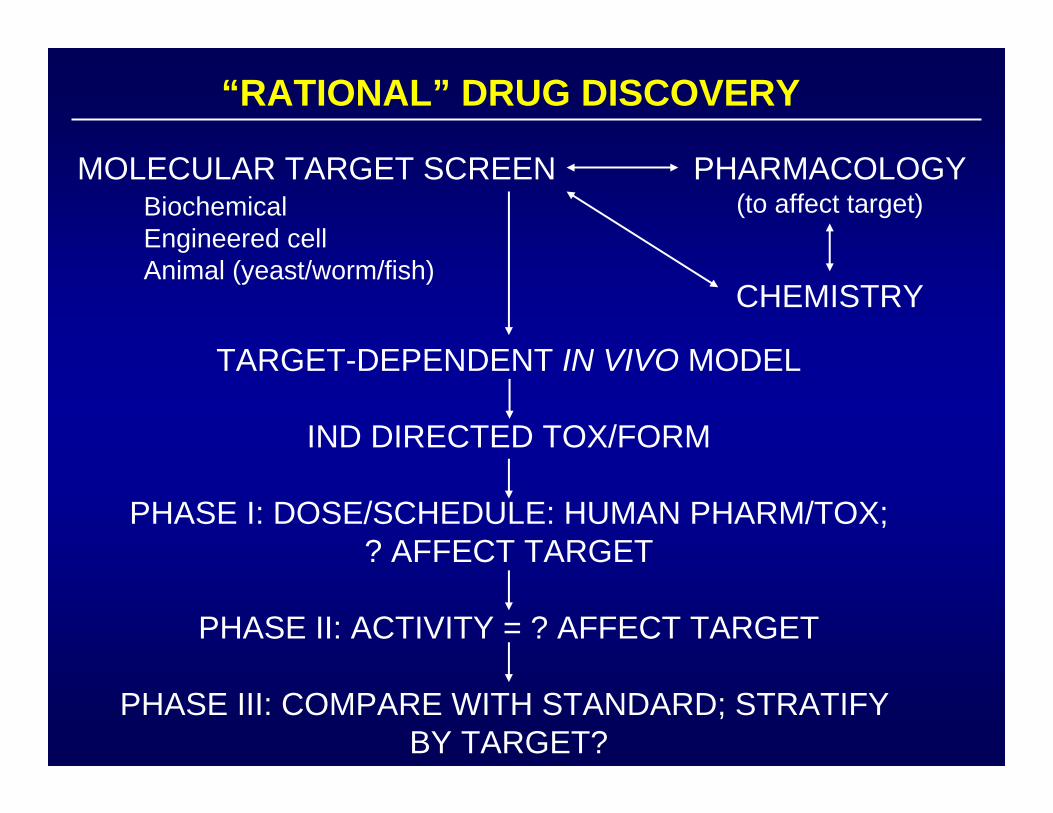
“RATIONAL” DRUG DISCOVERY
TARGET-DEPENDENT IN VIVO MODEL
IND DIRECTED TOX/FORM
PHASE I: DOSE/SCHEDULE: HUMAN PHARM/TOX;? AFFECT TARGET
PHASE II: ACTIVITY = ? AFFECT TARGET
PHASE III: COMPARE WITH STANDARD; STRATIFY BY TARGET?
PHARMACOLOGY(to affect target)
CHEMISTRY
MOLECULAR TARGET SCREENBiochemicalEngineered cellAnimal (yeast/worm/fish)
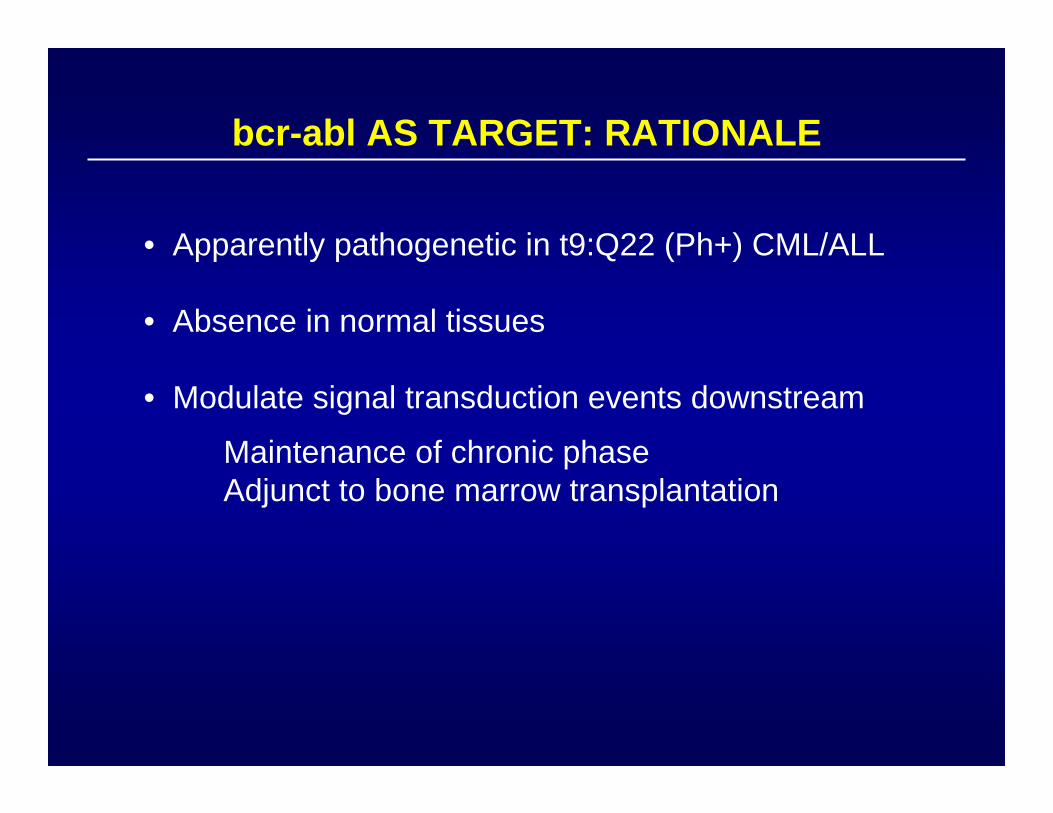
bcr-abl AS TARGET: RATIONALE
• Apparently pathogenetic in t9:Q22 (Ph+) CML/ALL
• Absence in normal tissues
• Modulate signal transduction events downstream
Maintenance of chronic phaseAdjunct to bone marrow transplantation
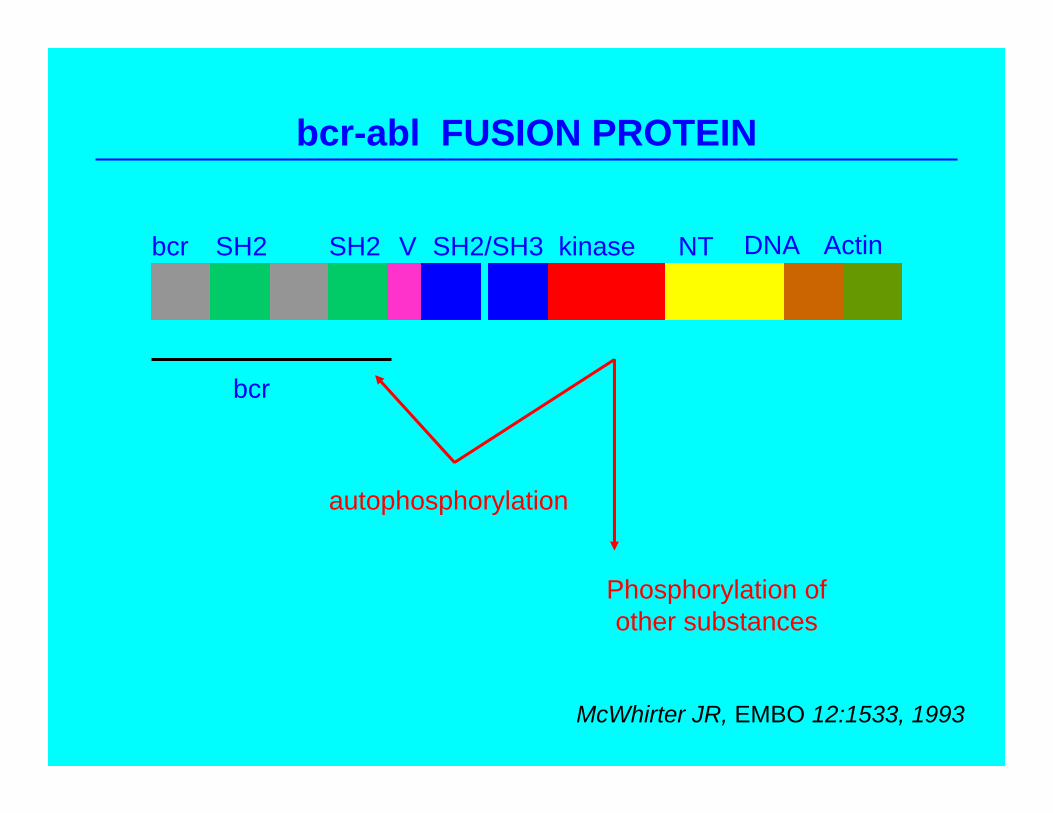
bcr-abl FUSION PROTEIN
bcr SH2 SH2 V SH2/SH3 kinase NT DNA Actin
bcr
autophosphorylation
Phosphorylation ofother substances
McWhirter JR, EMBO 12:1533, 1993
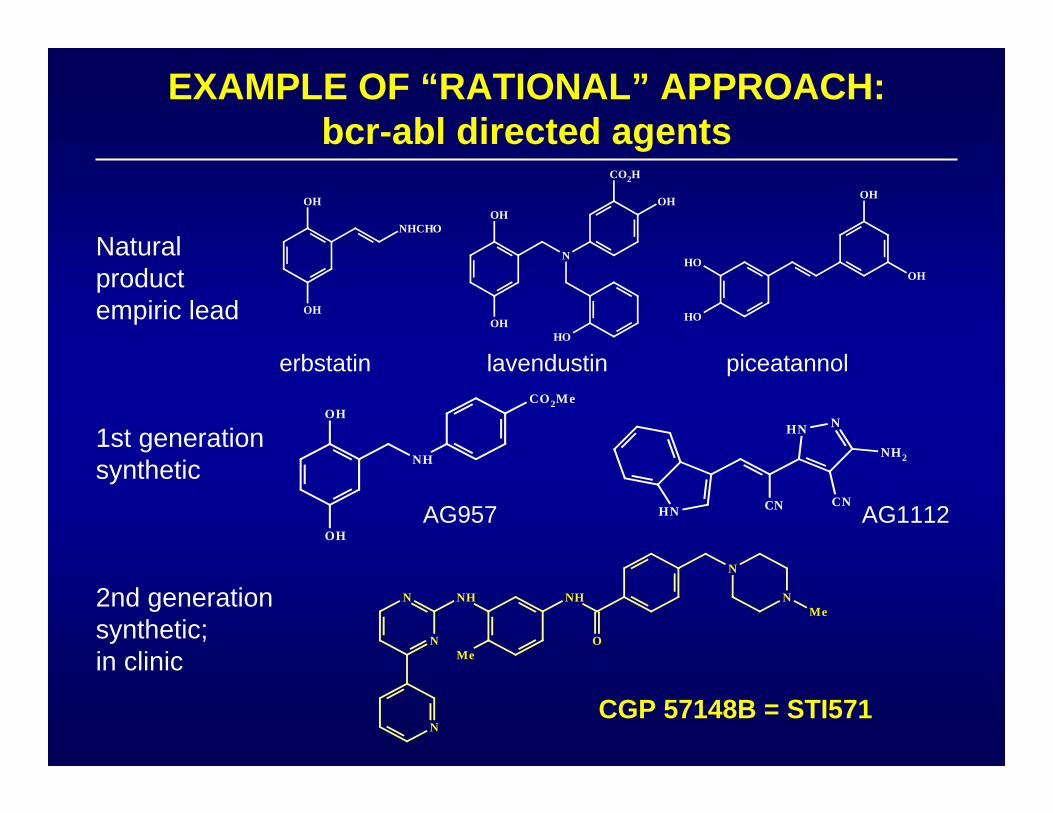
EXAMPLE OF “RATIONAL” APPROACH:bcr-abl directed agents
OH
OH
NHCHOOH
OH
N
HO
OH
CO2H
HO
HO
OH
OH
OH
OH
NH
CO2Me
HN CN
NHN
CN
NH2
N
N
N
NH NH
O
N
NMe
Me
erbstatin lavendustin piceatannol
AG957 AG1112
CGP 57148B = STI571
Naturalproductempiric lead
1st generationsynthetic
2nd generationsynthetic;in clinic

00.20.40.60.8
11.21.41.61.8
0 5 10 15 20
Tum
or W
eigh
t (g) control mice 3x160 mg/kg oral
STI571: An oral in vivo bcr-abl kinase inhibitor
N
N
N
NH NH O
Me
N
NMe
Tyr phosphorylation in vivo
le Coutre et al, JNCI 91:163, 1999
Antitumor activity in vivo
0
20
40
60
80
100
120
0 1 2 3 4 5 6 7 8 9
% P
hosp
hory
latio
n
Intraperitoneal Oral
0102030405060708090
100
0 10 20 30 40 50 60
% T
umor
Fre
e Su
rviv
al
KU812 control mice U937 control miceKU812 3x50 mg/kg i.p. U937 3x50 mg/kg i.p.KU812 3x160 mg/kg oral U937 3x160 mg/kg oral
(hrs)(days)
(days)
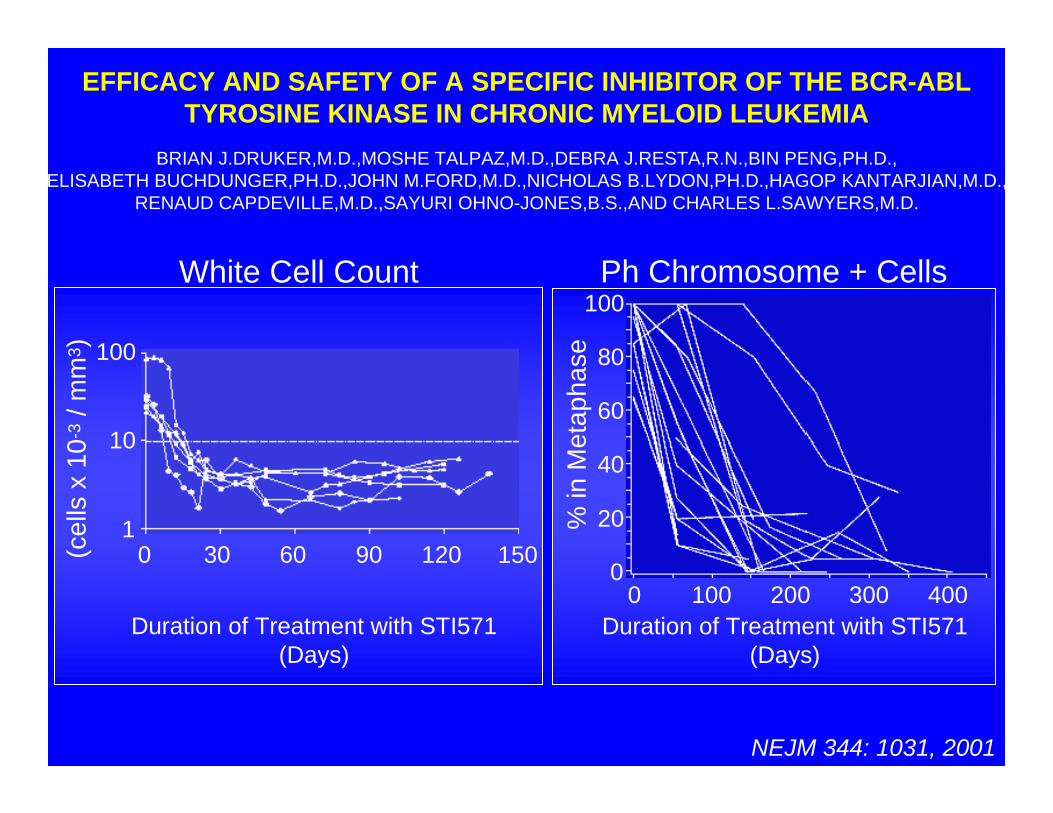
NEJM 344: 1031, 2001
EFFICACY AND SAFETY OF A SPECIFIC INHIBITOR OF THE BCR-ABLTYROSINE KINASE IN CHRONIC MYELOID LEUKEMIA
BRIAN J.DRUKER,M.D.,MOSHE TALPAZ,M.D.,DEBRA J.RESTA,R.N.,BIN PENG,PH.D.,ELISABETH BUCHDUNGER,PH.D.,JOHN M.FORD,M.D.,NICHOLAS B.LYDON,PH.D.,HAGOP KANTARJIAN,M.D.,
RENAUD CAPDEVILLE,M.D.,SAYURI OHNO-JONES,B.S.,AND CHARLES L.SAWYERS,M.D.
% in
Met
apha
se0 100 200 300 400
100
80
60
40
20
0
Ph Chromosome + Cells
Duration of Treatment with STI571(Days)
White Cell Count
(cel
ls x
10-
3/ m
m3 )
0 30 60 90 120 150
100
10
1
Duration of Treatment with STI571(Days)
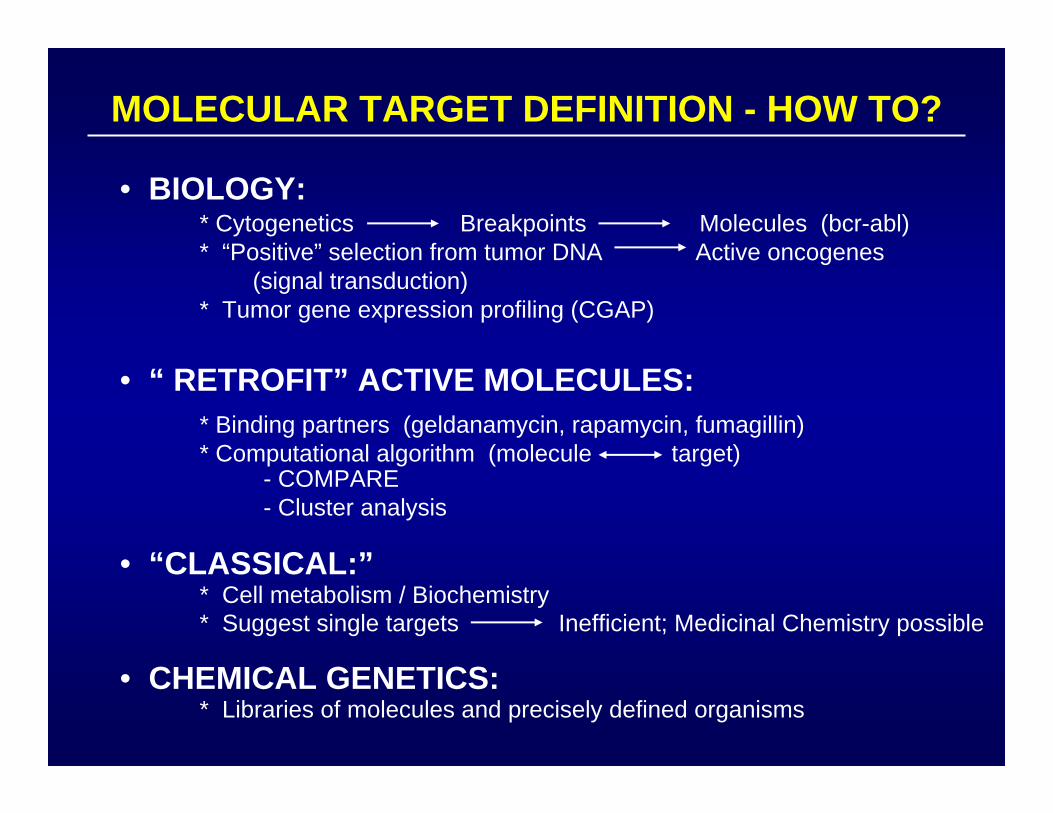
* Cytogenetics Breakpoints Molecules (bcr-abl)* “Positive” selection from tumor DNA Active oncogenes
(signal transduction)* Tumor gene expression profiling (CGAP)
* Binding partners (geldanamycin, rapamycin, fumagillin)* Computational algorithm (molecule target)
* Cell metabolism / Biochemistry* Suggest single targets Inefficient; Medicinal Chemistry possible
* Libraries of molecules and precisely defined organisms
MOLECULAR TARGET DEFINITION - HOW TO?
• BIOLOGY:
• “ RETROFIT” ACTIVE MOLECULES:
• “CLASSICAL:”
• CHEMICAL GENETICS:
- COMPARE- Cluster analysis
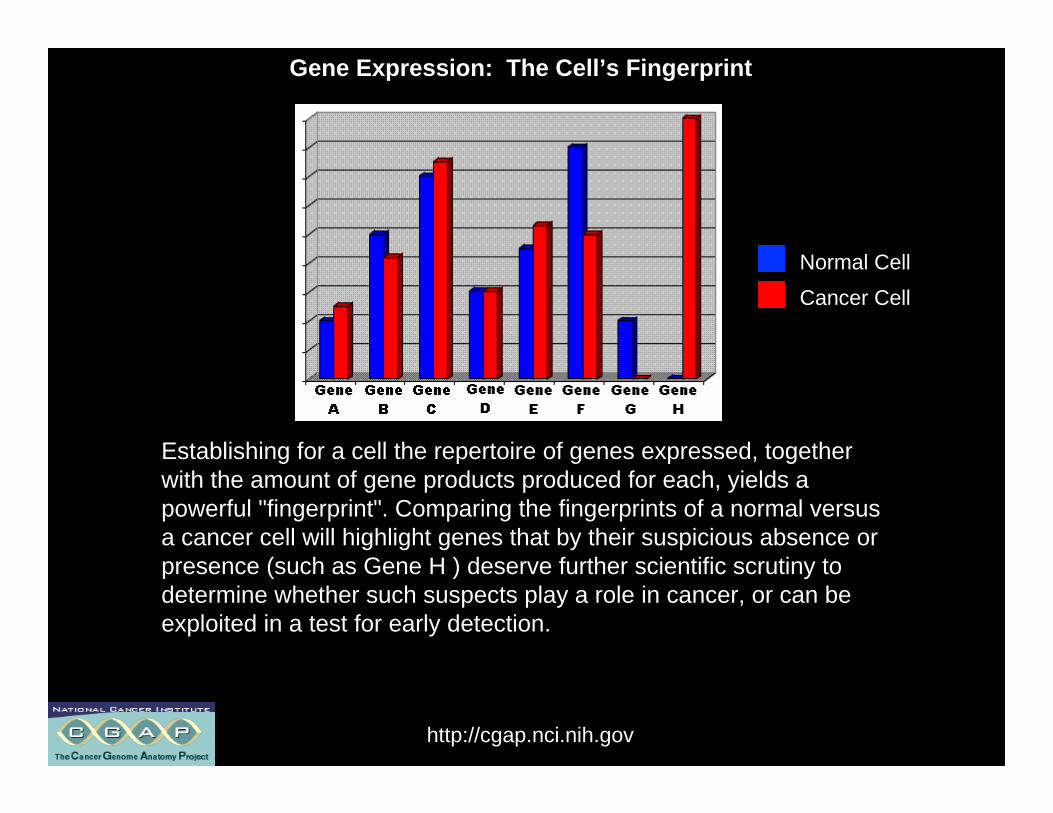
Establishing for a cell the repertoire of genes expressed, togetherwith the amount of gene products produced for each, yields apowerful "fingerprint". Comparing the fingerprints of a normal versusa cancer cell will highlight genes that by their suspicious absence orpresence (such as Gene H ) deserve further scientific scrutiny todetermine whether such suspects play a role in cancer, or can beexploited in a test for early detection.
Normal Cell
Cancer Cell
Gene Expression: The Cell’s Fingerprint
http://cgap.nci.nih.gov
http://cgap.nci.nih.gov/

Distinct types of diffuse large B-cell lymphoma identified by gene expression profiling
Alizadeh et al, Nature 403: 503, 2000
Overall survival (yrs)
Prob
abilit
yGC B-like DLBCL Activated B-like DLBCL
All patients
All patients Low clinical risk pts
Prob
abilit
y
Overall survival (yrs)
Low clinical risk
High clinical risk
P=0.002
GC B-like
Activated B-like
P=0.05
GC B-like
Activated B-like
P=0.01

Geldanamycin
17-AAG
122750
330507
OMe
NHCH2CH=CH2
RNSC
GELDANAMYCIN: EXAMPLE OF BINDING PARTNER DEFINING TARGET
O
O
R
NH
O
OCONH2
OH
O
MeO
Me
carbamateansa ring
benzoquinone

BENZOQUINOID ANSAMYCINSINITIAL CELL PHARMACOLOGY - I
• “Reverse” transformed phenotype of src-transformed rat kidney cell line– decrease tyrosine phosphorylation of pp60src– not inhibit pp60 immune complex kinase directly but
these were inhibited from drug-treated cells– thus alter “intracellular environment” of src
• Decrease steady state phosphorylation levels to 10% of control– decrease steady state level of pp60src by 30%– accelerate turnover of pp60src
(Uehara et al, MCB 6: 2198, 1986)
(Uehara et al, Cancer Res 49: 780, 1989)

Bead 18 Atom Spacer
O
O
R4
NH
O
Me
Me
R2
OMeMeMe
H2 NC(O)O
R1MeO

GELDANAMYCIN BEADSIDENTIFY HSP90 AS BINDING PARTNER
Neckers et al, PNAS 91:8324, 1994
1 2 3 4
p90
R. Lysate
1) Bead-Geld
2) Bead-Geld + Geld
3) Bead-Geld + Geldampicin
4) Bead
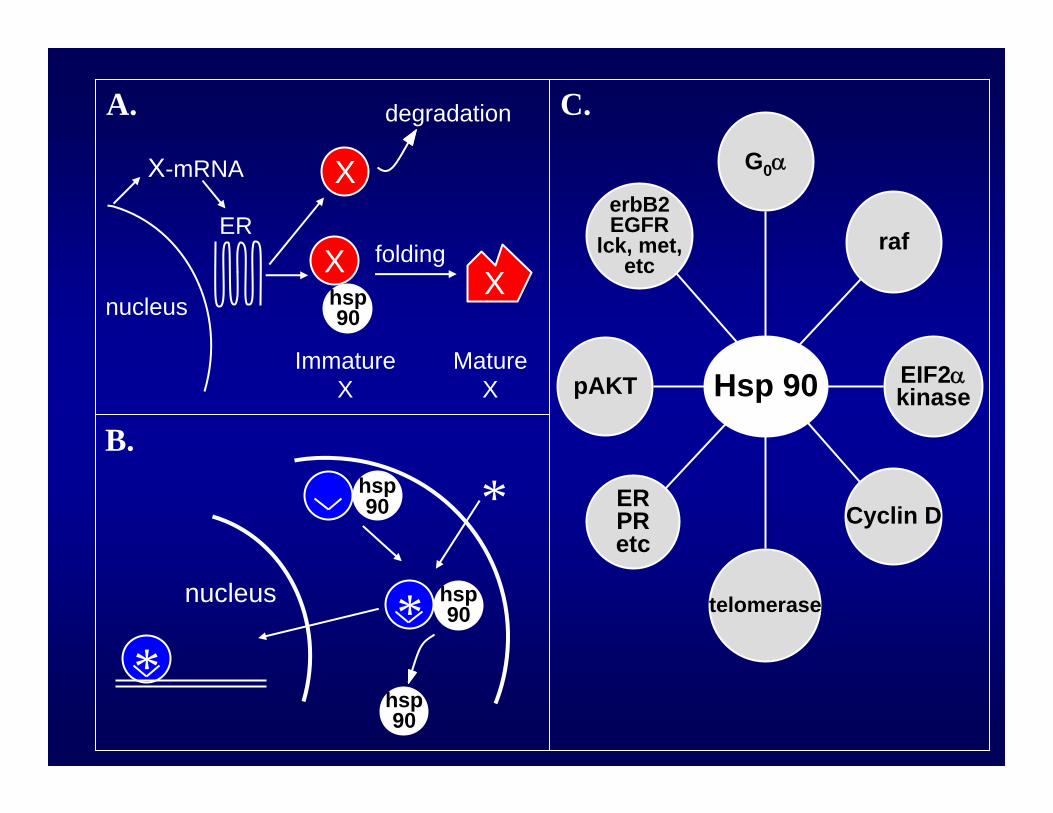
X
degradation
nucleus
Xhsp90
ImmatureX
MatureX
ERPRetc
Cyclin D
Hsp 90pAKT EIF2αkinase
raferbB2EGFR
lck, met,etc
nucleus hsp90
*
X
*
A.
B.
C.
ERfolding
G0α
telomerase
hsp90
*hsp90
X-mRNA

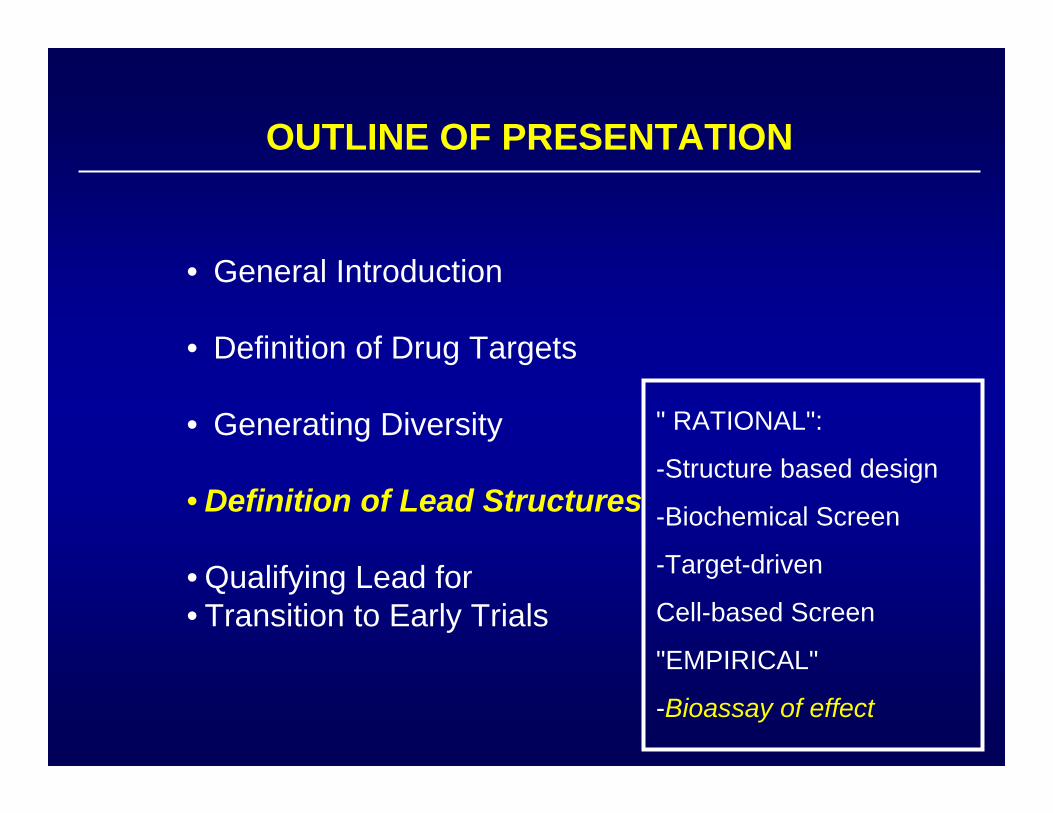
OUTLINE OF PRESENTATION
• General Introduction
• Definition of Drug Targets
• Generating Diversity
• Definition of Lead Structures
• Qualifying Lead for Transition to Early Trials
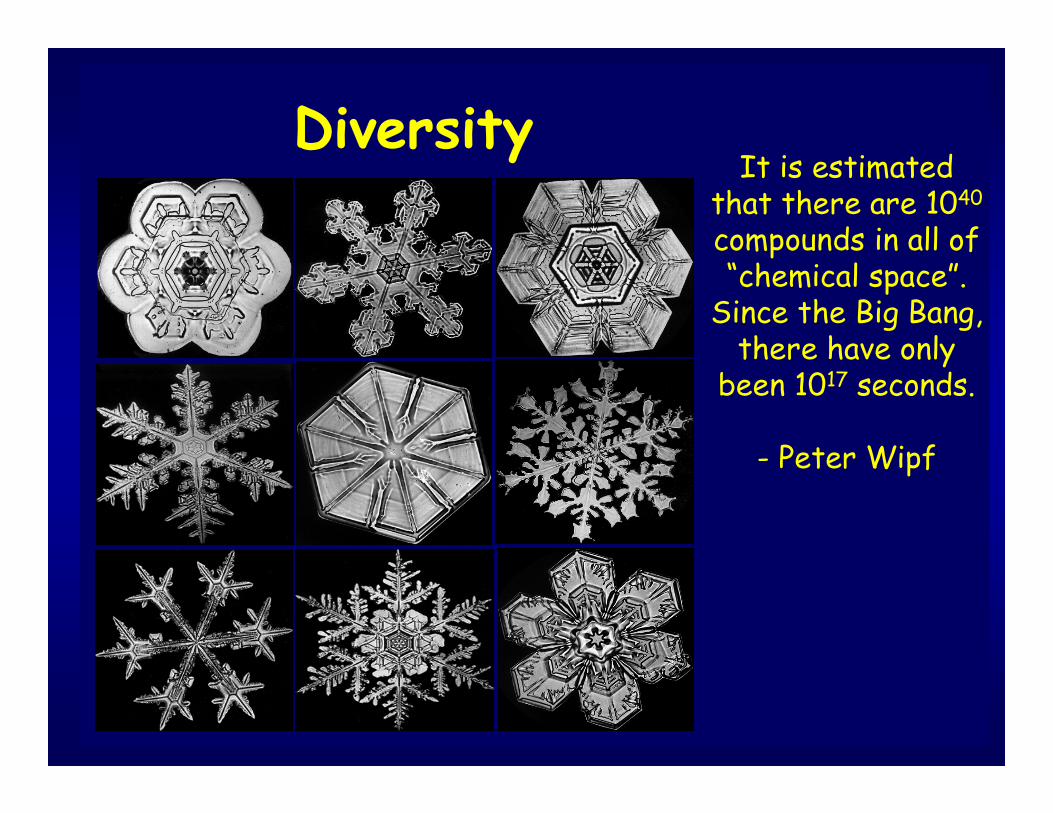
DiversityIt is estimated
that there are 1040
compounds in all of “chemical space”.
Since the Big Bang, there have only
been 1017 seconds.
- Peter Wipf
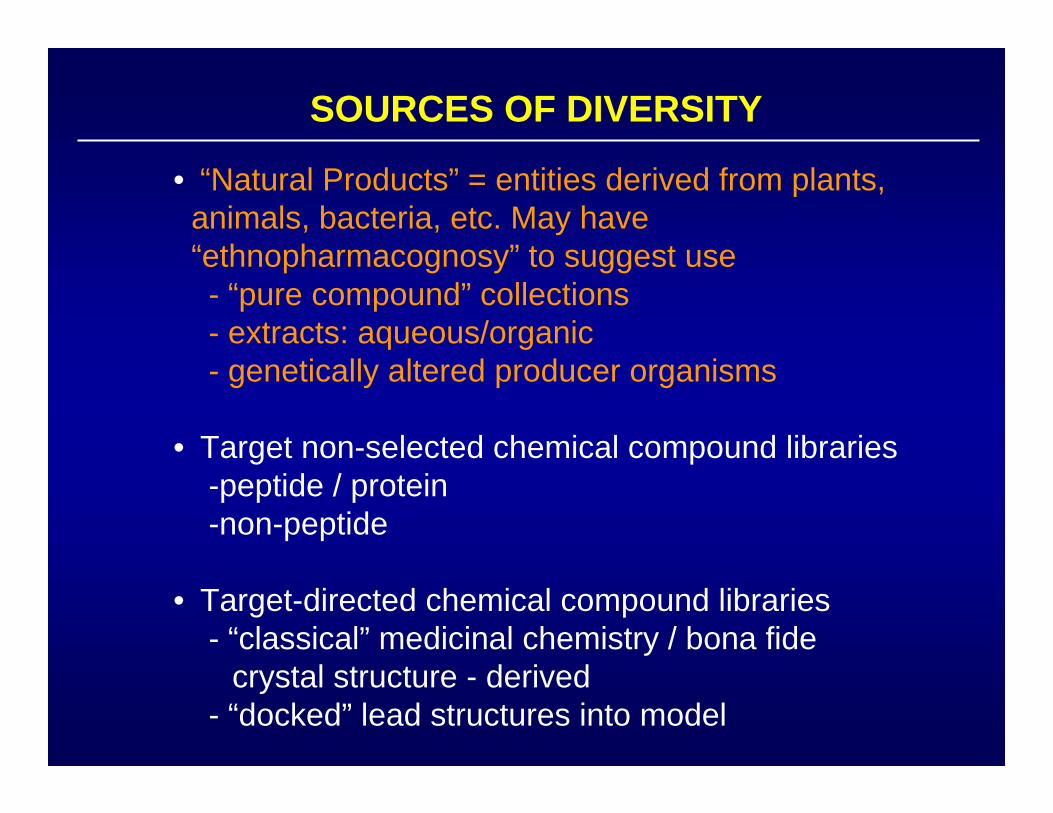
SOURCES OF DIVERSITY
• “Natural Products” = entities derived from plants, animals, bacteria, etc. May have “ethnopharmacognosy” to suggest use- “pure compound” collections- extracts: aqueous/organic- genetically altered producer organisms
• Target non-selected chemical compound libraries-peptide / protein-non-peptide
• Target-directed chemical compound libraries- “classical” medicinal chemistry / bona fide
crystal structure - derived- “docked” lead structures into model
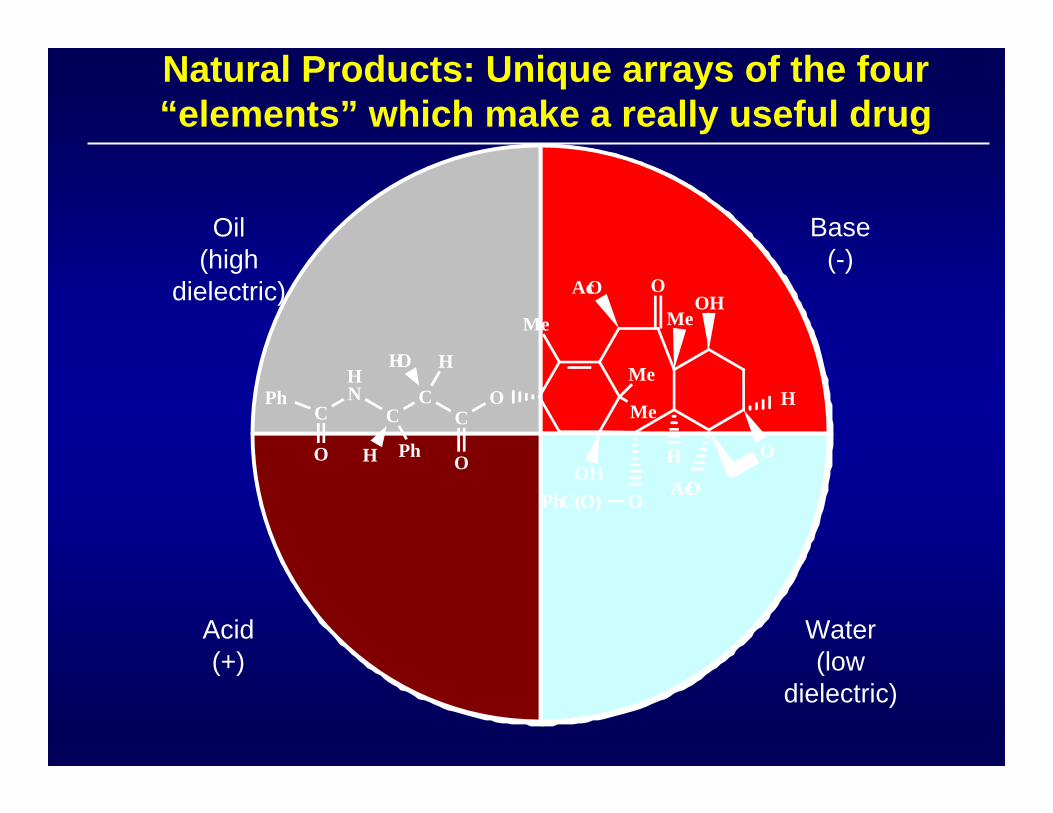
Natural Products: Unique arrays of the four “elements” which make a really useful drug
PhC
O
HN
H
C
HO
Ph
C
H
C
O
O
Me
Ph
AcO
C(O)OH
O
Me
Me
O
AcO
H
MeOH
O
H
Oil(high
dielectric)
Water(low
dielectric)
Acid(+)
Base(-)
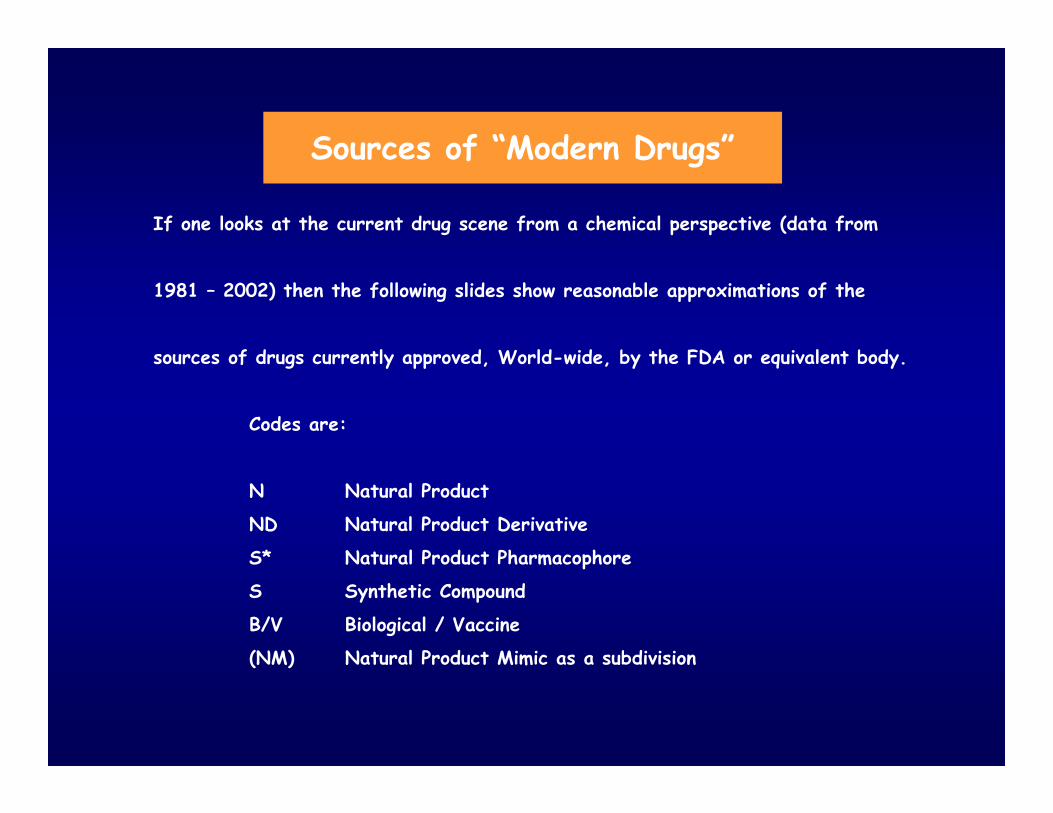
Sources of “Modern Drugs”
If one looks at the current drug scene from a chemical perspective (data from
1981 – 2002) then the following slides show reasonable approximations of the
sources of drugs currently approved, World-wide, by the FDA or equivalent body.
Codes are:
N Natural Product
ND Natural Product Derivative
S* Natural Product Pharmacophore
S Synthetic Compound
B/V Biological / Vaccine
(NM) Natural Product Mimic as a subdivision

Sources of Drugs (1981-2002); Extended Subdivisions n = 1031
B12% N
5%
ND23%
S33%
S/NM10%
S*4%
S*/NM10%
V3%
B
N
ND
S
S/NM
S*
S*/NM
V
Newman et al, J. Nat. Prod., 2003, 66, 1027-1037
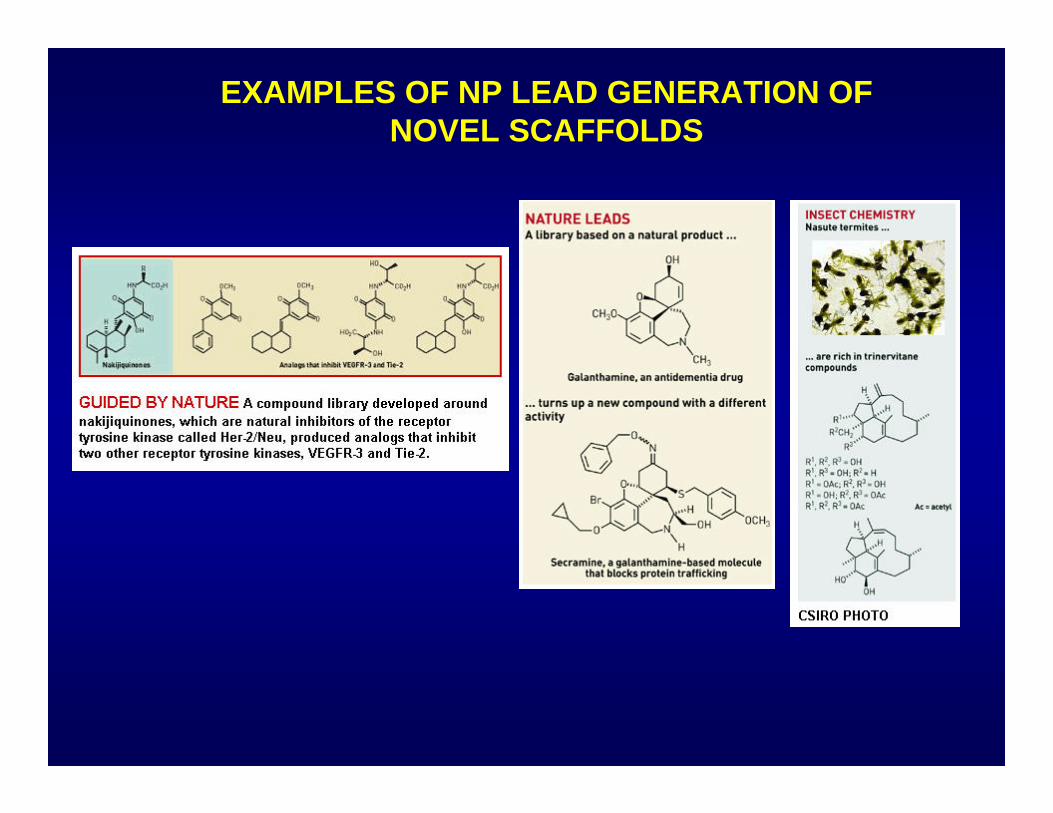
EXAMPLES OF NP LEAD GENERATION OF NOVEL SCAFFOLDS
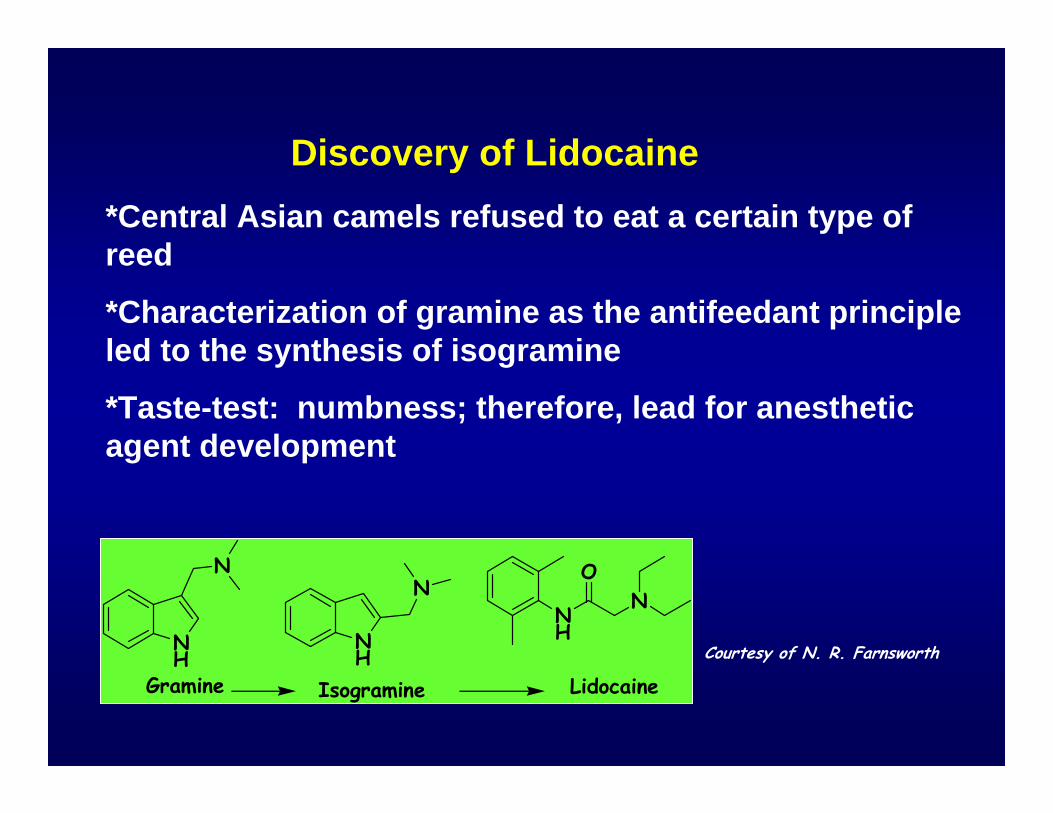
Discovery of Lidocaine*Central Asian camels refused to eat a certain type of reed
*Characterization of gramine as the antifeedant principle led to the synthesis of isogramine
*Taste-test: numbness; therefore, lead for anesthetic agent development
NH
NH
NN
NH
ON
Gramine Isogramine LidocaineCourtesy of N. R. Farnsworth
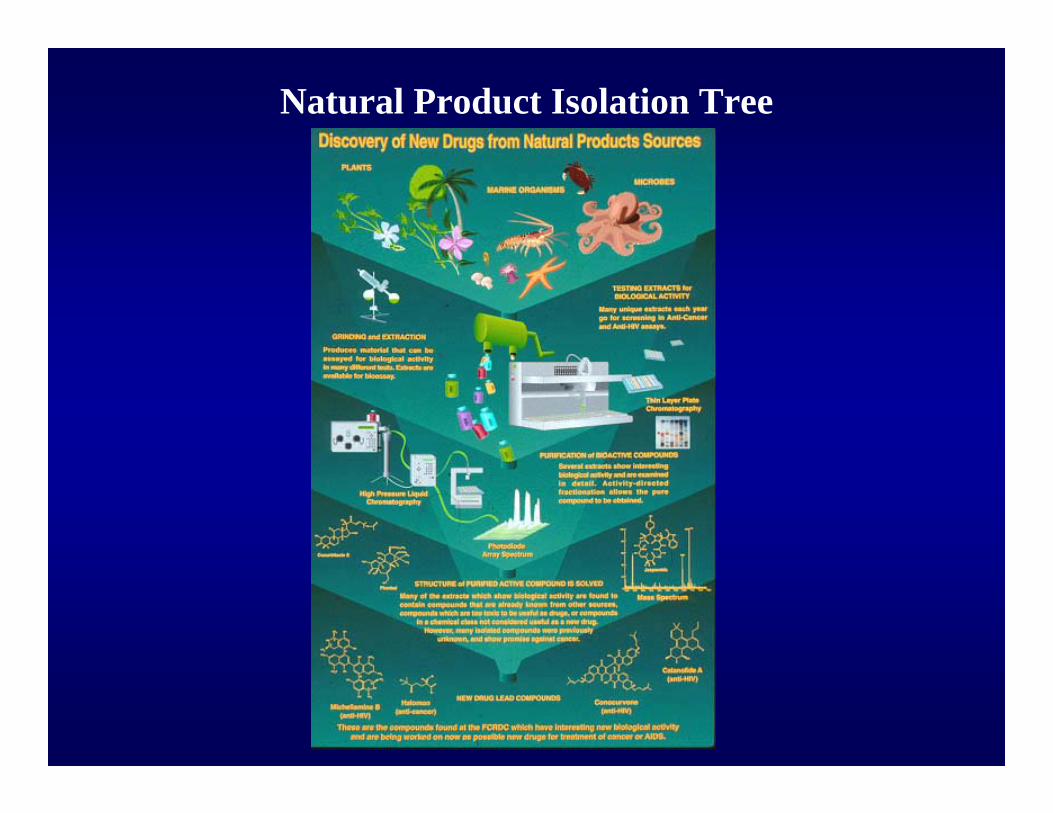
Natural Product Isolation Tree
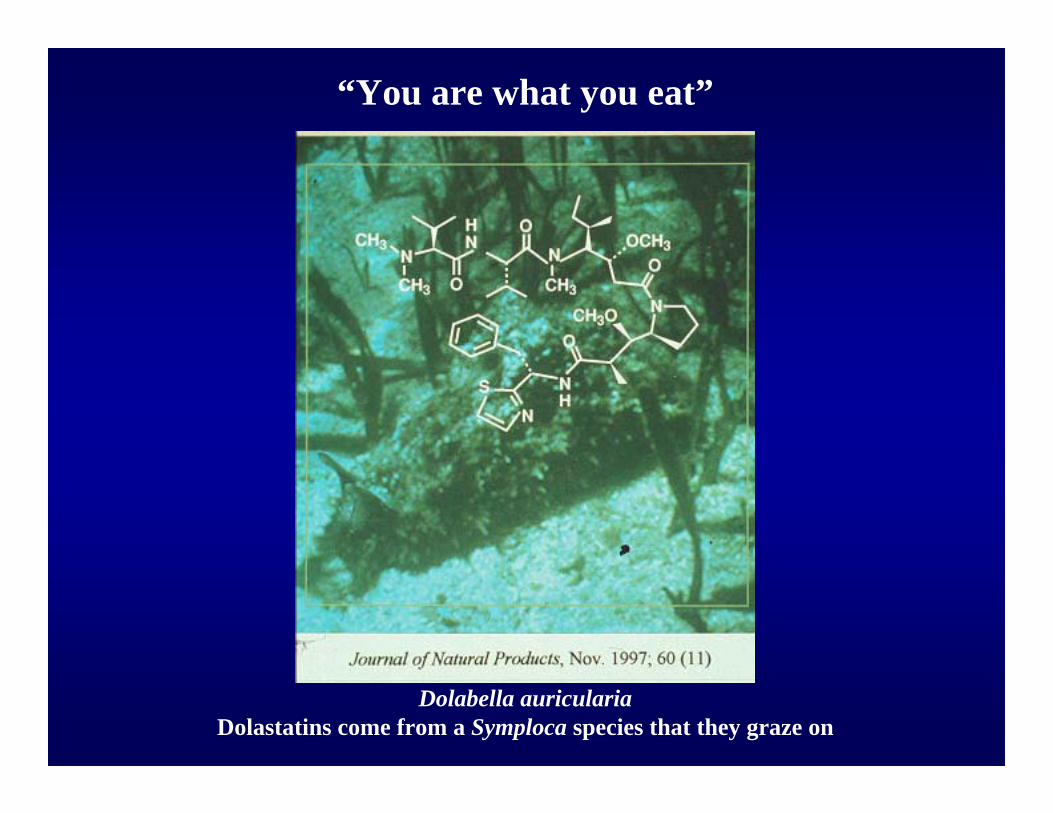
“You are what you eat”
Dolabella auriculariaDolastatins come from a Symploca species that they graze on
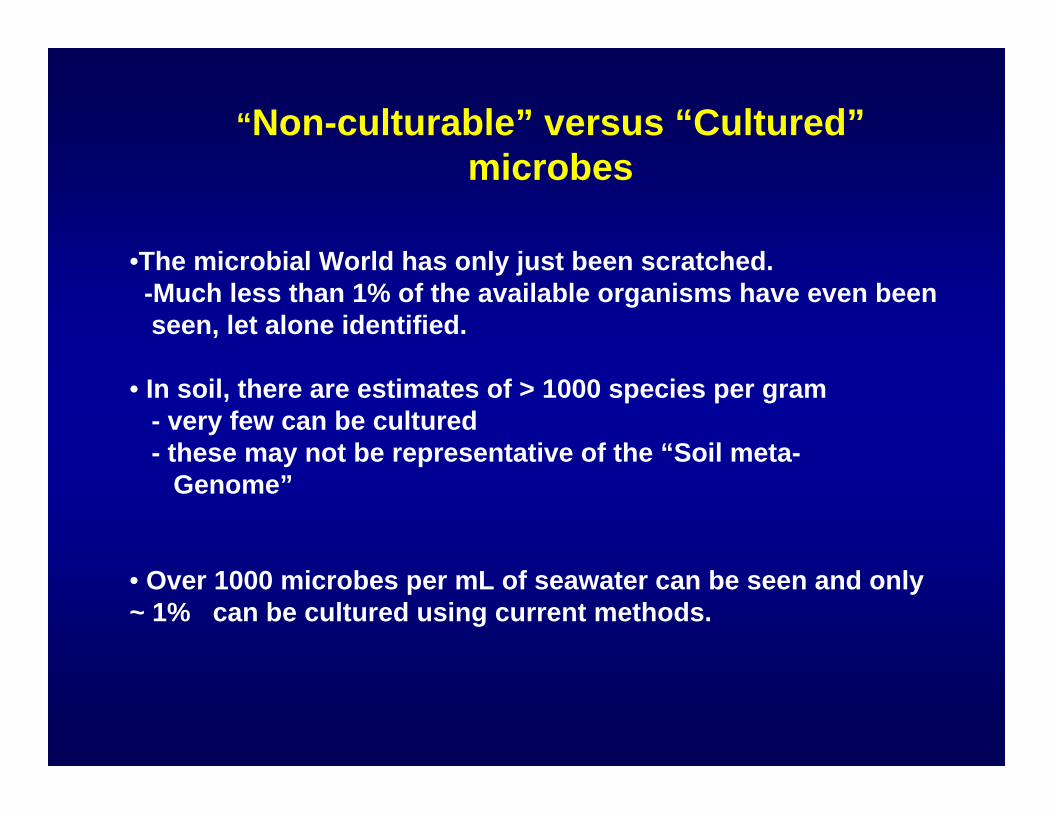
“Non-culturable” versus “Cultured”microbes
•The microbial World has only just been scratched. -Much less than 1% of the available organisms have even beenseen, let alone identified.
• In soil, there are estimates of > 1000 species per gram - very few can be cultured- these may not be representative of the “Soil meta-
Genome”
• Over 1000 microbes per mL of seawater can be seen and only ~ 1% can be cultured using current methods.

SOURCES OF DIVERSITY
• “Natural Products” = entities derived from plants, animals, bacteria, etc. May have “ethnopharmacognosy” to suggest use- “pure compound” collections- extracts: aqueous/organic- genetically altered producer organisms
• Target non-selected chemical compound libraries-peptide / protein-non-peptide
• Target-directed chemical compound libraries- “classical” medicinal chemistry / bona fide
crystal structure - derived- “docked” lead structures into model

TRIPEPTIDE COMBINATORIAL LIBRARY
after R. Houghten, 1999
X X X
Four amino acids in each position43 = 64
A = AlanineR = ArginineT = ThreonineW = Tryptophan

NUMBER OF PEPTIDESPOSSIBLE WITH INCREASING LENGTH
after R. Houghten, 1999
Length Peptide Number
O = Individual Defined Amino Acid
2345678
4008,000
160,0003,200,000
64,000,0001,280,000,000
25,600,000,000
Ac – OO – NH2
Ac – OOO – NH2
Ac – OOOO – NH2
Ac – OOOOO – NH2
Ac – OOOOOO – NH2
Ac – OOOOOOO – NH2
Ac – OOOOOOOO – NH2
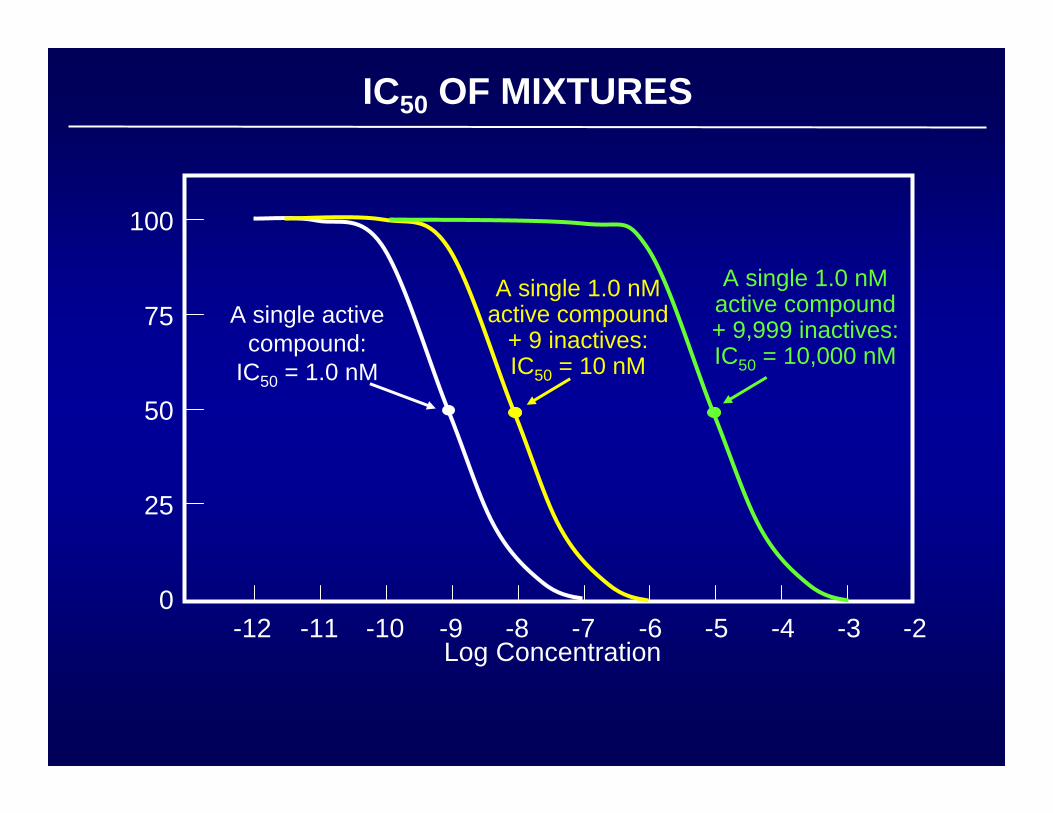
IC50 OF MIXTURES
Log Concentration
A single activecompound:
IC50 = 1.0 nM
A single 1.0 nMactive compound
+ 9 inactives:IC50 = 10 nM
A single 1.0 nMactive compound+ 9,999 inactives:IC50 = 10,000 nM
100
75
50
25
0-12 -10 -8 -6 -4 -2-11 -9 -7 -5 -3
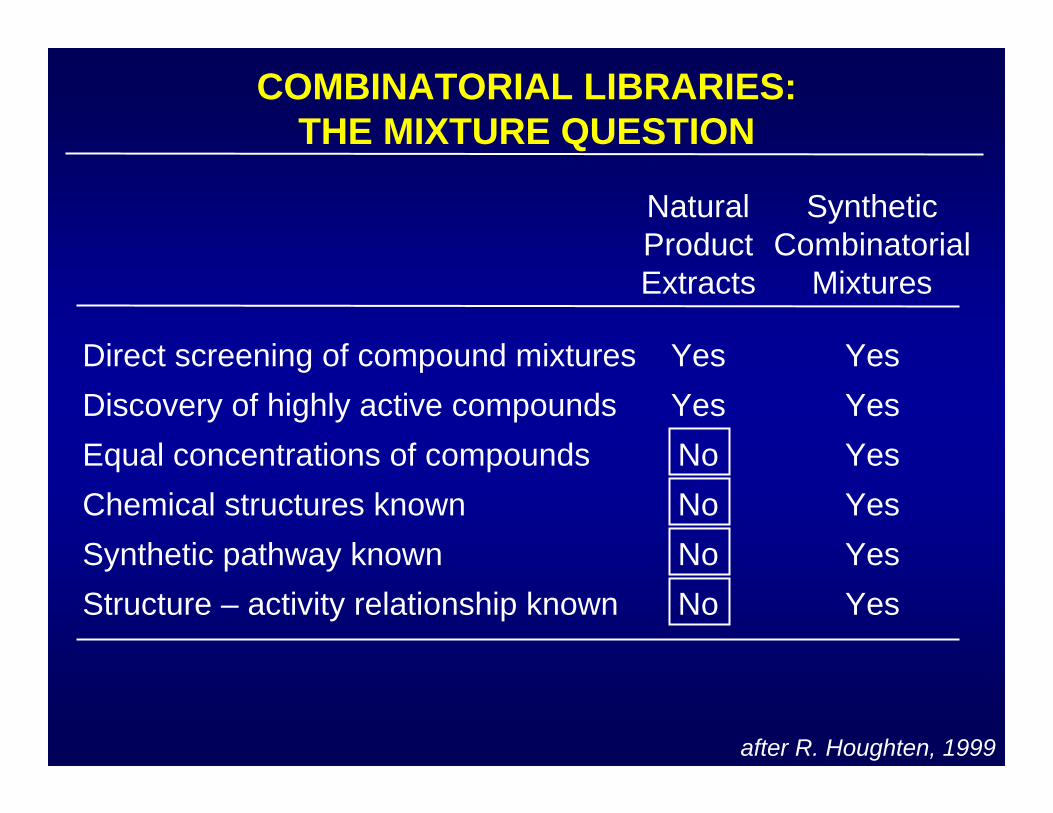
COMBINATORIAL LIBRARIES:THE MIXTURE QUESTION
after R. Houghten, 1999
NaturalProductExtracts
SyntheticCombinatorial
Mixtures
Direct screening of compound mixturesDiscovery of highly active compoundsEqual concentrations of compoundsChemical structures knownSynthetic pathway knownStructure – activity relationship known
YesYesYesYesYesYes
YesYesNoNoNoNo
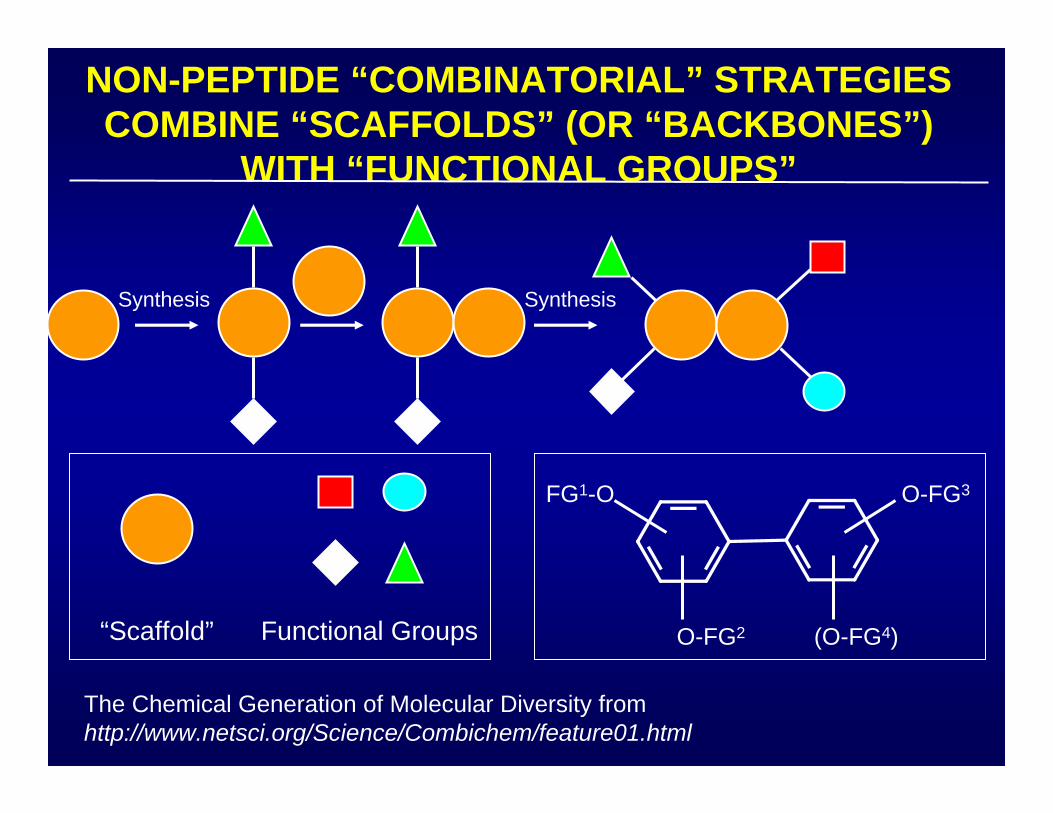
NON-PEPTIDE “COMBINATORIAL” STRATEGIESCOMBINE “SCAFFOLDS” (OR “BACKBONES”)
WITH “FUNCTIONAL GROUPS”
Synthesis Synthesis
“Scaffold” Functional Groups
The Chemical Generation of Molecular Diversity fromhttp://www.netsci.org/Science/Combichem/feature01.html
O-FG2 (O-FG4)
O-FG3FG1-O
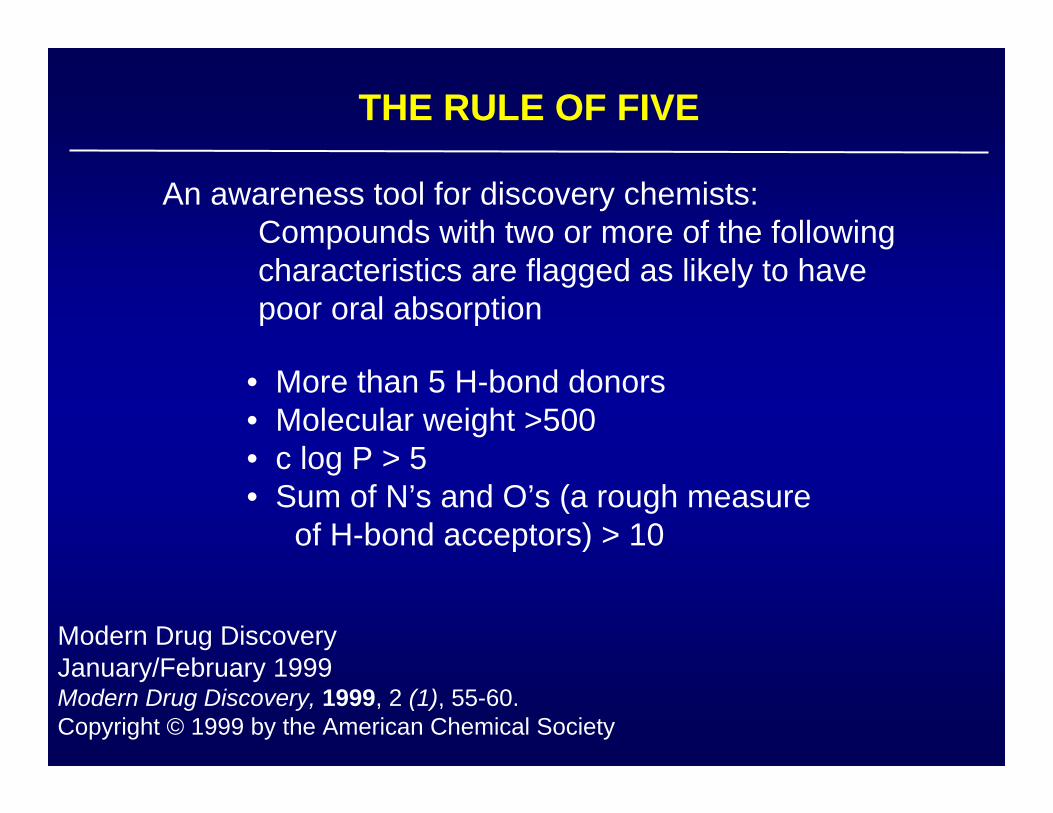
THE RULE OF FIVE
• More than 5 H-bond donors• Molecular weight >500• c log P > 5• Sum of N’s and O’s (a rough measure
of H-bond acceptors) > 10
Modern Drug DiscoveryJanuary/February 1999Modern Drug Discovery, 1999, 2 (1), 55-60.Copyright © 1999 by the American Chemical Society
An awareness tool for discovery chemists:Compounds with two or more of the followingcharacteristics are flagged as likely to havepoor oral absorption
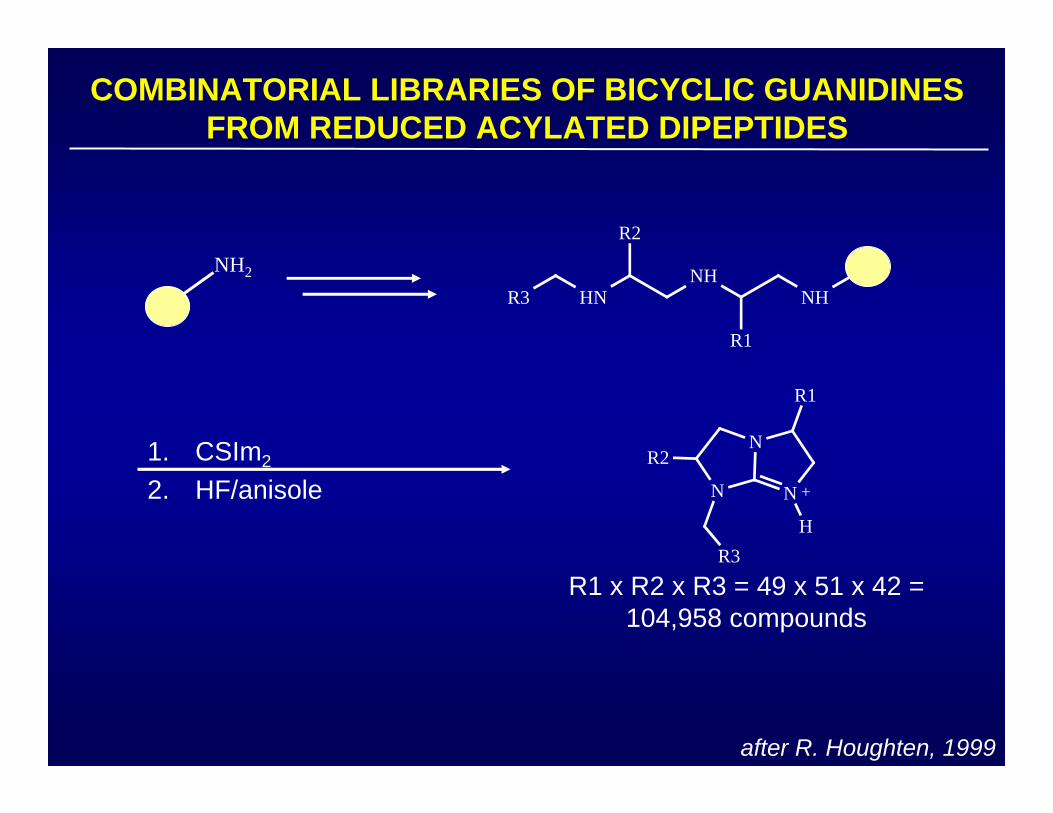
after R. Houghten, 1999
COMBINATORIAL LIBRARIES OF BICYCLIC GUANIDINES FROM REDUCED ACYLATED DIPEPTIDES
NH
R1
NHHN
R2
R3
NH2
N
N
N +
R3
R2
R1
H
R1 x R2 x R3 = 49 x 51 x 42 =104,958 compounds
1. CSIm2
2. HF/anisole
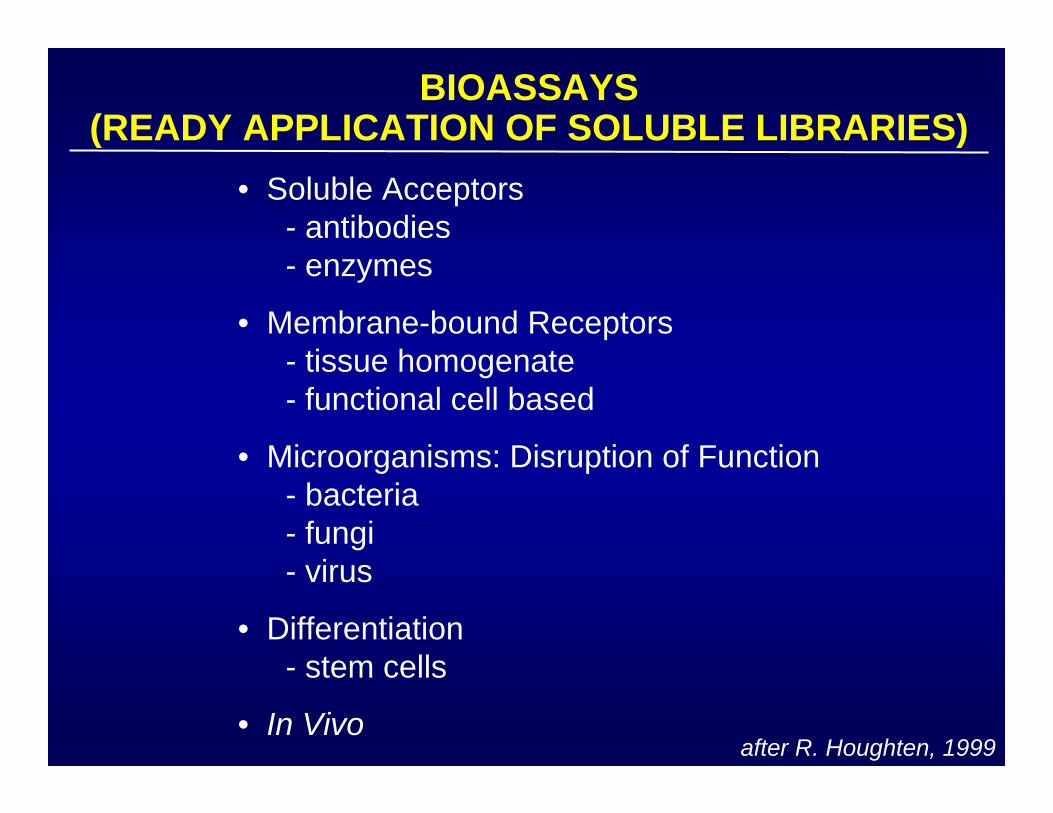
BIOASSAYS(READY APPLICATION OF SOLUBLE LIBRARIES)
• Soluble Acceptors- antibodies- enzymes
• Membrane-bound Receptors- tissue homogenate- functional cell based
• Microorganisms: Disruption of Function- bacteria- fungi- virus
• Differentiation- stem cells
• In Vivoafter R. Houghten, 1999
after R. Houghten, 1999
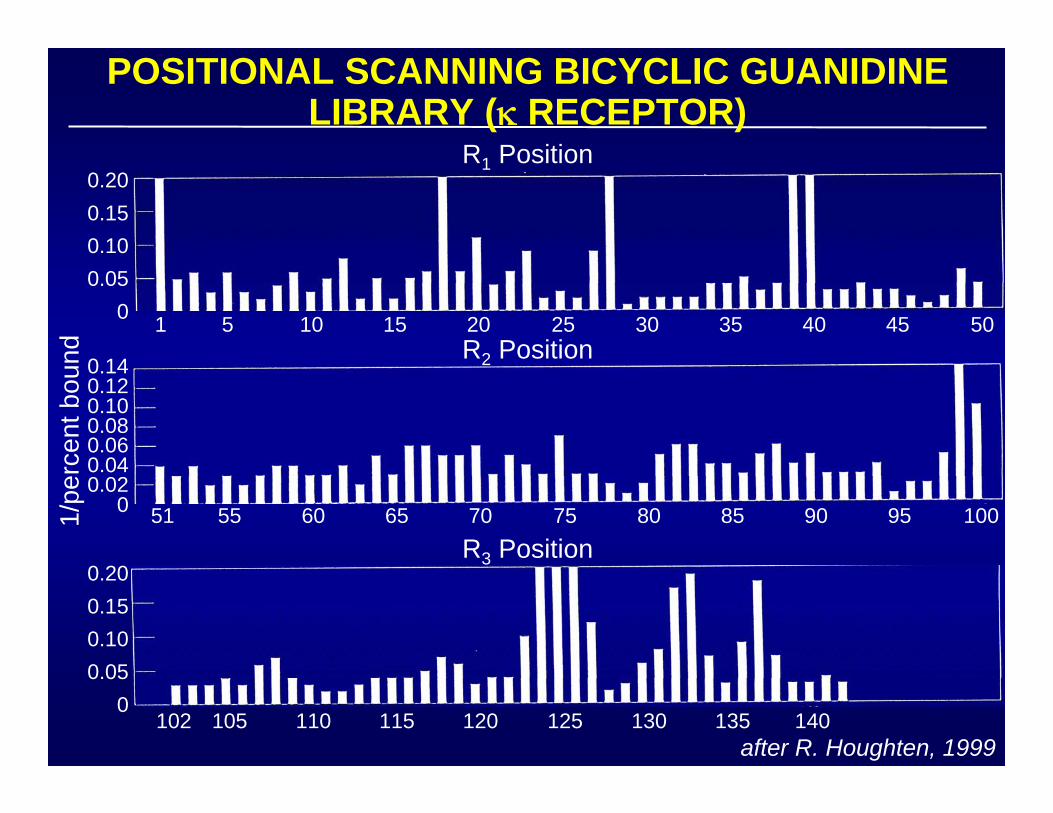
POSITIONAL SCANNING BICYCLIC GUANIDINE LIBRARY (κ RECEPTOR)
1/pe
rcen
t bou
nd
R1 Position0.200.150.100.05
0 5 15 25 35 451 10 20 30 40 50R2 Position
0.140.120.100.080.060.040.02
0 55 65 75 85 9551 60 70 80 90 100
0.200.150.100.05
0
R3 Position
105 115 125 135102 110 120 130 140
OUTLINE OF PRESENTATION
• General Introduction
• Definition of Drug Targets
• Generating Diversity
• Definition of Lead Structures
• Qualifying Lead for • Transition to Early Trials
" RATIONAL":
-Structure based design
-Biochemical Screen
-Target-driven
Cell-based Screen
"EMPIRICAL"
-Bioassay of effect
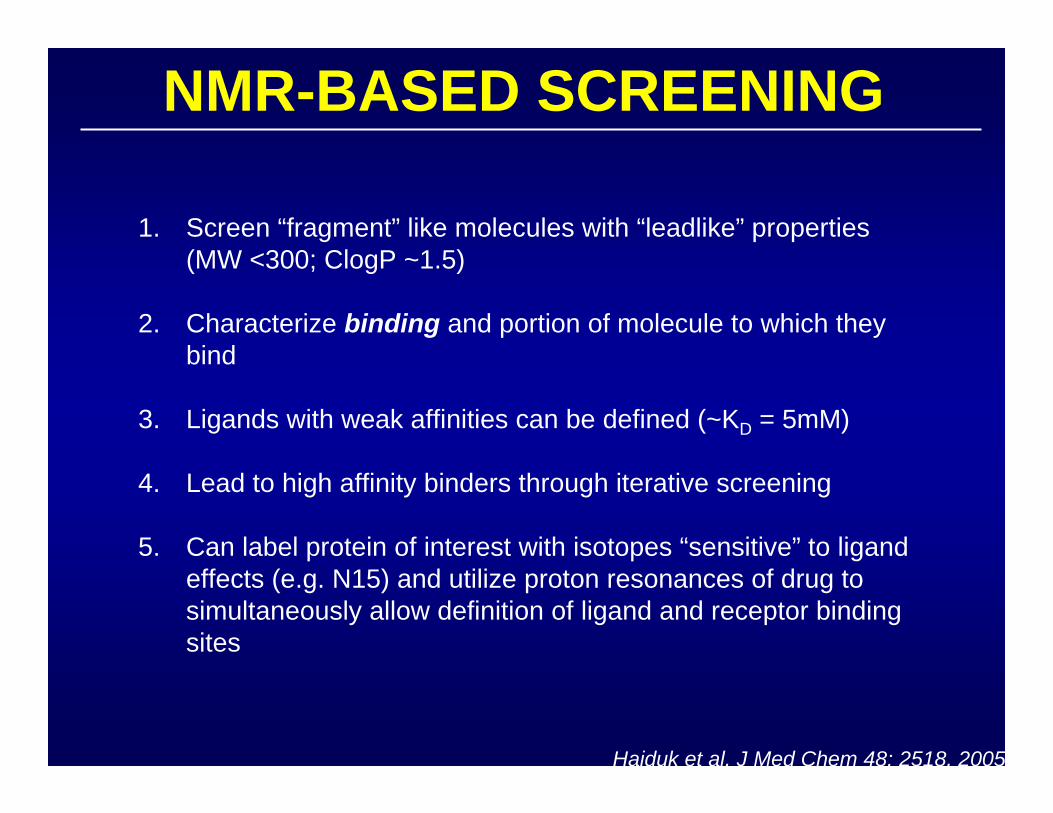
NMR-BASED SCREENING
Hajduk et al, J Med Chem 48: 2518, 2005
1. Screen “fragment” like molecules with “leadlike” properties (MW <300; ClogP ~1.5)
2. Characterize binding and portion of molecule to which they bind
3. Ligands with weak affinities can be defined (~KD = 5mM)
4. Lead to high affinity binders through iterative screening
5. Can label protein of interest with isotopes “sensitive” to ligand effects (e.g. N15) and utilize proton resonances of drug to simultaneously allow definition of ligand and receptor binding sites

NMR AS MEANS OF DEFINING BINDING SITES
Horwitz et al, Biochemistry 16: 3641, 1977
E.G., BLEOMYCIN BIMDING TO DNA
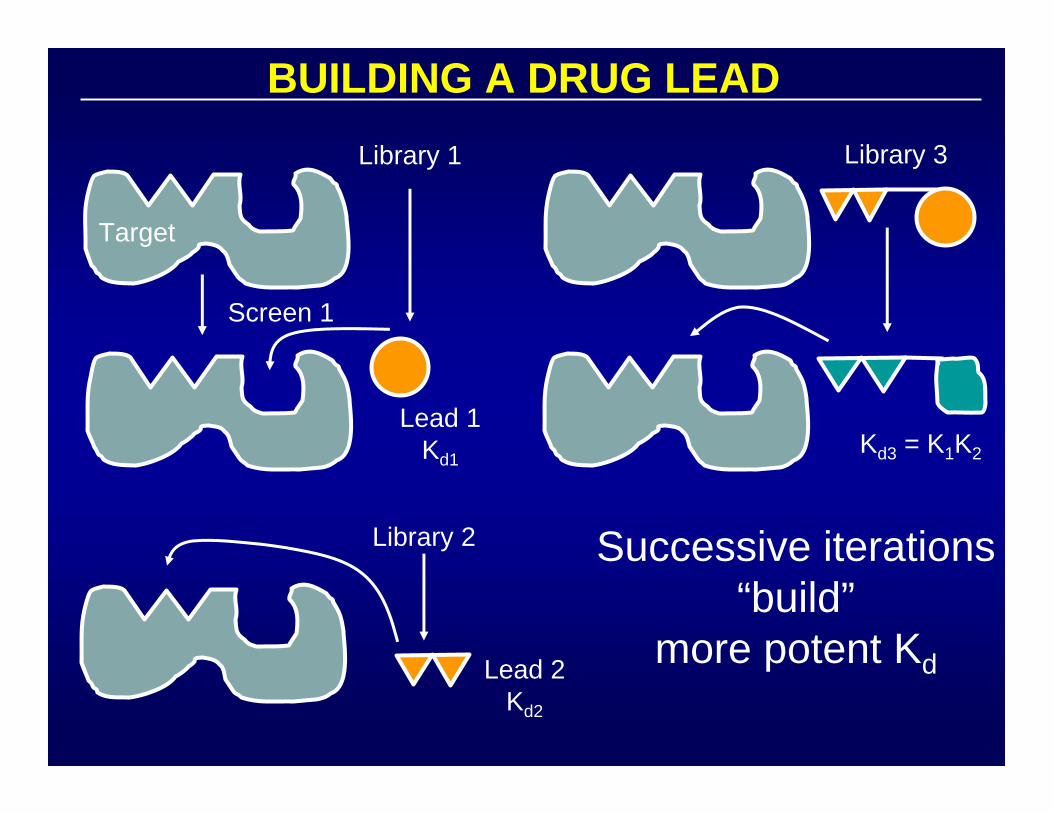
BUILDING A DRUG LEAD
Target
Screen 1
Library 1
Lead 1Kd1
Library 2
Lead 2Kd2
Kd3 = K1K2
Library 3
Successive iterations“build”
more potent Kd
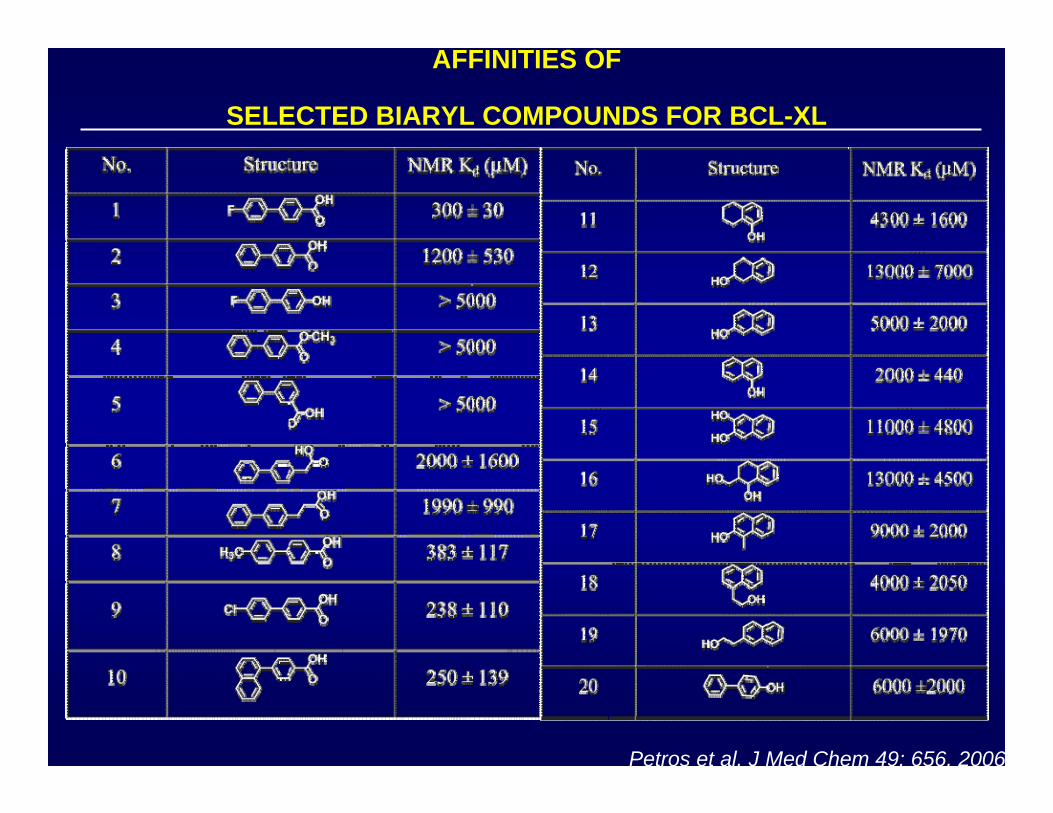
AFFINITIES OF
SELECTED BIARYL COMPOUNDS FOR BCL-XL
Petros et al, J Med Chem 49: 656, 2006

SECTION FROM A 15N HSQC SPECTRUM OF BCL-XL IN THE PRESENCE AND
ABSENCE OF COMPOUND
Petros et al, J Med Chem 49: 656, 2006
alone (white)2 mM biaryl acid 1(cyan)2 mM biaryl acid 1 and 5 mM naphtholderivative 11 (pink)
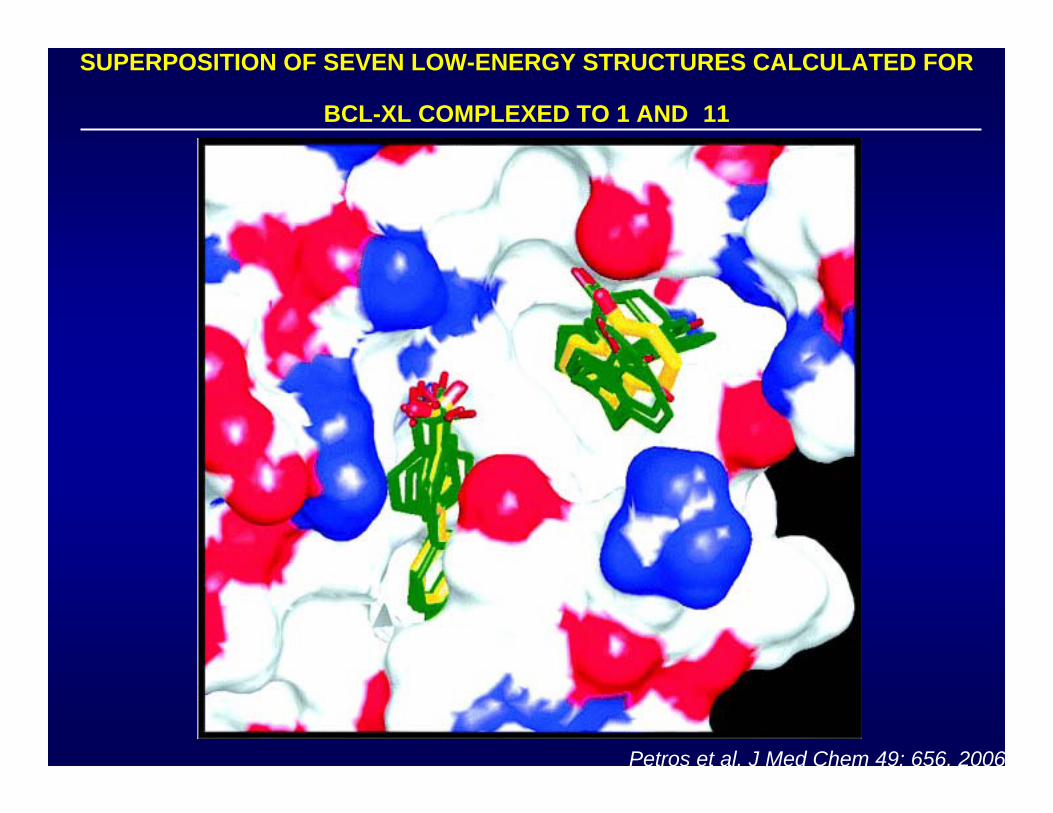
SUPERPOSITION OF SEVEN LOW-ENERGY STRUCTURES CALCULATED FOR
BCL-XL COMPLEXED TO 1 AND 11
Petros et al, J Med Chem 49: 656, 2006
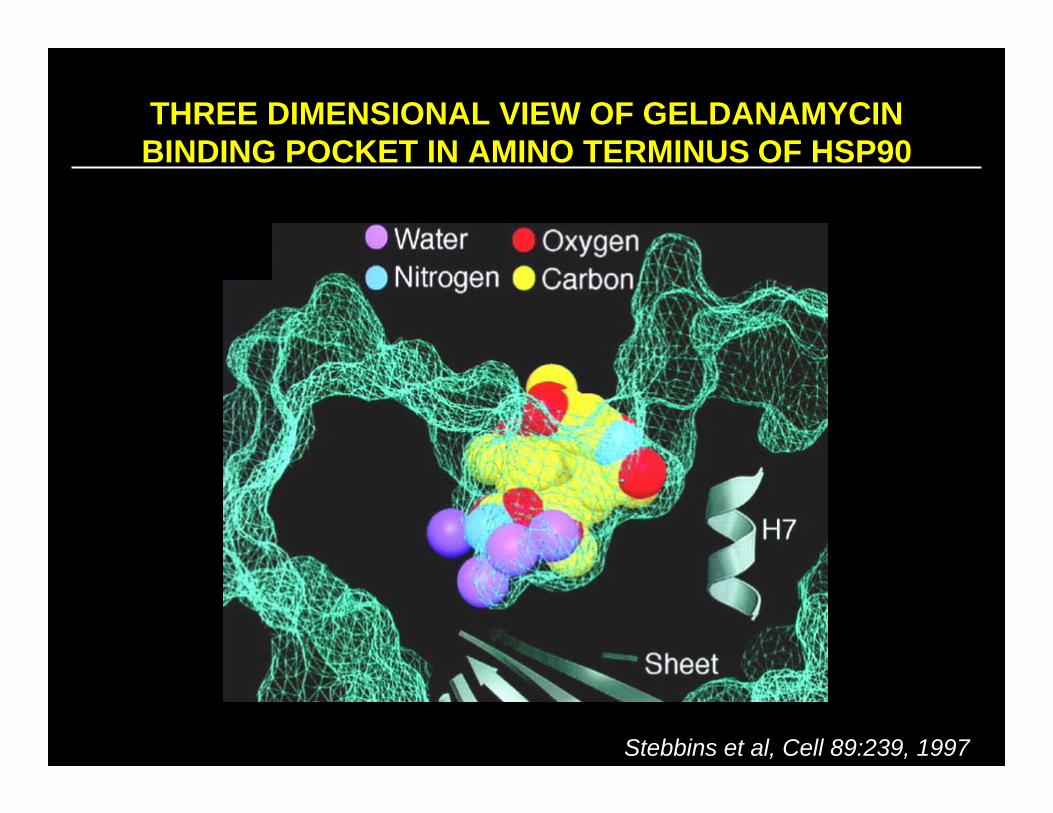
THREE DIMENSIONAL VIEW OF GELDANAMYCIN BINDING POCKET IN AMINO TERMINUS OF HSP90
Stebbins et al, Cell 89:239, 1997
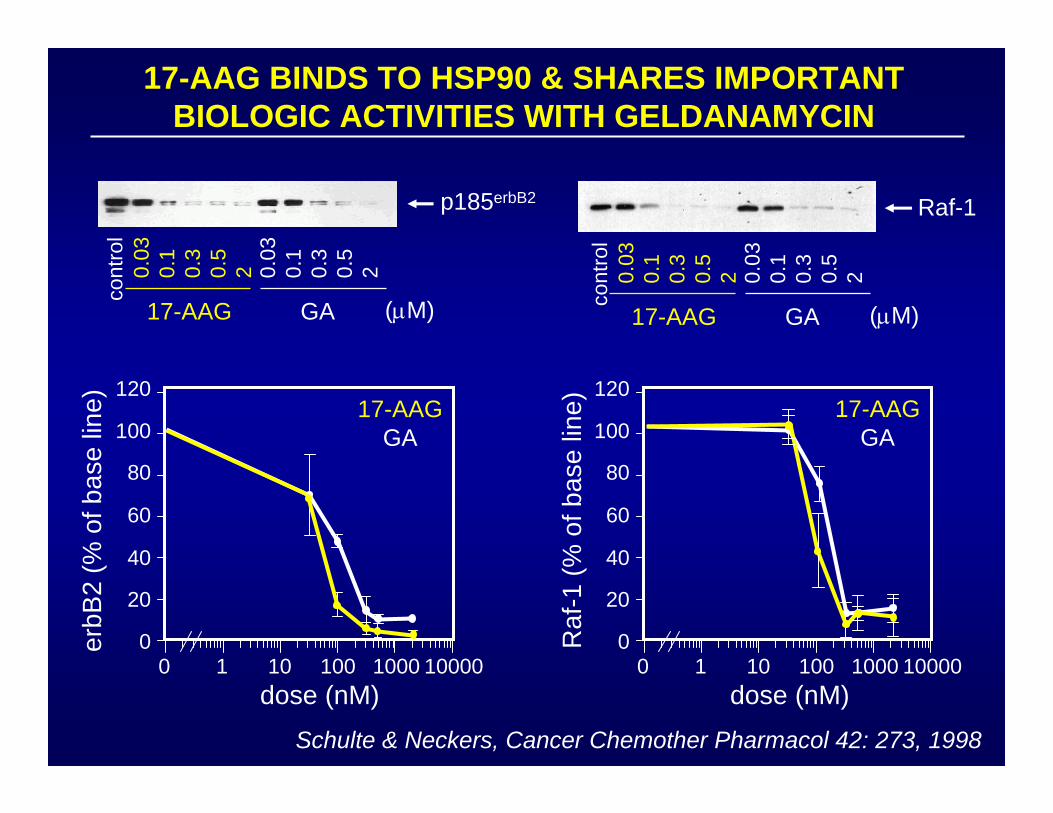
17-AAG BINDS TO HSP90 & SHARES IMPORTANT BIOLOGIC ACTIVITIES WITH GELDANAMYCIN
dose (nM)
erbB
2 (%
of b
ase
line)
Raf
-1 (%
of b
ase
line)
Schulte & Neckers, Cancer Chemother Pharmacol 42: 273, 1998
120
100
80
60
40
20
00 1 10 100 1000 10000
17-AAGGA
120
100
80
60
40
20
00 1 10 100 1000 10000
17-AAGGA
dose (nM)
p185erbB2
17-AAG GA (μM)
0.03
0.1
0.3
0.5
2 0.03
0.1
0.3
0.5
2
cont
rol
Raf-1
17-AAG GA (μM)
0.03
0.1
0.3
0.5
2 0.03
0.1
0.3
0.5
2
cont
rol
OUTLINE OF PRESENTATION
• General Introduction
• Definition of Drug Targets
• Generating Diversity
• Definition of Lead Structures
• Qualifying Lead for • Transition to Early Trials
" RATIONAL":
-Structure based design
-Biochemical Screen
-Target-driven
Cell-based Screen
"EMPIRICAL"
-Bioassay of effect
MM
G2G2 SS
G1G1
RbRb
RbRb
Cyclin DCyclin D
PP
E2FE2F
E2FE2F
Cyclin ECyclin E
Cdk2Cdk2Cyclin ACyclin A Cdc25ACdc25A
Cdk2Cdk2Cyclin ACyclin A
Cyclin A/BCyclin A/B
Cdk1Cdk1
Cyclin A/BCyclin A/BCdk1Cdk1
Cdc25BCdc25B
Cdc25CCdc25CPP
PP
Cdc25ACdc25A
Cdk2Cdk2Cdk4Cdk4
??
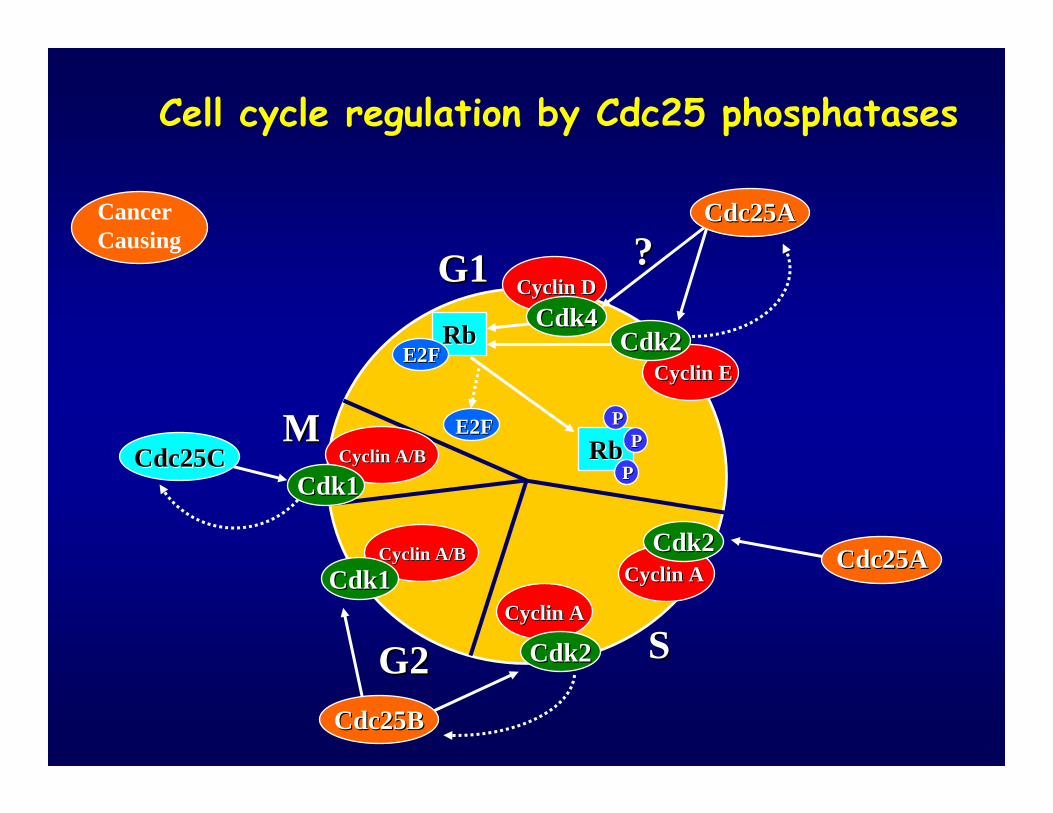
Cell cycle regulation by Cdc25 phosphatases
CancerCausing

Regulation of Cell Cycle Progression by Regulation of Cell Cycle Progression by Cdc25: Cdk ActivationCdc25: Cdk Activation
CdkCdkCyclinCyclin
InactiveInactive InactiveInactive ActiveActive
T14 Y15
T161 CdkCdkCyclinCyclin
T14 Y15
T161
PP PP
PP
CdkCdkCyclinCyclin
T14 Y15
T161
PP
Myt1Myt1
CAKCAK
Wee1Wee1 Cdc25Cdc25
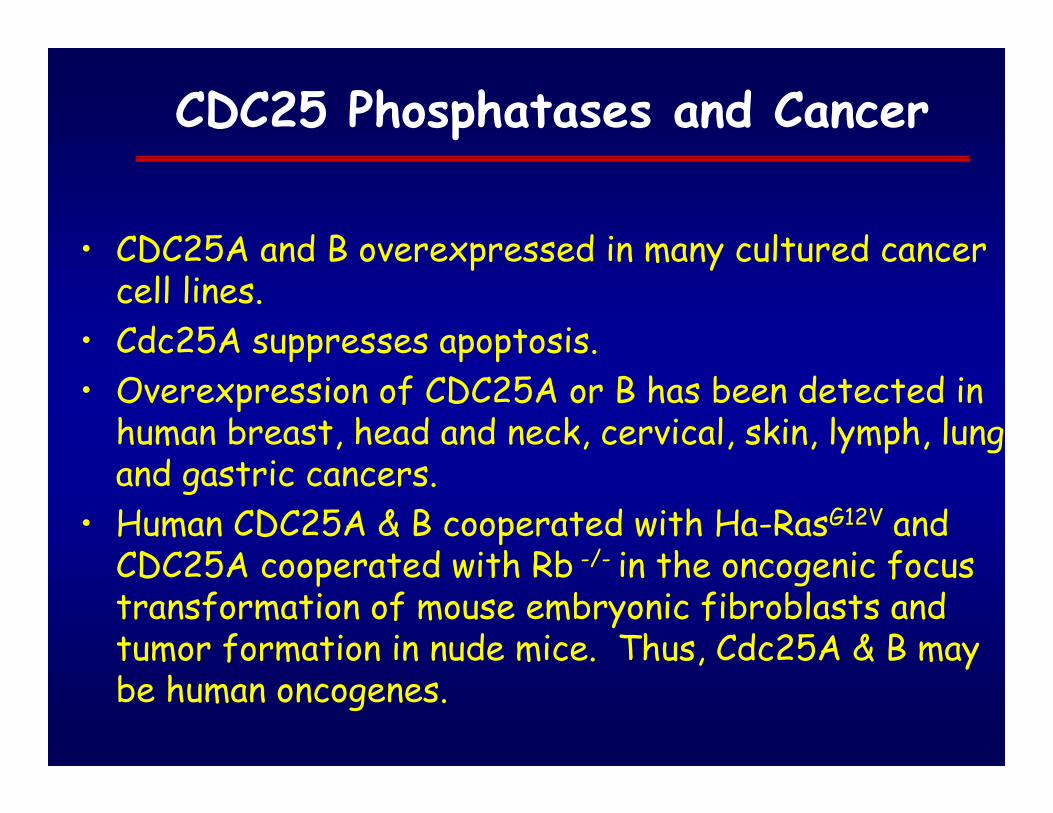
CDC25 Phosphatases and Cancer
• CDC25A and B overexpressed in many cultured cancer cell lines.
• Cdc25A suppresses apoptosis.• Overexpression of CDC25A or B has been detected in
human breast, head and neck, cervical, skin, lymph, lung and gastric cancers.
• Human CDC25A & B cooperated with Ha-RasG12V and CDC25A cooperated with Rb -/- in the oncogenic focus transformation of mouse embryonic fibroblasts and tumor formation in nude mice. Thus, Cdc25A & B may be human oncogenes.
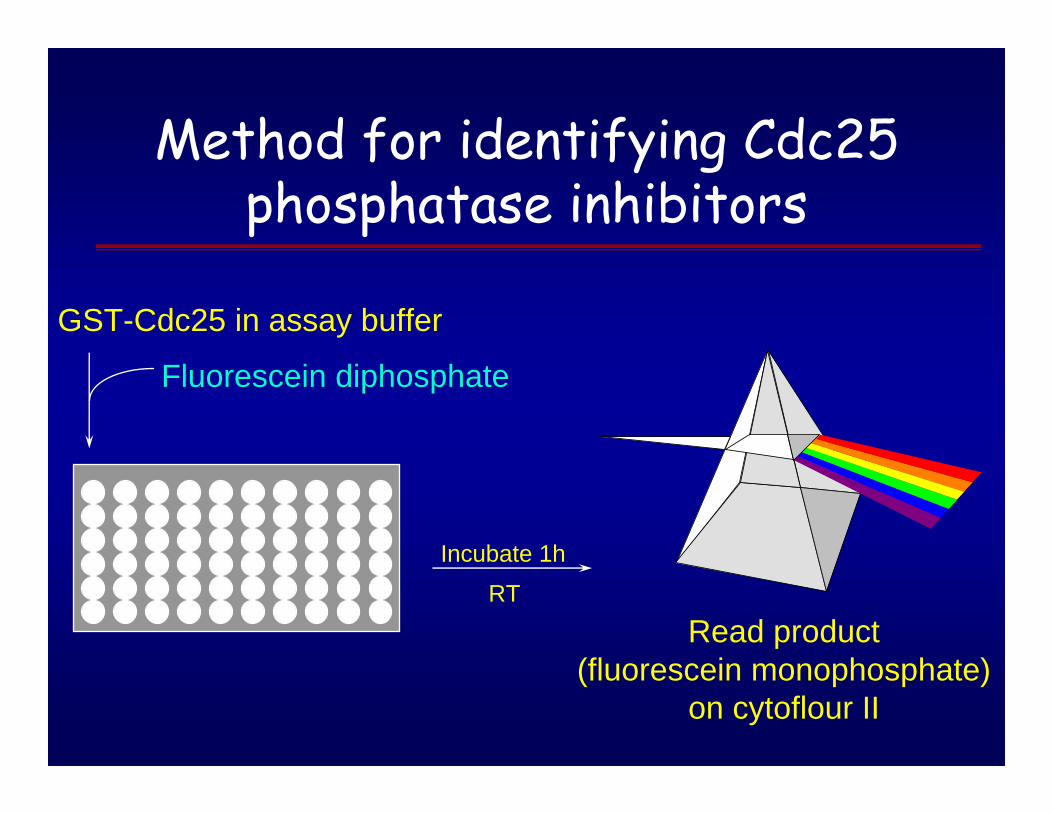
Method for identifying Cdc25 phosphatase inhibitors
GST-Cdc25 in assay buffer
Fluorescein diphosphate
Incubate 1h
RT
Read product (fluorescein monophosphate)
on cytoflour II

Chemical Screening Chemical Screening ApproachApproach
• Targeted Array Libraries• Diverse Chemical Libraries
-7 -6 -5 -4 -30
25
50
75
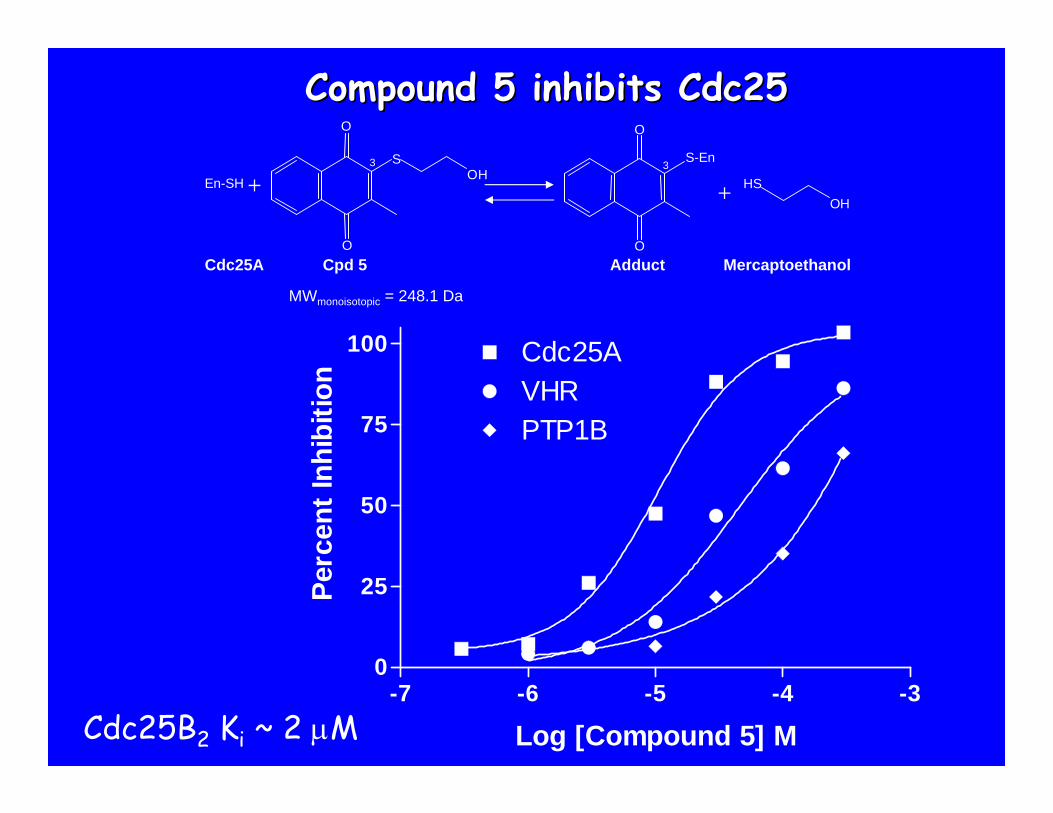
100 Cdc25AVHRPTP1B
Log [Compound 5] M
Perc
ent I
nhib
ition
C.
Compound 5 inhibits Cdc25Compound 5 inhibits Cdc25
Cdc25B2 Ki ~ 2 μM
+En-SH + OHHS
Cdc25A Cpd 5 Adduct Mercaptoethanol
O
O
SO H
3
O
O
S-En3
MWmonoisotopic = 248.1 Da
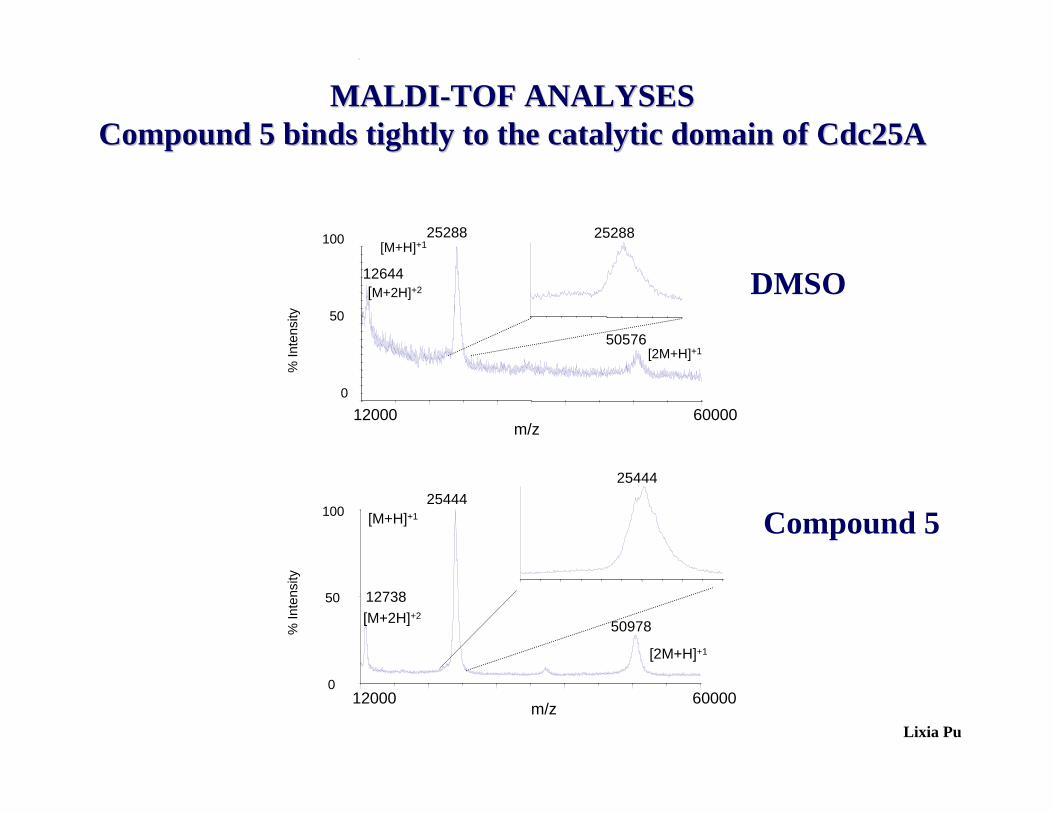
% In
tens
ity
12000 60000m/z
0
50
10025444
12738
50978[M+2H]+2
[M+H]+1
[2M+H]+1
25444
12000 60000m/z
0
50
100
% In
tens
ity
25288
[M+2H]+212644
50576[2M+H]+1
[M+H]+125288
Lixia Pu
MALDIMALDI--TOF ANALYSESTOF ANALYSESCompound 5 binds tightly to the catalytic domain of Cdc25ACompound 5 binds tightly to the catalytic domain of Cdc25A
DMSO
Compound 5

Compound ValidationCompound Validation
Cellular: Cell Cycle Biochemical: Substrate phosphorylationGenetic: Chemical complementation

tsFT210 Cell SystemtsFT210 Cell System
tsFT210 cellsCdk1 mutants
G1 G2/M
32o 17 h
39.4o 17 h
No functional Cdk1
Functional Cdk1

Compound 5 causes G2/M arrestCompound 5 causes G2/M arrest
2C 4C
39.4 oC17 h
A
rela
tive
cell
num
bers
32.0 oC
B
6 h, 32.0 o C
+DMSO
C
+Nocodazole1 μΜ
D
+Compound 520 μM
F
+Compound 510 μM
E
+Compound 2620 μM
I
+Compound 2720 μM
HG
OUTLINE OF PRESENTATION
• General Introduction
• Definition of Drug Targets
• Generating Diversity
• Definition of Lead Structures
• Qualifying Lead for • Transition to Early Trials
" RATIONAL":
-Structure based design
-Biochemical Screen
-Target-driven
Cell-based Screen
"EMPIRICAL"
-Bioassay of effect
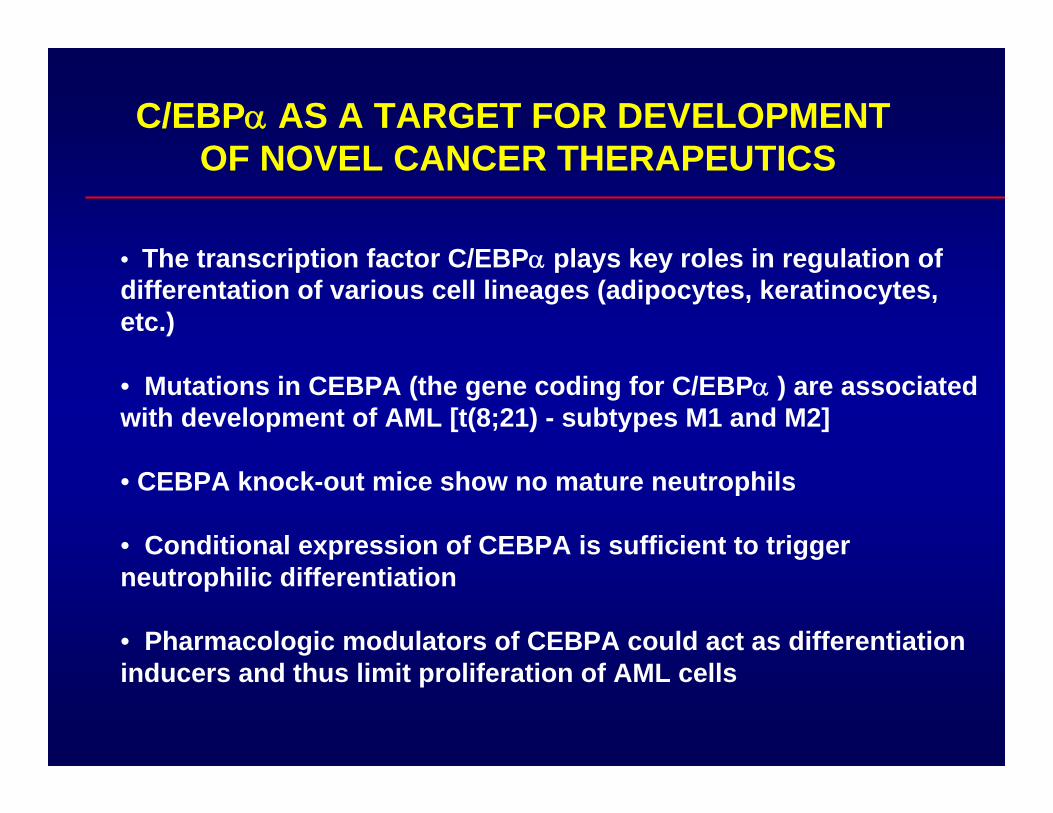
• The transcription factor C/EBPα plays key roles in regulation of differentation of various cell lineages (adipocytes, keratinocytes, etc.)
• Mutations in CEBPA (the gene coding for C/EBPα ) are associated with development of AML [t(8;21) - subtypes M1 and M2]
• CEBPA knock-out mice show no mature neutrophils
• Conditional expression of CEBPA is sufficient to trigger neutrophilic differentiation
• Pharmacologic modulators of CEBPA could act as differentiationinducers and thus limit proliferation of AML cells
C/EBPα AS A TARGET FOR DEVELOPMENTOF NOVEL CANCER THERAPEUTICS
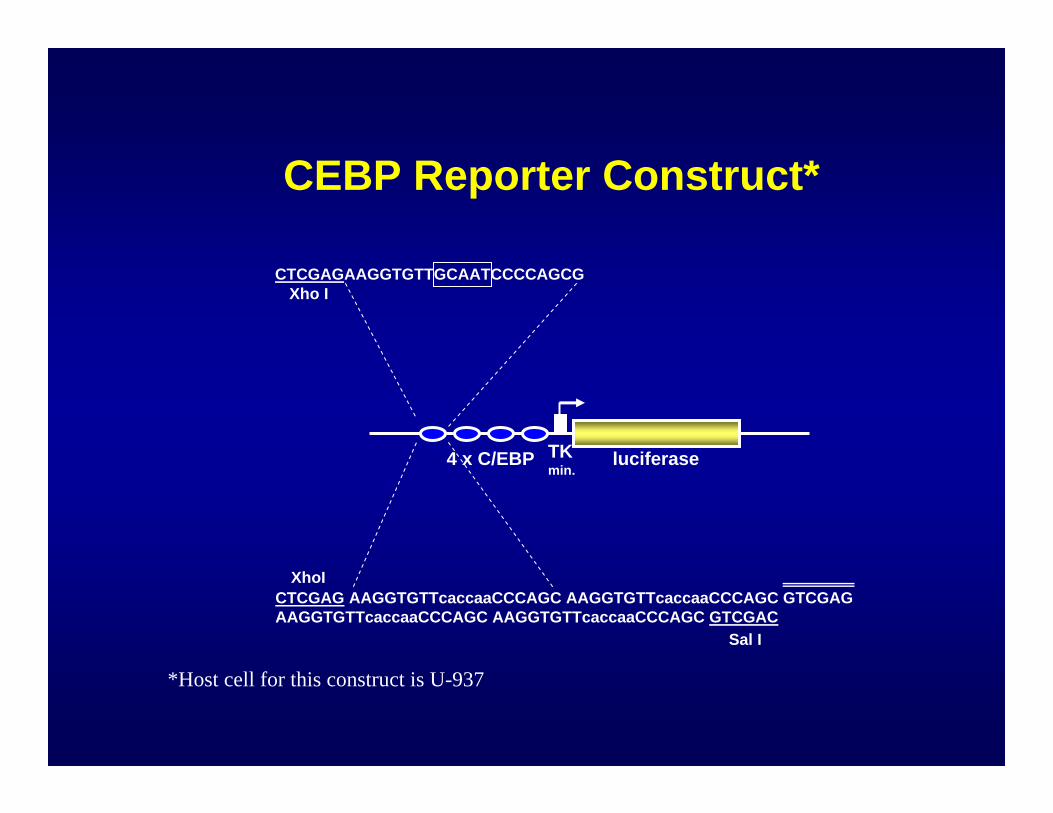
4 x C/EBP TKmin.
luciferase
CTCGAGAAGGTGTTGCAATCCCCAGCG
CTCGAG AAGGTGTTcaccaaCCCAGC AAGGTGTTcaccaaCCCAGC GTCGAG AAGGTGTTcaccaaCCCAGC AAGGTGTTcaccaaCCCAGC GTCGAC
XhoI
Sal I
Xho I
CEBP Reporter Construct*
*Host cell for this construct is U-937

CEBPA Assay TimelineDispense CellsTo Assay Plates
TransferTest SamplesTo Assay Plates
Incubate Plates At 37oC, 5% CO2, Ambient O2
Add “Bright-Glow”Luciferase Reagent
Read Assay PlatesOn Luminometer
Incubate Plates at RT5% CO2, Ambient O2
Remove PlatesFrom Incubator*
24 Hours 24 Hours One Hour
*Sister plates processed for Alamar blue toxicity assay
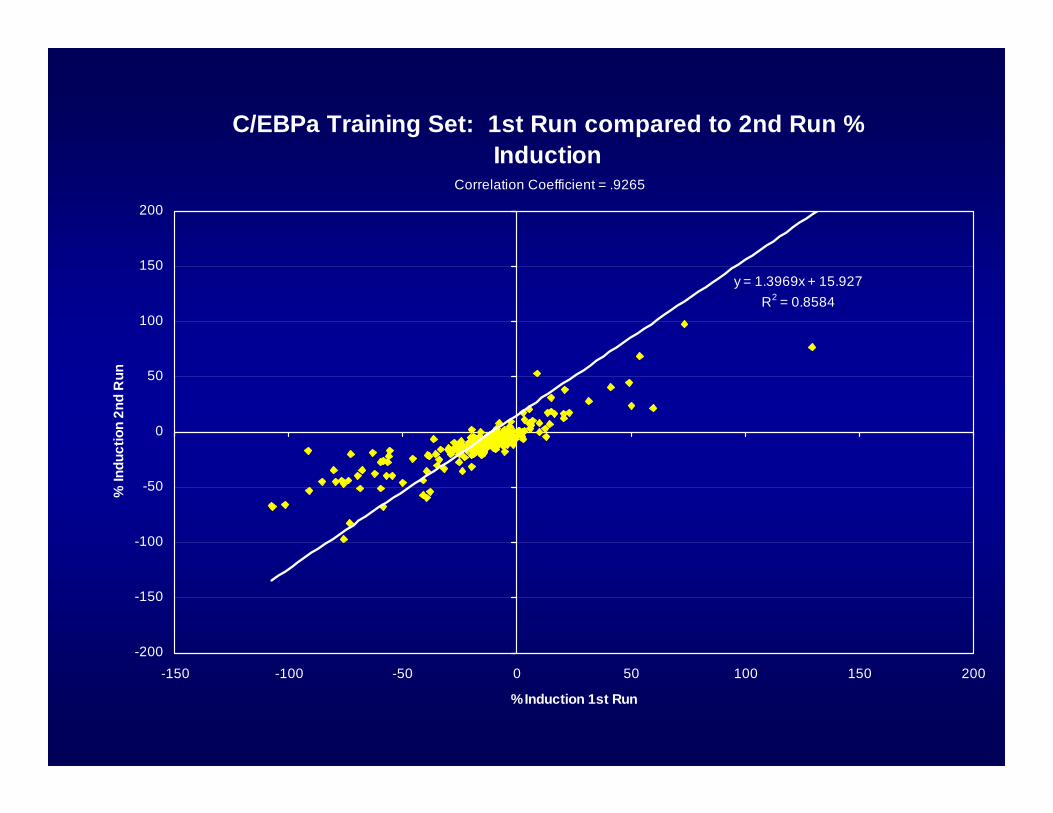
C/EBPa Training Set: 1st Run compared to 2nd Run % Induction
y = 1.3969x + 15.927R2 = 0.8584
-200
-150
-100
-50
0
50
100
150
200
-150 -100 -50 0 50 100 150 200
% Induction 1st Run
% In
duct
ion
2nd
Run
Correlation Coefficient = .9265
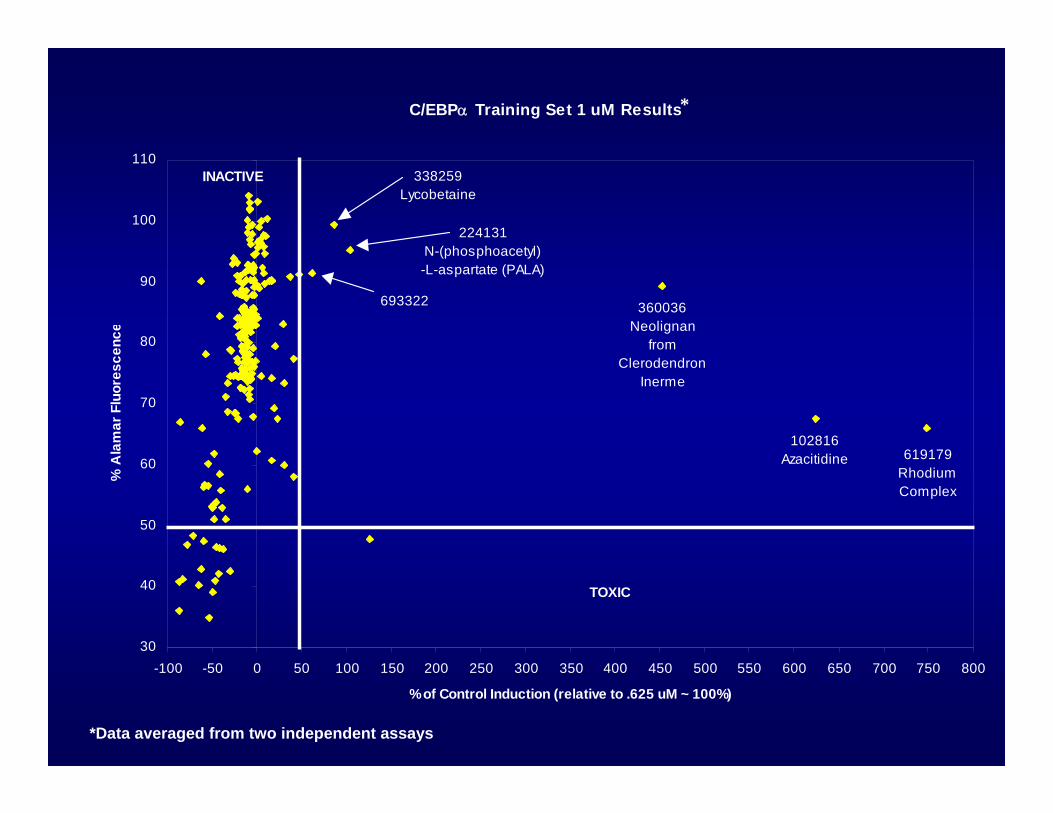
C/EBPα Training Set 1 uM Results
30
40
50
60
70
80
90
100
110
-100 -50 0 50 100 150 200 250 300 350 400 450 500 550 600 650 700 750 800
% of Control Induction (relative to .625 uM ~ 100%)
% A
lam
ar F
luor
esce
nce
INACTIVE
TOXIC
619179 Rhodium Complex
102816 Azacitidine
360036 Neolignan
from Clerodendron
Inerme
338259Lycobetaine
693322
224131N-(phosphoacetyl)-L-aspartate (PALA)
*Data averaged from two independent assays
*
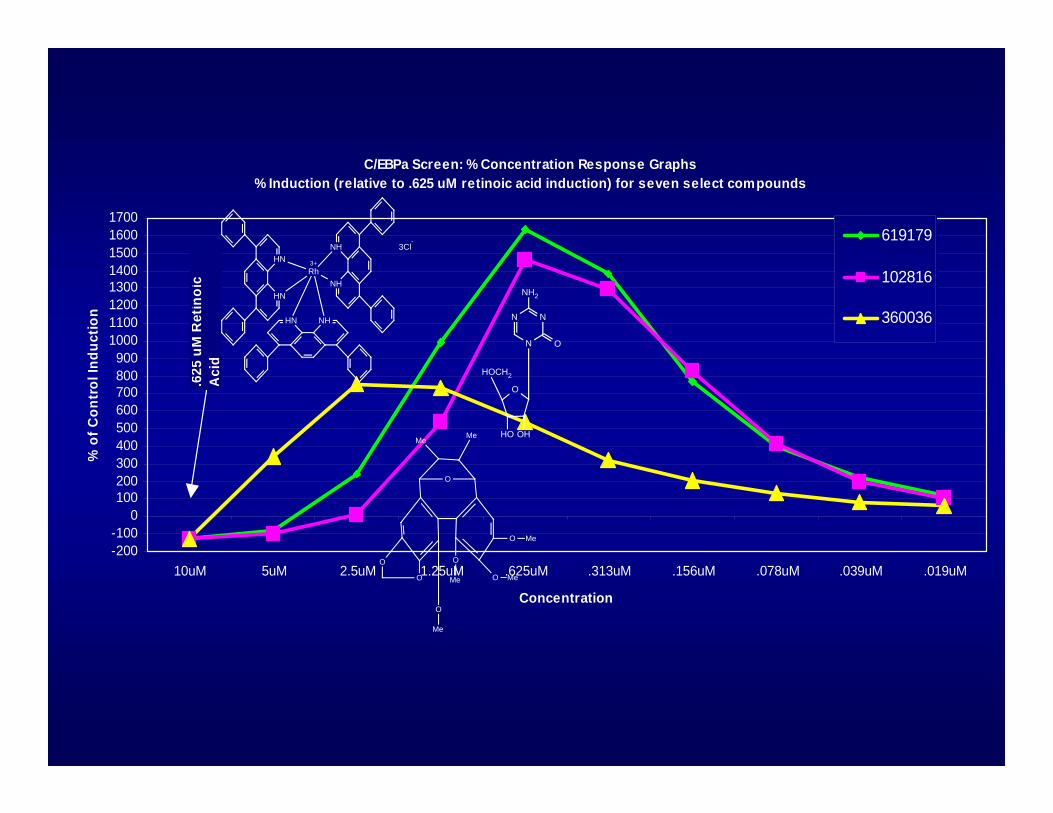
C/EBPa Screen: % Concentration Response Graphs % Induction (relative to .625 uM retinoic acid induction) for seven select compounds
-200-100
0100200300400500600700800900
10001100120013001400150016001700
10uM 5uM 2.5uM 1.25uM .625uM .313uM .156uM .078uM .039uM .019uM
Concentration
% o
f Con
trol
Indu
ctio
n
619179
102816
360036
.625
uM
Ret
inoi
c A
cid
NHHN
HN
HNNH
NH
Rh3+
3Cl-
N
O
N
N
O
HOCH2
HO OH
NH2
O
O
O
O
O
O
O
Me
Me
Me
Me
Me
Me
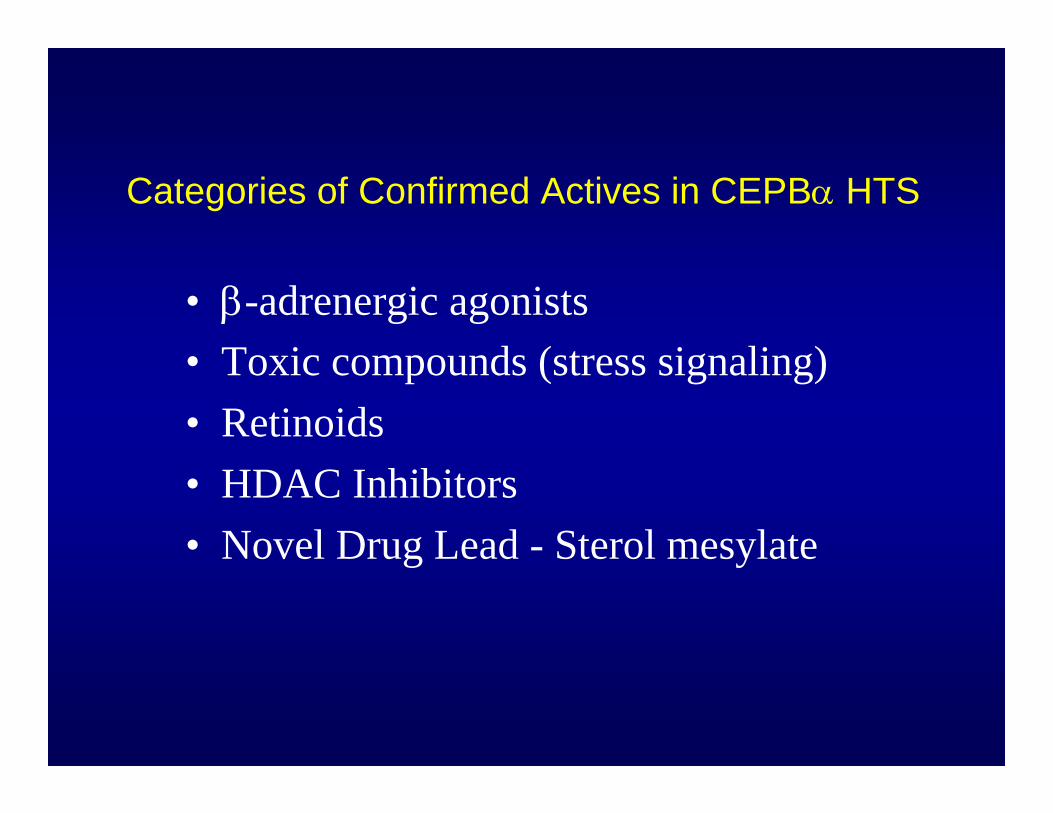
Categories of Confirmed Actives in CEPBα HTS
• β-adrenergic agonists• Toxic compounds (stress signaling)• Retinoids• HDAC Inhibitors• Novel Drug Lead - Sterol mesylate
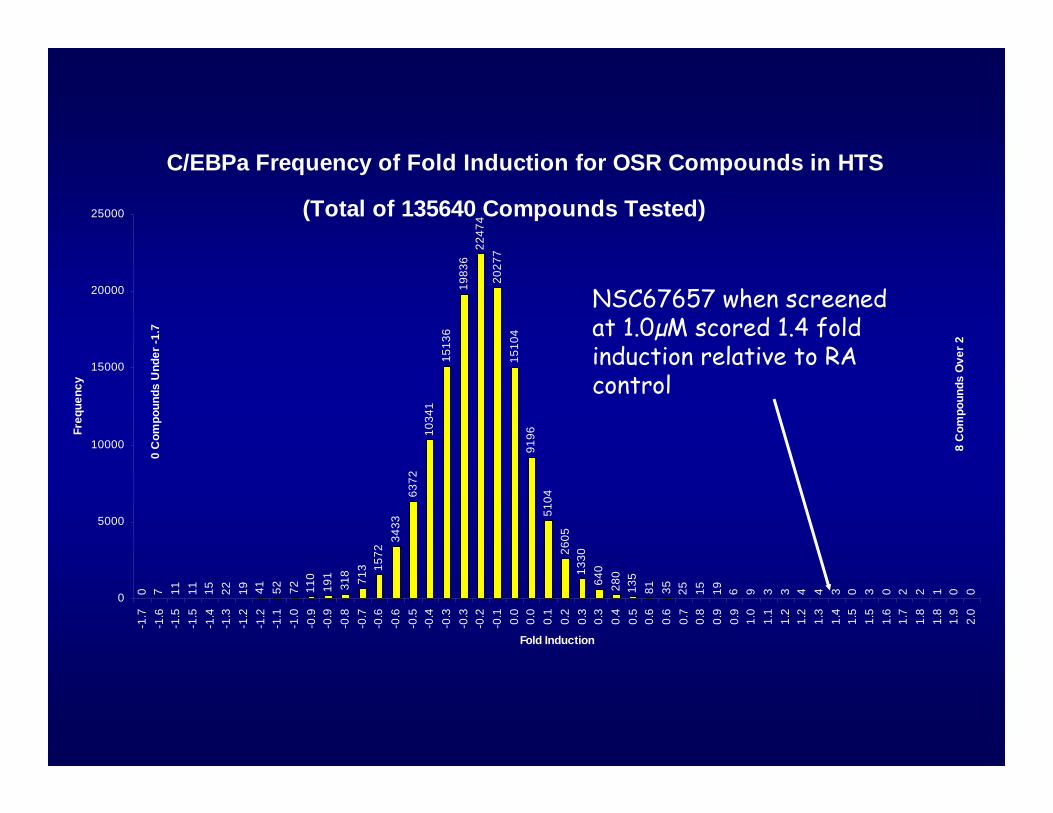
C/EBPa Frequency of Fold Induction for OSR Compounds in HTS0 7 11 11 15 22 19 41 52 72 11
019
131
871
3 1572
3433
6372
1034
115
136
1983
622
474
2027
715
104
9196
5104
2605
1330
640
280
135
81 35 25 15 19 6 9 3 3 4 4 3 0 3 0 2 2 1 0 00
5000
10000
15000
20000
25000
-1.7
-1.6
-1.5
-1.5
-1.4
-1.3
-1.2
-1.2
-1.1
-1.0
-0.9
-0.9
-0.8
-0.7
-0.6
-0.6
-0.5
-0.4
-0.3
-0.3
-0.2
-0.1 0.0
0.0
0.1
0.2
0.3
0.3
0.4
0.5
0.6
0.6
0.7
0.8
0.9
0.9
1.0
1.1
1.2
1.2
1.3
1.4
1.5
1.5
1.6
1.7
1.8
1.8
1.9
2.0
Fold Induction
Freq
uenc
y
(Total of 135640 Compounds Tested)
0 C
ompo
unds
Und
er -1
.7
8 C
ompo
unds
Ove
r 2
NSC67657 when screened at 1.0µM scored 1.4 fold induction relative to RA control
-20
0
20
40
60
80
100
120
10uM 5uM
2.5u
M
1.25
uM
.625
uM
.313
uM
.156
uM
.078
uM
.039
uM
.019
uM
289336
57654
59264
62786
89747
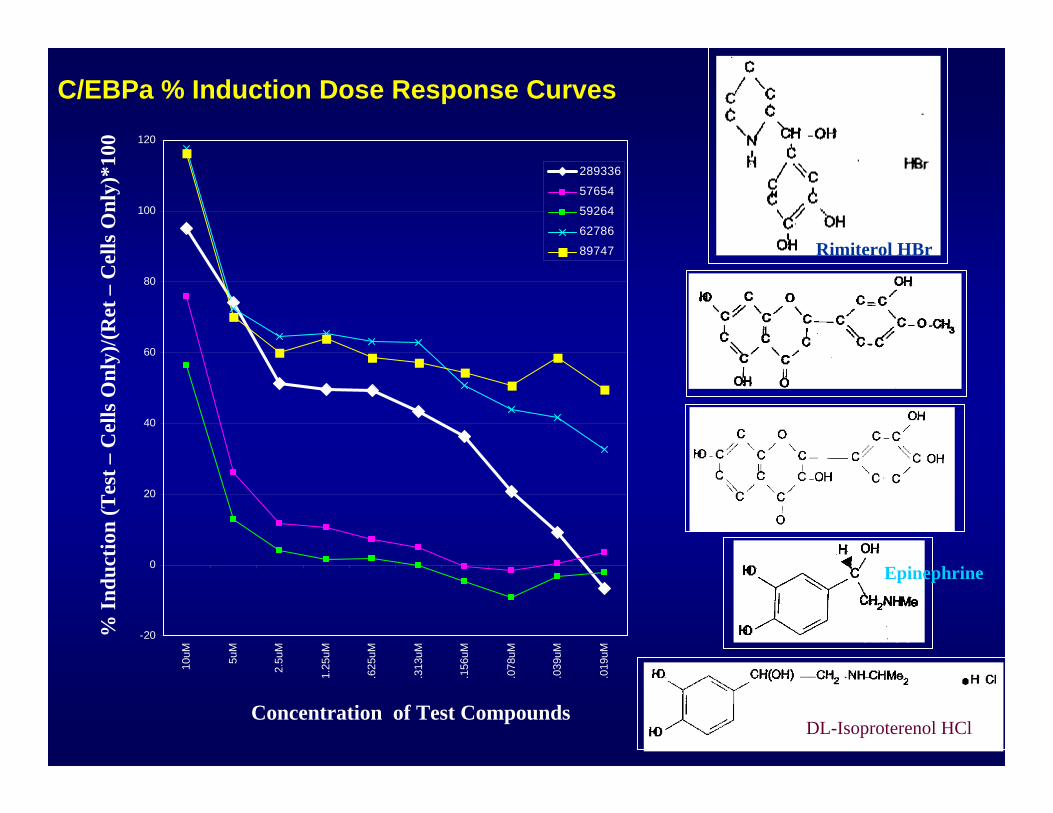
C/EBPa % Induction Dose Response Curves%
Indu
ctio
n (T
est –
Cel
ls O
nly)
/(Ret
–C
ells
Onl
y)*1
00
Concentration of Test Compounds
289336
57654
59264
62786
89747
Rimiterol HBr
Epinephrine
DL-Isoproterenol HCl
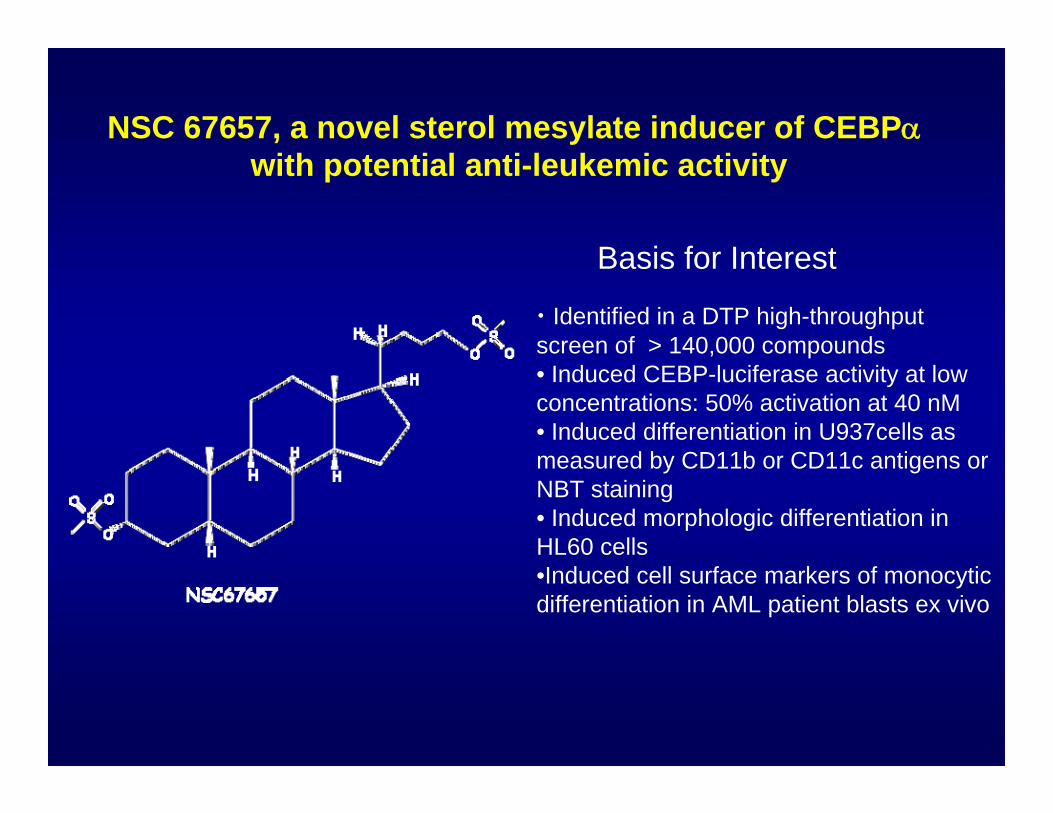
NSC 67657, a novel sterol mesylate inducer of CEBPαwith potential anti-leukemic activity
• Identified in a DTP high-throughput screen of > 140,000 compounds• Induced CEBP-luciferase activity at low concentrations: 50% activation at 40 nM• Induced differentiation in U937cells as measured by CD11b or CD11c antigens or NBT staining• Induced morphologic differentiation in HL60 cells•Induced cell surface markers of monocytic differentiation in AML patient blasts ex vivo
Basis for Interest
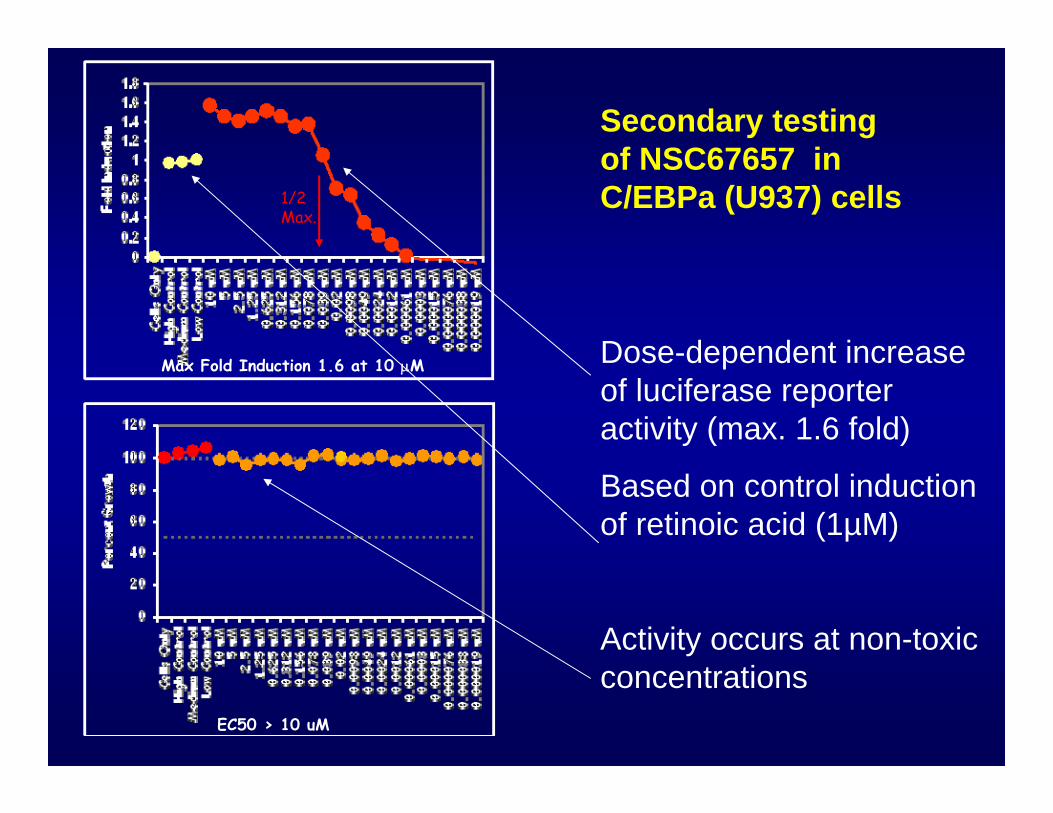
Max Fold Induction 1.6 at 10 μM
EC50 > 10 uM
Secondary testing of NSC67657 in C/EBPa (U937) cells
Dose-dependent increase of luciferase reporter activity (max. 1.6 fold)
Based on control induction of retinoic acid (1µM)
Activity occurs at non-toxic concentrations
1/2Max.
Untreated control -largely myeloblasts
40x
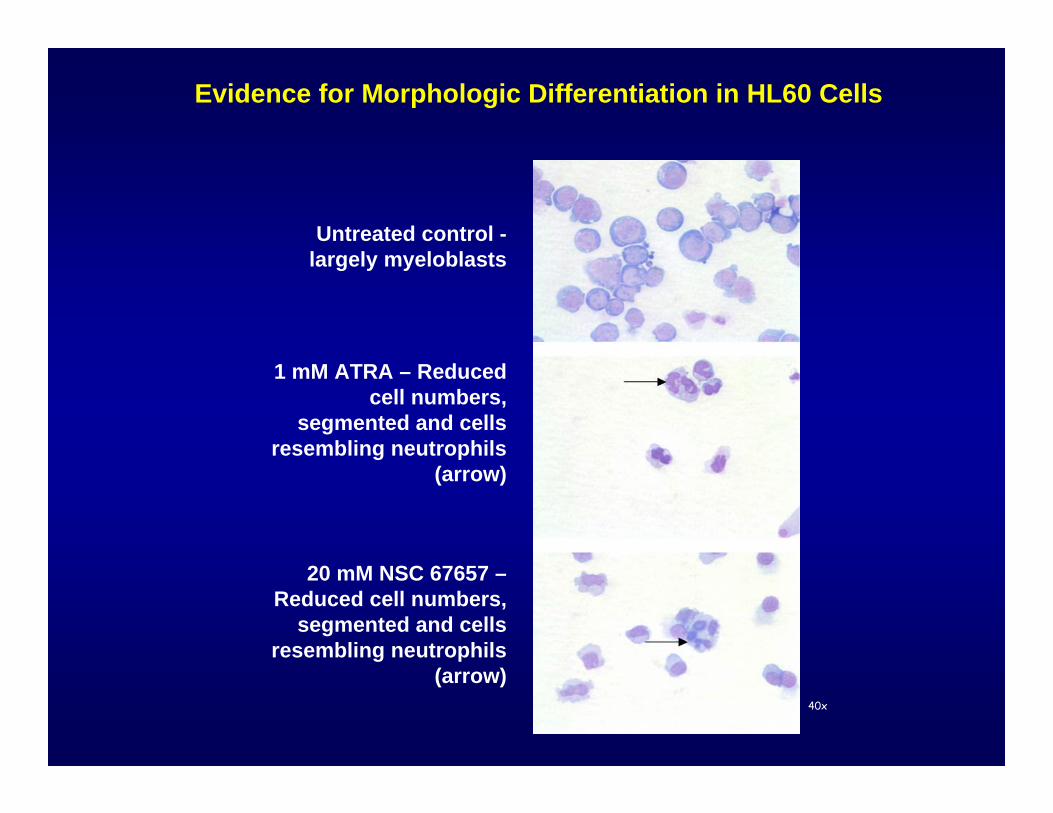
Evidence for Morphologic Differentiation in HL60 Cells
1 mM ATRA – Reduced cell numbers,
segmented and cells resembling neutrophils
(arrow)
20 mM NSC 67657 –Reduced cell numbers,
segmented and cells resembling neutrophils
(arrow)
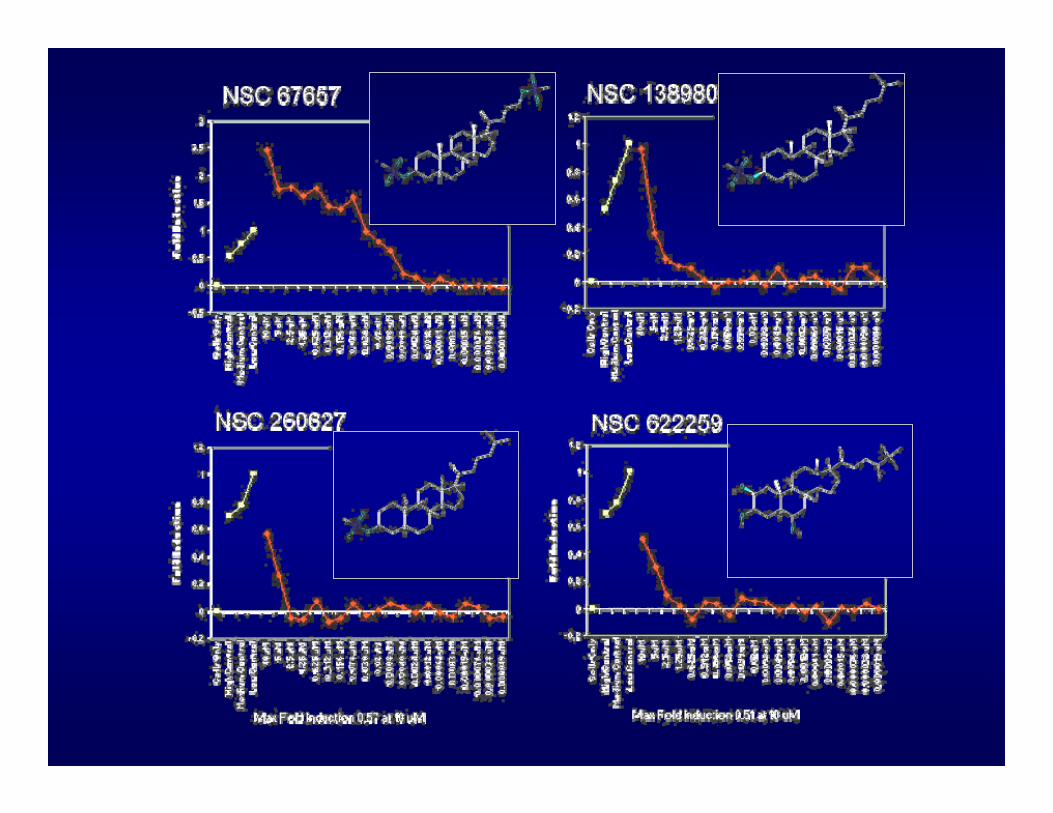
GENERATION OF SAR AROUND STEROID MESYLATE LEAD
• Related compounds available from the DTP Repository were tested in concentration-response format
• No compounds with comparable activity were found (most were completely inactive)
• Three compounds which showed some activity provided an initial SAR model
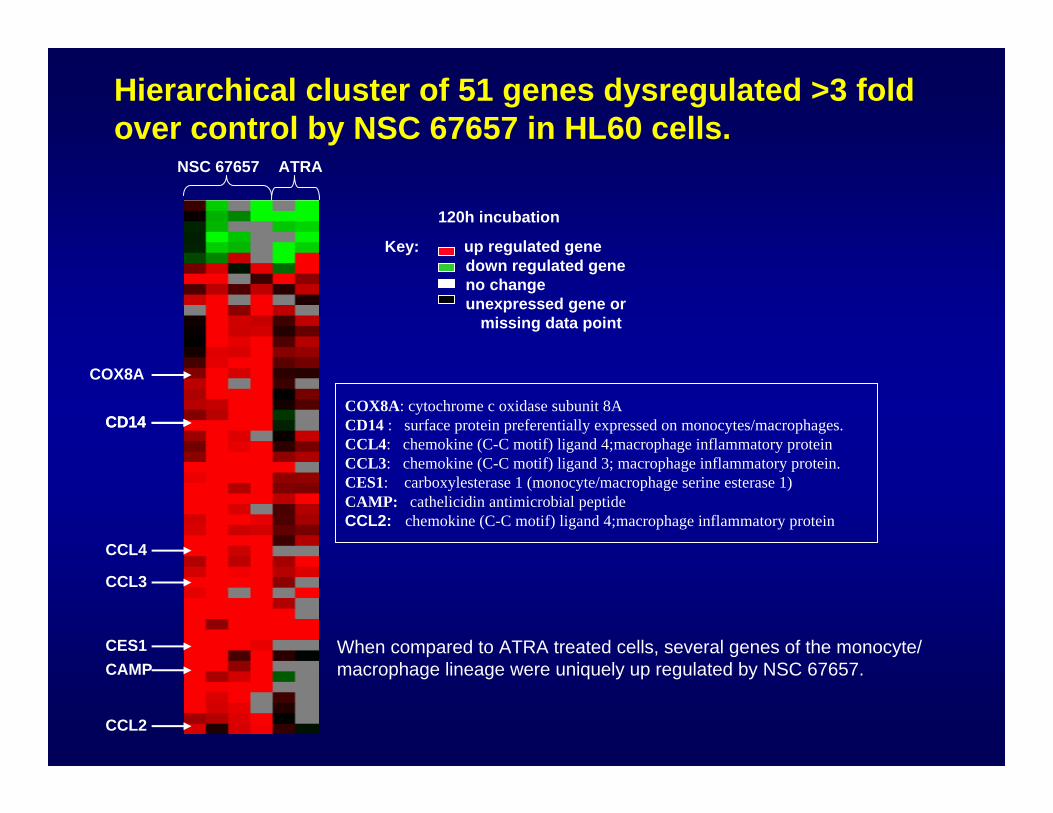
Key: up regulated genedown regulated geneno changeunexpressed gene or
missing data point
CD14CD14
CES1CAMP
CCL4
COX8A
CCL2
CCL3
NSC 67657 ATRA
120h incubation
When compared to ATRA treated cells, several genes of the monocyte/ macrophage lineage were uniquely up regulated by NSC 67657.
Hierarchical cluster of 51 genes dysregulated >3 fold over control by NSC 67657 in HL60 cells.
COX8A: cytochrome c oxidase subunit 8ACD14 : surface protein preferentially expressed on monocytes/macrophages.CCL4: chemokine (C-C motif) ligand 4;macrophage inflammatory proteinCCL3: chemokine (C-C motif) ligand 3; macrophage inflammatory protein.CES1: carboxylesterase 1 (monocyte/macrophage serine esterase 1)CAMP: cathelicidin antimicrobial peptideCCL2: chemokine (C-C motif) ligand 4;macrophage inflammatory protein

DMSO Control 2µM ATRA 20µM NSC 67657
ATRA induces differentiation (measured by NBT reduction after 7 days) in both HL60 and NB4 cell lines, while NSC 67657 induced differentiation only in HL60 cells. This supports the monocyte/ macrophage lineage specific differentiation proposed from the gene expression studies
HL60 cells: Can differentiate to either
granulocytes or monocyte/macrophages
DMSO Control 2µM ATRA 20µM NSC 67657
NB4 cells:Can only differentiate
into granulocytes
NSC 67657 induces differentiation in different cell lines compared to ATRA
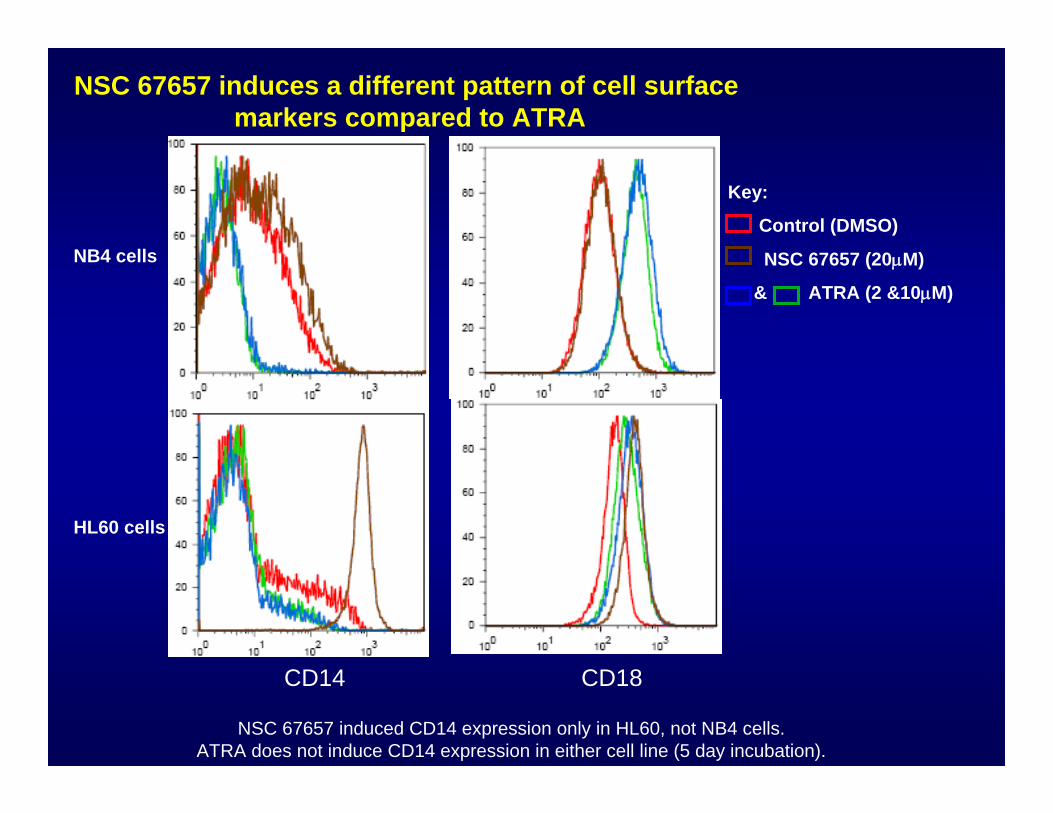
CD18CD14Key:
Control (DMSO)
NSC 67657 (20μM)
& ATRA (2 &10μM)
NB4 cells
HL60 cells
CD14 CD18
NSC 67657No effect
NSC 67657Induces CD14
NSC 67657 induces a different pattern of cell surfacemarkers compared to ATRA
NSC 67657 induced CD14 expression only in HL60, not NB4 cells. ATRA does not induce CD14 expression in either cell line (5 day incubation).
CD14 CD18
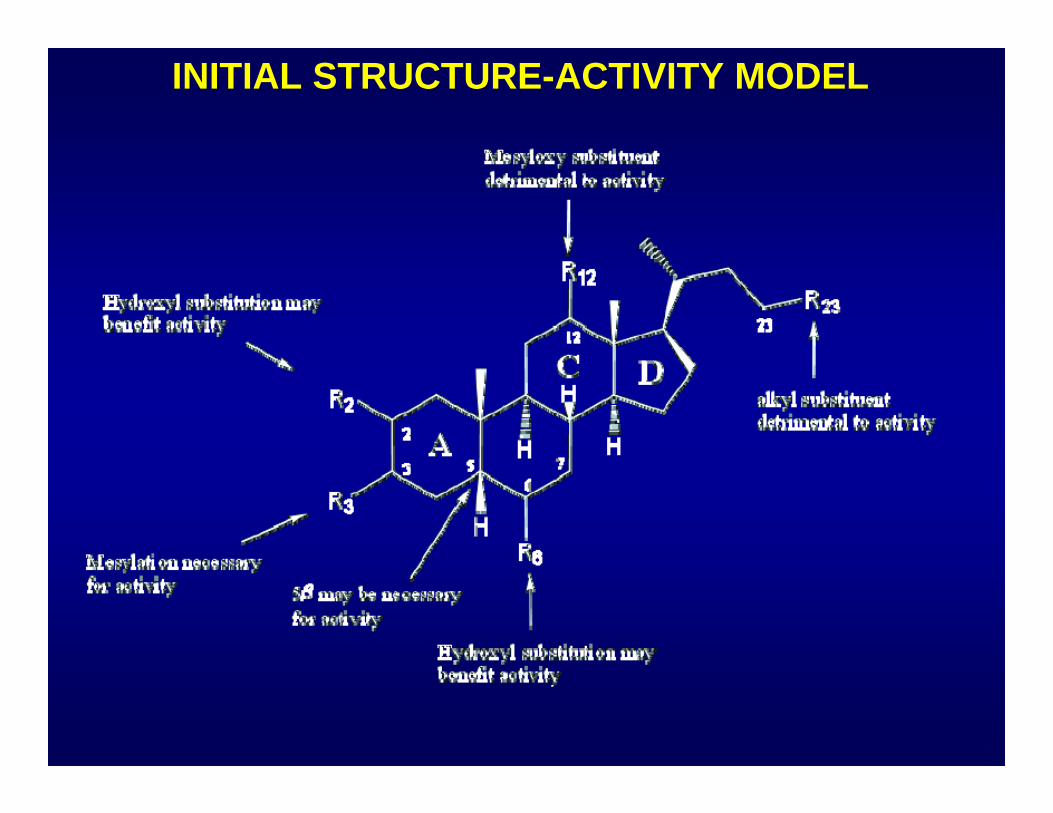
INITIAL STRUCTURE-ACTIVITY MODEL
OUTLINE OF PRESENTATION
• General Introduction
• Definition of Drug Targets
• Generating Diversity
• Definition of Lead Structures
• Qualifying Lead for • Transition to Early Trials
" RATIONAL":
-Structure based design
-Biochemical Screen
-Target-driven
Cell-based Screen
"EMPIRICAL"
-Bioassay of effect
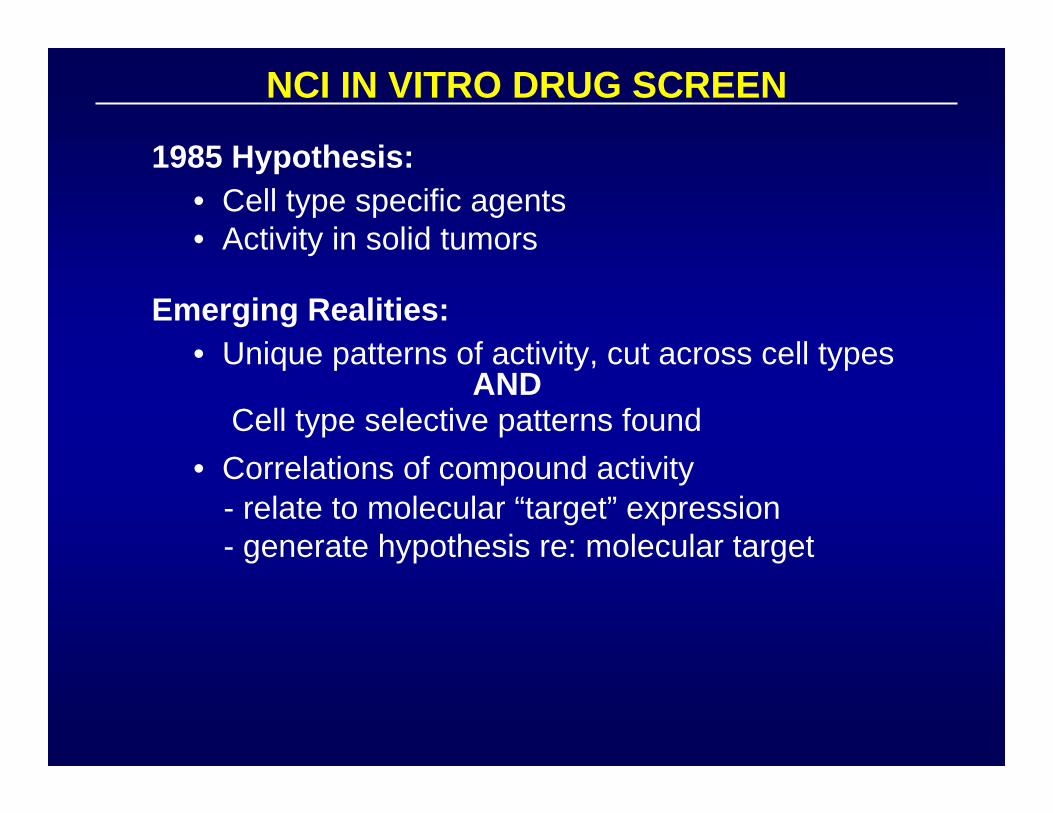
NCI IN VITRO DRUG SCREEN
1985 Hypothesis:
Emerging Realities:
• Cell type specific agents• Activity in solid tumors
• Unique patterns of activity, cut across cell types
• Correlations of compound activity
ANDCell type selective patterns found
- relate to molecular “target” expression- generate hypothesis re: molecular target
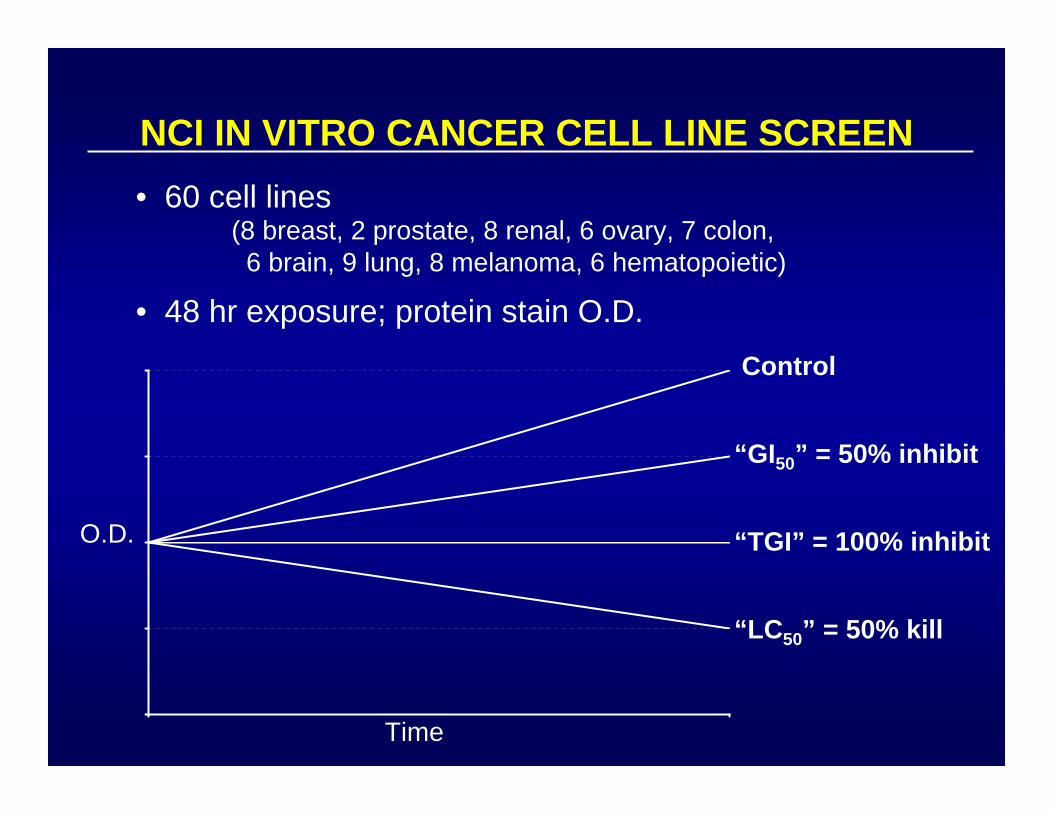
NCI IN VITRO CANCER CELL LINE SCREEN• 60 cell lines
• 48 hr exposure; protein stain O.D.
(8 breast, 2 prostate, 8 renal, 6 ovary, 7 colon,6 brain, 9 lung, 8 melanoma, 6 hematopoietic)
O.D.
Time
Control
“GI50” = 50% inhibit
“TGI” = 100% inhibit
“LC50” = 50% kill
All Cell Lines
Log10 of Sample Concentration (Molar)
Per
cent
age
Gro
wth
100
50
0
-50
-100 -9 -8 -7 -6 -5 -4
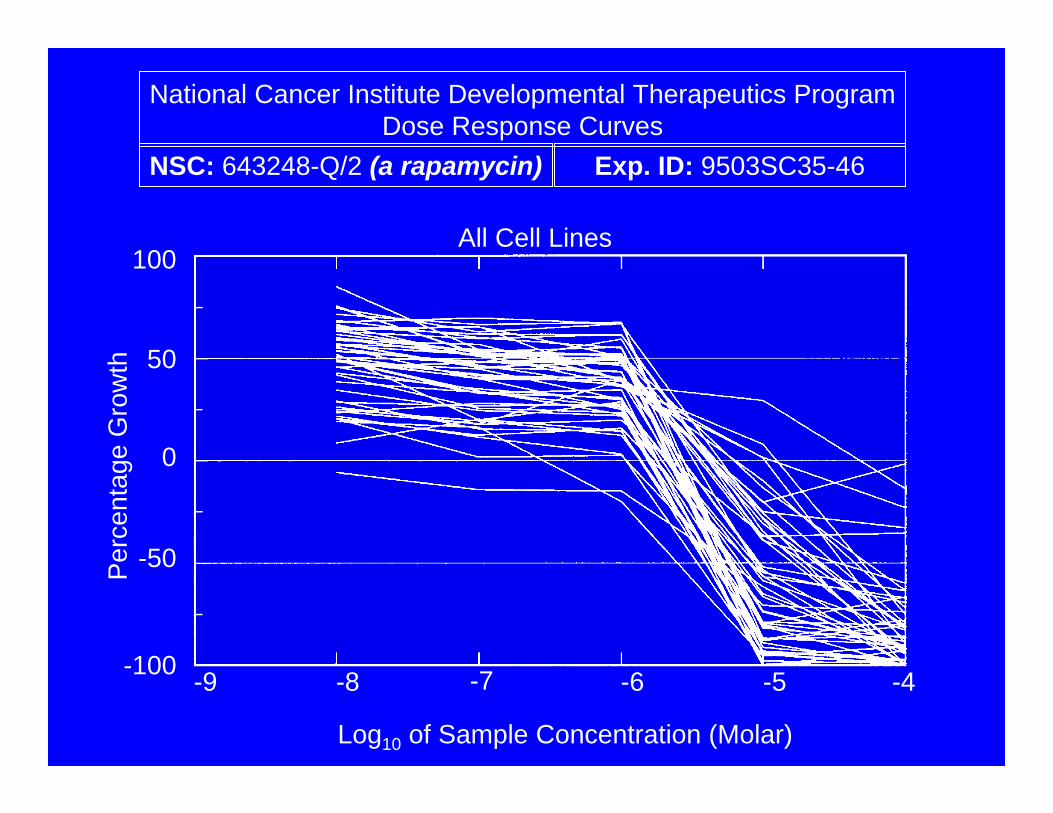
National Cancer Institute Developmental Therapeutics ProgramDose Response Curves
NSC: 643248-Q/2 (a rapamycin) Exp. ID: 9503SC35-46
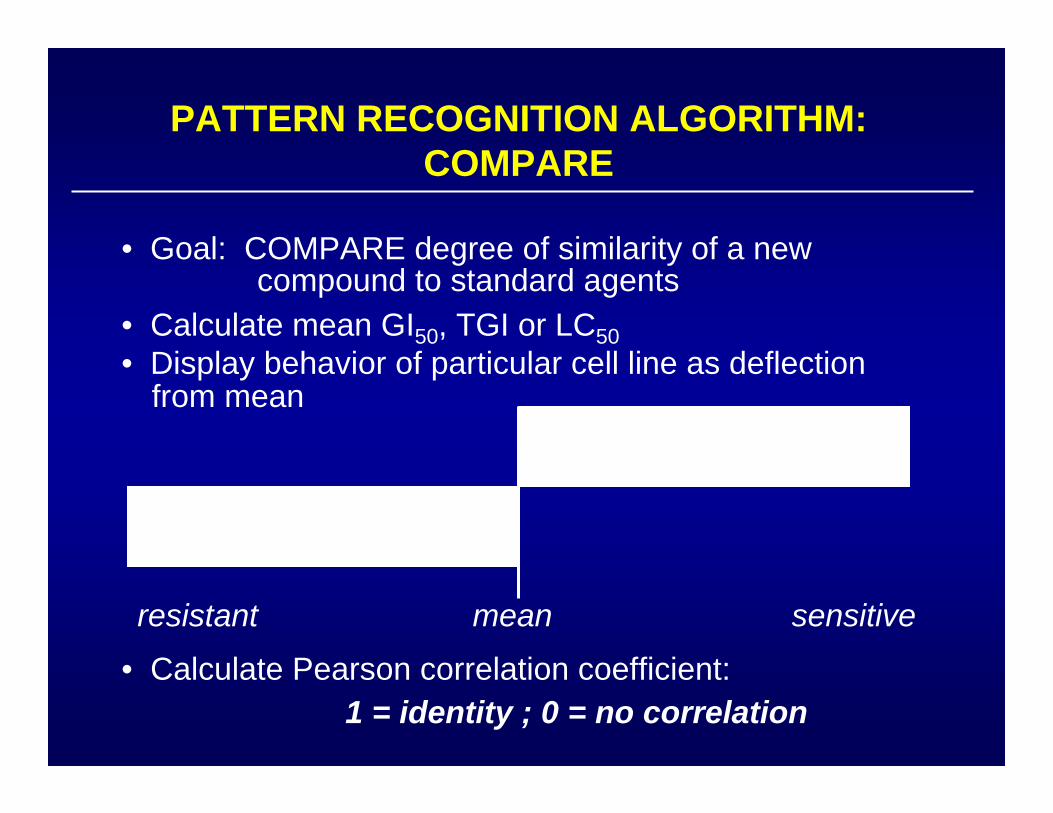
PATTERN RECOGNITION ALGORITHM:COMPARE
• Goal: COMPARE degree of similarity of a new
• Calculate mean GI50, TGI or LC50• Display behavior of particular cell line as deflection
• Calculate Pearson correlation coefficient:
compound to standard agents
1 = identity ; 0 = no correlation
resistant mean sensitive
from mean
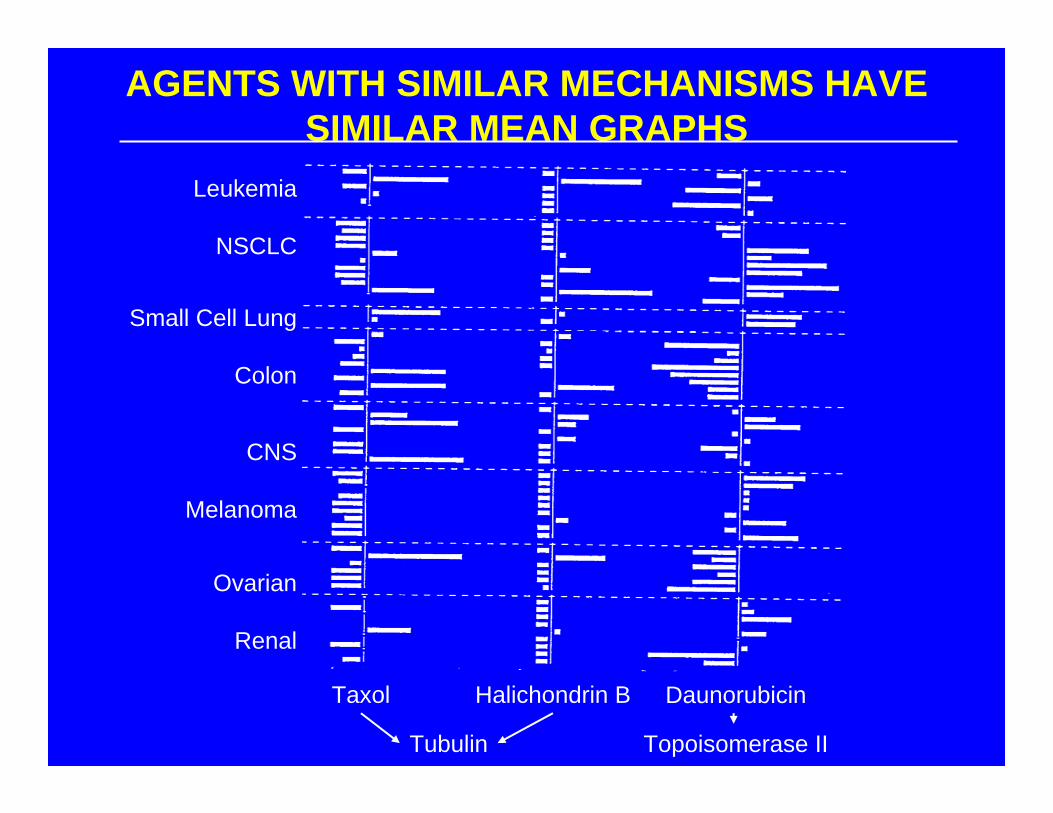
Taxol Halichondrin B Daunorubicin
Topoisomerase II
Leukemia
NSCLC
Small Cell Lung
Colon
CNS
Melanoma
Ovarian
Renal
AGENTS WITH SIMILAR MECHANISMS HAVESIMILAR MEAN GRAPHS
Tubulin
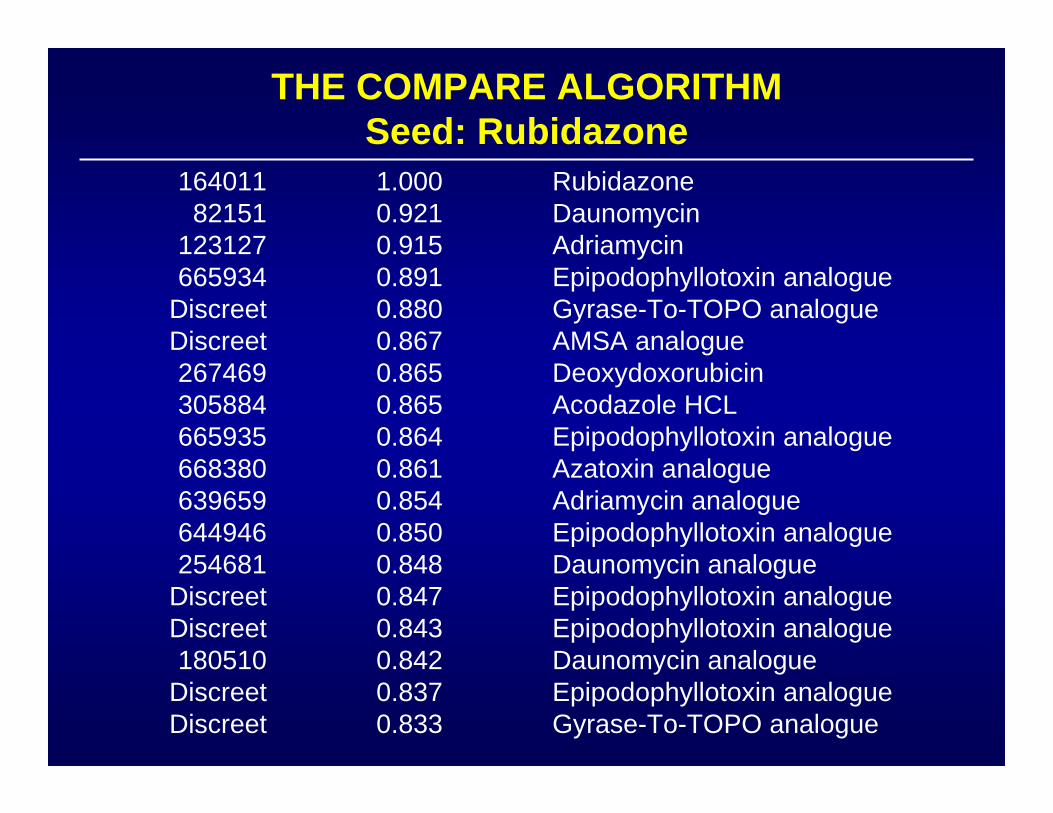
THE COMPARE ALGORITHMSeed: Rubidazone
16401182151
123127665934
DiscreetDiscreet267469305884665935668380639659644946254681
DiscreetDiscreet180510
DiscreetDiscreet
1.0000.9210.9150.8910.8800.8670.8650.8650.8640.8610.8540.8500.8480.8470.8430.8420.8370.833
RubidazoneDaunomycinAdriamycinEpipodophyllotoxin analogueGyrase-To-TOPO analogueAMSA analogueDeoxydoxorubicinAcodazole HCLEpipodophyllotoxin analogueAzatoxin analogueAdriamycin analogueEpipodophyllotoxin analogueDaunomycin analogueEpipodophyllotoxin analogueEpipodophyllotoxin analogueDaunomycin analogueEpipodophyllotoxin analogueGyrase-To-TOPO analogue
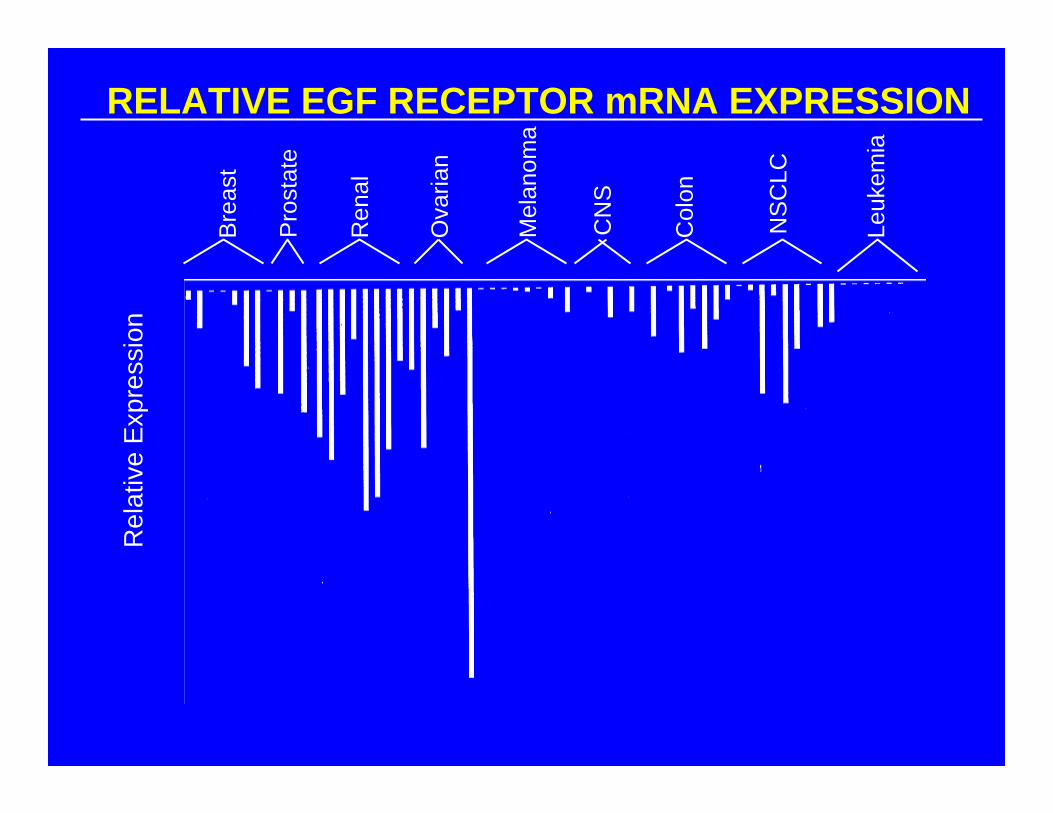
RELATIVE EGF RECEPTOR mRNA EXPRESSION
Bre
ast
Pro
stat
e
Ren
al
Ova
rian
Mel
anom
a
CN
S
Col
on
NS
CLC
Leuk
emia
Rel
ativ
e E
xpre
ssio
n

COMPARE ANALYSIS:EGF RECEPTOR
40,421 COMPOUNDS IN THE NCI DATABASE
RANK CORRELATION CHEMICAL NAME1
2
7
88
0.71
0.66
0.57
0.43
TGFα-PE40
Toxin-Δ53L, MW=43KEGFR Tyrosine Kinase Inhibitor
EGFR Tyrosine Kinase Inhibitor

DRUG TARGET CLUSTERINGSREVEAL CLUES TO MECHANISM
Nature Genetics 24: 236, 2000; http://dtp.nci.nih.gov5FU/DPYD L-Asparaginase/ASNS
OUTLINE OF PRESENTATION
• General Introduction
• Definition of Drug Targets
• Generating Diversity
• Definition of Lead Structures
• Qualifying Lead for Transition to Early Trials
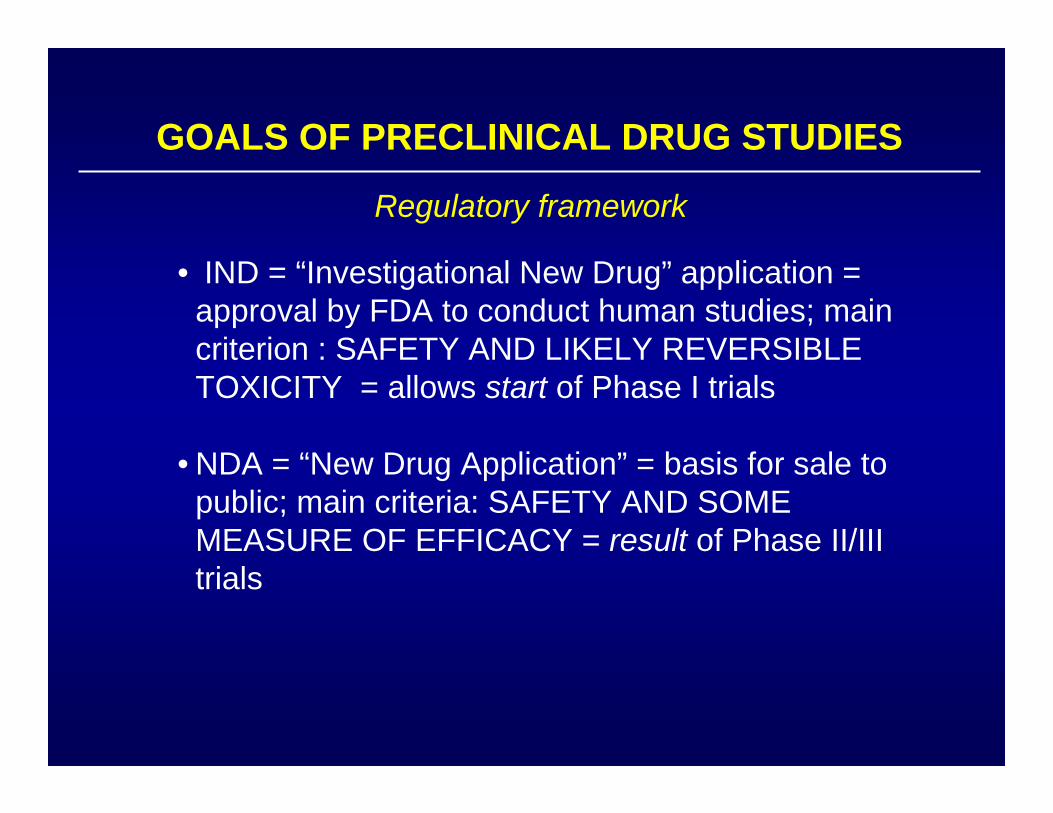
GOALS OF PRECLINICAL DRUG STUDIES
• IND = “Investigational New Drug” application = approval by FDA to conduct human studies; main criterion : SAFETY AND LIKELY REVERSIBLE TOXICITY = allows start of Phase I trials
• NDA = “New Drug Application” = basis for sale to public; main criteria: SAFETY AND SOME MEASURE OF EFFICACY = result of Phase II/III trials
Regulatory framework
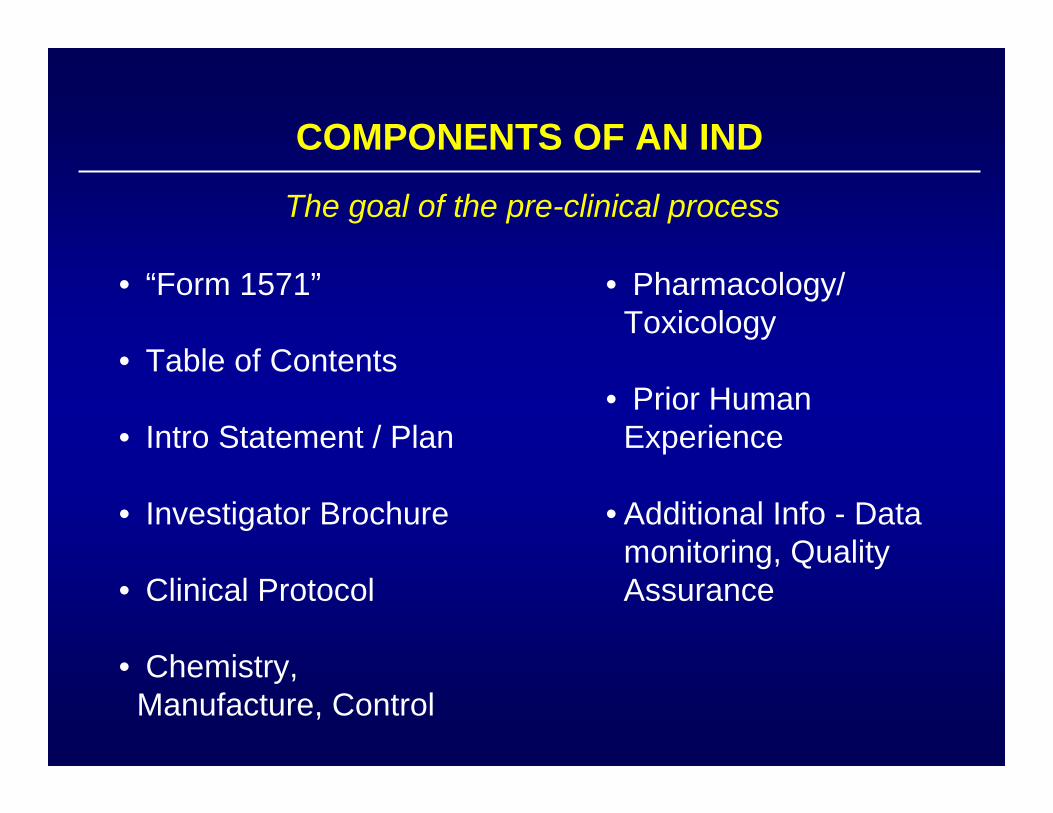
COMPONENTS OF AN IND
• “Form 1571”
• Table of Contents
• Intro Statement / Plan
• Investigator Brochure
• Clinical Protocol
• Chemistry, Manufacture, Control
The goal of the pre-clinical process
• Pharmacology/ Toxicology
• Prior Human Experience
• Additional Info - Data monitoring, Quality Assurance
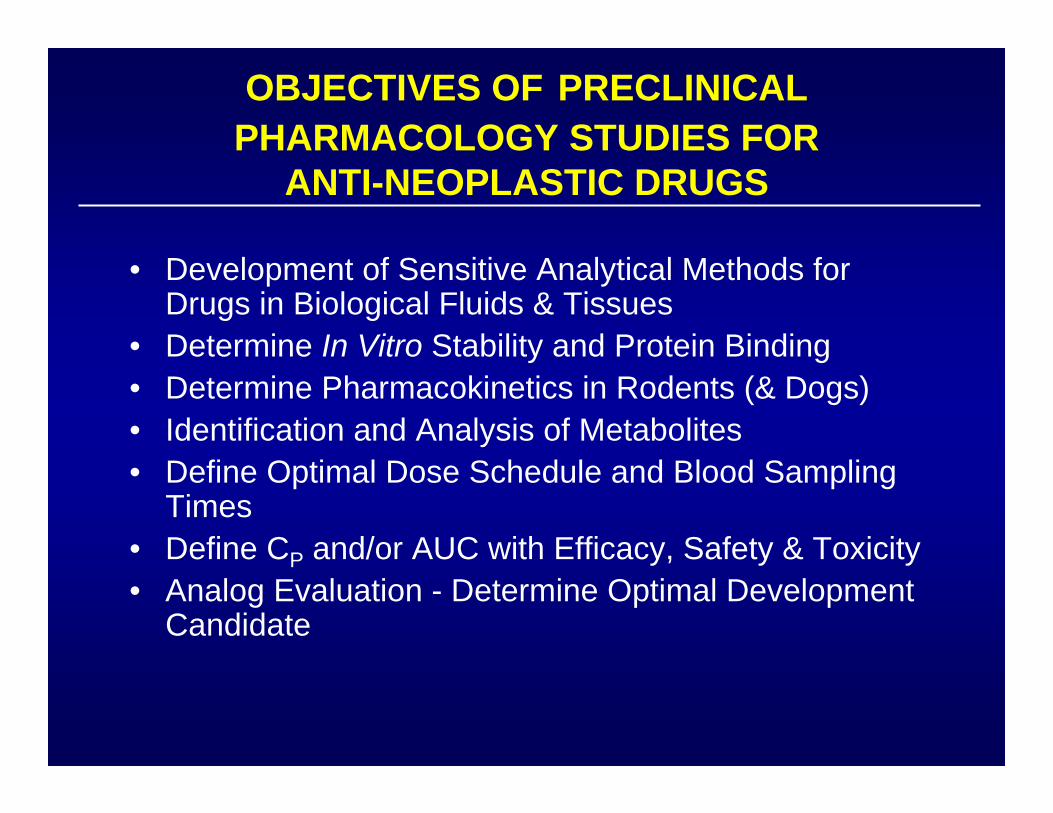
OBJECTIVES OF PRECLINICAL PHARMACOLOGY STUDIES FOR
ANTI-NEOPLASTIC DRUGS
• Development of Sensitive Analytical Methods for Drugs in Biological Fluids & Tissues
• Determine In Vitro Stability and Protein Binding• Determine Pharmacokinetics in Rodents (& Dogs)• Identification and Analysis of Metabolites• Define Optimal Dose Schedule and Blood Sampling
Times• Define CP and/or AUC with Efficacy, Safety & Toxicity• Analog Evaluation - Determine Optimal Development
Candidate
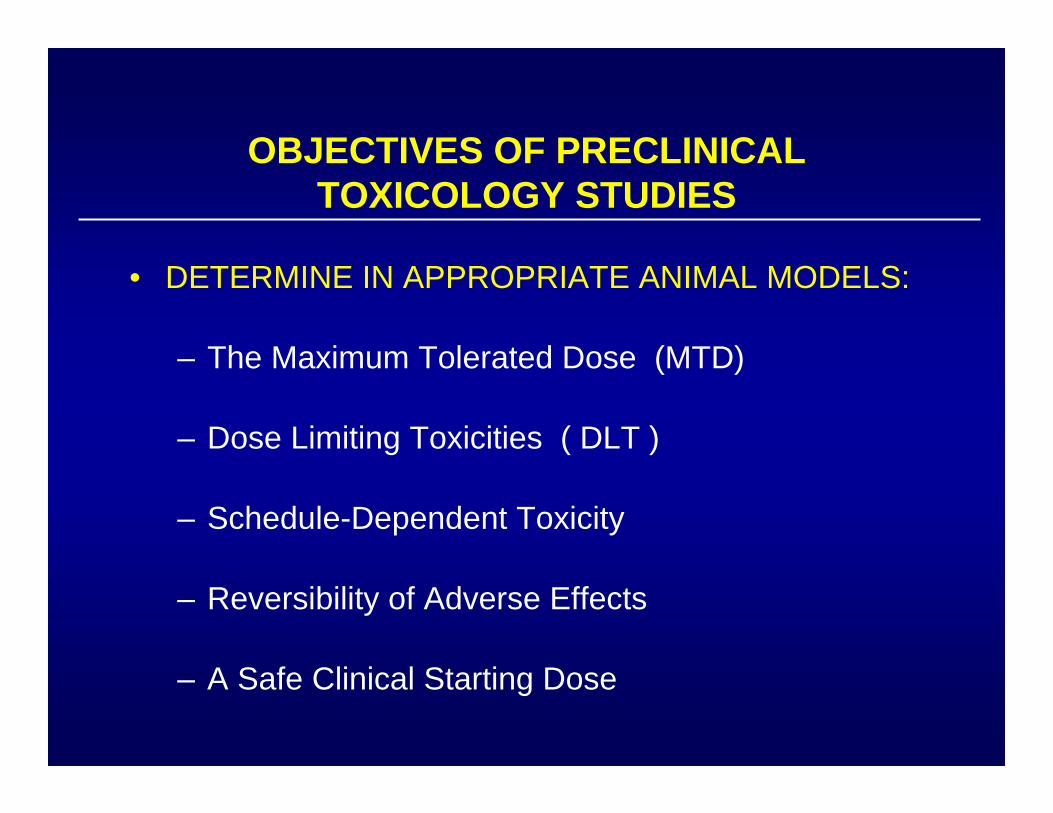
OBJECTIVES OF PRECLINICAL TOXICOLOGY STUDIES
• DETERMINE IN APPROPRIATE ANIMAL MODELS:
– The Maximum Tolerated Dose (MTD)
– Dose Limiting Toxicities ( DLT )
– Schedule-Dependent Toxicity
– Reversibility of Adverse Effects
– A Safe Clinical Starting Dose
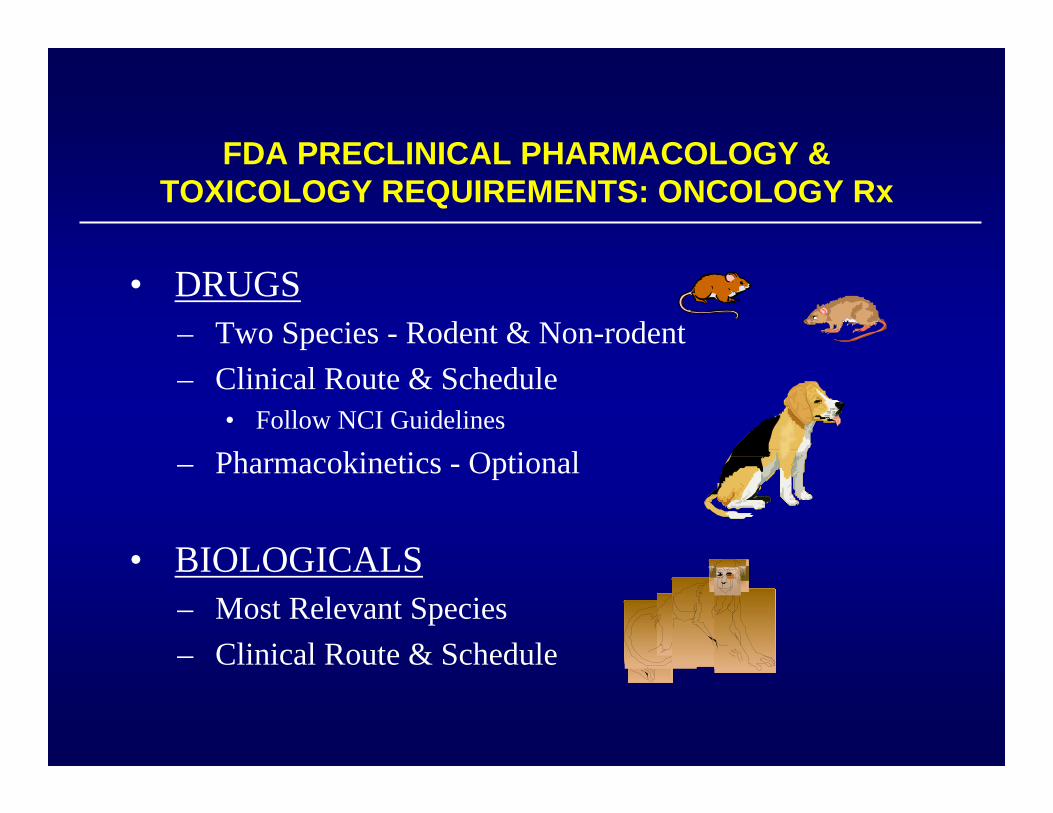
FDA PRECLINICAL PHARMACOLOGY & TOXICOLOGY REQUIREMENTS: ONCOLOGY Rx
• DRUGS– Two Species - Rodent & Non-rodent– Clinical Route & Schedule
• Follow NCI Guidelines
– Pharmacokinetics - Optional
• BIOLOGICALS– Most Relevant Species– Clinical Route & Schedule
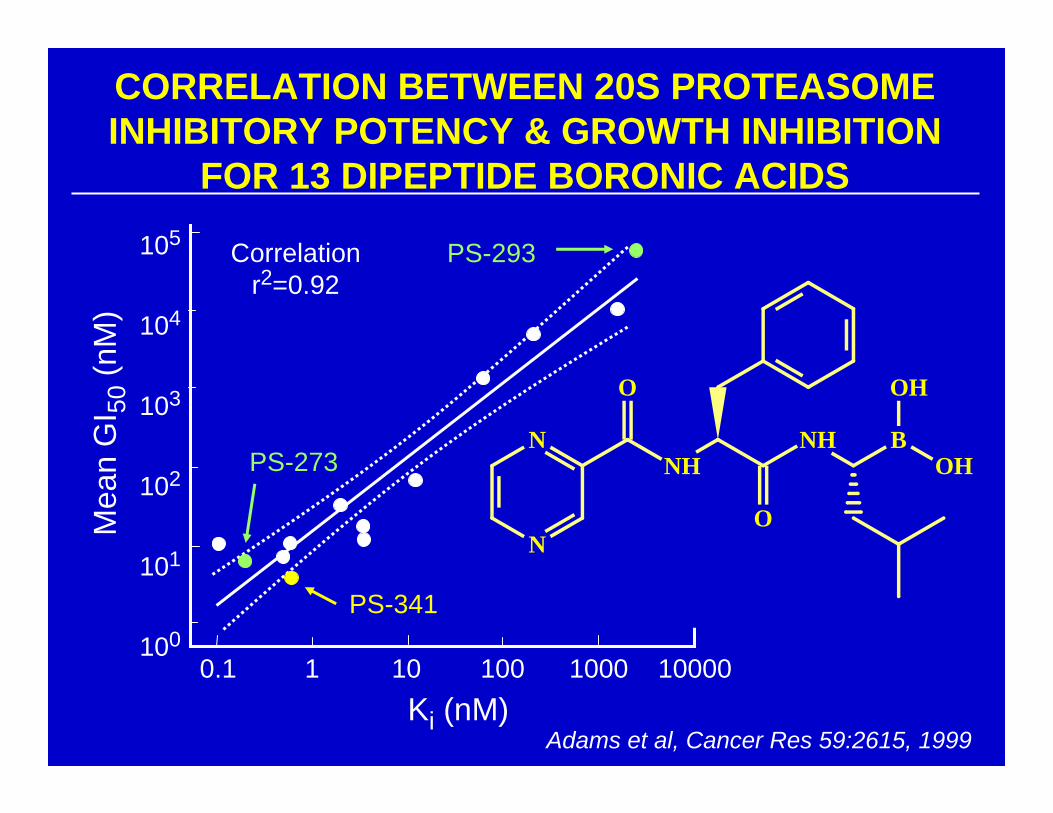
CORRELATION BETWEEN 20S PROTEASOMEINHIBITORY POTENCY & GROWTH INHIBITION
FOR 13 DIPEPTIDE BORONIC ACIDS
Adams et al, Cancer Res 59:2615, 1999
Mea
n G
I 50
(nM
)
Ki (nM)
PS-341
PS-273
PS-293
0.1 1 10 100 1000 10000
105
104
103
102
101
100
NH
O
N
N
NH
O
BOH
OH
Correlationr2=0.92

EFFECT OF PS-341ON PC-3 TUMOR GROWTH IN MICETu
mor
Vol
ume
(% V
ehic
le)
Week
Treatment
700
600
500
400
300
200
100
00 1 2 3 4 5 6
PS-3411.0 mg/kg(n=10)
PS-3410.3 mg/kg(n=15)
Vehicle(n=15)
Adams et al, Cancer Res 59:2615, 1999
EFFECT OF PS-341ON 20S PROTEASOME ACTIVITY
120
100
80
60
40
20
00.1 0.3 1.0 3.0VehiclePS-341 (mg/kg)
20S
Act
ivity
(% V
ehic
le)
Mouse WBC PC-3
Adams et al, Cancer Res 59:2615, 1999
120
100
80
60
40
20
0
PS-341 (mg/kg) 0.3 0.6Vehicle
20S
Act
ivity
(% V
ehic
le)
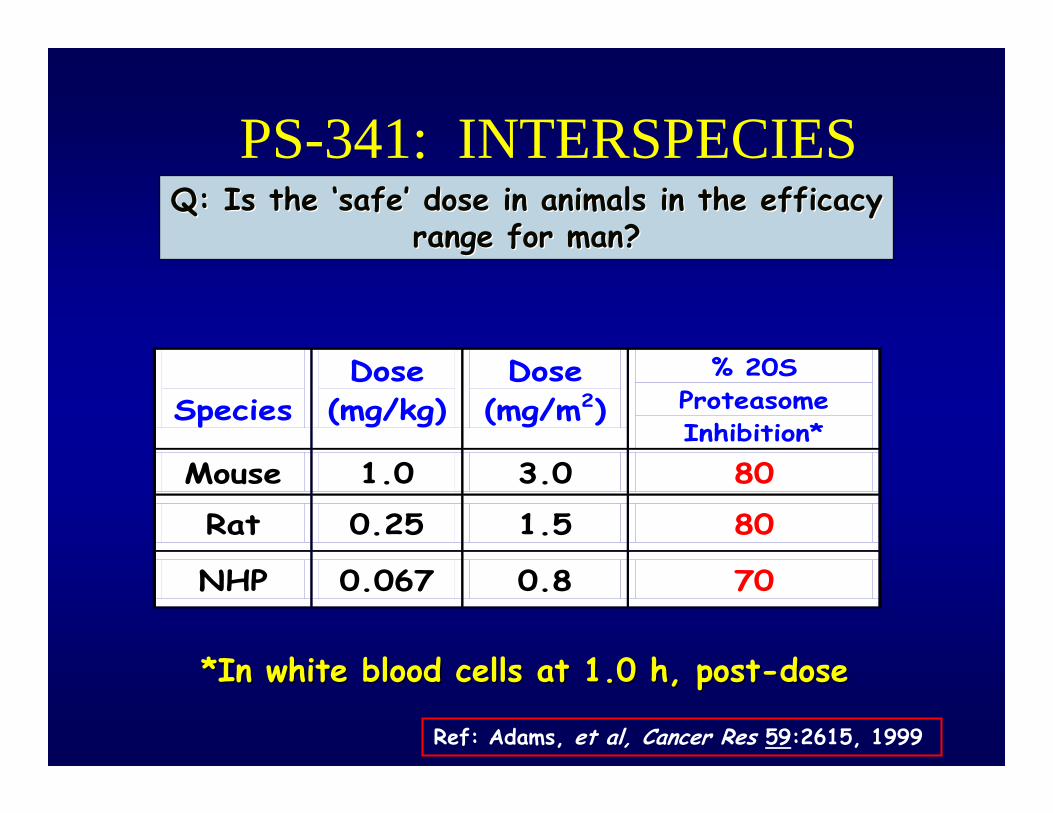
PS-341: INTERSPECIES DOSE RELATIONSHIP
*In white blood cells at 1.0 h, post*In white blood cells at 1.0 h, post--dosedose
Q: Is the Q: Is the ‘‘safesafe’’ dose in animals in the efficacy dose in animals in the efficacy range for man?range for man?
Ref: Adams, et al, Cancer Res 59:2615, 1999
Species
Dose (mg/kg)
Dose (mg/m2)
% 20S Proteasome Inhibition*
Mouse 1.0 3.0 80
Rat 0.25 1.5 80
NHP 0.067 0.8 70

0.1 1 100
20
40
60
80
100
120 MDACCMSKCCMayoNYUWisconsinUNCDFCICortes
1.96 mg/m2
PS-341 (Log dose, mg/m2)
% 2
0S A
ctiv
ity
Ex Vivo Proteasome Activity:Ex Vivo Proteasome Activity:1 Hour Post Treatment1 Hour Post Treatment
ACKNOWLEDGEMENTS
NCIJ. TomaszewskiM. AlleyM. Hollingshead / S. StinsonJ. JohnsonA. Monks / N. ScudieroS. BatesD. Zaharevitz / R. GussioS. DeckerR. Shoemaker / M. Currens
J. AdamsMillenium
J. LazoU. Pittsburgh