Drug and Alcohol Dependence - Duke University … to compensate for differences in selection...
8
Drug and Alcohol Dependence 132 (2013) 301–308 Contents lists available at SciVerse ScienceDirect Drug and Alcohol Dependence jo ur nal homep ag e: www.elsevier.com/locate/drugalcdep Individual- and community-level correlates of cigarette-smoking trajectories from age 13 to 32 in a U.S. population-based sample Bernard Fuemmeler a,b,e,∗ , Chien-Ti Lee a , Krista W. Ranby c , Trenette Clark d , F. Joseph McClernon e,f , Chongming Yang c , Scott H. Kollins e a Duke University Medical Center, Department of Psychology and Neuroscience, Durham, NC, United States b Duke University, Department of Community and Family Medicine, Durham, NC, United States c Duke University, Center for Child and Family Policy, Durham, NC, United States d University of North Carolina at Chapel Hill, School of Social Work, Chapel Hill, NC, United States e Duke University Medical Center, Department of Psychiatry and Behavioral Sciences, Durham, NC, United States f Durham VAMC Mental Illness Research, Education, and Clinical Center, Durham, NC, United States a r t i c l e i n f o Article history: Received 31 August 2012 Received in revised form 16 January 2013 Accepted 17 February 2013 Available online 15 March 2013 Keywords: Smoking trajectories Zero-inflated Poisson (ZIP) LCGA National Longitudinal Study of Adolescent Health Add health a b s t r a c t Background: Characterizing smoking behavior is important for informing etiologic models and targeting prevention efforts. This study explored the effects of both individual- and community-level variables in predicting cigarette use vs. non-use and level of use among adolescents as they transition into adulthood. Methods: Data on 14,779 youths (53% female) were drawn from the National Longitudinal Study of Ado- lescent Health (Add Health); a nationally representative longitudinal cohort. A cohort sequential design allowed for examining trajectories of smoking typologies from age 13 to 32 years. Smoking trajectories were evaluated by using a zero-inflated Poisson (ZIP) latent growth analysis and latent class growth analysis modeling approach. Results: Significant relationships emerged between both individual- and community-level variables and smoking outcomes. Maternal and peer smoking predicted increases in smoking over development and were associated with a greater likelihood of belonging to any of the four identified smoking groups versus Non-Users. Conduct problems and depressive symptoms during adolescence were related to cigarette use versus non-use. State-level prevalence of adolescent smoking was related to greater cigarette use during adolescence. Conclusions: Individual- and community-level variables that distinguish smoking patterns within the population aid in understanding cigarette use versus non-use and the quantity of cigarette use into adulthood. Our findings suggest that efforts to prevent cigarette use would benefit from attention to both parental and peer smoking and individual well-being. Future work is needed to better understand the role of variables in the context of multiple levels (individual and community-level) on smoking trajectories. © 2013 Elsevier Ireland Ltd. All rights reserved. 1. Introduction Cigarette use typically begins in early adolescence, with estab- lished regular use becoming more prevalent as adolescents mature into adulthood (DiFranza et al., 2007). Smoking habits, however, do not develop the same way for every individual. Some adolescents experiment with smoking but do not increase use with age, while others rapidly progress from experimentation to heavy smoking. Recent studies, employing mixture-modeling approaches, have identified different smoking trajectory subgroups according to time ∗ Corresponding author at: Department of Community and Family Medicine, Psy- chology and Neuroscience, and Psychiatry and Behavioral Sciences, Duke University Medical Center, DUMC 104006, Durham, NC 27710, United States. Tel.: +1 919 681 7171; fax: +1 919 684 5108. E-mail address: [email protected] (B. Fuemmeler). of onset and level of use over time (Abroms et al., 2005; Audrain- McGovern et al., 2004; Bernat et al., 2008; Chassin et al., 2009, 2000; Costello et al., 2008; Karp et al., 2005; Orlando et al., 2004; Pollard et al., 2010; Riggs et al., 2007; White et al., 2002). These studies outline different smoking patterns and provide insight for further analyses of etiologies and potential intervention strate- gies. Across the studies mentioned above, the number and patterns of smoking trajectories vary considerably. The variations may reflect differences in sample size, length of follow-up, or relative repre- sentativeness of the samples. Smaller sample sizes have typically resulted in the identification of fewer smoking trajectory subgroups (Chassin et al., 2000; White et al., 2002). Following individuals over a longer time span may also affect the trajectories observed. Many extant studies utilized regional community samples with a short window of follow-up rather than nationally representative, longitudinal samples (Chassin et al., 2000; Colder et al., 2001; 0376-8716/$ – see front matter © 2013 Elsevier Ireland Ltd. All rights reserved. http://dx.doi.org/10.1016/j.drugalcdep.2013.02.021
Transcript of Drug and Alcohol Dependence - Duke University … to compensate for differences in selection...

If
BCa
b
c
d
e
f
a
ARRAA
KSZLNHA
1
lineoRi
cMT
0h
Drug and Alcohol Dependence 132 (2013) 301– 308
Contents lists available at SciVerse ScienceDirect
Drug and Alcohol Dependence
jo ur nal homep ag e: www.elsev ier .com/ locate /drugalcdep
ndividual- and community-level correlates of cigarette-smoking trajectoriesrom age 13 to 32 in a U.S. population-based sample
ernard Fuemmelera,b,e,∗ , Chien-Ti Leea , Krista W. Ranbyc , Trenette Clarkd , F. Joseph McClernone,f ,hongming Yangc, Scott H. Kollinse
Duke University Medical Center, Department of Psychology and Neuroscience, Durham, NC, United StatesDuke University, Department of Community and Family Medicine, Durham, NC, United StatesDuke University, Center for Child and Family Policy, Durham, NC, United StatesUniversity of North Carolina at Chapel Hill, School of Social Work, Chapel Hill, NC, United StatesDuke University Medical Center, Department of Psychiatry and Behavioral Sciences, Durham, NC, United StatesDurham VAMC Mental Illness Research, Education, and Clinical Center, Durham, NC, United States
r t i c l e i n f o
rticle history:eceived 31 August 2012eceived in revised form 16 January 2013ccepted 17 February 2013vailable online 15 March 2013
eywords:moking trajectoriesero-inflated Poisson (ZIP)CGAational Longitudinal Study of Adolescentealthdd health
a b s t r a c t
Background: Characterizing smoking behavior is important for informing etiologic models and targetingprevention efforts. This study explored the effects of both individual- and community-level variables inpredicting cigarette use vs. non-use and level of use among adolescents as they transition into adulthood.Methods: Data on 14,779 youths (53% female) were drawn from the National Longitudinal Study of Ado-lescent Health (Add Health); a nationally representative longitudinal cohort. A cohort sequential designallowed for examining trajectories of smoking typologies from age 13 to 32 years. Smoking trajectorieswere evaluated by using a zero-inflated Poisson (ZIP) latent growth analysis and latent class growthanalysis modeling approach.Results: Significant relationships emerged between both individual- and community-level variables andsmoking outcomes. Maternal and peer smoking predicted increases in smoking over development andwere associated with a greater likelihood of belonging to any of the four identified smoking groups versusNon-Users. Conduct problems and depressive symptoms during adolescence were related to cigaretteuse versus non-use. State-level prevalence of adolescent smoking was related to greater cigarette use
during adolescence.Conclusions: Individual- and community-level variables that distinguish smoking patterns within thepopulation aid in understanding cigarette use versus non-use and the quantity of cigarette use intoadulthood. Our findings suggest that efforts to prevent cigarette use would benefit from attention to bothg andt of m
parental and peer smokinof variables in the contex
. Introduction
Cigarette use typically begins in early adolescence, with estab-ished regular use becoming more prevalent as adolescents maturento adulthood (DiFranza et al., 2007). Smoking habits, however, doot develop the same way for every individual. Some adolescentsxperiment with smoking but do not increase use with age, while
thers rapidly progress from experimentation to heavy smoking.ecent studies, employing mixture-modeling approaches, havedentified different smoking trajectory subgroups according to time
∗ Corresponding author at: Department of Community and Family Medicine, Psy-hology and Neuroscience, and Psychiatry and Behavioral Sciences, Duke Universityedical Center, DUMC 104006, Durham, NC 27710, United States.
el.: +1 919 681 7171; fax: +1 919 684 5108.E-mail address: [email protected] (B. Fuemmeler).
376-8716/$ – see front matter © 2013 Elsevier Ireland Ltd. All rights reserved.ttp://dx.doi.org/10.1016/j.drugalcdep.2013.02.021
individual well-being. Future work is needed to better understand the roleultiple levels (individual and community-level) on smoking trajectories.
© 2013 Elsevier Ireland Ltd. All rights reserved.
of onset and level of use over time (Abroms et al., 2005; Audrain-McGovern et al., 2004; Bernat et al., 2008; Chassin et al., 2009,2000; Costello et al., 2008; Karp et al., 2005; Orlando et al., 2004;Pollard et al., 2010; Riggs et al., 2007; White et al., 2002). Thesestudies outline different smoking patterns and provide insight forfurther analyses of etiologies and potential intervention strate-gies.
Across the studies mentioned above, the number and patterns ofsmoking trajectories vary considerably. The variations may reflectdifferences in sample size, length of follow-up, or relative repre-sentativeness of the samples. Smaller sample sizes have typicallyresulted in the identification of fewer smoking trajectory subgroups(Chassin et al., 2000; White et al., 2002). Following individuals
over a longer time span may also affect the trajectories observed.Many extant studies utilized regional community samples with ashort window of follow-up rather than nationally representative,longitudinal samples (Chassin et al., 2000; Colder et al., 2001;
3 cohol D
Oi
dbsaoctuEme2
piosdan22iViteaetcivmitv
eatmdocastvg
2
2
gl3i(wrs2
02 B. Fuemmeler et al. / Drug and Al
rlando et al., 2004; Riggs et al., 2007; White et al., 2002), resultingn findings with potentially limited generalizability.
Cigarette use over time is particularly challenging to model, withifficulties stemming from the non-normal distribution reflectedy the majority of the people abstaining from cigarette use. Oneolution is to utilize zero inflated Poisson (ZIP) modeling, whichllows for simultaneously estimating both the zero (probabilityf cigarette use) and count (level of cigarettes typically smoked)omponents of the outcome. This approach also facilitates a morehorough understanding of smoking patterns by allowing the eval-ation of covariate effects on each of the two dynamic processes.xtending a ZIP model to longitudinal data by using a latent growthodeling (LGM) approach is well suited for analyzing count data in
pidemiologic studies, such as smoking over time (Liu and Powers,007).
With respect to correlates of smoking, a social-ecological modelroposed by Wilcox (2003) highlights the importance of both
ndividual- and community-level variables as important predictorsf youth smoking trajectories. At the individual level, depres-ive symptoms (Brook et al., 2006; Prinstein and La Greca, 2009),ecreased self-efficacy (Hiemstra et al., 2011), impulsivity (Florynd Manuck, 2009), conduct problems (Upadhyaya et al., 2002),umber of friends who smoke (Abroms et al., 2005; Ali and Dwyer,009; Costello et al., 2008; Hoffman et al., 2007; Karp et al.,005; Vitaro et al., 2004; White et al., 2002), and parental smok-
ng (Gilman et al., 2009; Paul et al., 2008; Villanti et al., 2011;itaro et al., 2004; White et al., 2002) have each been linked to
ncreased cigarette use. At the community-level, factors such asobacco advertising (Sargent et al., 2000), smoking policies (Bernatt al., 2008), cigarette price/taxation (Liang and Chaloupka, 2002),nd percentage of adolescent smokers in the community (Lovatot al., 2010) are also predictive of smoking. Yet, little is known abouthe unique or combined effects of individual- and community-levelorrelates in predicting smoking trajectories (Wilcox, 2003). Thus,t is not yet fully understood which sets of variables (individual-s. community-level) are principally predictive of the develop-ental progression of smoking, whether the relationships between
ndividual-level variables and smoking outcomes differ as a func-ion of different community variables, and to what extent theseariables can be used to differentiate smoking trajectory subgroups.
The present study aimed to build upon previous research byxamining the effects of individual- and community-level vari-bles on smoking trajectories over development from adolescenceo young adulthood in a nationally representative database with a
ore integrated approach. Thus, the current study set out to (1)escribe overall smoking development and identify distinct devel-pmental trajectories of cigarette use in a nationally representativeohort, (2) examine individual- and community-level variables andssess whether these variables are differentially associated withmoking trajectories or developmental subgroups, and 3) examinewo-way interactions between individual- and community-levelariables in predicting smoking trajectories or developmental sub-roups.
. Methods
.1. Data source and study sample
The study population was drawn from 20,774 adolescents in the National Lon-itudinal Study of Adolescent Health (Add Health), a nationally representativeongitudinal cohort. Respondents completed in-home surveys in 1995 and up to
additional times (1996, 2001–2002, 2008–2009). The mean ages of the partic-pants at each of the four waves of data collection were 15.65 (SD = 1.75), 16.22
SD = 1.64), 22.96 (SD = 1.77), and 28.9 (SD = 1.76), respectively. To ensure the dataas nationally representative, the Add Health survey was stratified by geographicegion, urban versus rural residence, school type, school ethnic diversity, and schoolize. Study design and data collection have been described elsewhere (Harris et al.,009; Resnick et al., 1997). The number of participants from the longitudinal cohort
ependence 132 (2013) 301– 308
who met the minimum criteria for inclusion (were interviewed at least at both WaveI and Wave IV and had available sampling weights) was limited to 14,779 (71.1% offull sample). Due to missing covariate data, particularly in parent reported educationlevel (missing n = 2094) and maternal smoking (missing n = 869), our analysis sam-ple was further reduced to 11,639. Compared to participants in the study sample,participants in the analysis sample were similar with respect to parental educa-tion level (college vs. no college) and sex. Those included in the analysis samplewere more likely to be Caucasian (�2 = 144.11, Cramer’s V = 0.10, p < .001) and livein a dual parent household (�2 = 301.52, Cramer’s V = 0.14, p < .001); however, thesedifferences were small (i.e., effect sizes < 0.3).
2.2. Measures
2.2.1. Dependent variable. At all waves, participants reported their smoking statususing a computer aided survey instrument (CASI). The smoking variable in the cur-rent analyses represents the average number of cigarettes smoked per day, limitedto the days the participant smoked, in the past 30 days at each wave. Participantswho had never smoked or who had not smoked during the past 30 days were codedas zero and were included in the analyses.
2.2.2. Individual-level variables.
2.2.2.1. Conduct problems. Participants were asked about their level of engage-ment in 13 conduct problem related behaviors (e.g., property damage, lying toguardians, fighting, number of truancies from school) at Wave I. The 13 items weredichotomized into 0 (never) and 1(1 or more) and then summed. The scale exhibitedadequate reliability (KR-20 = .69) and has been used in previously published studieswith this sample (Kollins et al., 2005; McClernon et al., 2008).
2.2.2.2. Depressive symptoms. A modified version of the Center for EpidemiologicStudies – Depression (CES-D; Crockett et al., 2005) scale was used to assess depres-sive symptomatology at Wave I. Respondents were asked to indicate how often theyexperienced any of 20 depressive symptoms in the past seven days (e.g., you feltdepressed). Eighteen items had a response option ranging from 0 (never or rarely)to 3 (most or all of the time). Two other items had a 5-point response scale, whichranged from 0 (never) to 4 (every day). Following previous methods with this scale(Crockett et al., 2005), the 5-point items were modified so that a response of 4 wasrecoded as a 3 and other responses were retained. A mean was created based on the20 items. Cronbach’s alpha was .75.
2.2.2.3. Peer and maternal smoking. At Wave I, participants were asked how manyof their 3 best friends smoked at least one cigarette a day (range = 0–3), and whetheror not their resident mother ever smoked cigarettes.
2.2.3. Community-level variables. The Add Health Wave I tobacco contextualdatabase provides a number of community-level variables linked with respondents’identifiers. Home locations for respondents were geo-coded, linking home locationto state, county, tract, and block group Census areas, which allows for the utilizationof contextual data from many other sources. Data sources used in the Add Healthcontextual database containing state-level information were tobacco marketing leg-islation, state cigarette tax, and state prevalence of adolescent smoking.
The presence of tobacco marketing legislation was measured as not present(0) or present (1). The presence of legislation was based on the existence of anyor all of the following: the prohibition of tobacco marketing on billboards within500 feet of schools and/or churches, a mandate of warnings within advertising forsmokeless tobacco, and the prohibition of advertising on lottery tickets or videogames (Downey and Gardiner, 1996). Due to the methods by which the source wascollected, itemized legislative data was unavailable. Excise tax on a pack of cigarettesin 1995 served as the measure of state cigarette tax. Raw values ranged from 2.5cents (Virginia) to 81.5 cents (Washington). To increase interpretability the 1 centvalue was rounded to 25 cent increments. The prevalence of adolescent smokingwas drawn from the Youth Risk Behavioral Surveillance survey, which provided thepercent of high school students (grades 9–12) in the Add Health participant’s statewho smoked in 1995. The measure ranged from 3% to 19.9% (Kann et al., 1995).
2.2.4. Control variables. To reduce potential confounding by sex, race/ethnicity,socioeconomic status or caregiver burden, the following covariates were included inall models: sex, race/ethnicity (white, Hispanic, African–American, other), parental(or caregivers’) education (less than high school, high school or equivalent, somecollege, and college degree or beyond), and family structure (one versus two parenthousehold).
2.3. Analytic strategy
Analyses were conducted using Mplus version 6.12 (Muthén and Muthén,1998–2012). Survey design effects and survey weights were incorporated into theanalysis to compensate for differences in selection probabilities, differential ratesof non-response and attrition, and chance fluctuations between the sample andthe population. The application of survey weights helps the Add Health sample by
ohol D
ag
2mIetiadcmeo2jdp
tqtctocite
2figpdwIetals2bwues
3
3
Tlppcol0
3
saeSccg
B. Fuemmeler et al. / Drug and Alc
pproximating the composition of U.S. population as closely as possible within theiven confines of the data.
.3.1. Latent growth modeling of changes in smoking. LGM with ZIP was used toodel patterns of developmental changes in smoking among youths during Wave
(minimum age of 13) through Wave IV (maximum age of 32). LGM allows forstimating the average level of a parameter at a point in time (i.e., intercept),he rate of increase/decrease over time (i.e., linear trend), and the rate of changen the increase/decrease (i.e., quadratic trend; Bollen and Curran, 2006; Duncannd Duncan, 2004). These growth components can be regressed on covariates toetermine the association of a particular covariate with each growth component. Aohort-sequential design was employed, in which age, rather than wave of assess-ent, was the unit of time (Bollen and Curran, 2006; Duncan et al., 2006, Duncan
t al., 2007). Individual Add Health respondents contributed up to four repeatedbservations of smoking. Due to age overlap, an adequate number of participants at0 discrete ages were available, and thus, it was possible to model the smoking tra-
ectory from age 13 to 32. Using this design results in substantial amounts of missingata, however, Mplus employs an expectation maximization (EM) algorithm to limitotential biases in such designs (Duncan et al., 2006).
To start, a series of unconditional models were evaluated to determine whetherhe smoking trajectories were best represented by a linear only or a linear anduadratic growth function. Within this LGM framework, ZIP was used to simul-aneously estimate binary (probability of cigarette use) and count (number ofigarettes smoked among those who smoked) components of the smoking trajec-ories. The count component of the smoking outcome is referred to as “the levelf smoking” throughout the analysis and discussion. Both binary and count growthomponents were regressed on the covariates which included control variables,ndividual-, and community-level variables. We also examined two-way interac-ions between individual- and community-level correlates with significant mainffects in the model.
.3.2. Latent class growth analysis of smoking trajectory subgroups. Subsequent totting the LGM, a LCGA with ZIP was used to estimate smoking trajectory sub-roups. LCGA is a semi-parametric group-based approach that assumes unobservedopulation heterogeneity in smoking and change in smoking over time. This data-riven approach produces a latent categorical class variable for each individual,ith distinct categories representing each subgroup (Li et al., 2001). The Bayesian
nformation Criterion (BIC; Schwarz, 1978) is used as the primary fit statistic tovaluate whether a given model with a certain number of classes fits the data bet-er than a nested model with one fewer class. Additionally, entropy, parsimony,nd substantive interpretability are also used to evaluate the results. Models withower Bayesian Information Criteria values, higher entropy, parsimony, and sub-tantive interpretability are preferred (Connell et al., 2006; Muthén and Muthén,000). After we established the best-fitting growth-mixture model, the associationetween the individual- and community-level variables and smoking subgroupsere examined via multinomial logistic regression. This was done within Mplus bytilizing 20 pseudo draws based on posterior probabilities of group membership forach individual. For these results, the non-smoking subgroup served as the referentubgroup (Clark and Muthén, 2009).
. Results
.1. Descriptive statistics
Approximately half (53%) of the sample (N = 11,639) was female.he largest race/ethnic group was non-Hispanic White (56%), fol-owed by Black (20%), Hispanic (16%), and Other (8%). Seventy-twoercent of respondents lived in a two-parent household, and 24% ofrimary caregivers had a college degree or higher. Forty seven per-ent of participants had a mother figure that ever smoked, and 43%f the sample reported at least one friend who smoked. The meanevel of depressive symptoms at baseline was .61 (SD = .40, range–2.85) and conduct problems was .89 (SD = 1.39, range 0–10).
.2. Latent growth modeling of changes in smoking
Because the simulated cohort begins at age 13, this age waset as the intercept for all models in the current study. Thisge corresponds to the peak age of cigarette initiation (Johnstont al., 2008). A significant chi-square difference test statistic using
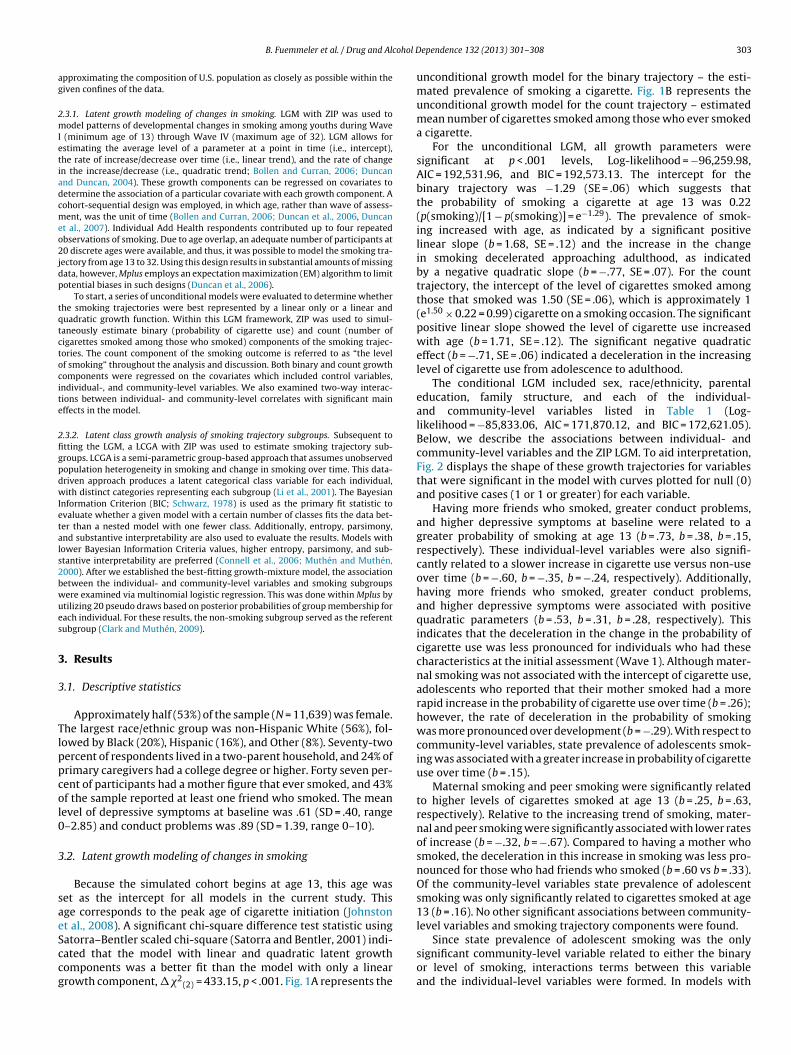
atorra–Bentler scaled chi-square (Satorra and Bentler, 2001) indi-ated that the model with linear and quadratic latent growthomponents was a better fit than the model with only a linearrowth component, ��2(2) = 433.15, p < .001. Fig. 1A represents the
ependence 132 (2013) 301– 308 303
unconditional growth model for the binary trajectory – the esti-mated prevalence of smoking a cigarette. Fig. 1B represents theunconditional growth model for the count trajectory – estimatedmean number of cigarettes smoked among those who ever smokeda cigarette.
For the unconditional LGM, all growth parameters weresignificant at p < .001 levels, Log-likelihood = −96,259.98,AIC = 192,531.96, and BIC = 192,573.13. The intercept for thebinary trajectory was −1.29 (SE = .06) which suggests thatthe probability of smoking a cigarette at age 13 was 0.22(p(smoking)/[1 − p(smoking)] = e−1.29). The prevalence of smok-ing increased with age, as indicated by a significant positivelinear slope (b = 1.68, SE = .12) and the increase in the changein smoking decelerated approaching adulthood, as indicatedby a negative quadratic slope (b = −.77, SE = .07). For the counttrajectory, the intercept of the level of cigarettes smoked amongthose that smoked was 1.50 (SE = .06), which is approximately 1(e1.50 × 0.22 = 0.99) cigarette on a smoking occasion. The significantpositive linear slope showed the level of cigarette use increasedwith age (b = 1.71, SE = .12). The significant negative quadraticeffect (b = −.71, SE = .06) indicated a deceleration in the increasinglevel of cigarette use from adolescence to adulthood.
The conditional LGM included sex, race/ethnicity, parentaleducation, family structure, and each of the individual-and community-level variables listed in Table 1 (Log-likelihood = −85,833.06, AIC = 171,870.12, and BIC = 172,621.05).Below, we describe the associations between individual- andcommunity-level variables and the ZIP LGM. To aid interpretation,Fig. 2 displays the shape of these growth trajectories for variablesthat were significant in the model with curves plotted for null (0)and positive cases (1 or 1 or greater) for each variable.
Having more friends who smoked, greater conduct problems,and higher depressive symptoms at baseline were related to agreater probability of smoking at age 13 (b = .73, b = .38, b = .15,respectively). These individual-level variables were also signifi-cantly related to a slower increase in cigarette use versus non-useover time (b = −.60, b = −.35, b = −.24, respectively). Additionally,having more friends who smoked, greater conduct problems,and higher depressive symptoms were associated with positivequadratic parameters (b = .53, b = .31, b = .28, respectively). Thisindicates that the deceleration in the change in the probability ofcigarette use was less pronounced for individuals who had thesecharacteristics at the initial assessment (Wave 1). Although mater-nal smoking was not associated with the intercept of cigarette use,adolescents who reported that their mother smoked had a morerapid increase in the probability of cigarette use over time (b = .26);however, the rate of deceleration in the probability of smokingwas more pronounced over development (b = −.29). With respect tocommunity-level variables, state prevalence of adolescents smok-ing was associated with a greater increase in probability of cigaretteuse over time (b = .15).
Maternal smoking and peer smoking were significantly relatedto higher levels of cigarettes smoked at age 13 (b = .25, b = .63,respectively). Relative to the increasing trend of smoking, mater-nal and peer smoking were significantly associated with lower ratesof increase (b = −.32, b = −.67). Compared to having a mother whosmoked, the deceleration in this increase in smoking was less pro-nounced for those who had friends who smoked (b = .60 vs b = .33).Of the community-level variables state prevalence of adolescentsmoking was only significantly related to cigarettes smoked at age13 (b = .16). No other significant associations between community-level variables and smoking trajectory components were found.
Since state prevalence of adolescent smoking was the onlysignificant community-level variable related to either the binaryor level of smoking, interactions terms between this variableand the individual-level variables were formed. In models with

304 B. Fuemmeler et al. / Drug and Alcohol Dependence 132 (2013) 301– 308
F stimab
todl
3
i
TR
Nf
ig. 1. (A) Estimated probability of smoking a cigarette by developmental age. (B) Ey developmental age. Smoking trajectories from age 13 to age 32.
he main effects, there were no significant two-way interactionsf individual-level correlates (maternal smoking, peer smoking,epression, and conduct problems) with state prevalence of ado-
escents smoking identified.
.3. Latent class growth analysis of smoking trajectory subgroups
The fit of the unconditional growth mixture models for zero-nflated count data with 1–6 classes were compared. All models
able 1esults of ZIP latent growth model regressed on individual- and community-level variabl
Use vs. Non-use
Intercept Slope
Est.B SE Est.B SE
Maternal smoking .01 .03 .26*** .07
Peer smoking .73*** .03 −.60*** .06
Conduct problems .38*** .03 −.35*** .08
Depressive symptoms .15*** .03 −.24** .08
Tobacco marketing legislation −.03 .03 .10 .09
State prevalence of adolescents smoking .01 .02 .15* .08
State cigarette tax (in 25 cent units) −.06 .04 .08 .09
ote: Standardized coefficients above were values after controlling the influences fromamily structure).
* p < .05.** p < .01.
*** p < .001.
ted mean number of cigarettes smoked among those who ever smoked a cigarette
included the mean factor of intercept, slope, and quadraticslope. Comparing BIC indices across models, a five-class model(133120.46) and six-class model (130825.70) exhibited similar fit;however, a five-class model produced a higher entropy (.847) value,which indicates a better classification of participants. Further, given
the similar fit indices, the more parsimonious 5-class model ispreferable. Analyses were continued using the 5-class specifica-tion. The smoking trajectory pattern for each class (subgroup) ispresented in Fig. 3.es.
Level of use
Quadratic Intercept Slope Quadratic
Est.B SE Est.� SE Est.� SE Est.� SE
−.29*** .08 .25** .08 −.32* .15 .33* .16.53*** .08 .63*** .08 −.67*** .13 .60*** .14.31** .10 .13 .09 −.11 .18 .05 .19.28** .10 .03 .08 .01 .14 .05 .16
−.11 .11 −.07 .10 .20 .16 −.27 .16−.16 .10 .16* .07 −.17 .11 .22 .13−.08 .11 .02 .11 −.01 .20 .02 .22
individual demographic background (sex, race/ethnicity, parental education, and

B. Fuemmeler et al. / Drug and Alcohol Dependence 132 (2013) 301– 308 305
Fig. 2. Probabilities and rates of smoking for individual- and community-level variables with significant effects.

306 B. Fuemmeler et al. / Drug and Alcohol Dependence 132 (2013) 301– 308
s smo
LHtaisELscH
lfespislAttmfU(tsn
ssap
4
afiUEdh
Fig. 3. Estimated mean number of cigarette
The smoking typology was loosely labeled as Non-Users (54%),ight Users (18%), Early Users (10%), Late Users (16%), and Lateeavy Users (2%). The names of these classes are derived from
heir respective trajectory patterns. Non-Users are characterizeds those who have never smoked or having smoked zero cigarettesn the 30 days preceding each wave. Light Users are those whomoked at a low level throughout development (i.e.,<5 cigarettes).arly users exhibit an established pattern of smoking at Wave 1.ate Users and Late Heavy Users both demonstrate low rates ofmoking until the late teens, after which the smoking rates of bothlasses show steady increases, with the rate of increase among Lateeavy Users being significantly greater.
Table 2 presents the results of the individual- and community-evel variables on smoking trajectory subgroups after controllingor sex, race/ethnicity, parental education, family structure, andach of the individual- and community-level factors. Maternalmoking, greater numbers of friends who smoke, and more conductroblems were significantly associated with being in any smok-
ng subgroup when compared to Non-Users. Having a mother whomoked was associated with nearly a two-fold increase in theikelihood of being an Early User versus a Non-User (OR = 1.83).dditionally, being affiliated with friends who smoked increased
he likelihood of being an Early User versus a Non-User. In follow-upesting across five pseudo-classes using posterior probability-based
ultiple imputations, Early Users had the highest mean number ofriends who smoked (M = 1.61; SE = .04), followed by Late Heavysers (M = 1.24; SE = .09), Late Users (M = 1.19; SE = .03), Light Users
M = 0.89; SE = .03), and Non-Users (M = .48; SE = .01). Althoughhere were no significant differences in numbers of friends whomoked between Late Users and Late Heavy Users, statistically sig-ificant differences were observed between other subgroup pairs.
Being categorized into any of the four smoking subgroups wasignificantly associated with a greater prevalence of adolescentmoking in the states where participants lived. No two-way inter-ction effects between each pair of individual-level correlate andrevalence of adolescent smoking in the state were observed.
. Discussion
This study described smoking trajectories of initial cigarette usend level of use from adolescence to early adulthood. In addition,ve cigarette-smoking patterns were identified: Non-Users, Light
sers, Early Users, Late Users, and Late Heavy Users. Notably, thearly Users and the Late Heavy Users had different patterns overevelopment; however, they tended to look similar in later adult-ood with respect the number of cigarettes smoked. The same canked for each of the five smoking typologies.
be said of the Late Users and Light Users. Several of the individual-level variables in our model (e.g., maternal smoking, peer smoking,conduct problems, depressive symptoms) were associated with theoverall trajectories of cigarette use and levels of use among smokersin the population. They were also significant in distinguishing Non-Users from other smoking subgroups. Community-level factors(i.e., prevalence of smoking in the state, tobacco marketing poli-cies/taxes) were less consistently related to smoking outcomes inthe models that also included individual-level variables. However,we did find that smoking initiation increased more rapidly overdevelopment in states with a higher adolescent smoking preva-lence. Together, the study highlights the importance of consideringindividual- and community-level variables jointly in adolescentsmoking trajectories.
Results from ZIP growth curve models revealed that the preva-lence of cigarette use is fairly low during early adolescence (age13), but increases rapidly throughout adolescence, with the rateof this increase slowing during adulthood. In line with a wealthof literature, our findings show that smoking initiation typicallybegins during adolescence (Chassin et al., 2009; Gilman et al., 2009;Nelson et al., 2008; Vitoria et al., 2011), nevertheless, our findingsare unique in describing how the rate of increase in initial cigaretteuse changes across adolescence and early adulthood development.Using a slightly different methodology, Messer and Pierce (2010)showed a somewhat similar pattern of first smoking experimen-tation analyzing data from the California Tobacco Survey. Similarto what we found, they report an increase in experimentationfrom age 12 to young adulthood with little new experimentationafter age 22 or 23 (Messer and Pierce, 2010). With respect to theestimated mean of the number of cigarettes smoked, the meanincreased through adolescence, peaked during the mid-twenties,after which it leveled off and then slightly decreased thereafter.
Predictors of trajectories of cigarette use were not necessarilythe same as predictors of the level of cigarettes smoked. Similar towhat has been reported in other studies (Prinstein and La Greca,2009; Upadhyaya et al., 2002), depressive symptoms and conductproblems at Wave 1 were associated with a higher likelihood ofcigarette use. These same factors were not predictive of level ofcigarettes smoked. Also, state prevalence of adolescent smokingrelated to a greater increase in probability of cigarette use butonly predicted a higher starting point of the level of cigarettessmoked. Other factors like peer and maternal smoking were related
to both the trajectories of cigarette use and the level of cigarettessmoked. These findings suggest that efforts to prevent the initia-tion of cigarette use should incorporate the relevance of parentaland peer smoking, as well as individual-level psychological
B. Fuemmeler et al. / Drug and Alcohol Dependence 132 (2013) 301– 308 307
Table 2Estimated multinomial logistic regression coefficients of risk correlates for a five class smoking typology based on pseudo-class membership.
Reference group: Non-Users (54%) Light Users (18%) Late Users (16%) Early Users (10%) Late Heavy Users (2%)
OR 95% CI OR 95% CI OR 95% CI OR 95% CI
Maternal smoking 1.29*** 1.15–1.46 1.44*** 1.27–1.65 1.83*** 1.54–2.18 1.56** 1.12–2.19Peer smoking 1.44*** 1.36–1.53 1.74*** 1.64–1.85 2.22*** 2.05–2.40 1.71*** 1.48–1.97Conduct problems 1.24*** 1.18–1.30 1.28*** 1.22–1.34 1.30*** 1.23–1.38 1.33*** 1.20–1.47Depressive Symptoms 1.05 0.89–1.24 1.30** 1.08–1.55 1.54*** 1.25–1.90 1.85** 1.26–2.72Tobacco marketing legislation 1.00 0.88–1.13 0.98 0.85–1.12 1.04 0.87–1.25 1.23 0.87–1.75State prevalence of adolescents smoking 1.03* 1.00–1.05 1.06*** 1.04–1.09 1.08*** 1.05–1.12 1.13*** 1.07–1.20State cigarette tax (in 25 cent units) 0.94 0.87–1.01 1.00 0.93–1.07 0.95 0.87–1.05 0.98 0.81–1.18
Note: OR = odds ratio; Coefficients above were values after controlling the influences from individual demographic background (gender, ethnicity, parental education, andfamily structure).
vras
rdNtt2wlaiUp
iwHmvIbdeasioetitlgii
ctdvoistcc
* p < .05.** p < .01.
*** p < .001.
ariables. The state prevalence of adolescent smoking may also be aelevant factor to consider when initiating such prevention efforts,s more intensive efforts may be needed in states with a highermoking prevalence.
The current results also show that while many variables wereelated to smoking trajectories, the strengths of associationsiffered among smoking subgroups. For instance, compared toon-Users members of the smoking subgroups were all more likely
o indicate they had friends who smoked at baseline, but this rela-ionship was particularly strong among Early Users (e.g., an OR of.2 vs. ORs between 1.4 and 1.7). Likewise, a significant relationshipas found between each of the smoking subgroups and the preva-
ence of adolescents smoking in the state, though, in this case, thessociation was pronounced in the Late Heavy Users. These find-ngs suggest that members of particular smoking subgroups (Earlysers or Late Heavy Users) have different levels of risk based onresence of individual- and community-level variables.
The scope of current study focused on potential variables dur-ng early adolescence, namely at Wave 1, that may be associated
ith smoking development from adolescence through adulthood.owever, many of these variables likely change over time, whichay have led to us underestimating the true effect. Assessing these
ariables as time-varying covariates would be the next logical step.t should also be recognized that while temporal relationshipsetween variables were evaluated, causal associations cannot beetermined. There may be a number of unmeasured confoundingffects that may be relevant to these associations. However, we didttempt to control for factors related to race, sex, socio-economictatus, and caregiver burden. As is also the case with epidemiologicnvestigations, the mechanisms through which these associationsperate cannot be determined with certainty. Finally, the nullffects of the community-level variables should not be interpretedo mean that community-level variables are irrelevant or lessmportant than individual-level variables. Our analysis was limitedo only three community-level variables. Other factors, such asimiting sale in vending machines, tobacco law enforcement pro-rams or state funds appropriated for tobacco control may also bemportant community-level variables relevant to adolescent smok-ng trajectories and could be assessed in future studies.
Despite these caveats, this study does add new information. Byombining the newly released Wave IV data from Add Health withhe data from the previous waves, our findings help better eluci-ate smoking trajectories over a longer developmental period anderify the role of relevant predictors on these smoking trajectoryutcomes. Additionally, few studies have simultaneously exam-ned the effects of individual- and community-level correlates on
moking trajectories and subgroups (Wilcox, 2003). Overall, givenhe relative importance of peer smoking, depressive symptoms,onduct problems, and state prevalence of adolescent smoking onigarette initiation, it is recommended that future studies assessthe effects of these factors in a time-varying fashion and examinepotentially meaningful mediation and/or interaction effects. Addi-tional research is also needed to examine the risk factors in thecontext of competing risks for multiple substance initiation anduse.
4.1. Conclusions
Studies, such as this one, highlight the importance of consider-ing the smoking phenotype as a developmental pattern for whichthere are changes in initial cigarette use over time, changes in levelof use among those that smoke, and varying trajectory subgroups.The causes of smoking can be better understood by the identifyingindividual- and community-level variables that relate to changesin smoking initiation or the rate of accelerations in smoking. Con-tinued epidemiologic work is needed that can consider variables atdifferent levels over the course of development if we are to makeprogress at identifying optimal ways for preventing smoking in oursociety.
Role of funding source
This research uses data from Add Health, a program projectdirected by Kathleen Mullan Harris and designed by J. RichardUdry, Peter S. Bearman, and Kathleen Mullan Harris at the Uni-versity of North Carolina at Chapel Hill, and funded by grantP01-HD31921 from the Eunice Kennedy Shriver National Insti-tute of Child Health and Human Development, with cooperativefunding from 23 other federal agencies and foundations. Specialacknowledgment is due Ronald R. Rindfuss and Barbara Entwislefor assistance in the original design. Information on how to obtainthe Add Health data files is available on the Add Health web-site (http://www.cpc.unc.edu/addhealth). No direct support wasreceived from grant P01-HD31921 for this analysis.
Support to complete analyses and writing this manuscript wasreceived from the following NIH grants: R01 DA030487 awarded toBFF, R01 DA030487 S awarded to BFF to support TC, 1K07CA124905awarded to BFF, K24 DA023464 awarded to SHK. For her work onthis manuscript, KWR was supported in part by NIDA Grant P30DA023026. Its contents are solely the responsibility of the author(s)and do not necessarily represent the official views of NIH or NIDA.
Contributors
Bernard Fuemmeler designed the study in conjunct with JosephMcClernon and Scott Kollins. Chongming-Yang advised on analyses.
Bernard Fuemmeler and Chien-Ti Lee managed the literaturesearches and summaries of previous related work. Chien-Ti Leeundertook the statistical analysis based on preliminary results fromBernard Fuemmeler. Bernard Fuemmeler completed the first draft
3 cohol D
ohca
C
A
rHo
R
A
A
A
B
B
B
C
C
C
C
C
C
C
D
D
D
D
D
F
G
H
08 B. Fuemmeler et al. / Drug and Al
f the manuscript and Chien-Ti Lee, Krista Ranby and Trenette Clarkelped edit subsequent revisions of the manuscripts. All authorsontributed to the editing the final draft of the manuscript and havepproved the final version.
onflict of interest
None declared.
cknowledgements
The authors thank Kevin Prybol, for assisting with the prepa-ation and proof-reading of the manuscript, and thank the Addealth research team for providing us with the data necessary forur analysis.
eferences
broms, L., Simons-Morton, B., Haynie, D.L., Chen, R.S., 2005. Psychosocial predictorsof smoking trajectories during middle and high school. Addiction 100, 852–861.
li, M.M., Dwyer, D.S., 2009. Estimating peer effects in adolescent smoking behavior:a longitudinal analysis. J. Adolesc. Health 45, 402–408.
udrain-McGovern, J., Rodriguez, D., Tercyak, K.P., Cuevas, J., Rodgers, K., Patterson,F., 2004. Identifying and characterizing adolescent smoking trajectories. CancerEpidemiol. Biomarkers Prev. 13, 2023–2034.
ernat, D.H., Erickson, D.J., Widorne, R., Perry, C.L., Forster, J.L., 2008. Adolescentsmoking trajectories: results from a population-based cohort study. J. Adolesc.Health 43, 334–340.
ollen, K.A., Curran, P.J., 2006. Latent Curve Models: A Structural Equation Perspec-tive. Wiley-Interscience, Hoboken, NJ.
rook, J.S., Ning, Y.M., Brook, D.W., 2006. Personality risk factors associated withtrajectories of tobacco use. Am. J. Addict. 15, 426–433.
hassin, L., Curran, P.J., Presson, C.C., Sherman, S.J., Wirth, R. (Eds.), 2009. Devel-opmental Trajectories of Cigarette Smoking from Adolescence to Adulthood.US Department of Health and Human Services, National Institutes of Health,National Cancer Institute, Bethesda, MD.
hassin, L., Presson, C.C., Pitts, S.C., Sherman, S.J., 2000. The natural history ofcigarette smoking from adolescence to adulthood in a midwestern communitysample: multiple trajectories and their psychosocial correlates. Health Psychol.19, 223–231.
lark, S., Muthén, B., 2009. Relating latent class analysis results to vari-ables not included in the analysis. http://www.statmodel.com/download/relatinglca.pdf.accessed
older, C.R., Mehta, P., Balanda, K., Campbell, R.T., Mayhew, K.P., Stanton, W.R.,Pentz, M.A., Flay, B.R., 2001. Identifying trajectories of adolescent smoking: anapplication of latent growth mixture modeling. Health Psychol. 20, 127–135.
onnell, A.M., Dishion, T.J., Deater-Deckard, K., 2006. Variable-and person-centeredapproaches to the analysis of early adolescent substance use: linking peer, fam-ily, and intervention effects with developmental trajectories. Merrill-PalmerQuart.: J. Dev. Psychol. 52, 421–448.
ostello, D.M., Dierker, L.C., Jones, B.L., Rose, J.S., 2008. Trajectories of smokingfrom adolescence to early adulthood and their psychosocial risk factors. HealthPsychol. 27, 811–818.
rockett, L.J., Randall, B.A., Shen, Y.L., Russell, S.T., Driscoll, A.K., 2005. Measurementequivalence of the Center for Epidemiological Studies Depression Scale for Latinoand Anglo adolescents: a national study. J. Consult. Clin. Psychol. 73, 47–58.
iFranza, J.R., Savageau, J.A., Fletcher, K., O’Loughlin, J., Pbert, L., Ockene, J.K., McNeill,A.D., Hazelton, J., Friedman, K., Dussault, G., Wood, C., Wellman, R.J., 2007. Symp-toms of tobacco dependence after brief intermittent use – the development andassessment of nicotine dependence in youth-2 study. Arch. Pediatr. Adolesc.Med. 161, 704–710.
owney, L.A., Gardiner, J.A., 1996. Reducing Youth Access to Tobacco: A Partial Inven-tory of State Initiatives. University of Illinois at Chigago, Office of Social ScienceResearch, Chicago.
uncan, S.C., Duncan, T.E., Strycker, L.A., 2006. Alcohol use from ages 9 to 16: acohort-sequential latent growth model. Drug Alcohol Depend. 81, 71–81.
uncan, S.C., Duncan, T.E., Strycker, L.A., Chaumeton, N.R., 2007. A cohort-sequentiallatent growth model of physical activity from ages 12 to 17 years. Ann. Behav.Med. 33, 80–89.
uncan, T.E., Duncan, S.C., 2004. An introduction to latent growth curve modeling.Behav. Ther. 35, 333–363.
lory, J.D., Manuck, S.B., 2009. Impulsiveness and cigarette smoking. Psychosom.Med. 71, 431–437.
ilman, S.E., Rende, R., Boergers, J., Abrams, D.B., Buka, S.L., Clark, M.A., Colby,S.M., Hitsman, B., Kazura, A.N., Lipsitt, L.P., Lloyd-Richardson, E.E., Rogers, M.L.,Stanton, C.A., Stroud, L.R., Niaura, R.S., 2009. Parental smoking and adolescent
smoking initiation: an intergenerational perspective on tobacco control. Pedi-atrics 123, E274–E281.arris, K., Halpern, C., Whitsel, E., Hussey, J., Tabor, J., Entzel, P., Udry, J., 2009.The National Longitudinal Study of Adolescent Health: Research Design. NorthCarolina Population Center, Chapel Hill.
ependence 132 (2013) 301– 308
Hiemstra, M., Otten, R., de Leeuw, R.N.H., van Schayck, O.C.P., Engels, R.C.M.E., 2011.The changing role of self-efficacy in adolescent smoking initiation. J. Adolesc.Health 48, 597–603.
Hoffman, B.R., Monge, P.R., Chou, C.P., Valente, T.W., 2007. Perceived peerinfluence and peer selection on adolescent smoking. Addict. Behav. 32,1546–1554.
Johnston, L.D., O’Malley, P.M., Bachman, J.G., Schulenberg, J.E., 2008. Monitoringthe Future National Survey Results on Drug Use, 1975–2007. Volume I: Sec-ondary School Students (NIH Publication No. 08-6418A). National Institute onDrug Abuse, Bethesda, MD.
Kann, L., Warren, C.W., Harris, W.A., Collins, J.L., Douglas, K.A., Collins, M.E., Williams,B.I., Ross, J.G., Kolbe, L.J., 1995. Youth risk behavior surveillance – United States,1993. J. School Health 65, 163–171.
Karp, I., O’loughlin, J., Paradis, G., Hanley, J., Difranza, J., 2005. Smoking trajecto-ries of adolescent novice smokers in a longitudinal study of tobacco use. Ann.Epidemiol. 15, 445–452.
Kollins, S.H., McClernon, F.J., Fuemmeler, B.F., 2005. Association between smokingand attention-deficit/hyperactivity disorder symptoms in a population-basedsample of young adults. Arch. Gen. Psychiatry 62, 1142–1147.
Li, F.Z., Duncan, T.E., Duncan, S.C., Acock, A., 2001. Latent growth modeling of longi-tudinal data: a finite growth mixture modeling approach. Struct. Equ. Model. 8,493–530.
Liang, L., Chaloupka, F.J., 2002. Differential effects of cigarette price on youth smokingintensity. Nicotine Tob. Res. 4, 109–114.
Liu, H., Powers, D.A., 2007. Growth curve models for zero-inflated count data: anapplication to smoking behavior. Struct. Equ. Model. 14, 247–279.
Lovato, C.Y., Zeisser, C., Campbell, H.S., Watts, A.W., Halpin, P., Thompson, M., Eyles, J.,Adlaf, E., Brown, K.S., 2010. Adolescent smoking: effect of school and communitycharacteristics. Am. J. Prev. Med. 39, 507–514.
McClernon, F.J., Fuemmeler, B.F., Kollins, S.H., Kail, M.E., Ashley-Koch, A.E., 2008.Interactions between genotype and retrospective ADHD symptoms predictlifetime smoking risk in a sample of young adults. Nicotine Tob. Res. 10,117–127.
Messer, K., Pierce, J.P., 2010. Changes in age trajectories of smoking experimenta-tion during the California Tobacco Control Program. Am. J. Public Health 100,1298–1306.
Muthén, B., Muthén, L.K., 2000. Integrating person centered and variable centeredanalyses: growth mixture modeling with latent trajectory classes. Alcohol. Clin.Exp. Res. 24, 882–891.
Muthén, L., Muthén, B., 1998–2012. Mplus User’s Guide. Muthén & Muthén, LosAngeles.
Nelson, D.E., Mowery, P., Asman, K., Pederson, L.L., O’Malley, P.M., Malarcher, A.,Maibach, E.W., Pechacek, T.F., 2008. Long-term trends in adolescent and youngadult smoking in the United States: metapatterns and implications. Am. J. PublicHealth 98, 905–915.
Orlando, M., Tucker, J.S., Ellickson, P.L., Klein, D.J., 2004. Developmental trajecto-ries of cigarette smoking and their correlates from early adolescence to youngadulthood. J. Consult. Clin. Psych. 72, 400–410.
Paul, S.L., Blizzard, L., Patton, G.C., Dwyer, T., Venn, A., 2008. Parental smoking andsmoking experimentation in childhood increase the risk of being a smoker 20years later: the Childhood Determinants of Adult Health Study. Addiction 103,846–853.
Pollard, M.S., Tucker, J.S., Green, H.D., Kennedy, D., Go, M.H., 2010. Friend-ship networks and trajectories of adolescent tobacco use. Addict. Behav. 35,678–685.
Prinstein, M.J., La Greca, A.M., 2009. Childhood depressive symptoms and adoles-cent cigarette use: a six-year longitudinal study controlling for peer relationscorrelates. Health Psychol. 28, 283–291.
Resnick, M.D., Bearman, P.S., Blum, R.W., Bauman, K.E., Harris, K.M., Jones, J., Tabor,J., Beuhring, T., Sieving, R.E., Shew, M., Ireland, M., Bearinger, L.H., Udry, J.R.,1997. Protecting adolescents from harm. Findings from the National Longitudi-nal Study on Adolescent Health. JAMA 278, 823–832.
Riggs, N.R., Chou, C.P., Li, C., Pentz, M.A., 2007. Adolescent to emerging adult-hood smoking trajectories: when do smoking trajectories diverge, and dothey predict early adulthood nicotine dependence? Nicotine Tob. Res. 9,1147–1154.
Sargent, J.D., Dalton, M., Beach, M., Bernhardt, A., Heatherton, T., Stevens, M., 2000.Effect of cigarette promotions on smoking uptake among adolescents. Prev. Med.30, 320–327.
Schwarz, G., 1978. Estimating dimension of a model. Ann. Stat. 6, 461–464.Upadhyaya, H.P., Deas, D., Brady, K.T., Kruesi, M., 2002. Cigarette smoking and psy-
chiatric comorbidity in children and adolescents. J. Am. Acad. Child Psychol. 41,1294–1305.
Villanti, A., Boulay, M., Juon, H.S., 2011. Peer, parent and media influences on ado-lescent smoking by developmental stage. Addict. Behav. 36, 133–136.
Vitaro, F., Wanner, B., Brendgen, M., Gosselin, C., Gendreau, P.L., 2004. Differentialcontribution of parents and friends to smoking trajectories during adolescence.Addict. Behav. 29, 831–835.
Vitoria, P.D., Salgueiro, M.F., Silva, S.A., de Vries, H., 2011. Social influence, intentionto smoke, and adolescent smoking behaviour longitudinal relations. Br. J. HealthPsychol. 16, 779–798.
White, H.R., Pandina, R.J., Chen, P.H., 2002. Developmental trajectories of cigaretteuse from early adolescence into young adulthood. Drug Alcohol Depend. 65,167–178.
Wilcox, P., 2003. An ecological approach to understanding youth smoking trajecto-ries: problems and prospects. Addiction 98 (Suppl. 1), 57–77.