Drug Abuse Trends in Minneapolis/St. Paul: 2015 · Drug Abuse Trends in Minneapolis/St. Paul: 2015...
14
Drug Abuse Trends in Minneapolis/St. Paul: 2015 Carol Falkowski Drug Abuse Dialogues St. Paul, Minnesota April 2015 ABSTRACT Adverse consequences related to heroin and other opiates continued their stronghold in the Twin Cities in 2014. A record-high 14.6 percent of admissions to addiction treatment programs were for heroin in 2014, of which 37.5 percent were age 18 - 25. For the first time ever, almost as many admissions were for heroin in 2014 (3,208) as were for marijuana (3,246). Opiate- related overdose deaths fell from 132 to 102 in Hennepin County, but increased in Ramsey County from 37 to 42. Statewide seizures of heroin and prescription drugs by multijurisdictional law enforcement drug task forces declined in 2014, although heroin seizures by DEA and local Hennepin County law enforcement increased. Methamphetamine-related treatment admissions gradually increased since 2009 and in 2014 accounted for 11.8 percent of total admissions, exceeding the number of admissions for meth in 2005 at the height of the statewide epidemic. Methamphetamine seizures by law enforcement in Ramsey County rose from 16 pounds (7,239 grams) in 2013 to 128 pounds in 2014 (58,286 grams). Cocaine-related treatment admissions, seizures and deaths continued downward trends. In 2014 exposures declined for synthetic THC (cannabimimetics), "bath salts" (substituted cathinones), and "research chemicals" (2-CE analogs), yet increased three-fold for MDMA, according to the Minnesota Poison Control System. Data Sources This quantitative report analyzes trends in substance abuse in the metropolitan area of Minneapolis/St. Paul, Minnesota, and is based on the most recent data obtained from the following sources: Mortality data on drug-related accidental overdose deaths due to drug toxicity are from the Ramsey County Medical Examiner and the Hennepin County Medical Examiner (through December 2014). Hennepin County cases include accidental overdose deaths in which drug toxicity or mixed drug toxicity was the cause of death and those in which the recent use of a drug was listed as a significant condition contributing to the death. Ramsey County cases include accidental overdose deaths in which drug toxicity or mixed drug toxicity was the cause of death. See exhibits 1 - 2. Addiction treatment data are from the Drug and Alcohol Abuse Normative Evaluation System, Minnesota Department of Human Services from programs in the metro counties of Anoka, Dakota, Hennepin, Ramsey and Washington (through December 2014). See exhibits 3 - 5. Data on drug seizures by law enforcement are from the U.S. Drug Enforcement Administration (DEA), and the multijurisdictional drug and violent crime task forces that operate throughout the State, compiled by the Office of Justice Programs, Minnesota Department of Public Safety (through 2014). Additional data are from the Hennepin County Sheriff's multijurisdictional Violent Offender Task
Transcript of Drug Abuse Trends in Minneapolis/St. Paul: 2015 · Drug Abuse Trends in Minneapolis/St. Paul: 2015...

Drug Abuse Trends in Minneapolis/St. Paul: 2015 Carol Falkowski
Drug Abuse Dialogues St. Paul, Minnesota
April 2015
ABSTRACT
Adverse consequences related to heroin and other opiates continued their stronghold
in the Twin Cities in 2014. A record-high 14.6 percent of admissions to addiction treatment
programs were for heroin in 2014, of which 37.5 percent were age 18 - 25. For the first time ever,
almost as many admissions were for heroin in 2014 (3,208) as were for marijuana (3,246). Opiate-
related overdose deaths fell from 132 to 102 in Hennepin County, but increased in Ramsey County
from 37 to 42. Statewide seizures of heroin and prescription drugs by multijurisdictional law
enforcement drug task forces declined in 2014, although heroin seizures by DEA and
local Hennepin County law enforcement increased. Methamphetamine-related treatment
admissions gradually increased since 2009 and in 2014 accounted for 11.8 percent of total
admissions, exceeding the number of admissions for meth in 2005 at the height of
the statewide epidemic. Methamphetamine seizures by law enforcement in Ramsey
County rose from 16 pounds (7,239 grams) in 2013 to 128 pounds in 2014 (58,286
grams). Cocaine-related treatment admissions, seizures and deaths continued
downward trends. In 2014 exposures declined for synthetic THC (cannabimimetics),
"bath salts" (substituted cathinones), and "research chemicals" (2-CE analogs), yet
increased three-fold for MDMA, according to the Minnesota Poison Control System.
Data Sources
This quantitative report analyzes trends in substance abuse in the metropolitan area of Minneapolis/St. Paul, Minnesota, and is based on the most recent data obtained from the following sources: Mortality data on drug-related accidental overdose deaths due to drug toxicity are from the Ramsey County Medical Examiner and the Hennepin County Medical Examiner (through December 2014). Hennepin County cases include accidental overdose deaths in which drug toxicity or mixed drug toxicity was the cause of death and those in which the recent use of a drug was listed as a significant condition contributing to the death. Ramsey County cases include accidental overdose deaths in which drug toxicity or mixed drug toxicity was the cause of death. See exhibits 1 - 2. Addiction treatment data are from the Drug and Alcohol Abuse Normative Evaluation System, Minnesota Department of Human Services from programs in the metro counties of Anoka, Dakota, Hennepin, Ramsey and Washington (through December 2014). See exhibits 3 - 5. Data on drug seizures by law enforcement are from the U.S. Drug Enforcement Administration (DEA), and the multijurisdictional drug and violent crime task forces that operate throughout the State, compiled by the Office of Justice Programs, Minnesota Department of Public Safety (through 2014). Additional data are from the Hennepin County Sheriff's multijurisdictional Violent Offender Task

2
Force, and the Ramsey County Sherriff's multijurisdictional Violent Crime Enforcement Team (through December 2014). See exhibits 6 - 9. Poison Center data on human exposures to various substances are reported to the Minnesota Poi-son Control System (through December 2014). See exhibits 10 and 11. Prescription drug data are from the Minnesota Prescription Monitoring Program, Minnesota Board of Pharmacy, March 2014 and 2015. See exhibit 12.
Drug Abuse Trends
HEROIN AND OTHER OPIATES
The escalating numbers of opiate-related drug overdose deaths slowed down in Hennepin, but not Ramsey County in 2014. In Hennepin County there were 102 opiate-related deaths in 2014, compared with 132 in 2013, and 84 in 2012. The decedents ranged in age from 17 to 71. Fifty of these deaths involved heroin (49 percent), 8 involved cocaine used in combination with an opiate, 31 involved methadone (30.4 percent), 11 involved oxycodone, five involved fentanyl and nine involved combined methamphetamine and opiate use. Due to 2014 State legislation the use of naloxone, the antidote to opioid overdose became more widespread, particularly in Hennepin County. The extent to which this may have contributed to the decline in opiate-related deaths in Hennepin County is unknown. In Ramsey County opiate-related deaths rose from 37 in 2013 to 42 in 2014, a 13.5 percent increase. The decedents ranged in age from 22 to 70. At least 11 of these cases involved heroin (26.2 percent), 14 involved methadone (33.3 percent), six involved oxycodone, five involved cocaine used in combination with opiates, one involved fentanyl, and one involved opiate and methamphetamine toxicity. Heroin accounted for a record-high 14.6 percent of total treatment admissions in 2014, compared with 14.0 percent in 2013. This compares with 7.8 percent in 2010, and 3.3 percent in 2000. Multiple treatment providers reported that most of the young patients entering treatment programs for heroin addiction initially abused prescription opiates before progressing to heroin use and addiction. Of the 3,208 heroin treatment admissions in 2014, 37.5 percent were age 18-25. Males accounted for 63.8 percent, Whites 63.2 percent and injection was the most common route of administration (62.5 percent). Other opiates (prescription opioids and opium) were the primary substance reported by 8.7 percent of treatment admissions in 2014, compared with 9.5 percent in 2013, and 1.4 percent in 2000. Of these 1,918 admissions, one-half were female and one-quarter (24.8 percent) were less than 26 years of age. The most common route of administration (67.3 percent) was oral, by mouth. Statewide seizures of heroin and prescription drugs by Minnesota multijurisdictional drug and violent crime task forces declined in 2014, while seizures of heroin by DEA and the Hennepin County multijurisdictional task force increased. Mexico and South America were the primary sources of heroin in Minnesota. Distribution involved Mexican drug cartels and Chicago gangs. Local heroin includes the chunky, black tar heroin and the grayish powdered heroin. Mexican heroin typically sold for $10 - $20 per dosage unit and $100 - $200 per gram. An “eight-ball” (1/8 of an ounce) cost roughly $300. An ounce of heroin ranges in price from $1,600 to $2,400. Opium smoking within the Twin Cities’ Hmong community remained an ongoing concern. Opium is creatively concealed in various types of goods and packages that are shipped from Asia to the Twin Cities or surrounding areas.

3
From 2013 to 2014, heroin exposures reported to the Minnesota Poison Control System rose slightly from 147 to 156. Hydrocodone exposures declined from 605 to 557, and oxycodone exposures increased from 579 to 610 in 2014. Hydrocodone with acetaminophen was the most frequently prescribed drug reported on the Minnesota Prescription Monitoring Program in March 2015, accounting for 15 percent of all prescriptions. By comparison in March 2014 it accounted for 22 percent of all prescriptions. This, coupled with the addition of tramadol to the top ten list in March 2015, may reflect an emerging change in prescribing practices.
COCAINE
From 2013 to 2014, cocaine-related deaths fell from 28 to 12 in Hennepin and from 9 to 5 in Ramsey County. Cocaine-related treatment admissions remained relatively constant from 2013 to 2014, and accounted for 4.3 percent of treatment admissions in both years. The vast majority of cocaine-related treatment admissions in 2014 (73.5 percent) were for crack cocaine. Over half (60.5 percent) were African-American, females accounted for 34.7 percent, and more than three-quarters (76.5 percent) were age 35 and older. A gram of cocaine powder cost $80 to $120. An ounce ranged in price from $1,000 to $1,400; a pound from $12,400 to $16,000; and a kilogram from $24,000 to $31,000. Criminal gangs remain involved in the street-level, retail distribution of crack cocaine. A rock of crack sold for $10 to $20.
METHAMPHETAMINE AND OTHER STIMULANTS
Accidental methamphetamine-related deaths fell from 2013 to 2014, going from 16 to 11 in Hennepin and from 8 to 6 in Ramsey County. However, methamphetamine-related treatment admissions have been rising in the Twin Cities since 2009. In 2014, 11.8 percent of total treatment admissions were for methamphetamine, compared with 10 percent in 2013, and 5.7 percent in 2009. As a percentage of total admissions, methamphetamine admissions are very close to the highest ever 12.0 percent level that was reached at the height of the statewide epidemic in 2005. There were 2,593 meth admissions in 2014, compared with 2,465 meth treatment admissions in 2005. Of the 2,593 admissions in 2014, smoking was the most common route of administration (65.7 percent). Methamphetamine seizures by law enforcement increased significantly in 2014. Law enforcement in Ramsey County seized 58,286 grams of methamphetamine in 2014 (128 pounds), compared with 7,239 grams (16 pounds) in 2013. Mexican drug trafficking organizations control the distribution of methamphetamine that arrives in Minnesota from Mexico, California and Arizona. Methamphetamine cost $20 per dosage unit and ranged in price from $80 to $100 per gram, $900 to $1,300 per ounce, and $6,500 to $11,000 per pound. Khat (pronounced “cot”) is a plant indigenous to East Africa and the Arabian Peninsula. Users chew the leaves, smoke it, or brew it in tea for its stimulant effects. Its use is primarily within the Somali community. Methylphenidate (Ritalin®) is a prescription medication used in the treatment of attention deficit hyperactive disorder. Adolescents and young adults use it nonmedically to increase alertness and suppress appetite. Crushed and snorted, or ingested orally, each pill sells for up to $5 or is simply shared with others at no cost. It is sometimes known as a “hyper pill” or “the study drug.” In March 2015, 5.2 percent of prescriptions reported to the Minnesota Prescription Monitoring Program were for methylphenidate, and 8.9 percent were for amphetamines. MDMA (3,4-methylenedioxymethamphetamine), also known as ecstasy, “X,” or “e,” is typically sold for $20 per pill, and has stimulant and mild hallucinogenic properties. It produces feelings of energy and euphoria in users, but can adversely elevate body temperature and precipitate feelings of confusion
4
and agitation. "Molly" (slang for “molecular”), refers to an allegedly pure crystalline powder form of the drug MDMA, but lab analysis has determined that the tablets are more likely to contain methylone, a chemical found in "bath salts." There were 19 MDMA exposures reported to the Minnesota Poison Control System in both 2012 and 2013. This jumped to 65 in 2014, more than a three-fold increase. The mixed drug toxicity death of a 21 year-old female in Hennepin County in 2014 involved MDMA and benzodiazepines.
MARIJUANA In 2014, 14.8 percent of admissions to addiction treatment programs involved marijuana as the primary substance problem, compared with 15.5 percent in 2013, and 16.3 percent in 2012. Of these 3,246 admissions, 25.6 percent were younger than 18; 37.3 percent were age 18–25; and females accounted for 23 percent, the lowest percentage of females in any drug category. Standard grade marijuana sold for $5 per joint, and up to $225 per ounce and $1,500 per pound. The cost of higher quality "BC Bud" ranged from $2,600 to $3,000 per pound. Synthetic cannabinoids (cannabimimetics) refer to synthetically produced chemicals that are sprayed onto dried herbal mixtures, and smoked to mimic the effects of THC, the active ingredient in plant marijuana. They are sold as "herbal incense" or "legal pot," with a warning "not for human consumption." Although these products are illegal to sell or possess under State and Federal laws, they continue to be sold online under many names, such as "K2," and "Spice." The Minnesota Poison Control System reported 157 THC homolog exposures in 2012, 110 in 2013, and 102 in 2014. In 2014 the Minnesota legislature passed a bill that allows individuals with certain qualifying health conditions to enroll in a patient registry maintained by the State in order to receive medical cannabis directly from one of eight dispensaries in Minnesota that are scheduled to open July 1, 2015.
HALLUCINOGENS AND OTHER SYNTHETICS
LSD (lysergic acid diethylamide) or “acid,” is a synthetically produced, long-acting hallucinogen, that is typically sold as saturated, tiny pieces of paper, known as “blotter acid,” for $5 to $10 per dosage unit. The Minnesota Poison Control System reported 15 LSD exposures in 2012, 45 in 2013, and 31 in 2014. Substituted cathinones, sold as so-called "bath salts," are consumed to produce effects similar to MDMA. Substituted cathinones may contain mephedrone or many other chemicals alone or in combination, such as MDPV (3,4-methylenedioxypyrovalerone), methylone (3,4 methylendioxymethcathinone or MDMC), naphyrone (napthylpyrovalerone or NRG-1), 4-Fluo-romethcathinone or 3-FMC0, methedrone (4-methoxymethcathinone or bk-PMMA or PMMC), or butylone (beta-keto-N-methylbenzodioxolylpropylamine or bk-MBDB). These are sold under names such as “Vanilla Sky,” “Bliss,” and “Ivory Wave.” Mephedrone by itself is also known as “Meow Meow,” “M-CAT,” “Bubbles,” or “Mad Cow.” Because the actual ingredients are unknown, the effects are unpredictable and can include paranoid delusions, psychosis, and an agitated state known as "excited delirium." The Minnesota Poison Control System reported 144 bath salt exposures in 2011, 87 in 2012 and 50 in 2013. 2C-E phenethylamine (2,5-dimethoxy-4-ethylphenylethylamine) and related analogs are sold online as so-called "research chemicals." In March 2014 a 22 year-old male and 17 year-old female died after ingesting chemicals in the 2C family in Mankato, Minnesota, located 90 miles southwest of the Twin Cities. The chemicals were purchased locally and packaged in small zip lock bags. NBOMe or “N-bomb” is also known as “legal acid,” “smiles,” or simply “25-I," and refers to these closely related synthetic hallucinogens: 25I-NBOMe, 25C-NBOMe, or 25B-NBOMe. The death of a 17

5
year-old white female in Hennepin County in 2014 listed NBOMe toxicity as a significant condition contributing to the death. The death of another 17 year-old white female in Ramsey County listed the cause of death as complications due to NBOMe toxicity. Exposures for 2C analogs were 24 in 2012, 35 in 2013, and 15 in 2014. Analysis has shown that a single packet of a synthetic drug, such as a bath salt or research chemical, can contain a single chemical component or multiple components, and that ingredients and the concentration of ingredients within single brand name change over time.
ALCOHOL AND TOBACCO
Less than one-half (43.1 percent) of total admissions to addiction treatment programs reported alcohol as the primary substance problem in 2014, over half of whom (60.5 percent) were age 35 and older. Tobacco smoking remained widespread among patients at addiction treatment programs. Rates of current smoking range from a high of 82 percent among heroin admissions, to a low of 57.8 percent among alcohol admissions. With inquiries about this report contact Carol Falkowski, Drug Abuse Dialogues, St. Paul, Minnesota at: [email protected].

6
This page is intentionally left blank

7
Exhibit 1
Drug abuse-related deaths by county: 2006 - 2014
Exhibit 2
0 20 40 60 80
100 120 140 160 180
2006 2007 2008 2009 2010 2011 2012 2013 2014
Hennepin County and Ramsey County drug abuse-related deaths: 2006 - 2014
Opiates Cocaine Methamphetamine
SOURCE: Hennepin County Medical Examiner, Ramsey County Medical Examiner, 2015.
opiates cocaine meth
2006 2007 2008 2009 2010 2011 2012 2013 2014 HENNEPIN COUNTY
Meth 8 6 9 6 9 7 14 16 11
Cocaine 48 59 21 10 25 28 18 28 12
Opiates 69 67 84 77 65 84 84 132 102
RAMSEY COUNTY
Meth 6 7 5 7 4 3 7 8 6
Cocaine 13 11 10 11 7 6 3 9 5
Opiates 27 39 31 36 27 36 45 37 42

8
Exhibit 3

9
Exhibit 4
SOURCE: Drug and Alcohol Abuse Normative Evaluation System, Minnesota Department of Human Services, 2015.
alcohol 43.1% cocaine 4.3%
meth 11.8%
marijuana 14.8%
heroin 14.6% other opiates
8.7%
other/missing 2.7%
Minneapolis/St. Paul metro area addiction treatment program admissions by primary substance problem:
2014
Total admissions = 21,928
10
Exhibit 5
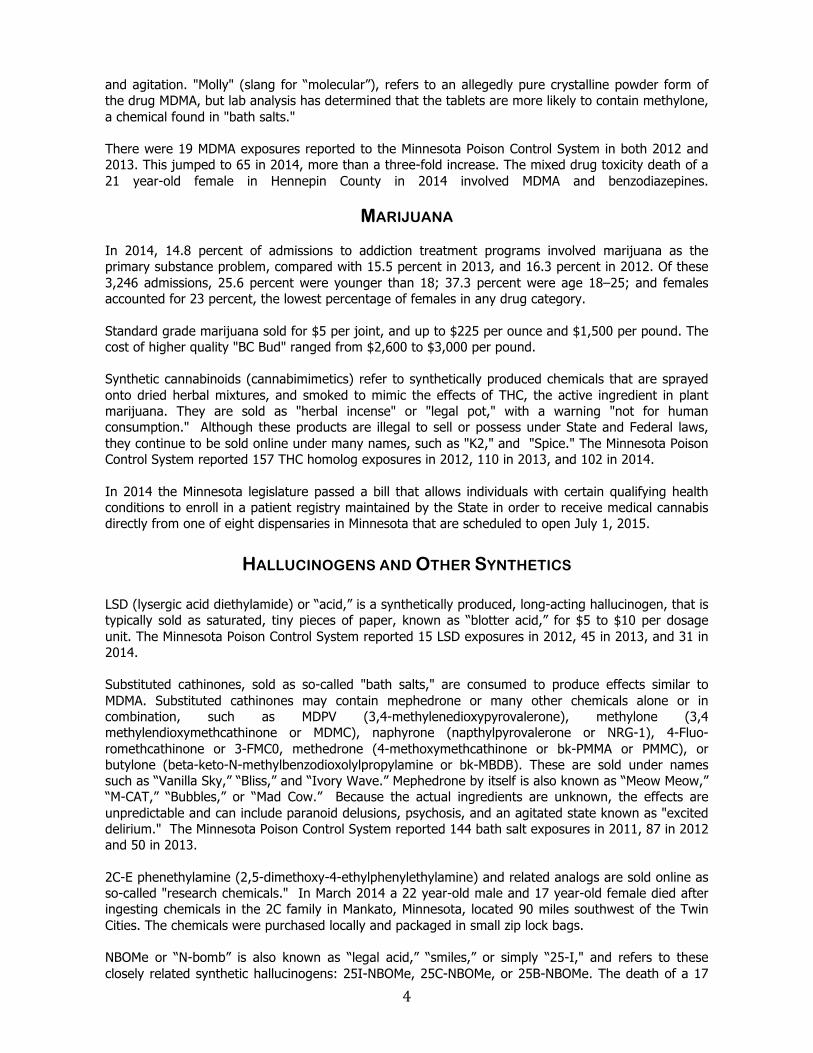
Characteristics of admissions to Minneapolis/St. Paul metro area addiction treatment programs by primary substance problem: 2014
SOURCE: Drug and Alcohol Abuse Normative Evaluation System, Minnesota Department of Human Services, 2015. Unknown primary drug = 259 (1.2%). All other primary drugs = 325 (1.5%).
TOTAL ADMISSIONS
21,928
ALCOHOL
9,444 43.1%
MARIJUANA
3,246 14.8%
COCAINE
935 4.3%
METH
2,593 11.8%
HEROIN
3,208 14.6%
OTHER OPIATES 1,918 8.7%
GENDER % MALE % FEMALE
67.2 32.8
77.0 23.0
65.3 34.7
62.5 37.5
63.8 36.2
50.1 49.9
RACE/ETHNICITY % WHITE
% AFRICAN AM % AM INDIAN % HISPANIC
% ASIAN/PACIFIC ISL % OTHER
71.6 15.8 2.9 5.0 1.7 3.0
49.7 29.7 4.0 8.0 1.5 7.1
25.6 60.5 4.2 4.3 0.7 4.7
78.2 2.8 4.0 5.7 4.9 4.4
63.2 19.1 9.1 4.4 0.8 3.3
73.0 6.4
10.4 4.3 2.3 3.6
AGE % 17 AND UNDER
% 18 -‐ 25 % 26 -‐ 34 % 35 +
1.1
13.7 24.6 60.5
25.6 37.3 21.3 15.7
1.2 6.7
15.6 76.5
2.9
21.4 40.5 35.2
0.8
37.5 28.3 33.4
1.3
23.5 33.0 42.3
ROUTE OF ADMINISTRATION % ORAL/MULTIPLE
% SMOKING % SNORTING % INJECTION % UNKNOWN
100
1.9 98.1
- -
-
73.5 24.9 1.6 -
5.5 65.7 6.8
22.0 -
0.5 9.6
27.4 62.5
-
67.3 5.2
18.4 9.1 -
% CURRENT SMOKERS 57.8 68.2 71.2 77.4 82.0 70.9

11
Exhibit 6
Exhibit 7
3 7.7
35.4
2.2
16.6 10.4
0.5
22
49.4
2.7 5.75
52.9
0
10
20
30
40
50
60
Heroin Cocaine Methamphetamine
Minneapolis/St. Paul drug seizures analyzed by DEA (in kilograms): 2011 - 2014
2011 2012 2013 2014
SOURCE: Drug Enforcement Administration (DEA), Minneapolis/St. Paul Minnesota, 2015.
819
5886
117
356
5716
405
811
600
604
0 1000 2000 3000 4000 5000 6000
heroin
meth
cocaine
Hennepin County seizures of selected drugs (in grams): 2012 - 2014
2012 2013 2014
SOURCE: Hennepin County Violent Offender Task Force, that includes personnel from the Hennepin County Sheriff's Office, the Drug Enforcement Administration (DEA), and the police departments of Brooklyn Park, Brooklyn Center, Golden Valley and Richfield.

12
Exhibit 8
Exhibit 9
2010$ 2011$ 2012$ 2013$ 2014$heroin$(grams)$ 228$ 406$ 2794$ 8490$ 5584$Rx$drugs$seized$$$$$$$$$$$$$$$$$$$$$$$$$(dosage$units)$ 16414$ 10711$ 14254$ 21917$ 18398$
0$
5000$
10000$
15000$
20000$
25000$
Heroin and Rx drug seizures by Minnesota Drug and Violent Crime Task Forces: 2010 - 2014
SOURCE:$Office$of$JusHce$Programs,$Minnesota$Department$of$Public$Safety,$2015.$$
58286
7239
21310
0 10000 20000 30000 40000 50000 60000
Ramsey County methamphetamine seizures (in grams): 2012 - 2014
2012 2013 2014
SOURCE: The Ramsey County Violent Crime Enforcement Team, composed of members that represent Ramsey County Sheriff, and the police departments of St. Paul, Maplewood, Roseville, White Bear Lake and New Brighton.
13
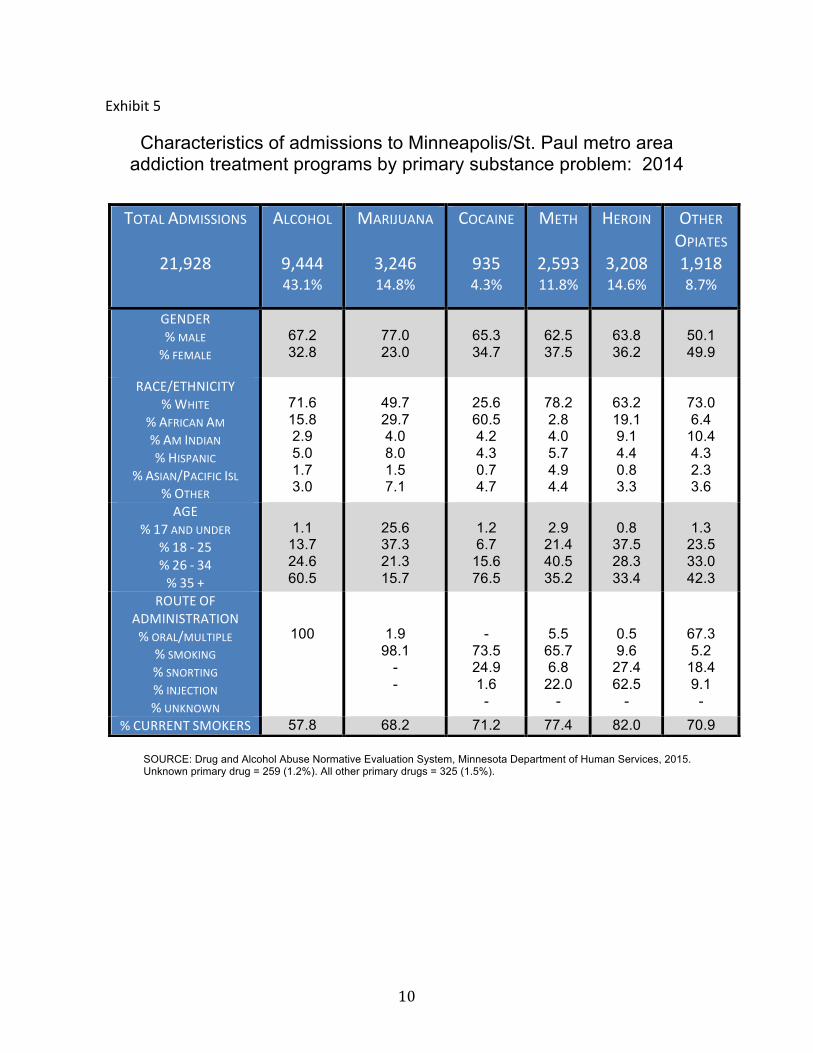
Exhibit 10
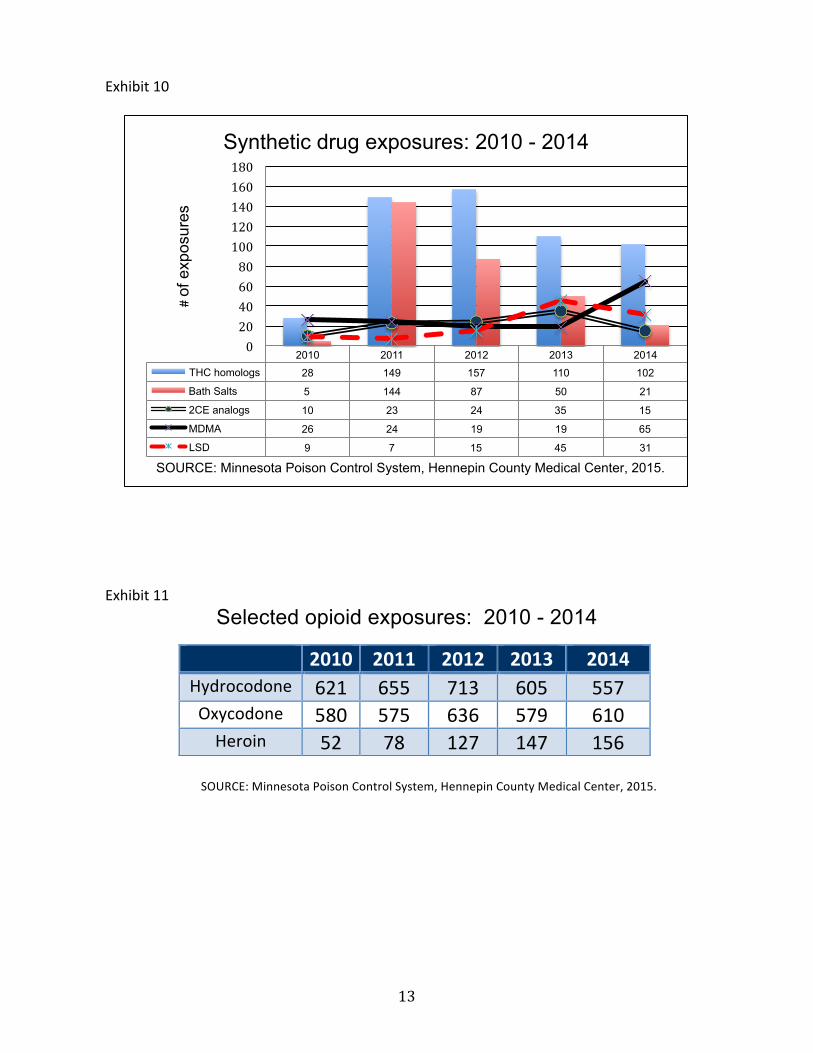
Exhibit 11
Selected opioid exposures: 2010 - 2014
SOURCE: Minnesota Poison Control System, Hennepin County Medical Center, 2015.
2010 2011 2012 2013 2014 THC homologs 28 149 157 110 102
Bath Salts 5 144 87 50 21
2CE analogs 10 23 24 35 15
MDMA 26 24 19 19 65
LSD 9 7 15 45 31
0 20 40 60 80 100 120 140 160 180
# of
exp
osur
es
Synthetic drug exposures: 2010 - 2014
SOURCE: Minnesota Poison Control System, Hennepin County Medical Center, 2015.
2010 2011 2012 2013 2014 Hydrocodone 621 655 713 605 557 Oxycodone 580 575 636 579 610 Heroin 52 78 127 147 156

14
Exhibit 12
Top ten prescriptions dispensed in Minnesota: March 2015 vs. March 2014
March 2015 March 2014
Drug # OF PRESCRIPTIONS
% OF ALL PRESCRIPTIONS
# OF PRESCRIPTIONS
% OF ALL PRESCRIPTIONS
Hydrocodone with acetaminophen 107,602 15 108,498 22
Oxycodone HCL 57,000 8.0 41,481 8.3 Oxycodone with acetaminophen 53,966 7.5 46,518 9.2 Dextroamphetamine/amphetamine 63,658 8.9 50,750 10.1
Zolpidem tartrate 46,042 6.4 41,166 8.2
Lorazepam 49,624 6.9 38,557 7.7
Methylphenidate HCL 37,423 5.2 31,780 6.3
Clonazepam 38,076 5.3 31,195 6.2
Alprazolam 32,532 4.5 27,781 5.5 Acetaminophen with codeine N/A N/A 13,177 2.6 Tramadol HCL 56,177 7.9 N/A N/A
SOURCE: Prescription Monitoring Program Monthly Reports, March 2014 and March 2015. Total prescriptions dispensed and reported to the Prescription Monitoring Program in March 2014 = 503,613. Total prescriptions dispensed and reported to the Prescription Monitoring Program in March 2015 = 715,055.