Dr.S.M.Yadav AitPfAssociate Professor CED, SVNIT … INDIA. Introduction •The development and...
103
Mapping Salinity Ingress Using GALDIT Model Dr.S.M.Yadav A it P f Associate Professor CED, SVNIT SURAT INDIA SURAT , INDIA
Transcript of Dr.S.M.Yadav AitPfAssociate Professor CED, SVNIT … INDIA. Introduction •The development and...

Mapping Salinity Ingress Using GALDIT Model
Dr.S.M.Yadav A i t P fAssociate Professor
CED, SVNITSURAT INDIASURAT, INDIA

Co-Authors
Dr.B.K.SamtaniProfessor
CED, SVNITSURAT, INDIA
H.D.VasavaJunior EngineerJunior Engineer
VMCVADODARA, INDIA,

Introduction
•The development and management of coastal•The development and management of coastal
ground water aquifer is a serious issue.g q
• Monitoring of sea water intrusion involves
determination and prediction of ground waterdetermination and prediction of ground water
deterioration and assesses other managerial
activities in coastal aquifers.

d if f d• Ground water aquifers are often exposed to heavy pumping and consequently risks of sea water intrusion in case of coastal aquifers
• Vasava et al (2010) studied the vulnerability of( ) ysea water intrusion in ground water as carriedout by Chachadi (2001, 2002) in coastaly ( , )aquifer of Goa, India.

• Coastin (2001) assessed ground watervulnerability to pollution.y p
Mi (2004) i d i i• Mitra (2004) carried out sea water intrusionstudy using remote sensing and GIS for theGulf of Cambay, Gujarat

• Kumar (2007) modelled sea water intrusion in
th Gnorth Goa.
•Sharma (1976) assessed quality of ground water
i h l if Vi kh I diin the coastal aquifer near Visakhapatnam, India.

•Number of solute transport models suitable for
the simulation of sea water intrusion and up
coning of saline water beneath pumping sites isconing of saline water beneath pumping sites is
commercially available.
•These include SUTRA(Voss,1984) , FEFLOW(
Diersch,1998),HST3D( Kipp,1987) and SALTFLOW(
Molson and Frind 1994)Molson and Frind ,1994) .

• The system presented here allows the user to
determine a numeric value for any hydrodetermine a numeric value for any hydro‐
geophysical setting by using an additiveg p y g y g
model.
• This model is an open‐ended model allowing
the user for addition and deletion of one orthe user for addition and deletion of one or
more indicators.

•However, under normal circumstance, present
set of indicators should not be deleted and anyset of indicators should not be deleted and any
addition of the indicator would require re‐q
deriving of the weights and the classification
table.

Suggested System of Vulnerability
gg y yEvaluation and Ranking
•The system of vulnerability evaluation and
ranking is developed by Chachadi (2001) is used
in the present study.
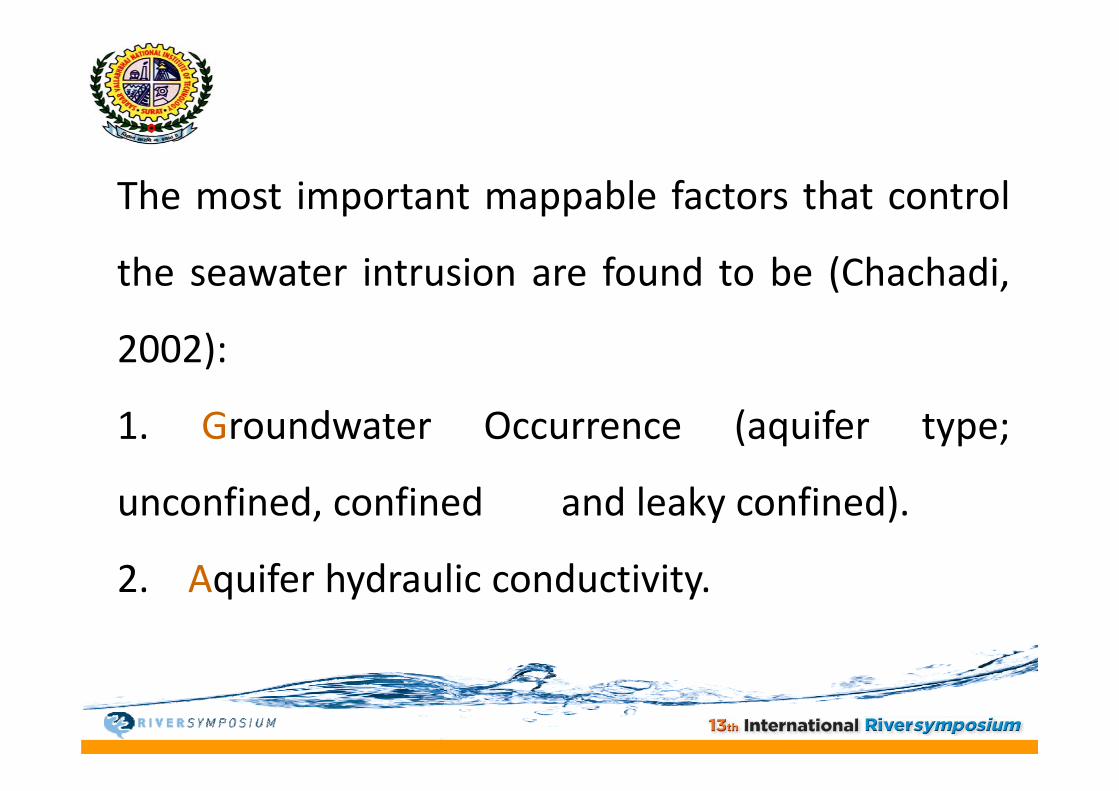
The most important mappable factors that controlp pp
the seawater intrusion are found to be (Chachadi,
2002):
1. Groundwater Occurrence (aquifer type;
unconfined, confined and leaky confined).
2 Aquifer hydraulic conductivity2. Aquifer hydraulic conductivity.

3 Depth to ground water Level above sea
4 Di t f th i t i ti f th4 Distance of the point in question from the
shore (distance inland perpendicular fromshore (distance inland perpendicular from
Shore line))

5 I t it d f th i ti t5. Impact magnitude of the existing seawater
i t i i th ifintrusion in the area, if any.
6 Thickness of the aquifer (which is being6. Thickness of the aquifer (which is being
mapped)mapped).

Th GALDIT i f d f h•The acronym GALDIT is formed from the
highlighted and underlined letters of the factorshighlighted and underlined letters of the factors
for ease of reference.
•These factors, in combination, are determined
t i l d th b i i t d d tto include the basic requirements needed to
assess the general seawater intrusion potentialassess t e ge e a sea ate t us o pote t a
of each hydro geologic setting.

• GALDIT factors represent measurable
parameters for which data are generally
il bl f i t f ith tavailable from a variety of sources without
detailed reconnaissance.
• A numerical ranking system to assess seawater
intrusion potential in hydro geologic settings
has been devised using GALDIT factorshas been devised using GALDIT factors.

•The system contains three significant parts:•The system contains three significant parts:weights, ranges and importance ratings.
• Each GALDIT factor has been evaluated withEach GALDIT factor has been evaluated withrespect to the other to determine the relativei f h fimportance of each factor.

•The various parameters adopted in the
evolution of the present indicator tool include:evolution of the present indicator tool include:
(i)Identification of all the indicators influencing
the seawater intrusion –This task was through
extensive discussions and consultations with theextensive discussions and consultations with the
experts, academicians etc.
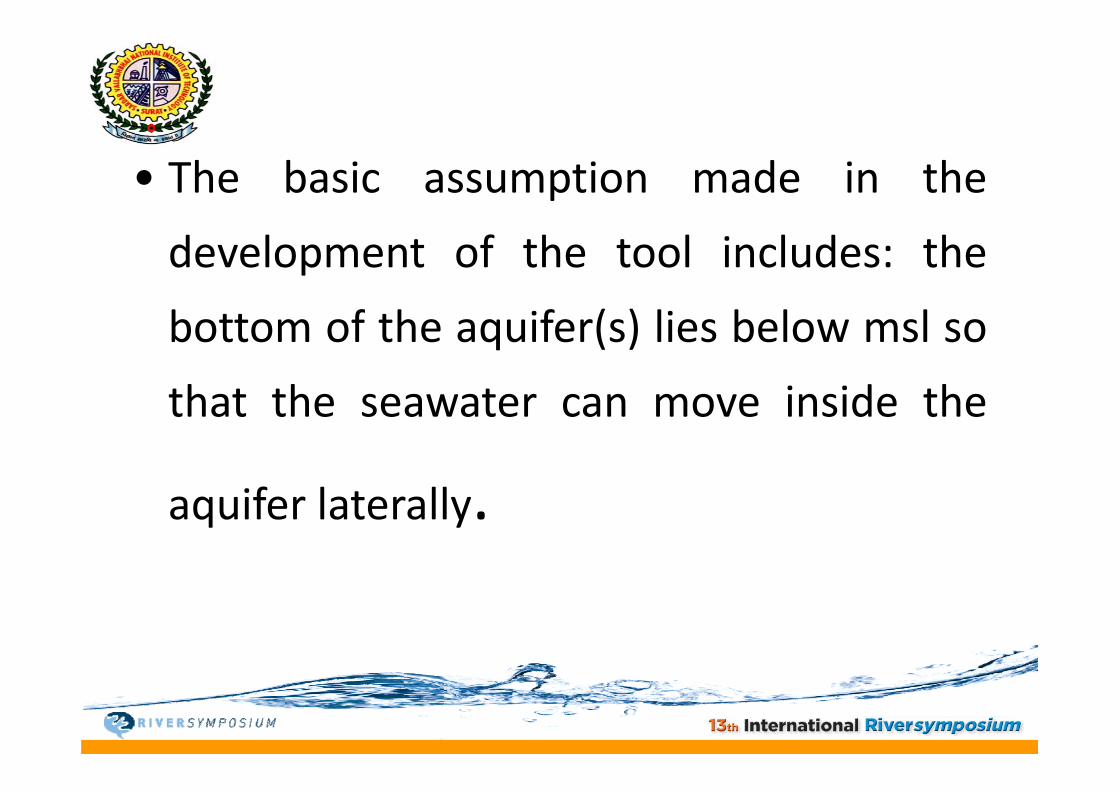
• The basic assumption made in the
development of the tool includes: the
bottom of the aquifer(s) lies below msl so
that the seawater can move inside thethat the seawater can move inside the
aquifer laterally.

• Any event of seawater moving inland and causingseawater mixing in the freshwater aquifers such asseawater mixing in the freshwater aquifers such asstorm surges and tsunamis, which normally move
i l d b i l lif i id d iseawater inland by vertical uplift, is not considered inthe present model.
• (ii)Derivation of indicator weights –Indicator weightsdepicts the relative importance of the indicator todepicts the relative importance of the indicator tothe process of seawater intrusion.

•After identifying the indicators, a group ofpeople consisting of Geologists hydro geologistspeople consisting of Geologists, hydro geologists,environmentalists, students, and in house expertswas asked to weigh these indicators in order ofimportance to the process of seawater intrusion.• The feedbacks from all such interactions wereanalyzed statistically and the final consensus list ofanalyzed statistically and the final consensus list ofindicators weights was prepared (Table 1).

Table 1 Indicator weights.
Factors Weights
d1. Groundwater occurrence 1
2. Aquifer hydraulic conductivity 3
3. Height of groundwater level above sea level
4
4. Distance from the shore 4
5. Impact of existing status of seawater 1Intrusion
6.Thickness of aquifer being mapped 2

•The most significant indicators have weights ofg g
4 and the least a weight of 1 in a five‐point scale
indicating parameter of less significance in the
process of seawater intrusionprocess of seawater intrusion.
•As the indicator weights are derived afterg
elaborate discussions and deliberations among
the experts, academicians, researchers, etc., they
must be considered as constants and may not bemust be considered as constants and may not be
changed under normal circumstances.

(iii)Assigning importance rates to indicator(iii)Assigning importance rates to indicator
variables using a scale of 2.5 to 10 – Each of
the indicators are subdivided into variables
di h ifi d ibaccording to the specified attributes to
determine the relative significance of thedetermine the relative significance of the
variable in question on the process of
seawater intrusion.

• The important ratings range between 2.5, 5,
7 5 and 10 Higher value of importance rating7.5 and 10. Higher value of importance rating
indicates higher vulnerability to seawaterg y
intrusion.

(iv) Decision criterion – It is the total sum of
the individual indicator scores obtained by
multiplication of values of importance ratings
with the corresponding indicator weights.
Higher the values of importance ratings of the
variable, more vulnerable are the aquifers to, q
seawater intrusionseawater intrusion.

Indicator Descriptions
Indicator Descriptions
Indicator‐1: Groundwater occurrenceIndicator 1: Groundwater occurrence(Aquifer Type)
I t d t ll iIn nature, groundwater generally occurs in
the geological layers and these layers may beg g y y y
confined, unconfined, and leaky confined or limited
b b d i Th fby one or more boundaries. The extent of seawater
intrusion is dependent on this basic nature ofp
groundwater occurrence.

Therefore, in assigning the relative weights to
GALDIT t G h ld f ll t d thGALDIT parameter G one should carefully study the
disposition and type of the aquifers in the studydisposition and type of the aquifers in the study
area.
• The confined aquifer is more vulnerable due
to larger cone of depression andto larger cone of depression and
instantaneous release of water to wells duringg
pumping and hence scores the high rating
compared to other types of aquifers.
• In case of multiple aquifer system in an area,
the highest rating may be adoptedthe highest rating may be adopted.

Table 2 Ratings for Ground Water
Table 2 Ratings for Ground WaterOccurrence.
Indicator Indicator variablesImportanceRatings
Confined aquifer 10
Un confined aquifer 7.5
Groundwater Occurence
Leacky confined aquifer5
Aquifer type Bounded aquifer(recharge and/or im pervious
b d li d ll l2.5
boundary alined parallel to the coast)

Indicator‐2: Aquifer hydraulic conductivity
•The parameter aquifer hydraulic conductivity is
used to measure the rate of flow of water in the
aquifer and hence to and fro from the sea in the
coastal area.
•By definition, the aquifer hydraulic conductivity is
the ability of the aquifer to transmit water.

•The hydraulic conductivity is the result of they y
interconnected pores (effective porosity) in the
sediments and fractures in the consolidated
krocks.
•The magnitude of seawater front movement isThe magnitude of seawater front movement is
influenced by the hydraulic conductivity of the
aquifer.

•For a given hydraulic head, a high value of
hydraulic conductivity of an aquifer leads to larger
inland movement of the seawater frontinland movement of the seawater front.
• The high hydraulic conductivity also results in
wider cone of depression during pumping and
may allow greater seawater intrusion if located
close to the coastclose to the coast.

Length of seawater intrusion in the coastal aquiferg q

•The ratings for the GALDIT parameter A, which
are modified from Aller et al. (1987), are given in
table 3.

Table 3 Ratings Aquifer Hydraulic Conductivity.
Indicator variables Importance
y
Indicator (A)Indicator variables Importance
RatingsClass Range,m
Hi h < 40 10Aquifer hydraulic conductivity
High < 40 10
Medium 10‐40 7.5y
(m/day) Low 5‐10 5
V low >5 2.5

•The aquifer hydraulic conductivity can be
estimated from pumping test data as well as from
litho logical logslitho logical logs.
•The well log data and porosity logs can also be
used to compute the aquifer hydraulic
conductivityconductivity.

Indicator‐3: Height of groundwater level above sea ele ation
sea elevation
•The level of groundwater with respect to mean•The level of groundwater with respect to mean
sea elevation is the most important factor in thesea elevation is the most important factor in the
evaluation of seawater intrusion in an area,evaluation of seawater intrusion in an area,
primarily because it determines the hydraulicp y y
pressure availability to push back the seawaterp y p
front.

•As seen from the famous Ghyben‐Herzberg
(1888 1901) relation for every meter rise of fresh(1888‐1901) relation, for every meter rise of fresh
water above mean sea elevation, a freshwater
column of 40 m is developed below it down to the
interface and vice‐versa.

•In assigning the ratings to the GALDIT parameter
L, the long‐term spatial variations of the
groundwater levels in the area need to be carefullygroundwater levels in the area need to be carefully
studied.
•Generally, the values pertaining to minimum
groundwater levels above sea (pre‐monsoon
d i M ) b id d thi ldduring May) may be considered, as this would
provide the highest possible vulnerability risk.provide the highest possible vulnerability risk.
• The ratings adopted for L are given in table 3

•Groundwater level data with respect to msl canGroundwater level data with respect to msl can
be obtained by establishing observation wells in
the area and measuring the pre‐ and post‐
monsoon water levels and reducing them with
respect to the mean sea levelrespect to the mean sea level.
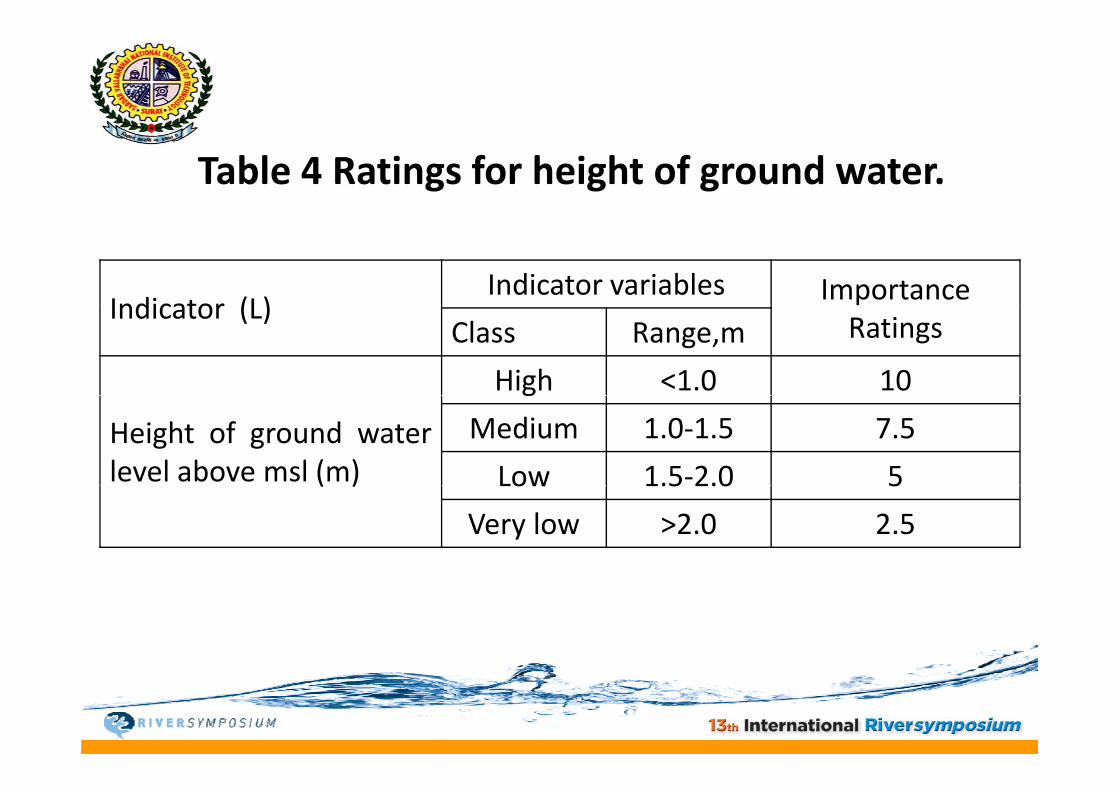
Table 4 Ratings for height of ground water.
Indicator (L)Indicator variables Importance
Indicator (L)RatingsClass Range,m
High <1.0 10
Height of ground waterlevel above msl (m)
g
Medium 1.0‐1.5 7.5
Low 1.5‐2.0 5( ) Low 1.5 2.0 5
Very low >2.0 2.5

Indicator‐4: Distance from the Shore
•The magnitude of the impact of seawater
i t i ll d i l dintrusion generally decreases as one move inland
at right angles to the shore and the creek. Theg g
maximum impact is witnessed close to the coast
and creeks under favorable hydro geological
di iconditions.

•Table 5 provides the general guidelines for rating of
the GALDIT parameter D assuming the aquifer isthe GALDIT parameter D assuming the aquifer is
under undisturbed conditions i.e. the groundwater
development in the area has not been significant to
offset the balanceoffset the balance.

• The value of importance ratings is assumed to
chan e linearl ith distance Dchange linearly with distance D.
• Data for parameter D can be computed using
the topographical/ cadastral or any surveyed
d t f th h i th hi h tiddata map of the area wherein the high tide
line for the coast has been demarcated.

Table 5. Ratings adopted for distance of thei t f h D
d ( ) d blImportance
point from shore D.
Indicator (L) Indicator variablesImportanceRatings
Class Range (m)g ( )
Distance of the Very small <500 10
Small 500‐750 7 5point fromShore ( m)
Small 500 750 7.5
Medium 750‐1000 5
Far >1000 2 5Far >1000 2.5

Indicator‐5: Impact of existing status of SeawaterIndicator 5: Impact of existing status of Seawaterintrusion
•Some times the area under mapping is already
under water stress conditions and this stressunder water stress conditions and this stress
might have affected the natural hydraulic balanceg y
between seawater and fresh groundwater.

• This existing imbalance in the seawater‐
f h f h ld b d dfreshwater interface should be considered
while mapping the aquifer vulnerability towhile mapping the aquifer vulnerability to
seawater intrusion.

•Revelle (1941) recommended the ratio of Cl /[HCO+ CO3] as a criterion to identify the extent of[HCO+ CO3] as a criterion to identify the extent ofseawater intrusion into the coastal aquifers.•Chloride (Cl) is the dominant ion in the seawaterand it is only available in small quantities inand it is only available in small quantities ingroundwater while bicarbonate (HCO3), which is
il bl i l i i i davailable in large quantities in groundwater, occursonly in very small quantities in seawater.

• This ratio can be used while assigning theimportance rating for the GALDIT parameter I,importance rating for the GALDIT parameter I,provided the chemical analysis data is
il bl f th d i ti tiavailable for the area under investigation.

•In case such chemical data is not readily available,
then information gathered from the field surveythen information gathered from the field survey
and inquiries from the water users in the area canq
be used in assigning the importance rating for I.
•The information required for the above rating can
b th d f hi t i l t i i fbe gathered from historical reports, inquiry from
the local people, farmers, and chemical analysisthe local people, farmers, and chemical analysis
data.

Table 6 Ratings for impact status of
Table 6 Ratings for impact status of existing sea water intrusion.
Indicator variables Importance
Indicator (I) RatingsClass Range of
CI/(HCO3+CO3)Ratio in lpm in groundwater
Impact t t f
High >2 10status of existing seawater
Medium 1.5 – 2.0 7.5
Low 1 – 1.5 5seawater intrusion Very low <1 2.5

Indicator‐6: Thickness of Aquifer being mappedIndicator 6: Thickness of Aquifer being mapped
•Aquifer thickness or saturated thickness of an
unconfined aquifer plays an important role in
determining the extent and magnitude of
seawater intrusion in the coastal areas.

•Keeping this as a guideline the ratings given in
T bl 7 d d f i f ifTable 7 are adopted for various ranges of aquifer
thickness T The aquifer thickness in a given areathickness T. The aquifer thickness in a given area
can be obtained from litho logical logs and can also
be deduced from carefully conducted vertical
electrical sounding data.

Table 7 Ratings for Aquifer thickness
Indicator variables ImportanceIndicator (T )
Indicator variables Importance Ratings
]Class Range
Aquifer thickness
Large >10 10
Medium 7.5‐ 10 7.5Aquifer thickness(saturated ) in meters Small 5 – 7.5 5
Very small < 5 2.5Very small < 5 2.5

Computing of the GALDIT Index
Each of the six GALDIT indicators has a pre‐
determined fixed weight that reflects its relative
importance to seawater intrusion Computing theimportance to seawater intrusion. Computing the
individual indicator scores and summing them and
dividing by the total weight as per the following
expression gives the GALDIT Index:

where, w = Weight of the indicator R = Importance rating of the ithR Importance rating of the i
indicator

•Thus, compute the indicator score from hydro
geologic and geological information from the area
of interest and variables to reflect specificof interest and variables to reflect specific
conditions within that area.co d t o s t t at a ea
•This system allows the user to determine a
numerical value for any hydro‐geographical setting
by using this additive model.

• The “maximum GALDIT Index” is obtained by
b hsubstituting the maximum importance ratings
of the indicators as shown in next slideof the indicators as shown in next slide.

Max = {(W1)×R1+ (W2)×R2 + (W3)×R3 + (W4)×R4 +
(W5) ×R5 + (W6)×R6}/ ∑w
= {(1)×10+(3)×10+(4)×10+(4)×10+(1)×10
+(2) ×10}/ 15
= 10

•Similarly, the “minimum GALDIT Index is
obtained by substituting the minimum importance
ratings of the indicators as shown below:ratings of the indicators as shown below:

• Min = {(W1)×R1+(W2)×R2+(W3)×R3+(W4)×R4+(W5){( ) ( ) ( ) ( ) ( )× R5+(W6)×R6}/ ∑w
= { (1)×2 5 + (3)×2 5 + (4)×2 5 + (4)×2 5+= { (1)×2.5 + (3)×2.5 + (4)×2.5 + (4)×2.5+ (1)×2.5 + (2) ×2.5 }/15
= 2.5

•Therefore the minimum and maximum GALDIT•Therefore, the minimum and maximum GALDIT
Index varies between 2.5 to 10.
• The vulnerability of the area to seawater
intrusion is assessed based on the magnitude of
th GALDIT I dthe GALDIT Index.
•In a general way, lower the index less vulnerableg y,
is the area to the seawater intrusion.

Decision Criteria
•Once the GALDIT Index has been computed it is•Once the GALDIT Index has been computed, it is
therefore possible to classify the coastal areas
into various categories of seawater intrusion
vulnerability the range of minimum and
maximum GALDIT Index scoresmaximum GALDIT Index scores
(i.e. 2.5 to 10) is divided into 3 groups.( ) g p
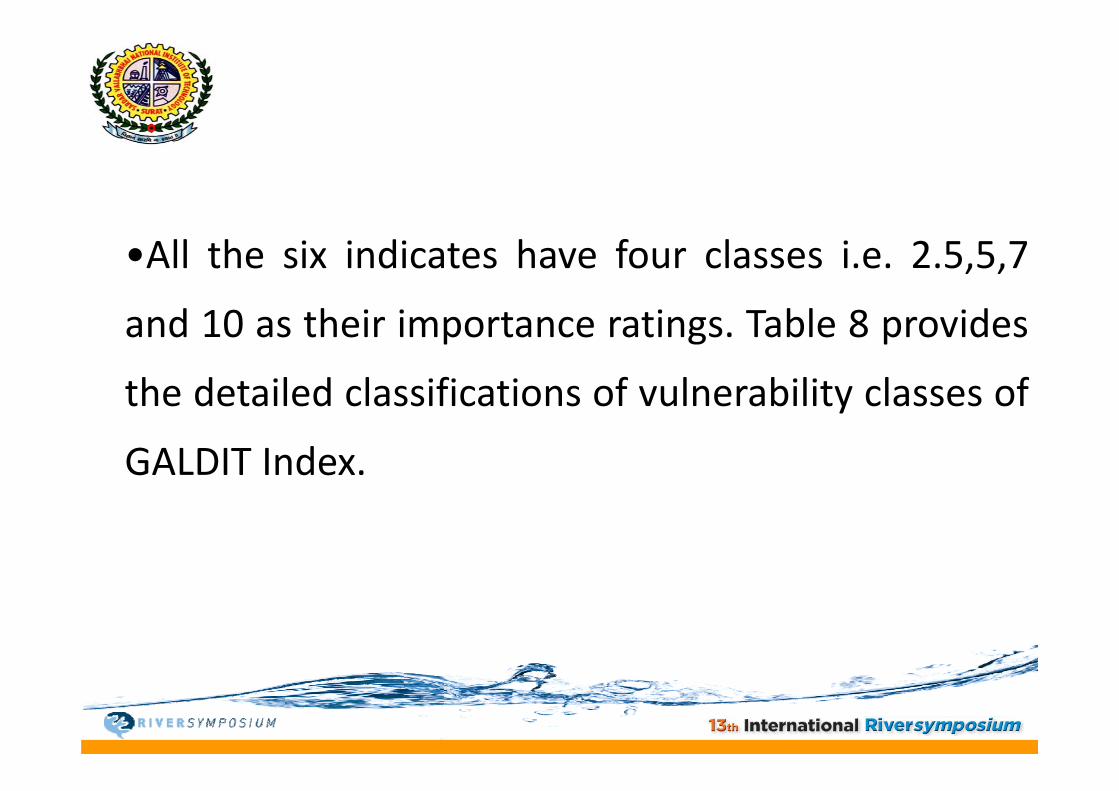
•All the six indicates have four classes i.e. 2.5,5,7
and 10 as their importance ratings. Table 8 provides
the detailed classifications of vulnerability classes ofthe detailed classifications of vulnerability classes of
GALDIT Index.

Table 8 Vulnerability classes
Sr No GALDIT Index Range Vulnerability ClassesSr No. GALDIT Index Range Vulnerability Classes
1 ≥7.5 High Vulnerability
2 5 t 7 5 M d t V l bilit2 5 to 7.5 Moderate Vulnrability
3 < 5 Low Vulnerability

Application of
GALDIT Mapping
•The coastal tracts in India cover parts of Gujarat,
M h ht K t k K l T il N d A dhMaharashtra, Karnataka, Kerala, Tamil Nadu, Andhra
Pradesh, Orissa and West Bengal.Pradesh, Orissa and West Bengal.
• Besides the inherent ground water salinity in the
coastal tract, Sea water intrusion is also one of the
bl h lmajor problems in the coastal region.

•In certain areas problem of up coning of saline waterp p g
has also been reported due to overexploitation of
ground water.
• Problem of salinity ingress has been noticed in• Problem of salinity ingress has been noticed in
Minjur area of Tamil Nadu and Mangrol – Chorwad‐
Porbander belt along the Saurashtra coast.

• In Orissa, in an 8‐10 km. wide belt of
S b kh S l di B h i t f llSubarnrekha, Salandi, Brahamani out fall
regions in the proximity of the coast, theregions in the proximity of the coast, the
upper aquifers contain saline horizons
decreasing landwards.

I P di h i t f N li li it•In Pondicherry region east of Neyveli lignite
mines salinity ingress has also been observed.y g
• The inland ground water salinity in India occurs
mainly in the states of Maharashtra, Punjab,
Rajasthan Haryana Gujarat Karnataka UttarRajasthan, Haryana, Gujarat, Karnataka, Uttar
Pradesh, Delhi, Orissa and Bihar.

• The occurrence of inland salinity may be due to
over exploitation of ground water, use of
f d d lsurface water and ground water in complete
isolation characteristics of aquifer or someisolation, characteristics of aquifer or some
other reasons.

About 1.93 lakh sq.km area has been estimated
to be affected by saline water of Electrical
Conductivity 4000 μS/cm There are severalConductivity 4000 μS/cm. There are several
places in parts of Rajasthan and southernp p j
Haryana where EC values of ground water are
greater than 10000 μS/cm making water non‐
potablepotable.

• In some areas of Rajasthan and Gujarat
ground water salinity is so high that the wellground water salinity is so high that the well
water is directly used for salt manufacturingy g
by solar evaporation.
•The present study area forms part of the
coastal tract of Surat coast.
•The Tapi river estuary in the South and the•The Tapi river estuary in the South and the
Chapora River in the North form the hydrologicalChapora River in the North form the hydrological
boundaries of the study area.

• The map along with the location of watershed
l h his also shown in the Fig 1.

Fig.2 Map of study area

Fig.3 Singanpore weir, Surat, Indiag g p

Fig.4 Line Diagram

•The tidal waves intrude in the river up to
Singanpore weir The Singanpore weir wasSinganpore weir. The Singanpore weir was
constructed on River Tapi. The River Tapi meets
Arabian Sea downstream of a Singanpore weir at a
distance of 2 km, from Singanpore weir.

• The tidal effect of sea reaches up to
Singanpore weir The weir was constructed inSinganpore weir. The weir was constructed in
1995.
• The area is mainly covered by laterites and
river alluvium and at some places the met
sediments are exposed in the northsediments are exposed in the north.

•In the study area 10 groundwater monitoring
wells have been established and monthlywells have been established and monthly
groundwater levels have been recorded in allgroundwater levels have been recorded in all
these wells for last 15 years.

• The aquifer is mainly shallow unconfined in
b h ll llnature occurring both in river alluvium as well
as laterites exposed in the low lying areas Theas laterites exposed in the low lying areas. The
plateau laterites generally lack water table
and at some places the water table is very
deep.

•The river alluvium is highly drainable whereas
the laterites are not The GALDIT scores at eachthe laterites are not. The GALDIT scores at each
of the groundwater monitoring wells were
computed for the study area.
•The map derived for this study area is shown in
the fig 1the fig.1.
•The table 10 presents the details of wells andp
their distances from sea shore and weir.

F ll i d t ll t d f GWRDCFollowing data were collected from GWRDC:
Groundwater data from Gujarat Water Resource
D l t C ti (GWRDC)Development Corporation (GWRDC)
Water quality parameters: Cl,TDSq y p ,

• Depth of the Well (TD)
• Static Water Level (SWL)Static Water Level (SWL)
For pre‐monsoon and post monsoon period of f hof the years

The data ranges used for present study are asg p y
shown in table 9 and location details of wells areshown in table 9 and location details of wells are
presented in table 10presented in table 10.

Table.9 Data Range
Rise/Fall CI R.W.L S.W.L R.W.L Rise/Fall Rise/Fall Rain fall Name of
well Year
Pre-Monsoon (May) Post-Monsoon (Oct)
S.W.L T.D.S
Hazira Well 1990-99 4.35-2.85 4360-410 2136-120 4.99-3.49 4.15-1.1 6.74-3.69 0.73--0.51 1.9--1.1 2.48-0.55 2169-659Dumas Well 1970-99 7.1-0.93 1790-146 664-208 0.88--1.47 6.2-3.4 2.23--0.57 2.2--1.2 2.2--2.25 2.7-0.1 2299-565Piplod Well 1970-2000 7.7-4.6 4430-740 3320-168 2.49--0.81 6.48-3.23 3.49-0.61 0.8--1.54 2.23--1.52 3.2-0.3 2886-616Rander Well 1970-2002 8.7-3 1750-670 544-88 4.1--1.6 7.7-1.2 0-0 5.9--0.6 2.55--4.08 2.8--5.13Sachin Well 1985-2003 7.9-3.95 2570-1800 840-320 13.49-9.34 6.47-2.98 14.26-10.77 1.9--2.35 2.65--2.85 4.02-0.13 2298-528Jahangirabad Well 1990-2006 5.1-3.25 2700-570 1523-160 8.63-6.78 3.8-1.05 10.83-6.8 1.1--0.6 3.28--1.33 3.15-0.02 2169-528Olpad Well 1990-2007 2.55-1.15 4310-1540 1840-392 13.68-12.33 1.84-0.85 14.03-13.04 1.35--0.65 0.69--0.64 1.56-0.1 1421-422Amroli 1990 2004 15 1 10 2 2350 1090 872 256 1 7 6 6 13 05 8 9 0 03 4 55 2 35 2 35 2 7 2 07 0 0Amroli 1990-2004 15.1-10.2 2350-1090 872-256 .-1.7--6.6 13.05-8.9 .-0.03--4.55 2.35--2.35 2.7--2.07 0-0Kathor Well 1985-2007 13.35-11.49 850-90 152-64 12.52-3.87 11.52-4.7 0-0 11.22-5.9 8.45--8 3.32--3.77Vav Well 1990-2007 8.15-3.6 1940-890 980-64 31.82-26.92 4.35-1.9 33.52-27.07 2.55--3.13 4.95--5.8 5.1--1.18 2476-495

Table.10 Observation well details
Results and Discussion
The GALDIT index is computed using followingThe GALDIT index is computed using followingconsiderations and presented in table 11.
Unconfined aquifer is observed throughout thestudy area hence, the weight 7.5 for G is consideredfor all wells.
Depths above mean sea level were computedDepths above mean sea level were computedfrom the well data.

Distance from the coastline was calculated usingthe satellite images.
Impact of existing ground water intrusion has beenconsidered only in case of two observation wellsconsidered only in case of two observation wellswhich are close to sea shore.
Thickness of aquifer was taken equal to the depthof the well as the wells penetrate full length of theaquifer.aquifer.

The analysis of results suggest that the Dumas
well and Hazira well which are on the down streamwell and Hazira well which are on the down stream
side of weir and near to seashore have high
vulnerability to sea water intrusion.

Table 11. GALDIT index for wells
Sr No Well NameDistance from the shore
Computed GALDIT Index
1 Hazira well 1.2 km 6.6
2 Dumas Well 0.5 km 7.14
3 Piplod Well 7.6 km 7.11
4 R d W ll 5 7 k 6 64 Rander Well 5.7 km 6.6
5 Jahangirabad Well 8 km 6.6
6 Amroli Well 18 km 5.00
7 Olpad Well 20 km 7.077 Olpad Well 20 km 7.07
8 Sachin Well 10 km 6.59
9 V W ll 21 k 3 329 Vav Well 21 km 3.32
10 Kathor Well 25 km 4.38

Conclusion
•Once the GALDIT index has been computed, it isp ,
possible to identify areas that are more likely to be
susceptible to sea water intrusion than other areas.
•In the present study the area down stream of the•In the present study the area down stream of the
Singapore weir is more susceptible to sea waterg p p
intrusion potential.
• It has been confirmed by field observation that
the salinity in this area has been increasedthe salinity in this area has been increased.

•To control further sea water intrusion and protect•To control further sea water intrusion and protect
ground water being more saline Surat Municipal
Corporation has proposed to construct Balloon dam
(storage dam) on the down stream side of the weir
about 4 5 kms away from Singapore weirabout 4‐5 kms away from Singapore weir.
Reference
Aller, L., Bennett, T., Lehr, J.H. and Petty, R. J. (1987)DRASTIC: A standardized system for evaluatingDRASTIC: A standardized system for evaluatinggroundwater pollution potential using hydro geologicsettings, U.S. EPA Report 600/2‐85/018.
Chachadi A.G. and Lobo‐Ferreira, J.P. (2001) Seawater intrusion vulnerability mapping of aquiferswater intrusion vulnerability mapping of aquifersisung GALDIT method, In: Proc. Workshop onModelling in Hydrogeology AnnaModelling in Hydrogeology,AnnaUniversity,Chennai,pp.143‐156.

Chachadi, A. G. and Teresa, L., 2002, Health of theground water regime in a coastal delta of Eastg gGodavari, Andhra Pradesh, coastin 6, pp. 5 – 7.
Chachadi A G J P Lobo‐Ferreira Ligia NoronhaChachadi, A. G., J. P. Lobo Ferreira, Ligia Noronhaand B. S. Choudri (2002), “Assessing the Impact ofS L l Ri S lt W t I t i i C t lSea‐Level Rise on Salt Water Intrusion in CoastalAquifers using GALDIT Model”, Coastin – November2002, TERI, pp. 27‐32.

COASTIN (2001), “GIS and Mathematical Modellingfor the Assessment of Groundwater Vulnerability toPollution: Application to an India Case – Study Area inpp yGoa”, 2nd Year Report, April 2001, 69 p.
C. P. Kumar, A. G Chachadi, B. K. Purandara, SudhirK d R j J l (2007) M d lli f S tKumar and Raju Juyal,(2007), Modelling of SeawaterIntrusion in Coastal Area of North Goa ,GoaUniversity, Goa.

Diersch, Hans‐jorg G., 1998. “FEFLOW – Interactive,Diersch, Hans jorg G., 1998. FEFLOW Interactive,Graphics‐based Finite Element Simulation System forModeling Groundwater Flow Contaminant Mass andModeling Groundwater Flow, Contaminant Mass andHeat Transport Processes”’ Getting Started; UsersM l R f M l WASY I tit t f W tManual; Reference Manual, WASY Institute for WaterResources Planning and Systems Resarch Ltd., Berlin.
Ghyben, Badon W. (1889), Nota in verband met dey , ( ),voozgenomen put‐bozing nabig Amsterdam, Tijdischrift vanhet Koninklijk Institute van lngenieursdischrift vanhet Koninklijk. Institute van lngenieurs,The Hague. P.21188.

H hi t T St di J R d L k D P (1982)Hashimoto T, Stedinger J R, and Loucks D P., (1982),Reliability, resiliency, and vulnerability criteria forwater resource system performance evaluation,Water Resources Research 18(1), pp 14–20.( ), pp
Herzberg, B. (1901) Die Wasserversorgung einigerNodeebader Jour Gas‐Beluchtung andNodeebader, Jour. Gas‐Beluchtung andWasserversorgung, V.44, PP.815‐819, 842‐844,M i hMunich.

H.Vasawa,S.M.Yadav, B.K.Samtani ,(2010), SeaWater Intrusion Mapping using GALDIT indicatormodel‐A case study of in Surat, Dissertation Report,model A case study of in Surat, Dissertation Report,SVNIT, Surat, India.
Kipp, K.L., 1987. “HST3D – A computer Code forl f d l hSimulation of Heat and Solute Transport in Three
Dimensional Ground‐Water Flow Systems”, U.S.Geological Survey, Water Resources InvestigationsReport 86‐4095, 517p.Report 86 4095, 517p.

Mitra, D. and Agarwadkar, Y. Y., 2004, Study ofS l I i d V l bili A l i iSaltwater Intrusion and VulnerabilityAnalysisusingRemote Sensing, GIS and Modelling Techniques: ACase Study for the Gulf of Cambay, Gujarat, India,Conference Proceedings, Third Indian Nationalg ,Conference on Harbour and Ocean Engineering.
Moloson, J. W. and E. O. Frind, 1944. “SALTFLOW –D it d d t Fl d M T t M d l iDensity‐dependent Flow and Mass Transport Model inThree Dimensions”, User Guide, Waterloo Centre forGroundwater Research, University of Waterloo,Ontario, 68P.,

Revella (1941) Cuteria for recognition of seawaterRevella (1941), Cuteria for recognition of seawaterin ground waters, Trans Amer. Geophysical union22:593 59722:593‐597.
Sarma V.V.J, N.Krishnaich, (1976), Quality of groundwater in the coastal aquifer near Visakhapatnamwater in the coastal aquifer near Visakhapatnam,India, Ground water, vol.14, no.5. PP.290‐295.

Voss, Clifford I., 1984. “A Finite‐Element Simulation
Model for Saturated‐Unsaturated Fluid‐Density‐
D d G d Fl i h E TDependent Groundwater Flow with Energy Transport
or Chemically Reactive Single Species Soluteor Chemically Reactive Single‐Species Solute
Transport” U S Geological Survey Water ResourcesTransport , U.S. Geological Survey, Water Resources
Investigations Report 84‐4369, 409 p.Investigations Report 84 4369, 409 p.

Th k•Thank you