Revised FY 2022 Economic Forecast and Revenue Estimate and ...
Yorkshire Water |Drought Plan Worked Examples 2022| March 2021
1
PUBLIC
PUBLIC
Drought Plan 2022 (revised draft)
Drought Triggers and Worked Examples of drought scenarios Yorkshire Water 20/09/2021
PUBLIC

Yorkshire Water |Drought Plan Worked Examples 2022| March 2021
2
PUBLIC
PUBLIC
Contents List of Figures........................................................................................................................ 3
1 Introduction ................................................................................................................... 4
2 Drought Triggers-Control Line Calculations ................................................................... 5
3 Historic Droughts ........................................................................................................... 7
4 May 2017 prolonged dry weather .................................................................................. 9
5 1995-1996 drought ....................................................................................................... 14
6 Single season drought: 1929 ........................................................................................ 15
7 Serious two-year drought ............................................................................................ 17
8 Serious two-year drought with outage of a major Water Treatment Works ............... 20
9 Extreme three-year drought......................................................................................... 21
10 June 2018-March 2019 drought ................................................................................ 24
11 Spring 2020 dry weather and high demand (Covid-19) ............................................. 28
1 Annex 1 Example control curves plus scenario lines ..................................................... 31
Annex 1.1: Drought Planning in Weekly Water Situation Report: 1995-96 baseline scenario 1300Ml/d demand ...................................................................................................................... 31
Annex 1.2: Drought Planning in Weekly Water Situation Report: 1929 one season drought scenario at 1460Ml/d demand .................................................................................................... 34
Annex 1.3: Drought Planning in Weekly Water Situation Report: 1929 one season drought scenario at 1380 Ml/d demand ................................................................................................... 38
Annex 1.4: Drought planning in Weekly Water Situation Report: Two year drought at 1460Ml/d demand ....................................................................................................................................... 40
Annex 1.5: Drought planning in Weekly Water Situation Report: Two year drought at 1380Ml/d demand ....................................................................................................................................... 46
Annex 1.6: Drought planning in Weekly Water Situation Report: Two year drought at 1380Ml/d demand, with outage .................................................................................................................. 49
Annex 1.7: Drought planning in Weekly Water Situation Report: Three-year drought at 1460Ml/d demand (1995-1996-1996) .......................................................................................... 53
Yorkshire Water |Drought Plan Worked Examples 2022| March 2021
3
PUBLIC
PUBLIC
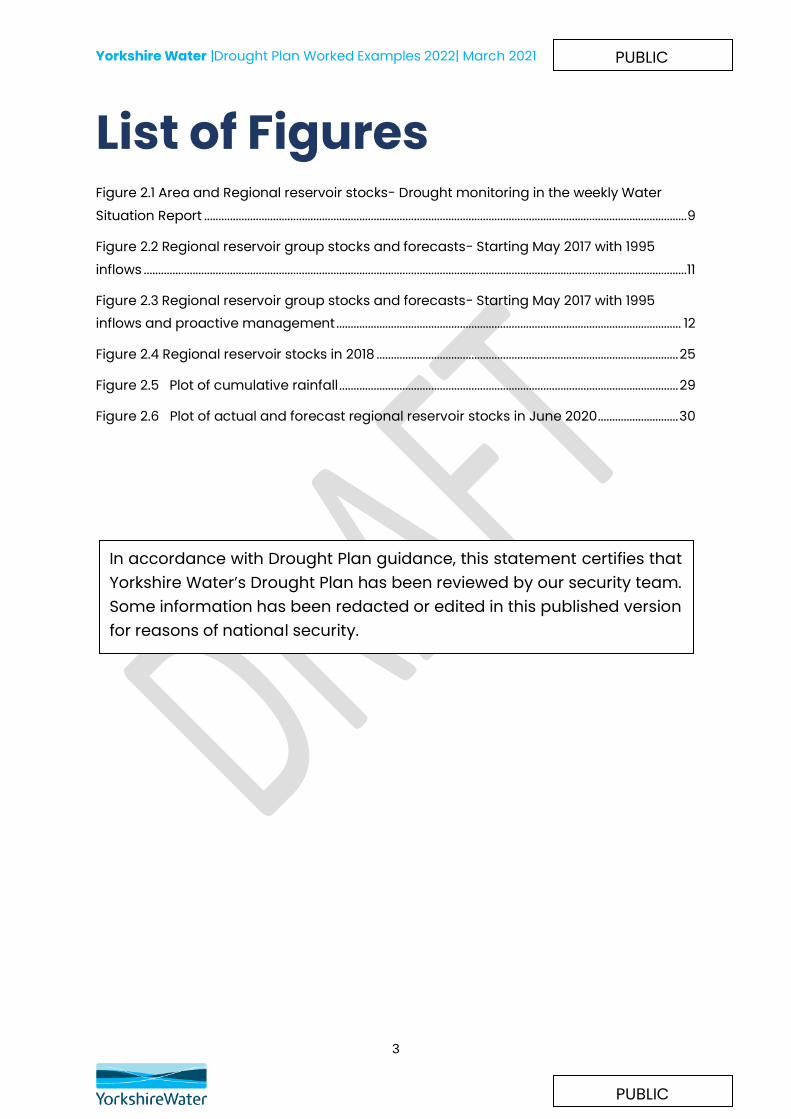
List of Figures Figure 2.1 Area and Regional reservoir stocks- Drought monitoring in the weekly Water Situation Report ........................................................................................................................................................................ 9
Figure 2.2 Regional reservoir group stocks and forecasts- Starting May 2017 with 1995 inflows .............................................................................................................................................................................................11
Figure 2.3 Regional reservoir group stocks and forecasts- Starting May 2017 with 1995 inflows and proactive management ........................................................................................................................ 12
Figure 2.4 Regional reservoir stocks in 2018 ......................................................................................................... 25
Figure 2.5 Plot of cumulative rainfall ...................................................................................................................... 29
Figure 2.6 Plot of actual and forecast regional reservoir stocks in June 2020 ............................ 30
In accordance with Drought Plan guidance, this statement certifies that Yorkshire Water’s Drought Plan has been reviewed by our security team. Some information has been redacted or edited in this published version for reasons of national security.
Yorkshire Water |Drought Plan Worked Examples 2022| March 2021
4
PUBLIC
PUBLIC
1 Introduction The scenarios below describe droughts of different severities, and the actions we would take in these examples. It should be remembered that these are examples, and the actions described are indicative of how we would respond to these particular examples. The figures here and in annexes 1.1-1.7 show reservoir group stocks for our five area and regional reservoir groups, as reported in our drought contingency plan graphs in our weekly Water Situation Report. The area graphs are used for operational planning, and a temporary use ban (level 2 restriction) or drought permit (level 3 restriction) triggered in one area does not mean that such restrictions will be implemented. If temporary use bans or drought permits are forecast in only one or two areas, we will manage resources to try to balance stocks across the region, and only implement regional restrictions once this had been done. We will generally only implement temporary use bans or drought permits if they are forecast in three or more of our five areas, or regionally.
The worked examples in this document have been used to test our drought plan, and shows that our triggers work well for these scenarios. We will continue to update scenarios in response to events, and use this process to identify and required updates to triggers where shortcomings are identified in the future.
Yorkshire Water |Drought Plan Worked Examples 2022| March 2021
5
PUBLIC
PUBLIC
2 Drought Triggers-Control Line Calculations
We have calculated the control lines using historical reservoir inflow sequences from 1920 (the start of our period of record) and we have designed them to minimise the risk of reservoir stocks falling below the marginal storage level. Marginal storage is 30 days’ supply at the reservoir or group yield, or 12.5 per cent of reservoir stocks, whichever is greater.
The control lines represent the value of reservoir storage that is required to guarantee a continuous rate of supply (equivalent to yield) such that the reservoir storage never falls below a critical storage line given the minimum historical inflows.
We calculate two sets of control lines:
▪ Drought Control Line (DCL) - the DCL is designed such that stocks will never fall below marginal storage.
▪ Normal Control Line (NCL) - the NCL is designed such that stocks will never fall below the DCL.
For the DCLs, net inflows assume that Once we have calculated the NCL and DCL, we linearly interpolate between the 100% full level and the NCL, the NCL and DCL, and the DCL and emergency storage level, to obtain the ten control lines (CLs) used in our modelling and reservoir stocks monitoring. The NCL is CL3, the DCL is CL7, and we use CL4 as the Environment Agency trigger line.
The control lines are updated on a regular basis and were last updated in 2012 based on minimum inflows from 1920-2011. In 2011 we experienced low rainfall and inflows in the south of the region resulting in very low reservoir levels in this area. A considerable amount of support was provided to compensation reservoirs by supply reservoirs, and we used this experience to change the way the control lines are calculated.
if there is a downstream compensation reservoir, it supplies compensation flows at half the normal compensation, and this is fully supported by the supply reservoir. For the NCLs, full support to maintain the normal compensation release is assumed. The changes in control lines that we made in 2012 led to a decrease in yield for many reservoirs in the region, and/or an increase in the level of control lines. However, this yield decrease was not reflected into a decrease in regional deployable output. This is
Yorkshire Water |Drought Plan Worked Examples 2022| March 2021
6
PUBLIC
PUBLIC
because of the conjunctive use of our grid system, whereby flows from multiple sources can be balanced right across the grid.
We will review control lines using inflows calculated using the latest data when available and provide any updates in annual reviews. Control lines have not been fully revised since 2013 as, until 2018, there had been no significantly dry years since 2011. We have carried out analysis of minimum inflows for a selection of reservoirs, and no minima occur in the years since 2013 that would affect the ordinates of the control lines.
We have now updated our historic inflows to include the period up to the end of 2018 and this will be used in future WRMP and Drought Plan modelling / analyses, as well as stochastic time series. We now also have a new set of inflows developed using GR6J rainfall runoff models
Yorkshire Water |Drought Plan Worked Examples 2022| March 2021
7
PUBLIC
PUBLIC
3 Historic Droughts The summer of 2003 was hot and dry late into the autumn, with no significant reservoir refill until November. In the summer of 2006 some very high temperatures led to extremely high peak demands. We used this to reappraise our peak demand profile to reflect a worst-case scenario of high summer demands.
In 2010 and 2011 we experienced uncharacteristically dry springs, which led to earlier than usual reservoir drawdowns. In both years, the spring was preceded by an unusually cold winter. At the end of 2011 we recalculated our control lines using the latest data, and changing the way we dealt with the issue of supporting compensation reservoirs from supply reservoirs when deriving control lines, making them more conservative.
During our most recent drought in 2018, a period of exceptionally dry weather led to an unprecedented and prolonged period of high demand across our region. In reaction to falling reservoir stocks we implemented parts of our Drought Plan and the Environment Agency classified the region as “in drought” from November 2018 to February 2019. To ensure we were resilient to the dry weather continuing into 2019, we started the process of applying to the Environment Agency for drought permits for the first time since 1996.
Significant rainfall in late 2018 meant our reservoirs recovered sufficiently enough for us to only progress with two drought permit applications. These permits were to temporarily modify licence agreements we hold with the Environment Agency for abstracting water from the River Wharfe and River Derwent. The applications were to increase the total volume we could abstract over the year from 1 April 2018 to 31 March 2019. The instantaneous and daily maximum abstractions were not changed, and neither were the rules that govern how much we abstract at different river flow rates. Both permits were granted by the Environment Agency.
We applied for and obtained these permits as a precautionary measure as we had used a larger than usual proportion of the licenced volumes in 2018 and there was a risk we could reach the annual limits if we experienced high demand through winter 2018/19. As the winter demand was not exceptional, we did not implement the permits.
Yorkshire Water |Drought Plan Worked Examples 2022| March 2021
8
PUBLIC
PUBLIC
In 2020 we experienced high demands in spring and early summer, partly due to the hot dry weather, but also influenced by the Covid-19 lockdown. There was unprecedented volatility in demand due to more people being at home during the week and responding to the hot weather with increased water use for activities such as garden watering and paddling pool use. Reservoir stocks fell rapidly, and forecasts showed level 2 triggers to be expected in August. We started to prepare drought permit applications required for level 3 actions, but rainfall in June and July increased reservoir stocks, and we stopped the drought permit application process. During 2020 we carried out our usual WRPR modelling, but developed a new demand profile to better reflect the spatial and temporal patterns of demands we were seeing during lockdown, so that our forecasts were based on the latest information.
We have periodically generated demand profiles for use in our WRAPsim modelling, and use these to test our triggers against a range of demand profiles. The 2006 demand profile is still one with the highest monthly peak, the 2018 profile has a long period of high demand, so the scaled peak is lower compared to the annual average, and the 2020 profile has a different spatial distribution due to the effects of the Covid-19 Lockdown. We work with our colleagues in Production Planning to agree the most appropriate demand profile to use for our WRPR planning report (see section 2.5), and in 2018 and 2020 we used demand profiles adjusted to better reflect the demand patterns we were seeing, and expected to see based on weather forecasts.
It should be noted that the demand profiles reflect the temporal and spatial shape of demands, and in our modelling and in the worked examples, we use these profiles scaled to annual average demands of different magnitudes.

Yorkshire Water |Drought Plan Worked Examples 2022| March 2021
9
PUBLIC
PUBLIC
4 May 2017 prolonged dry weather
In May 2017 regional reservoir stocks were close to the Environment Agency early warning trigger line, and we held our first Environment Agency liaison meeting in mid May. This followed a dry winter, and regional reservoir stocks were only 80 per cent at the start of the year. Some recovery occurred towards the end of February, but stocks remained relatively low, and recharge was slow due to the extremely dry conditions. The area and regional reservoir stocks are shown in Figure 4.1 for the years 2014-2021 (to date).
NORTH WEST RESERVOIR GROUP
NORTH RESERVOIR GROUP
SOUTH WEST RESERVOIR GROUP
EAST RESERVOIR GROUP
SOUTH RESERVOIR GROUP
REGIONAL RESERVOIR
Figure 4.1 Area and Regional reservoir stocks- Drought monitoring in the weekly Water Situation Report
Yorkshire Water |Drought Plan Worked Examples 2022| March 2021
10
PUBLIC
PUBLIC
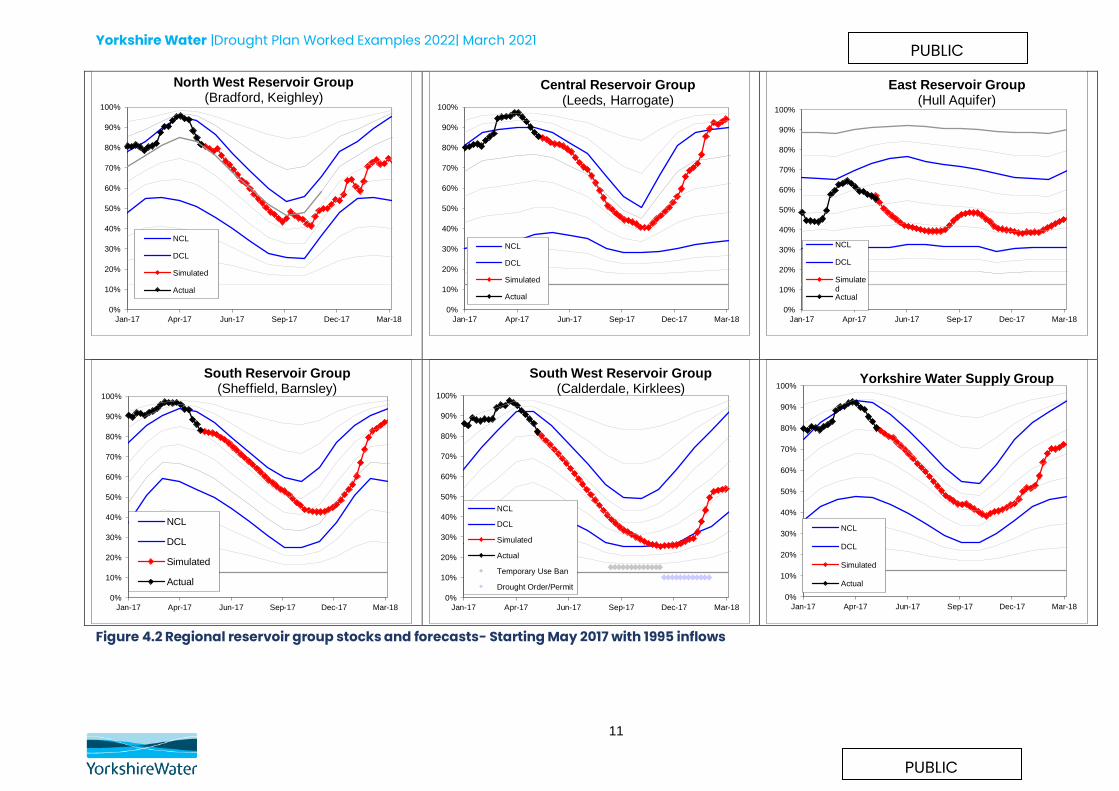
We produced forecasts of reservoir stocks, which are shown in Figure 4.2. The forecast showed that we could expect a temporary use ban to be triggered in autumn 2017 in the South West area if we had a repeat of the 1995-1996 inflows drought at 1300Ml/d demand. However, in practice we would not impose restrictions if a temporary use ban was forecast in only one area. In this scenario, a temporary use ban was triggered in only the South West area, and we did not apply for any demand restrictions, although we implemented our Company Risk Management Team (now Bronze Risk) and met with the Environment Agency in May once regional stocks crossed the Environment Agency trigger line.
Our normal water saving campaign promoting advice and free water saving devices was live as usual throughout the summer. As the weather warmed up we increased the level of promotion and instigated our media communications to heighten awareness of the dry weather. Our level of communications to customers, albeit heightened, did not cross into any more serious messages of do not use as regional stocks were only below the Environment Agency trigger line for a few weeks. The situation was monitored closely internally and communications were prepared and ready to be activated should the situation have escalated.
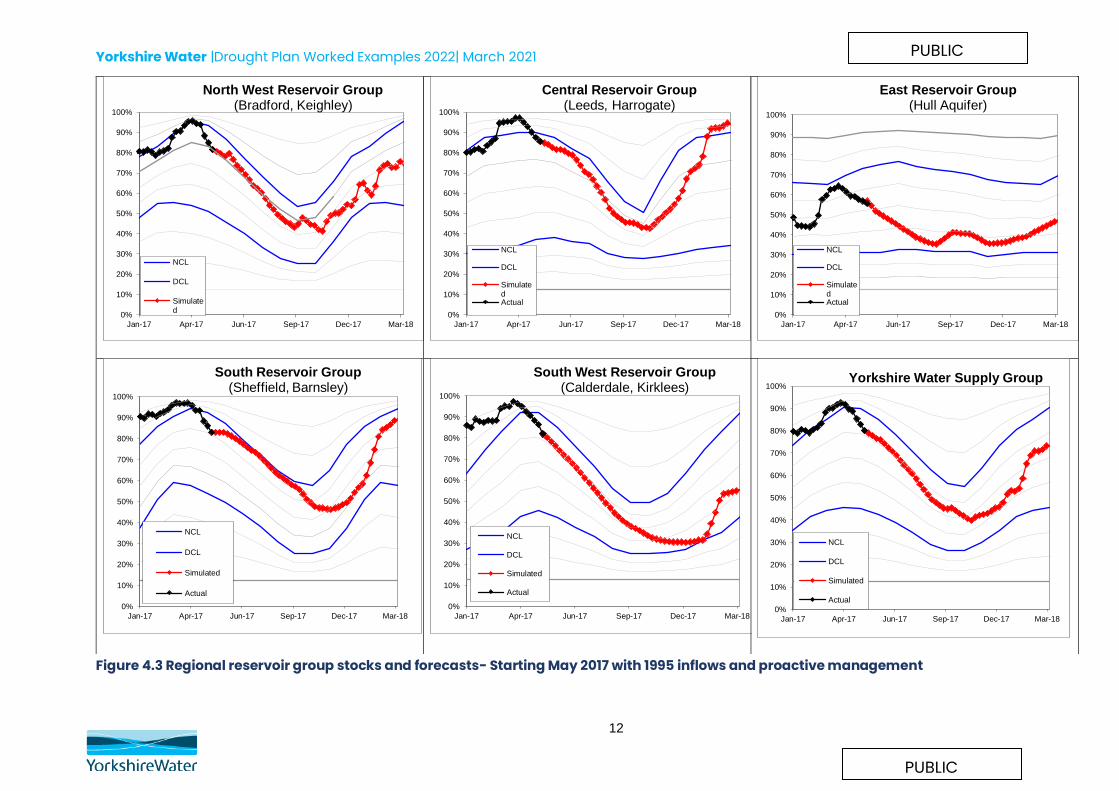
Figure 4.3 shows the forecast assuming proactive management of the situation to avoid temporary use bans, by increasing the use of rivers and using reservoirs groups in areas with higher stocks.
Yorkshire Water |Drought Plan Worked Examples 2022| March 2021
11
PUBLIC
PUBLIC
Figure 4.2 Regional reservoir group stocks and forecasts- Starting May 2017 with 1995 inflows
0%
10%
20%
30%
40%
50%
60%
70%
80%
90%
100%
Jan-17 Apr-17 Jun-17 Sep-17 Dec-17 Mar-18
North West Reservoir Group(Bradford, Keighley)
NCL
DCL
Simulated
Actual
0%
10%
20%
30%
40%
50%
60%
70%
80%
90%
100%
Jan-17 Apr-17 Jun-17 Sep-17 Dec-17 Mar-18
Central Reservoir Group(Leeds, Harrogate)
NCL
DCL
Simulated
Actual
0%
10%
20%
30%
40%
50%
60%
70%
80%
90%
100%
Jan-17 Apr-17 Jun-17 Sep-17 Dec-17 Mar-18
East Reservoir Group (Hull Aquifer)
NCL
DCL
SimulatedActual
0%
10%
20%
30%
40%
50%
60%
70%
80%
90%
100%
Jan-17 Apr-17 Jun-17 Sep-17 Dec-17 Mar-18
South Reservoir Group(Sheffield, Barnsley)
NCL
DCL
Simulated
Actual
0%
10%
20%
30%
40%
50%
60%
70%
80%
90%
100%
Jan-17 Apr-17 Jun-17 Sep-17 Dec-17 Mar-18
South West Reservoir Group(Calderdale, Kirklees)
NCL
DCL
Simulated
Actual
Temporary Use Ban
Drought Order/Permit
0%
10%
20%
30%
40%
50%
60%
70%
80%
90%
100%
Jan-17 Apr-17 Jun-17 Sep-17 Dec-17 Mar-18
Yorkshire Water Supply Group
NCL
DCL
Simulated
Actual
Yorkshire Water |Drought Plan Worked Examples 2022| March 2021
12
PUBLIC
PUBLIC
Figure 4.3 Regional reservoir group stocks and forecasts- Starting May 2017 with 1995 inflows and proactive management
0%
10%
20%
30%
40%
50%
60%
70%
80%
90%
100%
Jan-17 Apr-17 Jun-17 Sep-17 Dec-17 Mar-18
North West Reservoir Group(Bradford, Keighley)
NCL
DCL
Simulated
0%
10%
20%
30%
40%
50%
60%
70%
80%
90%
100%
Jan-17 Apr-17 Jun-17 Sep-17 Dec-17 Mar-18
Central Reservoir Group(Leeds, Harrogate)
NCL
DCL
SimulatedActual
0%
10%
20%
30%
40%
50%
60%
70%
80%
90%
100%
Jan-17 Apr-17 Jun-17 Sep-17 Dec-17 Mar-18
East Reservoir Group (Hull Aquifer)
NCL
DCL
SimulatedActual
0%
10%
20%
30%
40%
50%
60%
70%
80%
90%
100%
Jan-17 Apr-17 Jun-17 Sep-17 Dec-17 Mar-18
South Reservoir Group(Sheffield, Barnsley)
NCL
DCL
Simulated
Actual
0%
10%
20%
30%
40%
50%
60%
70%
80%
90%
100%
Jan-17 Apr-17 Jun-17 Sep-17 Dec-17 Mar-18
South West Reservoir Group(Calderdale, Kirklees)
NCL
DCL
Simulated
Actual
0%
10%
20%
30%
40%
50%
60%
70%
80%
90%
100%
Jan-17 Apr-17 Jun-17 Sep-17 Dec-17 Mar-18
Yorkshire Water Supply Group
NCL
DCL
Simulated
Actual
Yorkshire Water |Drought Plan Worked Examples 2022| March 2021
13
PUBLIC
PUBLIC
Our WRAPsim model is calibrated so that in our WRMP Deployable Output scenario we meet our levels of service of no more than three temporary use bans and one drought order/permit triggered in each reservoir group in our period of record. When we are experiencing a particular drought event, we will optimise our operations in response to the conditions of that drought, balancing stocks across the region as far as possible. If stocks are falling quickly in one area, we will reduce the use of reservoirs in that area and increase support from other areas and from river abstractions.
The 1995-1996 flow deficit is shown in the main drought plan document in Figure 2.4 on our Drought Response Surface (DRS). On this plot we can see that 1996 is our most severe 18 month drought by a considerable margin, falling just on the edge of the shaded area of the response surface where the DCL threshold is crossed.
Yorkshire Water |Drought Plan Worked Examples 2022| March 2021
14
PUBLIC
PUBLIC
5 1995-1996 drought
The figure in Annex 1.1 shows the predicted reservoir storage under a repeat of 1995-1996 inflows at an average annual demand of 1300Ml/d, with a dry year monthly demand profile. The simulation shows no temporary use bans because our service has improved since 1995-1996. In practice, during 1995-1996 we had drought orders throughout the region. The improved service, compared to the actual situation in 1995-1996, is due to the significant investment that we have made over the last 25 years, in reducing leakage and improving our grid network. This scenario shows no temporary use bans as it is based on the entire 1995-1996 period, and the start of 1995 was relatively wet. The scenario shown in Figure 4.2, with forecasts for 1995-1996 inflows starting in May 2017 shows temporary use bans triggered in some areas because the start of 2017, was far drier than the start of 1995.
When January 1995-December 1996 inflows are repeated at a higher annual average demand of 1380Ml/d, temporary use bans are triggered. Since 2004 annual average demands have ranged from 1210Ml/d to 1317Ml/d, with an average of 1275Ml/d, so a 1380Mld annual average demand represents a high demand scenario. In 2018 we had a prolonged period of high demands, which was unprecedented in recent years. Average demand in 2018 was 1302Ml/d, with monthly demands of 1351Ml/d in May, 1350Ml/d in June and 1392 Ml/d in July. For much of this summer period the regional demand followed our high demand profile, which we used for forecasting in our scenario modelling.
The 1995-1996 event is the only two-year drought we have in our period of record. Rainfall totals for the 20 month period from March 1995 to October 1996 are just 67 per cent of the long-term average. This equates to a return period of about 1 in 500 to 1 in 1000 years (rainfall analysis using Tabony Tables). However, because the drought was preceded by and followed by relatively wet periods, if the entire two years 1995 and 1996 are analysed, the 80 per cent rainfall in this period has a return period of only 1 in 20 years. This highlights the problems associated with the use of return period statistics in drought situations.
Yorkshire Water |Drought Plan Worked Examples 2022| March 2021
15
PUBLIC
PUBLIC
6 Single season drought: 1929
The first set of figures in Annex 1.2 show the predicted reservoir storage under a repeat of 1929 inflows when demand is at 1460 Ml/d (Deployable Output). The DCL is not crossed in any reservoir group, although temporary use bans are triggered in all but the East (Hull Boreholes Group).
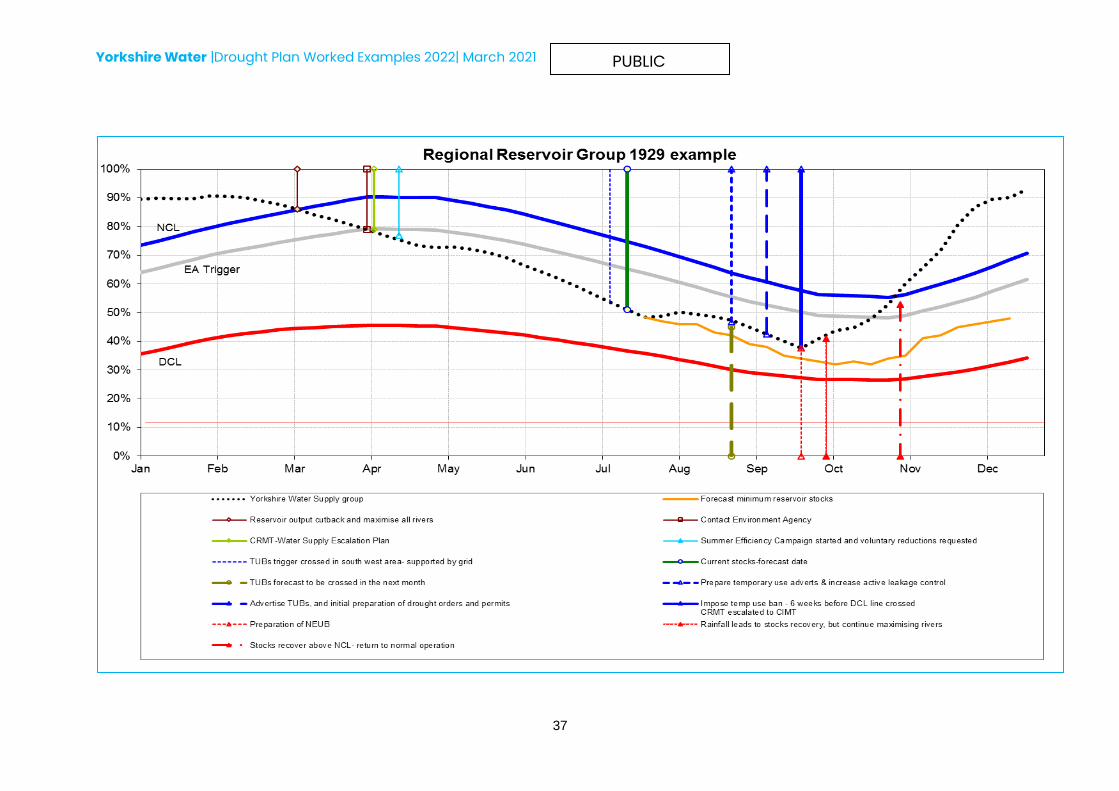
In this scenario the Environment Agency trigger for the regional reservoir group is crossed in April, and at this stage we would have started meetings with the Environment Agency and our escalated to Bronze Risk through our internal Incident Management Process as part of our water supply escalation plan. We would increase agile communications with our customers from May with enhanced messages, requesting voluntary reductions in use. Temporary use bans are triggered in one area in July and in a further three areas in September. With the July threshold crossed, and further thresholds forecast to be crossed in late September, we would begin preparation of our temporary use bans adverts in August, and advertise them in September. At the same time, we start to consult the Environment Agency and Natural England on supply side drought options, and begun preparation of our supply side drought permit applications and a drought order for a non-essential use ban. We would consider imposing temporary use bans in late September. However, when rainfall resulted in the recovery of reservoirs in October we would not proceed with our supply side drought permit applications and non-essential use bans.
The table and the second figure in Annex 1.2 show a timeline of triggers and actions (plotted in relation to regional reservoir stocks), and also indicate the likelihood of this event using different return period analysis techniques.
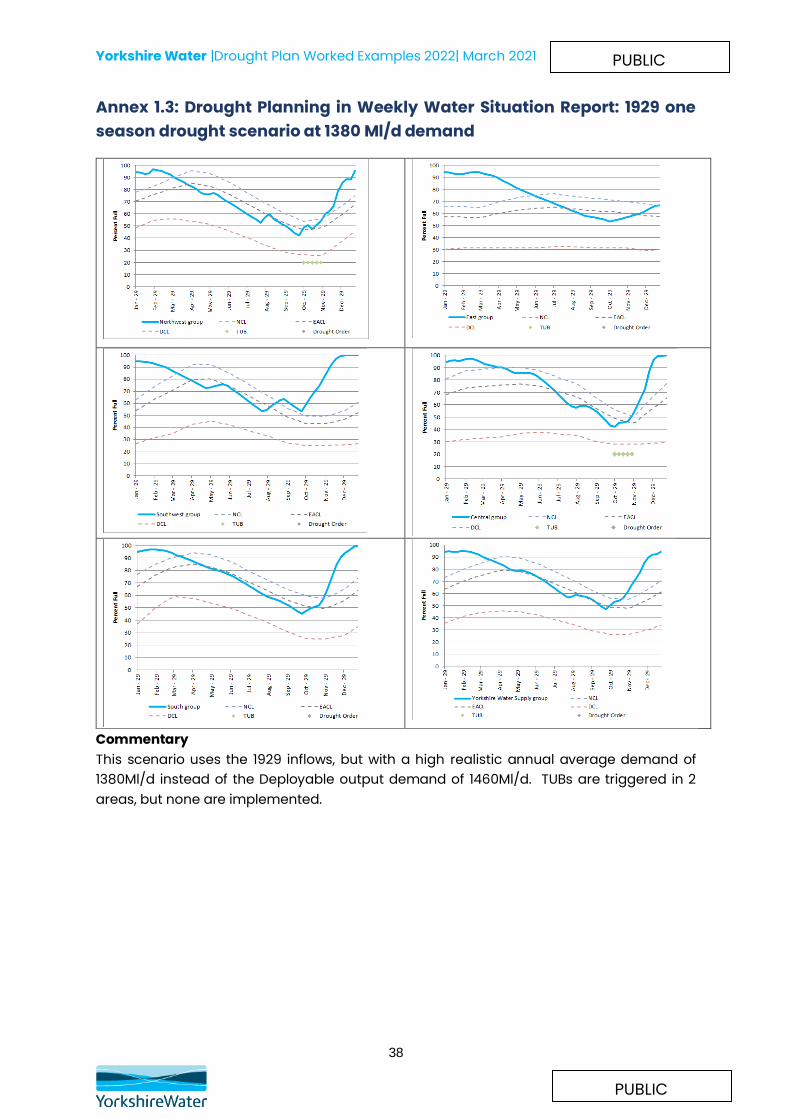
When the same scenario is run at a more realistic, but high, average annual demand of 1380Ml/d, temporary use bans are triggered in the North West and Central areas (Annex 1.3). When run at an average annual demand of 1300Ml/d, no temporary use bans are triggered.
We have carried out analyses on the minimum modelled reservoir stocks and on rainfall amounts for this event. Tabony Tables can be used to estimate the return period of rainfall events (Tabony, 1977), and indicate the regional rainfall (80 per cent of long-term average from February to September), has a return period of about 1 in 100 years. Extreme value analyses of the minimum modelled reservoir stocks from our WRAPsim
Yorkshire Water |Drought Plan Worked Examples 2022| March 2021
16
PUBLIC
PUBLIC
model indicate that the minimum modelled reservoir stocks of 38 per cent have a return period of between 50 and 100 years.
The 1929 flow deficit is shown in Figure 2.4 on our Drought Response Surface (DRS) in the main drought plan document. On this plot we can see that 1929 is our most severe six month drought ending in August, but it does not fall into the shaded area of the response surface where the DCL of our regional reservoir group is crossed.
Yorkshire Water |Drought Plan Worked Examples 2022| March 2021
17
PUBLIC
PUBLIC
7 Serious two-year drought
Annex 1.4 shows the predicted reservoir storage in a serious two-year drought. This is based on the 1995-1996 drought, but run at a demand of 1460 Ml/d (deployable output) rather than the lower demand scenario shown in Annex 1.1. In this scenario, temporary use bans are triggered in several areas, and stocks fall below the DCL in some areas, triggering drought orders.
When the Environment Agency trigger line is crossed in July of year 1 we would have started meeting the Environment Agency and convened our water supply escalation at Bronze Risk in our company Incident Management Plan. We would also have requested voluntary reductions in demand, and escalated our summer efficiency campaign, as part of our Agile Communications Strategy.
Our modelling shows temporary use bans are triggered in September in the central and south west reservoir groups, and in late October in our south reservoir group. However, we would be unlikely to implement temporary use bans at this time as they would have little effect due to the time of year. One of the main reductions in water use due to temporary use bans is garden watering, which is minimal even during a dry winter as it is outside the growing season. Instead we would carefully monitor the situation, and actively promote demand reduction and efficiency measures, and maximise leakage reduction.
In line with our normal operating policy, with reservoirs below the NCL we would maximise river abstractions and minimise use of reservoirs wherever possible. In this situation we would operate to rebalance reservoir stocks as far as possible and minimise the use of reservoirs in the south and south west. In this situation we would consider applying for winter drought permits to increase annual abstraction limits on rivers if we were likely to exceed our annual limits if abstractions were maximised according to daily limits and relevant river flow thresholds. We may also have applied for winter permits to reduce compensation flows in areas where we were concerned about reservoir recovery and where we thought this would provide a benefit. Prior to applying for these permits we would have prepared environmental reports and liaised with Natural England and the Environment Agency.

Yorkshire Water |Drought Plan Worked Examples 2022| March 2021
18
PUBLIC
PUBLIC
If no winter permits had been applied for, over the winter period, if minimal winter refill had occurred, we would prepare our advertisements for temporary use bans and our applications for compensation reductions drought permits, including the preparation of environmental reports and liaison with Natural England and Environment Agency. Temporary use bans would be advertised in March of year 2, and implemented by April, coinciding with the start of the growing season. With the slight recovery of reservoir stocks over the winter period, we would have continued to monitor the situation, and applied for a drought order for a non-essential use ban and supply side drought permits or orders in May of year 2, with a view to implementing them by the start of July. During this time, we would have been continuously reassessing the situation and would have been performing scenario modelling, and with a repeat of 1929 inflows from March 1996, regional reservoir stocks would have been forecast to fall below the DCL at the start of July 1996.
During the summer of year 2 when we were applying for supply side drought permits and a drought order for a non-essential use ban we would also be carrying out environmental assessments required for our long-term drought options, and assessing which options would be the most beneficial with respect to our current water resources position, as well as which were best in terms of the environment.
In this scenario non-essential use ban drought orders and supply side drought orders or permits are implemented even though regional reservoir stocks do not fall below the drought control line. Our modelling forecasts that stocks will fall below the DCL if we have a repeat of some of the worst years on record, and we implement the drought options in order to preserve reservoir stocks as much as possible in preparation for a second dry winter.
This scenario is based on our 1995/96 inflows, and its position on the DRS is shown as being on the border of having stocks below the DCL for the 18 month duration ending in August. In reality, the 1995/96 drought continued until October. It should also be noted that the DRS is for only the regional reservoir group, whereas the drought actions we have described relate to both regional and area groups. We manage our resources to balance stocks across the region as much as possible, so believe the regional DRS does offer an accurate reflection of our drought risk.
Yorkshire Water |Drought Plan Worked Examples 2022| March 2021
19
PUBLIC
PUBLIC
The same scenario is shown in Annex 1.5, but run at an annual average demand of 1380Ml/d. In this scenario, temporary use bans are triggered in the summer of the second year in the South Area. The DCL is crossed in the winter of the first year in the South West Area, but no temporary use bans are triggered as this trigger would have been hit during the October to March period, when we do not implement temporary use bans. Had we had a repeat of the 1995-1996 inflows, we would have preserved stocks in the south west by reducing the use of these reservoirs and using alternative supplies, and would not have implemented temporary use bans, but would have increased our water efficiency and leakage activity.

Yorkshire Water |Drought Plan Worked Examples 2022| March 2021
20
PUBLIC
PUBLIC
8 Serious two-year drought with outage of a major Water Treatment Works This is a repeat of the previous example, with an annual average demand of 1380Ml/d, but assuming a 1 month long outage of one of our River Derwent Water treatment works in July of the first year. In this example, thte unexpected outage of a WTWs for a month puts added pressure on the other supply sources, but since the outage is only for 1 month, it doesn’t change the situation greatly. Temporary use bans are triggered in the summer of the second year in the south area only. Reservoirs are drawn down at a faster rate compared to the example without a major outage, and, this brings the date of the drought permit triggered in the south west group forward by a week.
The plots in annex 1.6 show the reservoir stocks for both the serious 2 year drought (as in annex 1.5), and for this same example, but with the outage event. Is can be seen that stocks in the east, south west and south reservoir groups are drawdown further than previously, although there is very little difference in regional stocks, as most of the shortfall is made up for by increased use of the Hull boreholes (east group).
Had we had a repeat of the 1995-1996 inflows, we would have preserved stocks in the south west by reducing the use of these reservoirs and using alternative supplies, and would not have implemented temporary use bans as they were triggered in only one area, but would have increased our water efficiency and leakage activity.
Yorkshire Water |Drought Plan Worked Examples 2022| March 2021
21
PUBLIC
PUBLIC
9 Extreme three-year drought
We commissioned a report1 which estimated the return period of a two-year drought to be 40-70 years in the south of the region. The return period is greater in the north (i.e. the event is rarer). This same report estimated that return periods for a three-year drought are greater than 400 years. However, the frequency of such long duration droughts may increase to as little as 1 in 100 years under extreme (10th per centile) climate change scenarios. This report analysed historical climate data (rainfall and temperature) and assessed the impact of future climate projections.
In the unlikely event that a drought was to extend into a third consecutive year, storage in each of the reservoir groups could be severely depleted, falling below and remaining below the DCL for several months (as demonstrated in Annex 1.7). This is a scenario only; a three-year drought has never been experienced in the Yorkshire Water region since reliable records began, and there is a very low probability of such an event occurring.
Annex 1.7 shows the predicted reservoir storage during an extreme three-year drought. This is based on the January 1995 to August 1996 inflows, followed by September 1995 to December 1996 inflows. This again represents a more extreme position than has been experienced in Yorkshire in our period of record.
In this example, we would have escalated to Bronze Risk in our company Incident Management Plan in July of year 1 when regional reservoir stocks crossed the Environment Agency trigger, at the same time as starting liaison with the Environment Agency. In July we would also have escalated our summer water saving campaign, and requested voluntary reductions. Over the summer we would have continually reviewed the situation, and we would have prepared our temporary use bans advertisements, although as in the 2 year drought in Annex 1.5, we would be unlikely to have implemented temporary use bans when they were first triggered in September and October of the first year of the drought.
The drought control line was touched in the winter of year 1 in the South and South West reservoir groups, but in the period when we would not usually
1 Duration Modelling - impact of multi - year drought events on resources and assets, WRC 2012

Yorkshire Water |Drought Plan Worked Examples 2022| March 2021
22
PUBLIC
PUBLIC
implement temporary use bans. During the winter we would have prepared our adverts for temporary use bans, and our applications for drought permits and orders to reduce compensation flows. In the spring of year 2, with some recovery, but with reservoir stocks still well below normal, we would have advertised and implemented temporary use bans. In the summer of year 2 we would apply for non-essential use bans and for ordinary supply-side drought permits to reduce compensation flows, and to increase river abstractions in low flow bands.
During the summer of year 2 when we were applying for ordinary supply-side drought permits and non-essential use bans we would also be carrying out environmental assessments required for our long-term drought options, and assessing which options would be the most beneficial with respect to our current water resources position, as well as which were best in terms of the environment. With the drought ongoing, we would decide which long term options to implement depending on resource and environmental investigations, and commence the process of construction of long-term drought options (transfer from Northumbrian Water, River Ouse abstraction increase, River Aire abstraction). Depending on the time taken to construct the long term option, the additional resource would be available sometime during year 3. The figure shows modelled reservoir stocks for the “ordinary” drought options of reduced compensation releases and decreased hands off flows (HOFs). In addition, this scenario includes options that would only be implemented during an extreme long-term drought, including use of the River Aire abstraction (up to 40Ml/d), and an additional abstraction of 40Ml/d from the River Ouse (this could either be the Northumbrian Water transfer or the Ouse Raw Water Transfer). We would keep a decision to implement one of these options under continuous review. In this scenario, during the second year of the drought we would have decided to progress with the option, with the it becoming operational sometime during the third year.
There is some uncertainty as to when these long-term options could be implemented. Therefore, we have shown the effect of these options if implemented in January, April and July in the third year. This shows that a long-term option would aid recovery of reservoir stocks in the third year of an extreme drought; the earlier the option was available, the faster that recovery would be. This allows us to be certain that even if there were delays
Yorkshire Water |Drought Plan Worked Examples 2022| March 2021
23
PUBLIC
PUBLIC
in construction of the long-term drought options, they would still improve our position with respect to reservoir stocks.
Yorkshire Water |Drought Plan Worked Examples 2022| March 2021
24
PUBLIC
PUBLIC
10 June 2018-March 2019 drought
In 2018 we experienced exceptionally high demand and low rainfall, which led to our worst drought since 1995/96. During dry weather we aim to maximise use of river sources to conserve reservoir stocks for longer. We use our regional reservoir stocks graph to monitor the resource position and when pre-determined control lines are crossed it triggers drought actions. In the most recent dry years (2003, 2006 and 2011) prior to 2018 we crossed our Normal Control Line and Environment Agency Early Warning Control Line but did not experience the same high demands as in 2018.
We applied for and were granted two drought permits in 2018/19 which were not options in our previous Drought Plan. These permit applications were identified in 2018 following the unprecedented high demands that required reservoir and river supplies to be used simultaneously for a substantial period. We identified them as being the best option to allow us to increase river abstractions and preserve reservoir stocks if dry conditions continued over the winter and we experienced exceptionally high winter demand, similar to 2018 winter demand.
At times during 2018, we had to maximise use of rivers and reservoirs simultaneously and during periods of low river flow we had to rely on reservoir supplies. We balance the drawdown of reservoirs across the region through use of our grid system. This makes our supply system more resilient to supply risks but following exceptional weather conditions during 2018, stocks in the reservoirs across our region were lower than average and we’d used more of our river abstraction allowance than we had in previous dry years. This led to the crossing of reservoir control lines, which triggered a number of our drought actions. Figure 8.1 shows the 2018 reservoir stocks with key actions highlighted compared to the 1995 reservoir stocks.
In May 2018 our reservoirs stocks crossed our Normal Control Line, which triggers a change to operations to conserve reservoir supplies. At this stage we were implementing our summer campaign for water saving. In June 2018 we started to model the potential for reservoir stocks to cross further control lines, which would trigger further drought actions. Reservoir stocks crossed the Environment Agency Early Warning Control Line on 6 July 2018. We continued to operate to maximise river sources where possible and

Yorkshire Water |Drought Plan Worked Examples 2022| March 2021
25
PUBLIC
PUBLIC
enhanced our messages for encouraging customers to reduce their use voluntarily.
The demand experienced in June and July 2018 was unprecedented in our region and led to significant use of both reservoir and river resources simultaneously. Throughout the summer we continually modelled and monitored our water resources situation, including estimates of the likely dates that temporary use ban and drought permit triggers could have been crossed. Early in the summer, our forecasts indicated that in the worst-case scenario our temporary use ban trigger could have been reached during August and September in some areas. In reaction to this we enhanced our customer communications using more media channels to request water conservation. This included information for water retailers to ensure they were informed in case of any queries they may receive from their non-household customers. As the summer progressed, small amounts of rainfall meant we did not reach triggers linked to temporary use bans. In line with our Drought Plan temporary use bans would only be implemented in the
0%
20%
40%
60%
80%
100%
Jan Feb Mar Apr May Jun Jul Aug Sep Oct Nov Dec
Normal Control Line
EA trigger line
Drought Control Line
2018 stocks
1995 stocks
21st May 2018 NCL. Reduced use of reservoir supplies.
6th July 2018 crossed EACL. Implemented
drought communications plan.
At start of July modelling showed a risk of
reservoir stocks reaching the 10 weeks from
crossing our drought control line on 6th
August 2018.
Applied for
drought
permits
Figure 10.1 Regional reservoir stocks in 2018
Yorkshire Water |Drought Plan Worked Examples 2022| March 2021
26
PUBLIC
PUBLIC
summer months (in the current Drought Plan this is April-September inclusive).
In August 2018 we started preliminary work for permit applications, including onset of drought walkovers to gather information for environmental assessments. Our modelling indicated that in the majority of scenarios neither temporary use bans nor permits would be needed. However, in any drought, we plan for the worst-case scenario.
During August demand reduced closer to normal levels but rainfall was still below normal, and whilst we received average rainfall in September (largely due to a single storm event towards the end of the month), rainfall in October and the start of November was below average. Reservoirs stocks continued to decline through most of the autumn, at a time when we would usually see recovery.
At the beginning of November 2018 reservoir stocks were still below the Environment Agency Control Line and our water resource modelling (19 November 2018) indicated that, if we had a repeat of 1995/96 inflows over the winter and we experienced high winter demands, we could cross drought permit triggers (our Drought Control Line) in three of our five operating areas by January 2019. At this time our scenario modelling of below average rainfall from December 2018 to March 2019 with a repeat of high winter demands due to freeze-thaw over the winter of 2018/19 showed a risk our reservoirs would not refill in time for summer 2019.
In reaction to this risk we took the decision to submit drought permits applications in November 2018, before crossing the trigger for applications. This was to aid winter refill of reservoirs to ensure we were in the best position possible by spring 2019 if it remained dry. By implementing the permits during winter, we would have had less environmental impact than if we implemented them in the summer if reservoir stocks did not receive sufficient refill through rainfall alone. Furthermore, by maximising our prospects for winter recovery, we would have decreased the likelihood of requiring permits in the following year during the more environmentally sensitive spring and summer periods.
Throughout the process of producing the applications, starting in August 2018, we reviewed the need for the permits and the prioritisation based on the rate of reservoir drawdown and the volume of rainfall received. This led
Yorkshire Water |Drought Plan Worked Examples 2022| March 2021
27
PUBLIC
PUBLIC
to some changes to the order for submitting the applications, for example we originally intended to submit the South West Area applications first, but this was later the lowest priority.
In November and December 2018, we applied for Drought Permits to reduce reservoir compensation releases in our South Area and to increase our annual abstraction limits for two river abstractions. We also submitted a “pre-application” for two reservoirs in our North Area and were intending to submit applications for a number of reservoirs in our North West and South West areas.
Significant rainfall in late November and early December 2018 led to a rapid increase in regional reservoir stocks from below the Environment Agency Control Line to above the normal control line. This was an unprecedented 26% increase in just three weeks. Drought permit applications for the River Wharfe and South Area had been submitted and the consultation period closed. As a result of the recovery in stocks we withdrew the South Area applications and did not submit any more reservoir permit applications.
However, we continued with the River Wharfe and River Derwent permit applications as a precautionary measure as, although our reservoirs had received significant recovery, there was a risk we would not have sufficient licenced river resource available to meet a high winter demand. However, we operated to retain enough licence capacity to meet a three-week period of high winter demand, so we would have only needed to implement the permits if an extreme cold spell had occurred. Demand during the winter of 2019 was relatively stable and we did not implement either permit. The first half of 2019 was mostly drier than normal, and with baseline river flows low due to the previous dry year, we monitored the situation carefully.
Yorkshire Water |Drought Plan Worked Examples 2022| March 2021
28
PUBLIC
PUBLIC
11 Spring 2020 dry weather and high demand (Covid-19) In spring 2020, conditions were hot and dry. February 2020 was one of the wettest months ever recorded, and March started wet, but became drier, with only 70% of the long term average rainfall overall. April had only 17% of long term average rainfall, and by mid April reservoir stocks were falling rapidly, with no significant rainfall in the weater forecasts for the coming weeks. We initiated our water resources CRMT2 in April, despite the fact that reservoir stocks had not yet crossed the EA control line. We did this because stocks were falling faster than at this time in other years, and because demands were high and unpredictable due to the Covid-19 lockdown. We also recognised that, because of the other operational pressures that we were facing at that time relating to Covid-19 – such as changes to working practices to ensure colleague safety, need for social distancing, etc. – that it was prudent to escalate early and ensure that we were proactively managing our supply position from very early on.
May 2020 had only 26% of long term average rainfall, and this, coupled with some exceptionally high demands due to hot dry weather, led to rapidly decreasing reservoir stocks. By the middle of May we crossed the EACL and were forecasting TUBs being triggered in 3 areas by the end of August if we had a repeat of the inflows from 1995-1996, and we were making preparations for applying for drought permits. We ran various modeling scenarios, and developed a new demand profile to reflect the changes in the spatial patterns in demand we were seeing due to lockdown (greater residential demands, lower business demand), and the increased volatility of demand during some of the extremely hot dry weather we experienced. We saw peaks in demand similar in magnitude to those in the summer of 2018, but whereas in the past the biggest peaks only occurred at weekends, in 2020 they could occur on any day, as people working from home or on furlough watered their gardens or filled paddling pools for childen who were not at school.
Our forecasts for the triggering of TUBs and drought permits were based on our driest years, but we also produced forecasts based on historical data for other years. During the development of a drought we use many tools to
2 It should be noted that in January 2021 we updated our company Incident Management Plan. Bronze Risk is now used in place of CRMT within our escalation procedures; CIMT is replaced with Silver; and CMT is replaced with Gold.
Yorkshire Water |Drought Plan Worked Examples 2022| March 2021
29
PUBLIC
PUBLIC
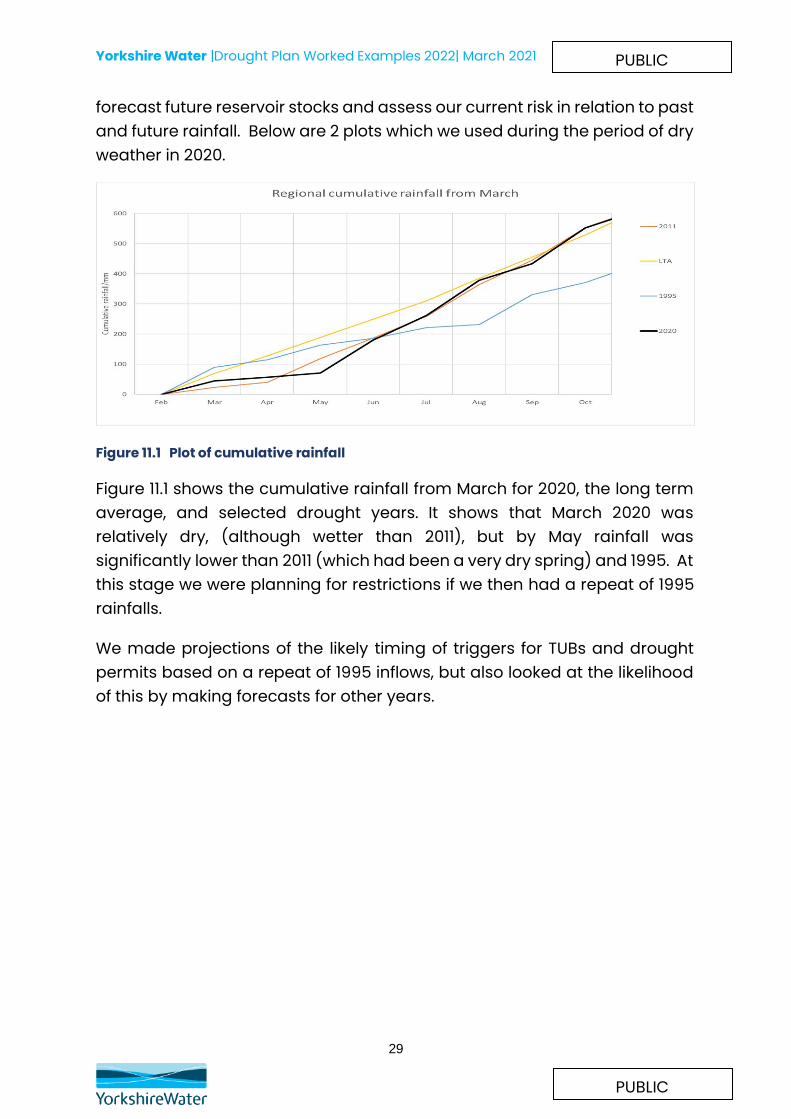
forecast future reservoir stocks and assess our current risk in relation to past and future rainfall. Below are 2 plots which we used during the period of dry weather in 2020.
Figure 11.1 Plot of cumulative rainfall
Figure 11.1 shows the cumulative rainfall from March for 2020, the long term average, and selected drought years. It shows that March 2020 was relatively dry, (although wetter than 2011), but by May rainfall was significantly lower than 2011 (which had been a very dry spring) and 1995. At this stage we were planning for restrictions if we then had a repeat of 1995 rainfalls.
We made projections of the likely timing of triggers for TUBs and drought permits based on a repeat of 1995 inflows, but also looked at the likelihood of this by making forecasts for other years.
Yorkshire Water |Drought Plan Worked Examples 2022| March 2021
30
PUBLIC
PUBLIC
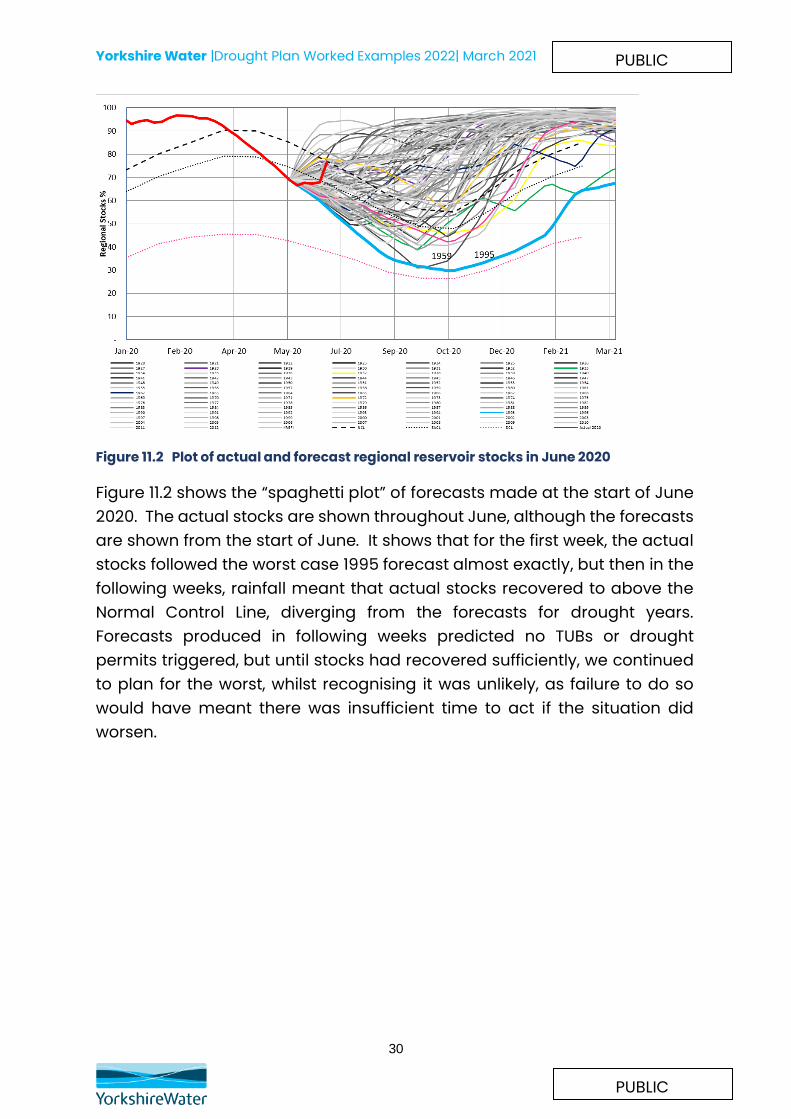
Figure 11.2 Plot of actual and forecast regional reservoir stocks in June 2020
Figure 11.2 shows the “spaghetti plot” of forecasts made at the start of June 2020. The actual stocks are shown throughout June, although the forecasts are shown from the start of June. It shows that for the first week, the actual stocks followed the worst case 1995 forecast almost exactly, but then in the following weeks, rainfall meant that actual stocks recovered to above the Normal Control Line, diverging from the forecasts for drought years. Forecasts produced in following weeks predicted no TUBs or drought permits triggered, but until stocks had recovered sufficiently, we continued to plan for the worst, whilst recognising it was unlikely, as failure to do so would have meant there was insufficient time to act if the situation did worsen.
Yorkshire Water |Drought Plan Worked Examples 2022| March 2021
31
PUBLIC
PUBLIC
1 Annex 1 Example control curves plus scenario lines
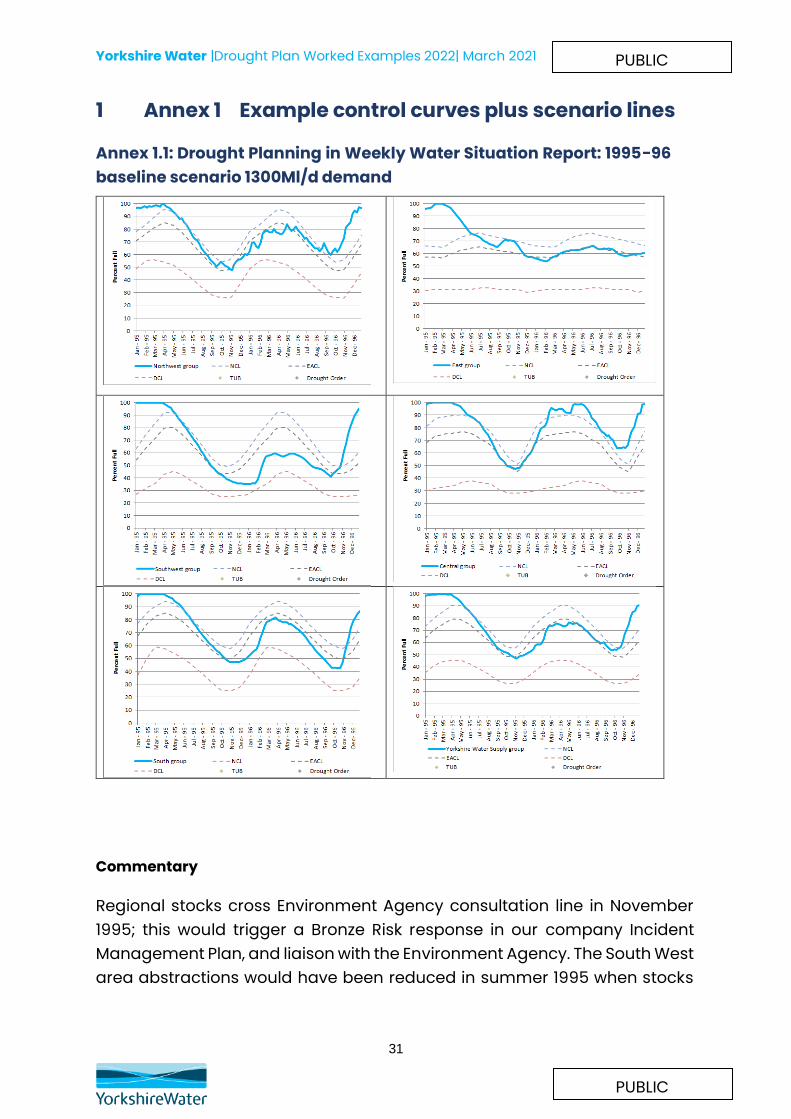
Annex 1.1: Drought Planning in Weekly Water Situation Report: 1995-96 baseline scenario 1300Ml/d demand
Commentary
Regional stocks cross Environment Agency consultation line in November 1995; this would trigger a Bronze Risk response in our company Incident Management Plan, and liaison with the Environment Agency. The South West area abstractions would have been reduced in summer 1995 when stocks
Yorkshire Water |Drought Plan Worked Examples 2022| March 2021
32
PUBLIC
PUBLIC
fell faster in that area than others, and the area would have been supported by grid transfers.
The figure above shows the predicted reservoir storage under a repeat of 1995-1996 inflows at an average annual demand of 1300Ml/d, with a dry year monthly demand profile. The simulation shows no temporary use bans as our service has improved since 1995-1996. In practice, during 1995-1996 we had drought orders throughout the region. The improved service, compared to the actual situation in 1995-1996, is due to the significant investment in leakage control and the grid network that we have made in the last 25 years. This scenario shows no temporary use bans as it is based on the entire 1995-1996 period, and the start of 1995 was relatively wet. The scenario shown in Figure 2.2, with forecasts for 1995-1996 inflows starting in May 2017 shows temporary use bans because the start of 2017, was far drier than the start of 1995.
When January 1995-December 1996 inflows is repeated at a higher annual average demand of 1380Ml/d, temporary use bans are triggered. Since 2004 annual average demands have ranged from 1210Ml/d to 1317Ml/d, with an average of 1275Ml/d, so a 1380Mld annual average demand represents a high demand scenario.
The 1995-1996 event is the only two-year drought we have in our period of record. Rainfall totals for the 20 month period from March 1995 to October 1996 are just 67 per cent of the long-term average. This equates to a return period of about 1 in 500 to 1 in 1000 years. However, because the drought was preceded by and followed by relatively wet periods, if the entire two years 1995 and 1996 are analysed, the 80 per cent rainfall in this period has a return period of only 1 in 20 years. This highlights the problems associated with the use of return period statistics in drought situations.
Scenario
Demand:1300Ml/d Inflows: Jan 1995-December 1996 Return periods of regional rainfall (based on Tabony Tables) March 1995-October 1996- 1000 year return period (67% average, 20 months) Jan 1995-dec 1996- 24 months, 82% LTA, 20 year return period
Yorkshire Water |Drought Plan Worked Examples 2022| March 2021
33
PUBLIC
PUBLIC
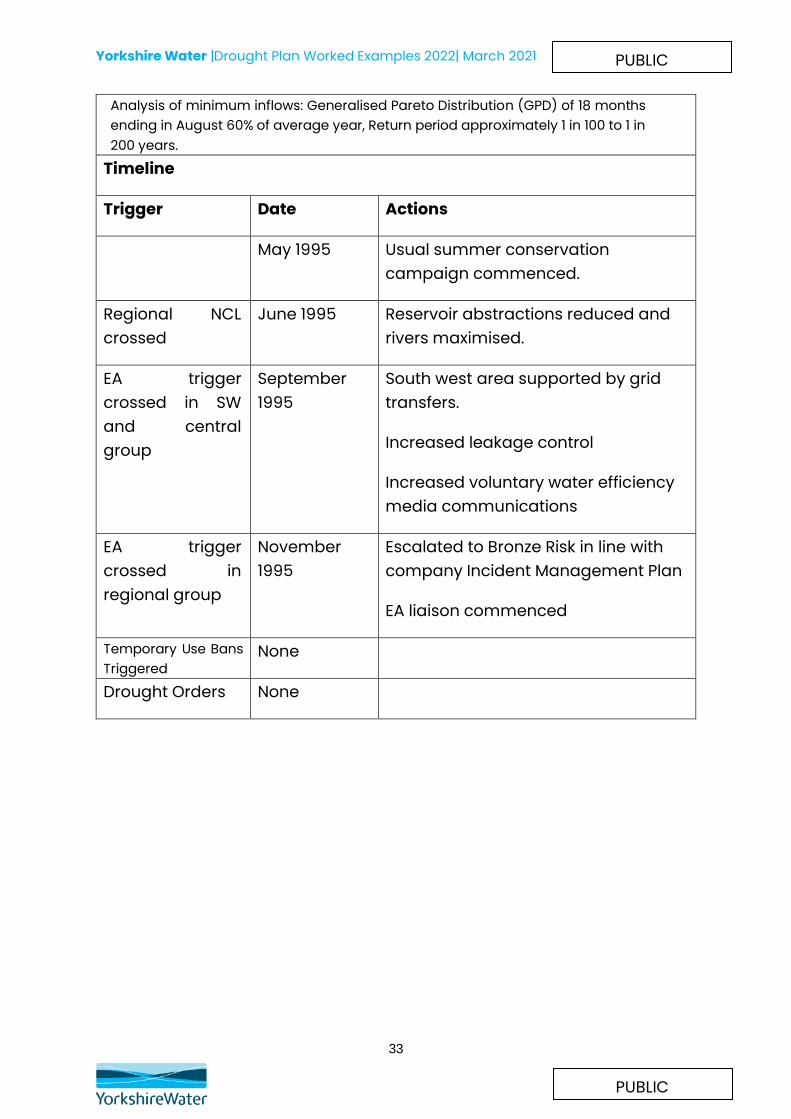
Analysis of minimum inflows: Generalised Pareto Distribution (GPD) of 18 months ending in August 60% of average year, Return period approximately 1 in 100 to 1 in 200 years.
Timeline
Trigger Date Actions
May 1995 Usual summer conservation campaign commenced.
Regional NCL crossed
June 1995 Reservoir abstractions reduced and rivers maximised.
EA trigger crossed in SW and central group
September 1995
South west area supported by grid transfers.
Increased leakage control
Increased voluntary water efficiency media communications
EA trigger crossed in regional group
November 1995
Escalated to Bronze Risk in line with company Incident Management Plan
EA liaison commenced
Temporary Use Bans Triggered
None
Drought Orders None
Yorkshire Water |Drought Plan Worked Examples 2022| March 2021
34
PUBLIC
PUBLIC
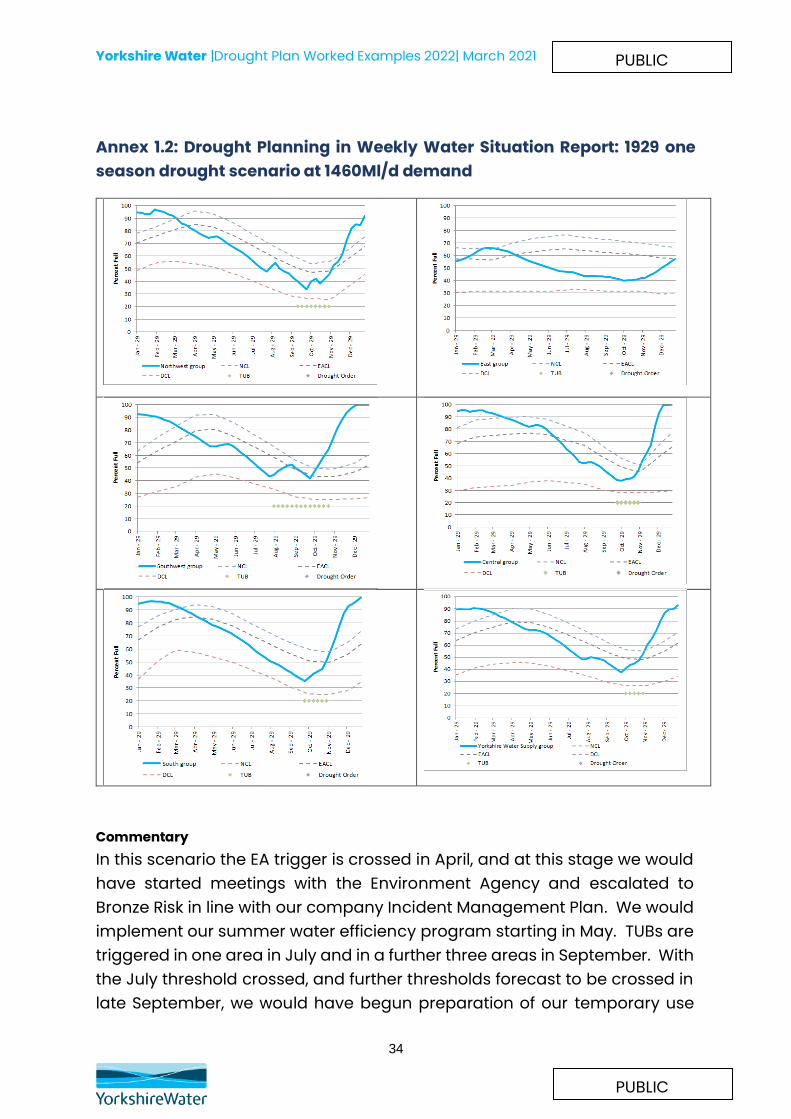
Annex 1.2: Drought Planning in Weekly Water Situation Report: 1929 one season drought scenario at 1460Ml/d demand
Commentary In this scenario the EA trigger is crossed in April, and at this stage we would have started meetings with the Environment Agency and escalated to Bronze Risk in line with our company Incident Management Plan. We would implement our summer water efficiency program starting in May. TUBs are triggered in one area in July and in a further three areas in September. With the July threshold crossed, and further thresholds forecast to be crossed in late September, we would have begun preparation of our temporary use
Yorkshire Water |Drought Plan Worked Examples 2022| March 2021
35
PUBLIC
PUBLIC
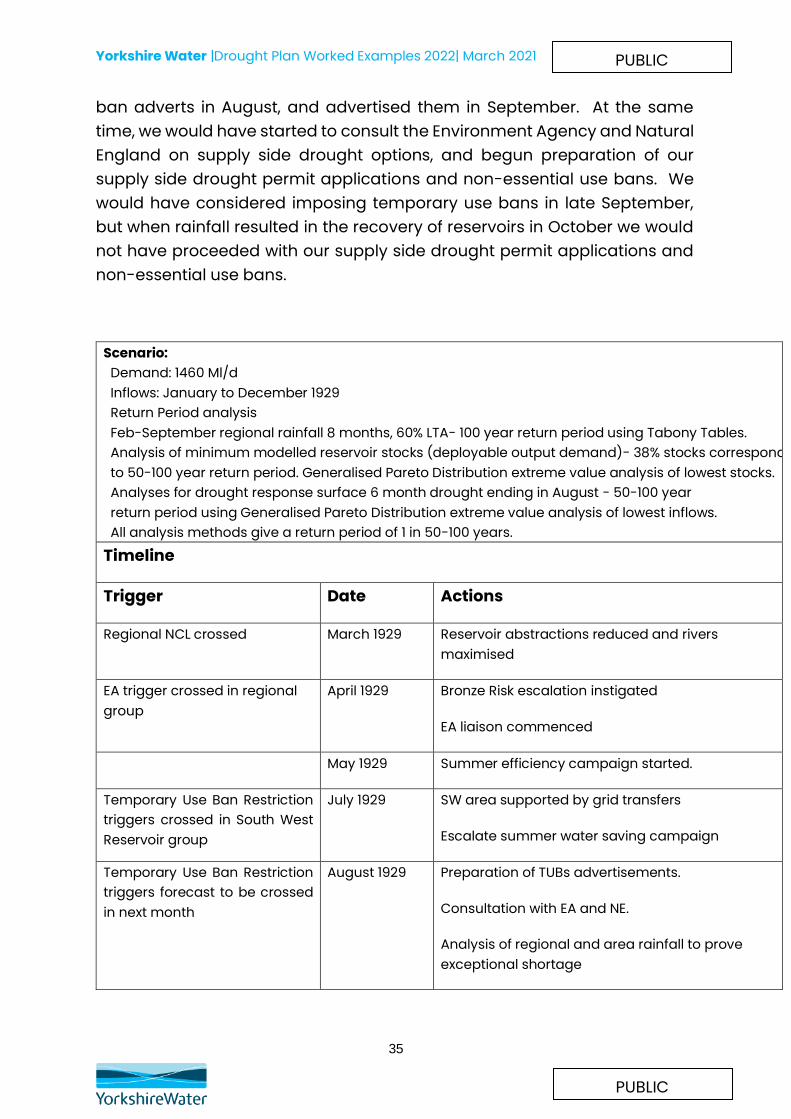
ban adverts in August, and advertised them in September. At the same time, we would have started to consult the Environment Agency and Natural England on supply side drought options, and begun preparation of our supply side drought permit applications and non-essential use bans. We would have considered imposing temporary use bans in late September, but when rainfall resulted in the recovery of reservoirs in October we would not have proceeded with our supply side drought permit applications and non-essential use bans.
Scenario: Demand: 1460 Ml/d Inflows: January to December 1929 Return Period analysis Feb-September regional rainfall 8 months, 60% LTA- 100 year return period using Tabony Tables. Analysis of minimum modelled reservoir stocks (deployable output demand)- 38% stocks correspond to 50-100 year return period. Generalised Pareto Distribution extreme value analysis of lowest stocks. Analyses for drought response surface 6 month drought ending in August - 50-100 year return period using Generalised Pareto Distribution extreme value analysis of lowest inflows. All analysis methods give a return period of 1 in 50-100 years.
Timeline
Trigger Date Actions
Regional NCL crossed March 1929 Reservoir abstractions reduced and rivers maximised
EA trigger crossed in regional group
April 1929 Bronze Risk escalation instigated
EA liaison commenced
May 1929 Summer efficiency campaign started.
Temporary Use Ban Restriction triggers crossed in South West Reservoir group
July 1929 SW area supported by grid transfers
Escalate summer water saving campaign
Temporary Use Ban Restriction triggers forecast to be crossed in next month
August 1929 Preparation of TUBs advertisements.
Consultation with EA and NE.
Analysis of regional and area rainfall to prove exceptional shortage
Yorkshire Water |Drought Plan Worked Examples 2022| March 2021
36
PUBLIC
PUBLIC
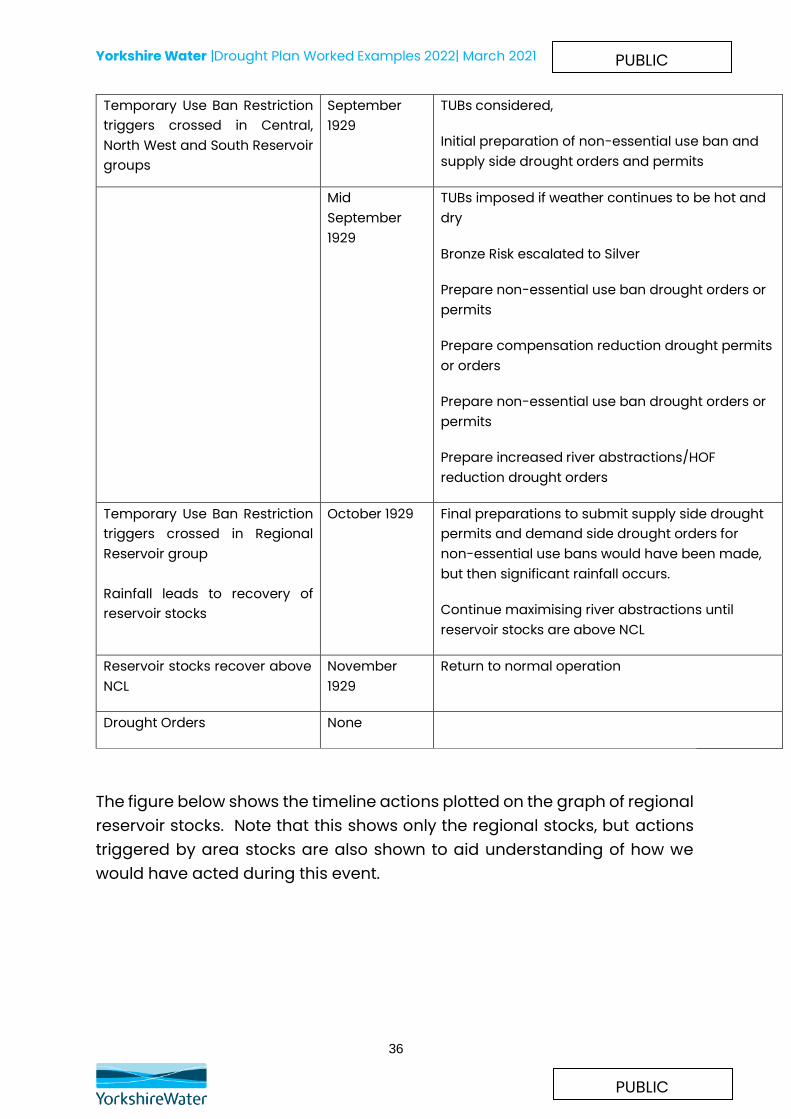
Temporary Use Ban Restriction triggers crossed in Central, North West and South Reservoir groups
September 1929
TUBs considered,
Initial preparation of non-essential use ban and supply side drought orders and permits
Mid September 1929
TUBs imposed if weather continues to be hot and dry
Bronze Risk escalated to Silver
Prepare non-essential use ban drought orders or permits
Prepare compensation reduction drought permits or orders
Prepare non-essential use ban drought orders or permits
Prepare increased river abstractions/HOF reduction drought orders
Temporary Use Ban Restriction triggers crossed in Regional Reservoir group Rainfall leads to recovery of reservoir stocks
October 1929 Final preparations to submit supply side drought permits and demand side drought orders for non-essential use bans would have been made, but then significant rainfall occurs.
Continue maximising river abstractions until reservoir stocks are above NCL
Reservoir stocks recover above NCL
November 1929
Return to normal operation
Drought Orders None
The figure below shows the timeline actions plotted on the graph of regional reservoir stocks. Note that this shows only the regional stocks, but actions triggered by area stocks are also shown to aid understanding of how we would have acted during this event.
Yorkshire Water |Drought Plan Worked Examples 2022| March 2021
37
PUBLIC
Yorkshire Water |Drought Plan Worked Examples 2022| March 2021
38
PUBLIC
PUBLIC
Annex 1.3: Drought Planning in Weekly Water Situation Report: 1929 one season drought scenario at 1380 Ml/d demand
Commentary This scenario uses the 1929 inflows, but with a high realistic annual average demand of 1380Ml/d instead of the Deployable output demand of 1460Ml/d. TUBs are triggered in 2 areas, but none are implemented.
Yorkshire Water |Drought Plan Worked Examples 2022| March 2021
39
PUBLIC
PUBLIC
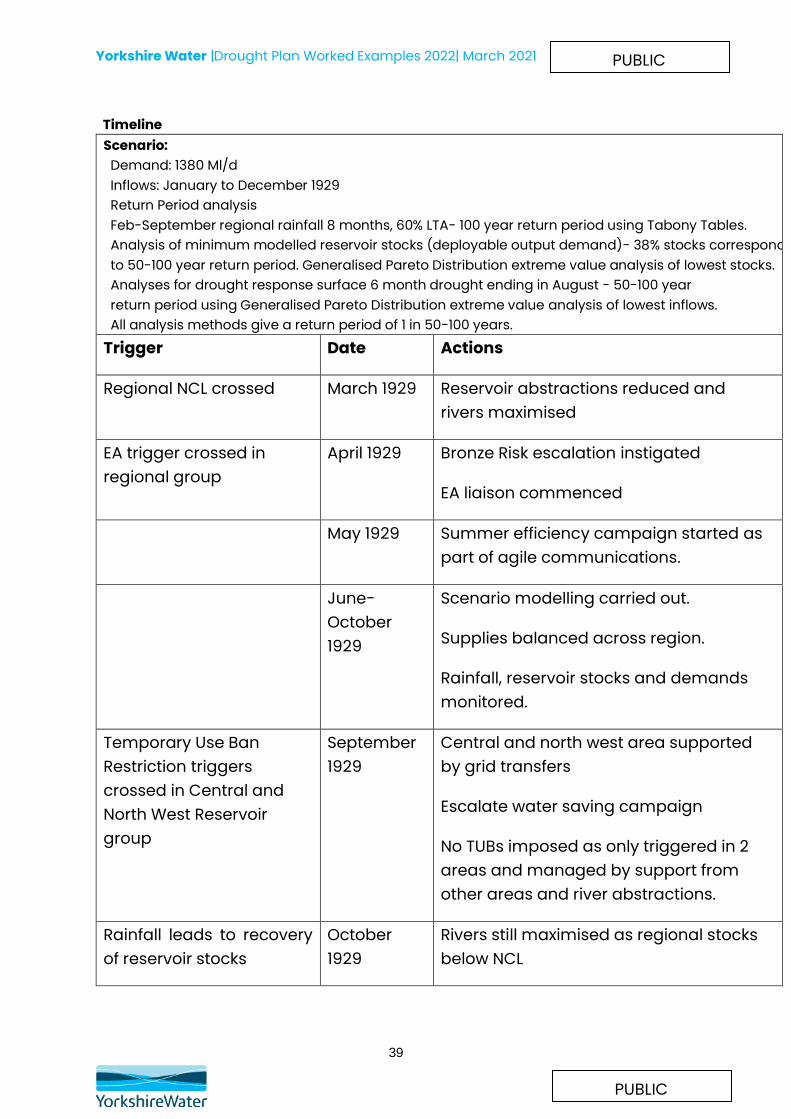
Timeline Scenario: Demand: 1380 Ml/d Inflows: January to December 1929 Return Period analysis Feb-September regional rainfall 8 months, 60% LTA- 100 year return period using Tabony Tables. Analysis of minimum modelled reservoir stocks (deployable output demand)- 38% stocks correspond to 50-100 year return period. Generalised Pareto Distribution extreme value analysis of lowest stocks. Analyses for drought response surface 6 month drought ending in August - 50-100 year return period using Generalised Pareto Distribution extreme value analysis of lowest inflows. All analysis methods give a return period of 1 in 50-100 years.
Trigger Date Actions
Regional NCL crossed March 1929 Reservoir abstractions reduced and rivers maximised
EA trigger crossed in regional group
April 1929 Bronze Risk escalation instigated
EA liaison commenced
May 1929 Summer efficiency campaign started as part of agile communications.
June-October 1929
Scenario modelling carried out.
Supplies balanced across region.
Rainfall, reservoir stocks and demands monitored.
Temporary Use Ban Restriction triggers crossed in Central and North West Reservoir group
September 1929
Central and north west area supported by grid transfers
Escalate water saving campaign
No TUBs imposed as only triggered in 2 areas and managed by support from other areas and river abstractions.
Rainfall leads to recovery of reservoir stocks
October 1929
Rivers still maximised as regional stocks below NCL
Yorkshire Water |Drought Plan Worked Examples 2022| March 2021
40
PUBLIC
PUBLIC
Reservoir stocks recover above NCL
November 1929
Return to normal operation
Drought Orders None
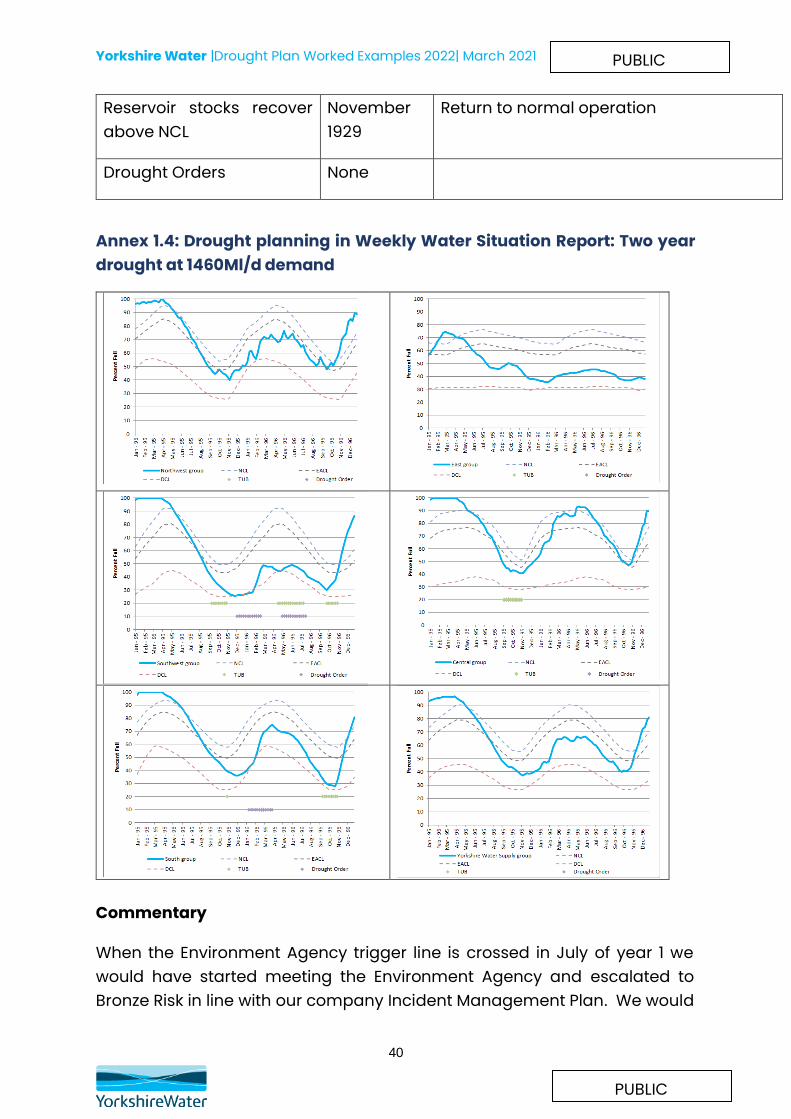
Annex 1.4: Drought planning in Weekly Water Situation Report: Two year drought at 1460Ml/d demand
Commentary
When the Environment Agency trigger line is crossed in July of year 1 we would have started meeting the Environment Agency and escalated to Bronze Risk in line with our company Incident Management Plan. We would
Yorkshire Water |Drought Plan Worked Examples 2022| March 2021
41
PUBLIC
PUBLIC
also have requested voluntary reductions in demand, and escalated our summer efficiency campaign as part of our agile communications plan.
Our modelling shows temporary use bans are triggered in September in the central and south west reservoir groups, with triggers crossed in late October (outside our TUBs season) in our south reservoir group. We would be unlikely to implement temporary use bans at this time as they would have little effect due to the time of year. One of the main reductions in water use due to temporary use bans is garden watering, which is minimal even during a dry winter as it is outside the growing season. Instead we would carefully monitor the situation, and actively promote demand reduction and efficiency measures, and maximise leakage reduction. In line with our normal operating policy, with reservoirs below the NCL we would maximise river abstractions and minimise use of reservoirs wherever possible. In this situation we would operate to rebalance reservoir stocks as far as possible, and minimise the use of reservoirs in the south and south west. We would consider applying for winter drought permits to increase annual abstraction limits on rivers if we were likely to exceed our annual limits if abstractions were maximised according to daily limits and relevant river flow thresholds. We may also have applied for winter permits to reduce compensation flows in areas where we were concerned about reservoir recovery and where we thought this would provide a benefit. Prior to applying for these permits we would have prepared environmental reports and liaised the Environment Agency and other relevant stakeholders.
If no winter permits had been applied for, over the winter period, if minimal winter refill had occurred, we would prepare our advertisements for temporary use bans and our applications for compensation reductions drought permits, including the preparation of environmental reports and liaison with Natural England and Environment Agency. Temporary use bans would be advertised in March of year 2, and implemented by April, coinciding with the start of the growing season. With the slight recovery of reservoir stocks over the winter period, we would have continued to monitor the situation, and applied for non-essential use bans and supply side drought permits or orders in May of year 2, with a view to implementing them by the start of July. During this time, we would have been continuously reassessing the situation and would have been performing scenario modelling, and with a repeat of 1929 inflows from March 1996, regional
Yorkshire Water |Drought Plan Worked Examples 2022| March 2021
42
PUBLIC
PUBLIC
reservoir stocks would have been forecast to fall below the DCL at the start of July 1996.
During the summer of year 2 when we were applying for supply-side drought permits and non-essential use bans we would also be carrying out environmental assessments required for our long-term drought options, and assessing which options would be the most beneficial with respect to our current water resources position, as well as which were best in terms of the environment.
This scenario is based on our 1995/96 inflows, and its position on the drought response surface (DRS) in Figure 2.4 of the main drought plan document is shown as being on the border of having stocks below the DCL for the 18 month duration ending in August. In reality, the 1995/96 drought continued until October. It should also be noted that the DRS is for only the regional reservoir group, whereas the drought actions we have described relate to both regional and area groups. We manage our resources to balance stocks across the region as much as possible, so believe the regional DRS does offer an accurate reflection of our drought risk.
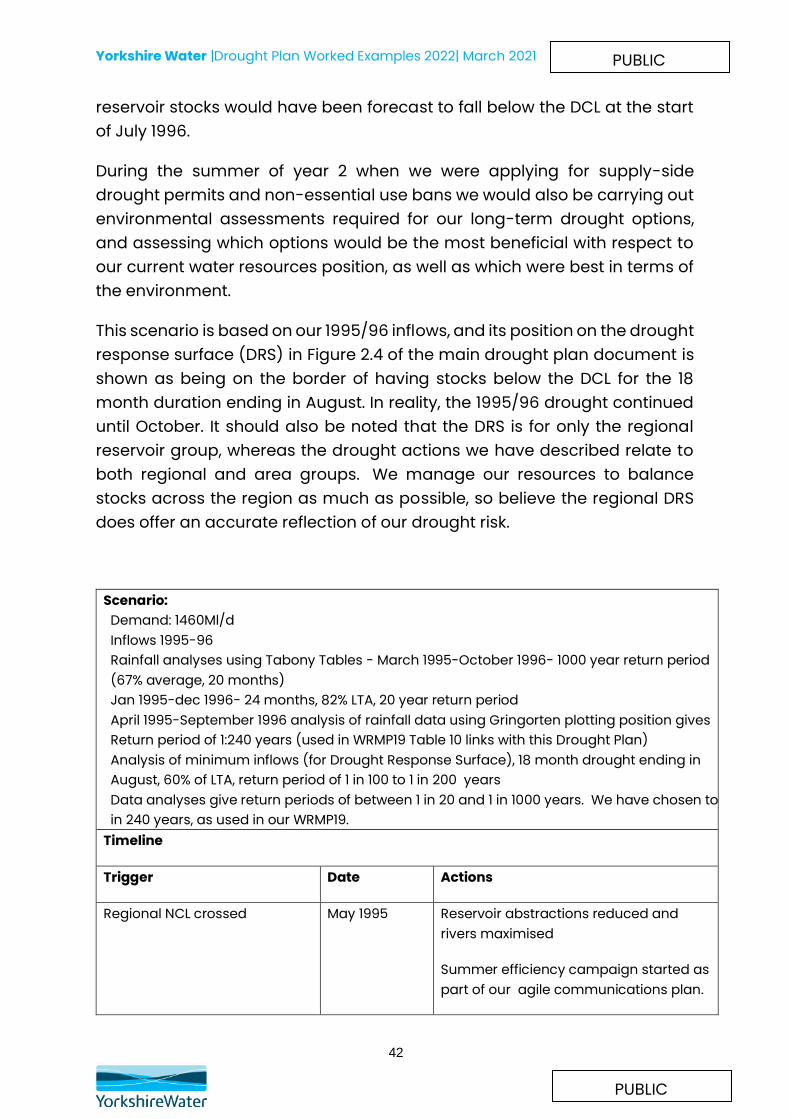
Scenario: Demand: 1460Ml/d Inflows 1995-96 Rainfall analyses using Tabony Tables - March 1995-October 1996- 1000 year return period (67% average, 20 months) Jan 1995-dec 1996- 24 months, 82% LTA, 20 year return period April 1995-September 1996 analysis of rainfall data using Gringorten plotting position gives Return period of 1:240 years (used in WRMP19 Table 10 links with this Drought Plan) Analysis of minimum inflows (for Drought Response Surface), 18 month drought ending in August, 60% of LTA, return period of 1 in 100 to 1 in 200 years Data analyses give return periods of between 1 in 20 and 1 in 1000 years. We have chosen to use 1 in 240 years, as used in our WRMP19.
Timeline
Trigger Date Actions
Regional NCL crossed May 1995 Reservoir abstractions reduced and rivers maximised
Summer efficiency campaign started as part of our agile communications plan.
Yorkshire Water |Drought Plan Worked Examples 2022| March 2021
43
PUBLIC
PUBLIC
EA trigger crossed in regional group
July 1995 Bronze Risk escalation instigated
EA liaison commenced
Analysis to determine exceptional shortage of rainfall commenced.
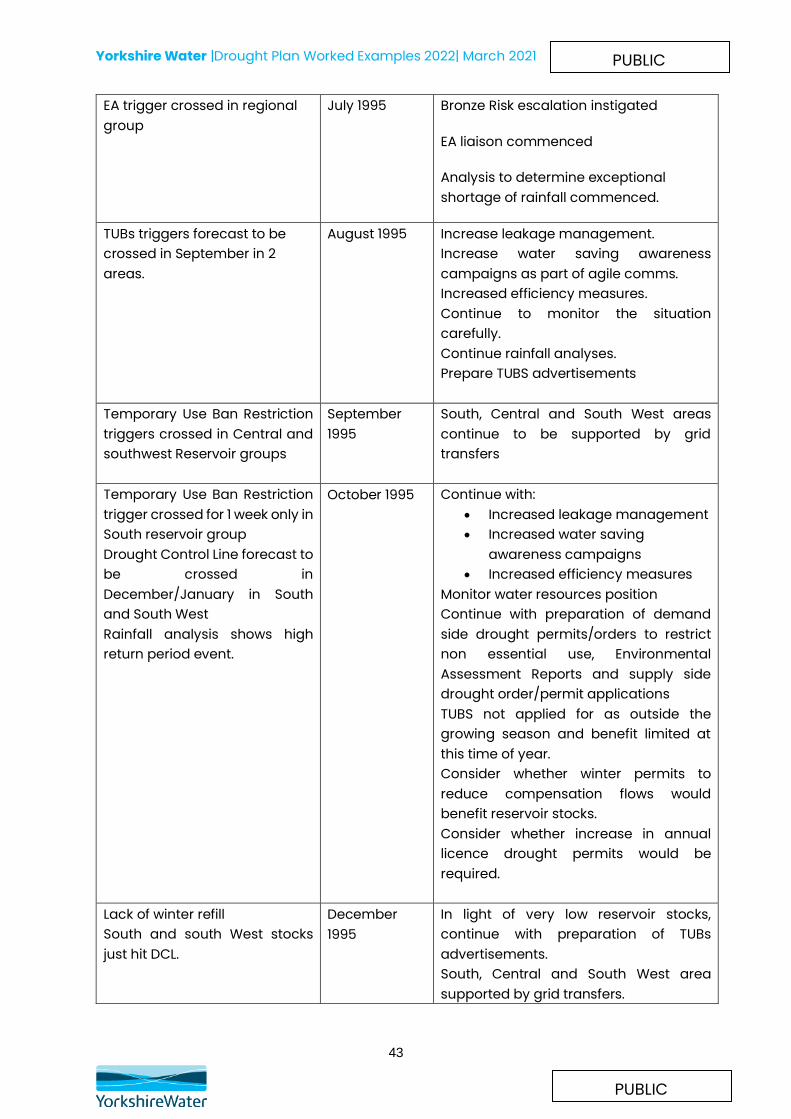
TUBs triggers forecast to be crossed in September in 2 areas.
August 1995 Increase leakage management. Increase water saving awareness campaigns as part of agile comms. Increased efficiency measures. Continue to monitor the situation carefully. Continue rainfall analyses. Prepare TUBS advertisements
Temporary Use Ban Restriction triggers crossed in Central and southwest Reservoir groups
September 1995
South, Central and South West areas continue to be supported by grid transfers
Temporary Use Ban Restriction trigger crossed for 1 week only in South reservoir group Drought Control Line forecast to be crossed in December/January in South and South West Rainfall analysis shows high return period event.
October 1995 Continue with: • Increased leakage management • Increased water saving
awareness campaigns • Increased efficiency measures
Monitor water resources position Continue with preparation of demand side drought permits/orders to restrict non essential use, Environmental Assessment Reports and supply side drought order/permit applications TUBS not applied for as outside the growing season and benefit limited at this time of year. Consider whether winter permits to reduce compensation flows would benefit reservoir stocks. Consider whether increase in annual licence drought permits would be required.
Lack of winter refill South and south West stocks just hit DCL.
December 1995
In light of very low reservoir stocks, continue with preparation of TUBs advertisements. South, Central and South West area supported by grid transfers.

Yorkshire Water |Drought Plan Worked Examples 2022| March 2021
44
PUBLIC
PUBLIC
Limited winter refill, exceptional shortage of rainfall, and scenario modelling using historic inflows predicts triggers being crossed again.
March 1996 With reservoir stocks failing to recover, advertise TUBs. Liaison with EA and NE Initial preparation of demand side drought permits/orders to restrict non-essential use, Environmental Assessment Reports and supply side drought order/permit applications Continue with preparation of demand side drought permits/orders to restrict non-essential use, Environmental Assessment Reports and supply side drought order/permit applications Rainfall and inflow analyses to demonstrate exceptional shortage of rainfall.
Scenario modelling (using 1929 inflows) indicates regional stocks falling below DCL in July
April 1996 TUBS implemented to coincide with start of growing season.
Bronze Risk escalated to Silver
Continue to:
Prepare non-essential use ban drought orders or permits
Prepare compensation reduction drought permits or orders
Prepare non-essential use ban drought orders or permits
Prepare increased river abstractions/HOF reduction drought orders
Reservoir stocks start to fall again
May 1996 Submit supply side drought permits (compensation reduction and increased abstraction/HOFs) and demand side drought orders for non-essential use bans.
Start to discuss long term drought options with EA, NE and other stakeholders.
Yorkshire Water |Drought Plan Worked Examples 2022| March 2021
45
PUBLIC
PUBLIC
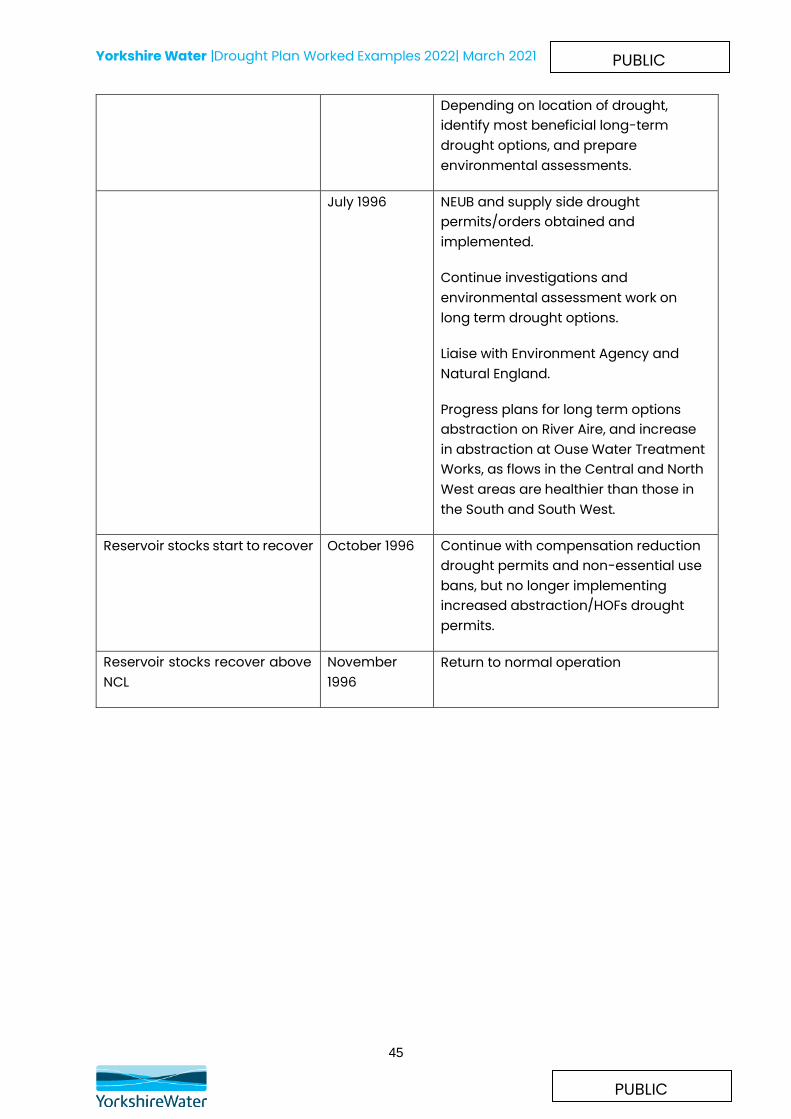
Depending on location of drought, identify most beneficial long-term drought options, and prepare environmental assessments.
July 1996 NEUB and supply side drought permits/orders obtained and implemented.
Continue investigations and environmental assessment work on long term drought options.
Liaise with Environment Agency and Natural England.
Progress plans for long term options abstraction on River Aire, and increase in abstraction at Ouse Water Treatment Works, as flows in the Central and North West areas are healthier than those in the South and South West.
Reservoir stocks start to recover October 1996 Continue with compensation reduction drought permits and non-essential use bans, but no longer implementing increased abstraction/HOFs drought permits.
Reservoir stocks recover above NCL
November 1996
Return to normal operation
Yorkshire Water |Drought Plan Worked Examples 2022| March 2021
46
PUBLIC
PUBLIC
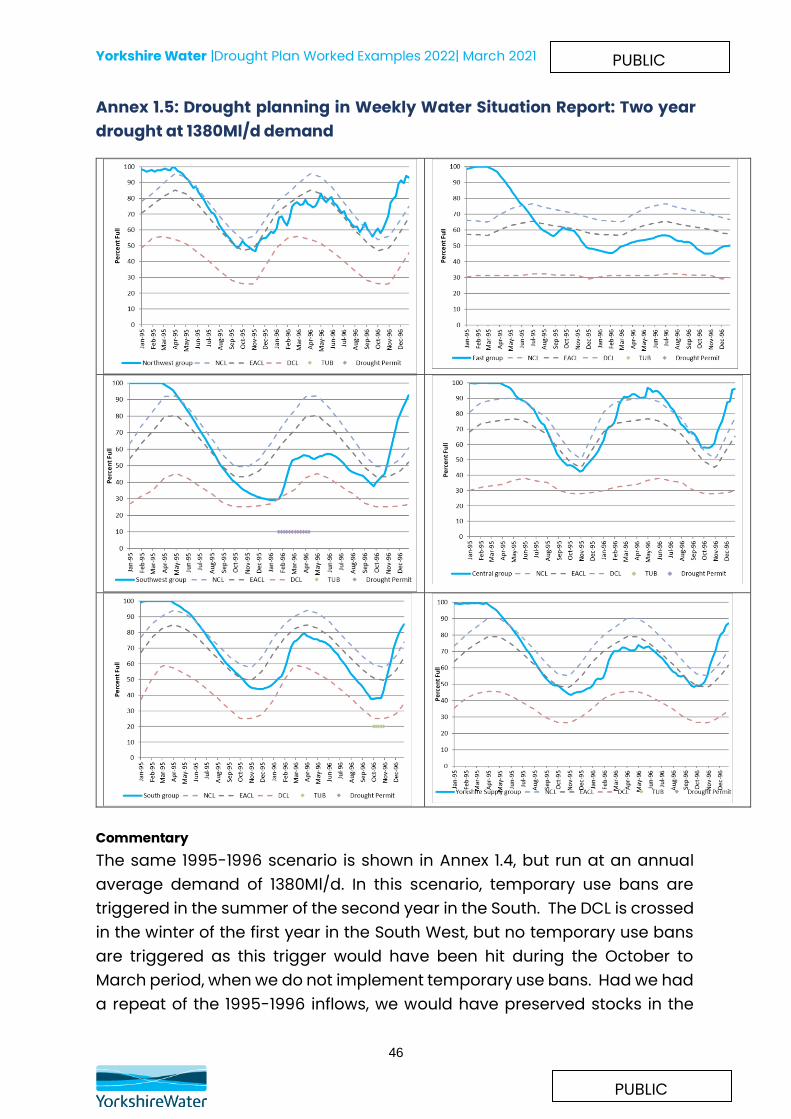
Annex 1.5: Drought planning in Weekly Water Situation Report: Two year drought at 1380Ml/d demand
Commentary The same 1995-1996 scenario is shown in Annex 1.4, but run at an annual average demand of 1380Ml/d. In this scenario, temporary use bans are triggered in the summer of the second year in the South. The DCL is crossed in the winter of the first year in the South West, but no temporary use bans are triggered as this trigger would have been hit during the October to March period, when we do not implement temporary use bans. Had we had a repeat of the 1995-1996 inflows, we would have preserved stocks in the

Yorkshire Water |Drought Plan Worked Examples 2022| March 2021
47
PUBLIC
PUBLIC
South West by reducing the use of these reservoirs and using alternative supplies, and would not have implemented TUBs, but would have increased our water efficiency and leakage activity.

Yorkshire Water |Drought Plan Worked Examples 2022| March 2021
48
PUBLIC
PUBLIC
Scenario: Demand 1380Ml/d Inflows 1995-96 inflows Rainfall analyses using Tabony Tables - March 1995-October 1996- 1000 year return period (67% average, 20 months) Jan 1995-dec 1996- 24 months, 82% LTA, 20 year return period April 1995-September 1996 analysis of rainfall data using Gringorten plotting position gives Return period of 1:240 years (used in WRMP19 Table 10 links with this Drought Plan) Analysis of minimum inflows (for Drought Response Surface), 18 month drought ending in August, 60% of LTA, return period of 1 in 100 to 1 in 200 years Data analyses give return periods of between 1 in 20 and 1 in 1000 years. We have chosen to use 1 in 240 years, as used in our WRMP19.
Timeline Regional NCL crossed May 1995 Reservoir abstractions reduced and
rivers maximised
Summer efficiency campaign started.
EA trigger crossed in regional group
July 1995 Bronze Risk escalation instigated
EA liaison commenced
South West Group stocks falling rapidly Lack of winter refill
December 1995
South West area supported by grid transfers Increase leakage management Increase water saving awareness campaigns Increased efficiency measures
South West group stocks fall below DCL
January 1996 Maximise support by grid transfers Increased leakage activity and demand management.
Continued lack of winter refill, exceptional shortage of rainfall, and scenario modelling using historic inflows predicts TUBs in April.
March 1996 Continue increased level of water saving campaigns.
April 1996-July Situation continuously monitored, analysing reservoir stocks and rainfall.
Preparations made for advertising TUBs.

Yorkshire Water |Drought Plan Worked Examples 2022| March 2021
49
PUBLIC
PUBLIC
TUBs triggered in South reservoir group
September 1996
No TUBs imposed taken as triggered in only one area.
Continue balancing stocks across the region,
Reservoir stocks start to recover October 1996
Reservoir stocks recover above NCL
November 1996
Return to normal operation
Annex 1.6: Drought planning in Weekly Water Situation Report: Two year drought at 1380Ml/d demand, with outage
Yorkshire Water |Drought Plan Worked Examples 2022| March 2021
50
PUBLIC
PUBLIC
Commentary The same 1995-1996 scenario is shown in Annex 1.6, but with a 1 month outage of a River Derwent WTW in July 1995. In this scenario, temporary use bans are triggered in the summer of the second year in the South. The DCL is crossed in the winter of the first year in the South West (1 week earlier than in the example with no outage), but no temporary use bans are triggered as this trigger would have been hit during the October to March period, when we do not implement temporary use bans. Had we had a repeat of the 1995-1996 inflows, we would have preserved stocks in the South West by reducing the use of these reservoirs and using alternative supplies, and would not have implemented TUBs, but would have increased our water efficiency and leakage activity.
The graphs show reservoir stocks with the outage (purple) as well as the plots for the previous example with no outage. With the outage at the River Derwent WTWs, one of the major grid treatment works able to provide water throughout the region, reservoirs are used more during the outage period, and stocks in the south, south west and east groups are drawn down more because of this. Regional stocks are also slightly lower until the winter of 1995/96.
Yorkshire Water |Drought Plan Worked Examples 2022| March 2021
51
PUBLIC
PUBLIC
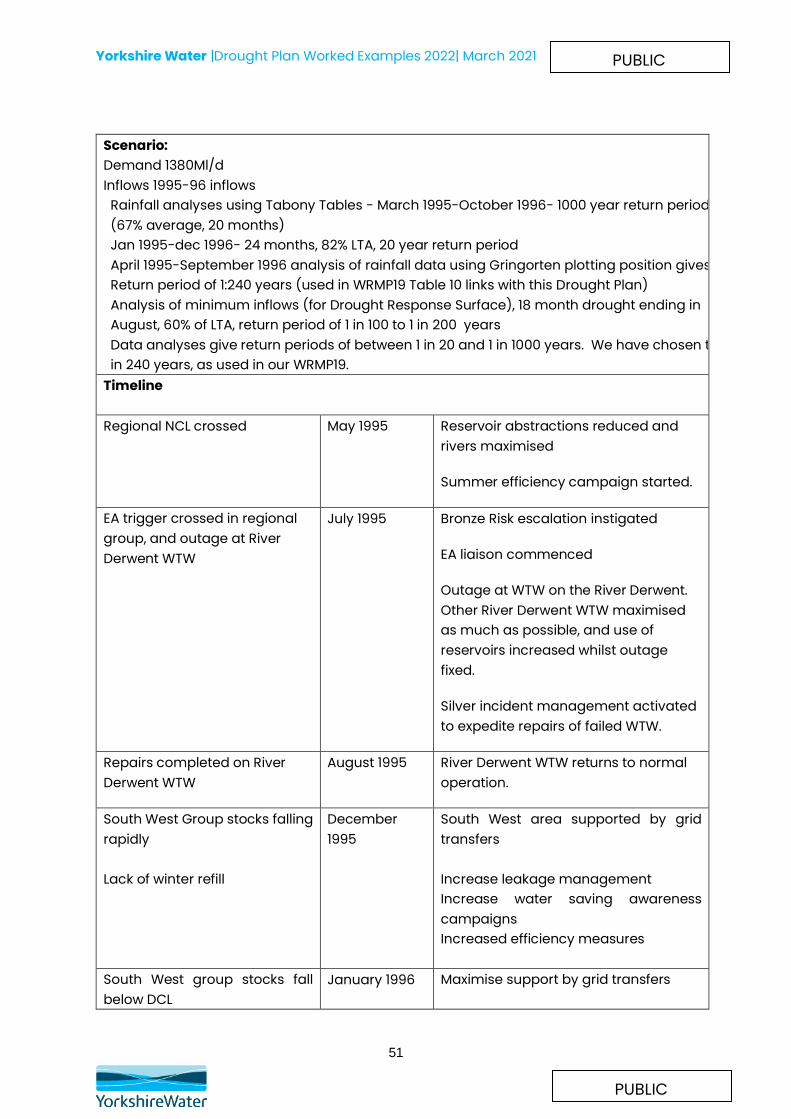
Scenario: Demand 1380Ml/d Inflows 1995-96 inflows Rainfall analyses using Tabony Tables - March 1995-October 1996- 1000 year return period (67% average, 20 months) Jan 1995-dec 1996- 24 months, 82% LTA, 20 year return period April 1995-September 1996 analysis of rainfall data using Gringorten plotting position gives Return period of 1:240 years (used in WRMP19 Table 10 links with this Drought Plan) Analysis of minimum inflows (for Drought Response Surface), 18 month drought ending in August, 60% of LTA, return period of 1 in 100 to 1 in 200 years Data analyses give return periods of between 1 in 20 and 1 in 1000 years. We have chosen to use 1 in 240 years, as used in our WRMP19.
Timeline Regional NCL crossed May 1995 Reservoir abstractions reduced and
rivers maximised
Summer efficiency campaign started.
EA trigger crossed in regional group, and outage at River Derwent WTW
July 1995 Bronze Risk escalation instigated
EA liaison commenced
Outage at WTW on the River Derwent. Other River Derwent WTW maximised as much as possible, and use of reservoirs increased whilst outage fixed.
Silver incident management activated to expedite repairs of failed WTW.
Repairs completed on River Derwent WTW
August 1995 River Derwent WTW returns to normal operation.
South West Group stocks falling rapidly Lack of winter refill
December 1995
South West area supported by grid transfers Increase leakage management Increase water saving awareness campaigns Increased efficiency measures
South West group stocks fall below DCL
January 1996 Maximise support by grid transfers
Yorkshire Water |Drought Plan Worked Examples 2022| March 2021
52
PUBLIC
PUBLIC
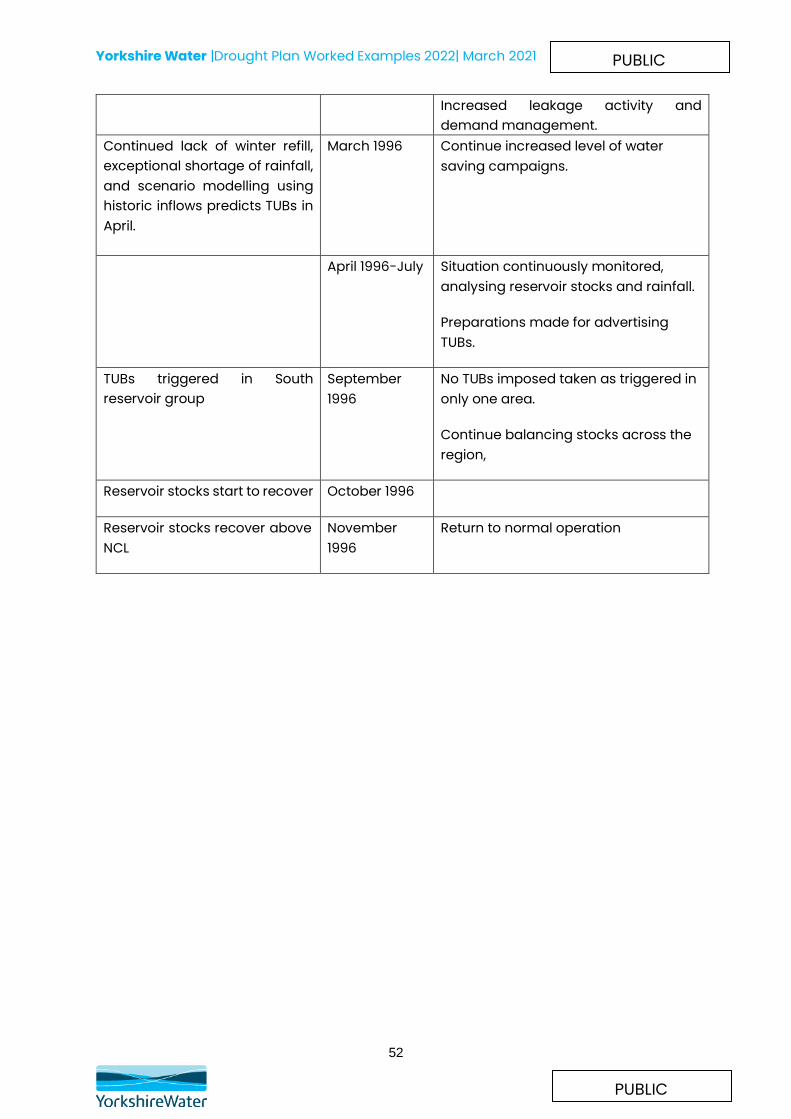
Increased leakage activity and demand management.
Continued lack of winter refill, exceptional shortage of rainfall, and scenario modelling using historic inflows predicts TUBs in April.
March 1996 Continue increased level of water saving campaigns.
April 1996-July Situation continuously monitored, analysing reservoir stocks and rainfall.
Preparations made for advertising TUBs.
TUBs triggered in South reservoir group
September 1996
No TUBs imposed taken as triggered in only one area.
Continue balancing stocks across the region,
Reservoir stocks start to recover October 1996
Reservoir stocks recover above NCL
November 1996
Return to normal operation
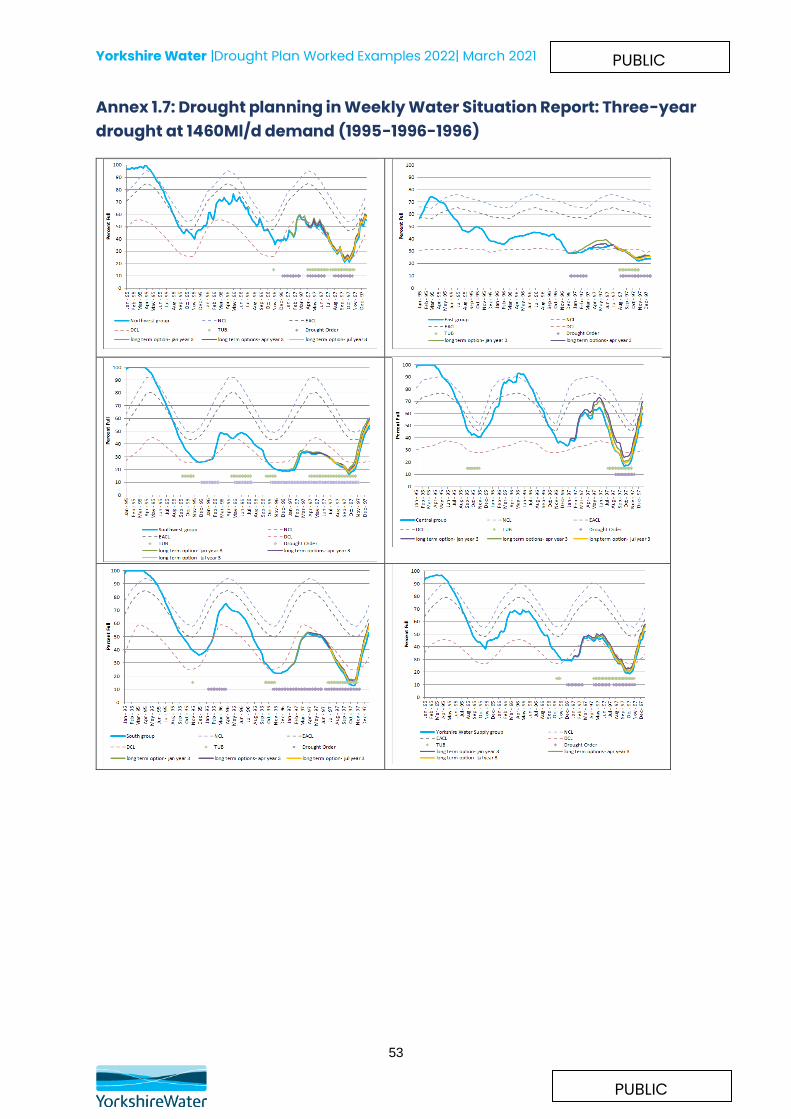
Yorkshire Water |Drought Plan Worked Examples 2022| March 2021
53
PUBLIC
PUBLIC
Annex 1.7: Drought planning in Weekly Water Situation Report: Three-year drought at 1460Ml/d demand (1995-1996-1996)
Yorkshire Water |Drought Plan Worked Examples 2022| March 2021
54
PUBLIC
PUBLIC
Commentary This is based on the January 1995 to August 1996 inflows, followed by 80% of September 1995 to December 1996 inflows. This again represents a more extreme position than has been experienced in Yorkshire in our period of record.
In this example, we would have escalated to Bronze Risk in line with our company Incident Management Plan in July of year 1 when regional reservoir stocks crossed the EA trigger, at the same time as starting liaison with the Environment Agency. In July we would also have escalated our summer water saving campaign, and requested voluntary reductions. Over the summer we would have continually reviewed the situation, and we would have prepared our TUBs advertisements, although as in the 2 year drought in Annex 1.4, we would be unlikely to have implemented TUBs when they were first triggered in September and October after the TUBs season of year 1.
The drought control line was touched in the December of year 1 in the south west and January 1996 in the south reservoir groups, but in the period when we would not usually implement TUBs. During the winter we would have prepared our adverts for TUBS, and our applications for drought permits and orders to reduce compensation flows. In the spring of year 2, with some recovery, but with reservoir stocks still well below normal, we would have advertised and implemented TUBs, and would start the process of applying for non-essential use bans. In the summer of year 2 we would apply for supple side drought permits to reduce compensation flows, and to increase river abstractions in low flow bands.
During the summer of year 2 when we were applying for supply side drought permits and non-essential use bans we would also be carrying out environmental assessments required for our long term drought options, and assessing which options would be the most beneficial with respect to our current water resources position, as well as which were best in terms of the environment. With the drought ongoing, we would decide which long-term options to implement depending on resource and environmental investigations, and commence the process of construction of long term drought options (Northumbrian Water transfer, River Ouse abstraction increase, River Aire abstraction). Depending on the time taken to construct the long-term option, the additional resource would be available sometime during year 3.
Yorkshire Water |Drought Plan Worked Examples 2022| March 2021
55
PUBLIC
PUBLIC
We would also assess the need for emergency drought orders from the summer of year 2, and would continually review the requirements (and benefits) of these.
Scenario: 3 year drought Demand: 1460Ml/d Inflows: January 1995-August 96 inflows followed by 80% of September 1995-December 1996 inflows.
Return Preiod Analyses
Rainfall return period using Tabony Tables: January 1995-August 96 inflows followed by 80% of September 1995-December 1996, 36 months of 73%LTA, >1000 year RP (Jan 1995-August 96, followed by Sept 95-Dec 96, 36 months, 80% LTA, would have a 100-200 year return period)
Inflow analysis using Generalised Pareto distribution (as described in Drought Response Surface analyses) Inflows compared to “average” year 1952 Inflows used for the period January 1995-August 96 inflows followed by 80% of September 1995-December 1996, 76% inflows for 36 months. DRS analyses are carried out for 6-month periods ending in August and November, so: For 30 months June 1995 to August 1996 followed by 80% September 1995- November 1996, 62% of average- 1 in 500 year return period., For 30 months March 1995 to August 1996 followed by 80% September 1995- August 1996, 64% of average- over 1 in 1000 year return period.
Timeline
Trigger Date Actions
Regional NCL crossed May 1995 Reservoir abstractions reduced and rivers maximised
Summer efficiency campaign started.
EA trigger crossed in regional group
July 1995 Bronze Risk escalation instigated
EA liaison commenced
Analysis to determine exceptional shortage of rainfall commenced.
TUBs triggers forecast to be crossed in September in 2 areas.
August 1995
Increase leakage management Increase water saving awareness campaigns Increased efficiency measures Continue to monitor the situation carefully.
Yorkshire Water |Drought Plan Worked Examples 2022| March 2021
56
PUBLIC
PUBLIC
Continue rainfall analyses. Prepare TUBS advertisements
Temporary Use Ban Restriction triggers crossed in Central and southwest Reservoir groups
September 1995
South, Central and South West areas continue to be supported by grid transfers
Temporary Use Ban Restriction trigger crossed for 1 week only in South reservoir group Drought Control Line forecast to be crossed in December/January in South and South West Rainfall analysis shows high return period event.
October 1995
Continue with: • Increased leakage management • Increased water saving awareness
campaigns • Increased efficiency measures
Monitor water resources position Continue with preparation of demand side drought permits/orders to restrict non essential use, Environmental Assessment Reports and supply side drought order/permit applications TUBS not applied for as outside the growing season and benefit limited at this time of year.
Lack of winter refill South and south West stocks just hit DCL.
December 1995
In light of very low reservoir stocks, continue with preparation of TUBs advertisements. South, Central and South West area supported by grid transfers.
Limited winter refill, exceptional shortage of rainfall, and scenario modelling using historic inflows predicts triggers being crossed again.
March 1996 With reservoir stocks failing to recover, advertise TUBs. Liaison with EA and NE Initial preparation of demand side drought permits/orders to restrict non essential use, Environmental Assessment Reports and supply side drought order/permit applications Continue with preparation of demand side drought permits/orders to restrict non essential use, Environmental Assessment Reports and supply side drought order/permit applications Rainfall and inflow analyses to demonstrate exceptional shortage of rainfall.
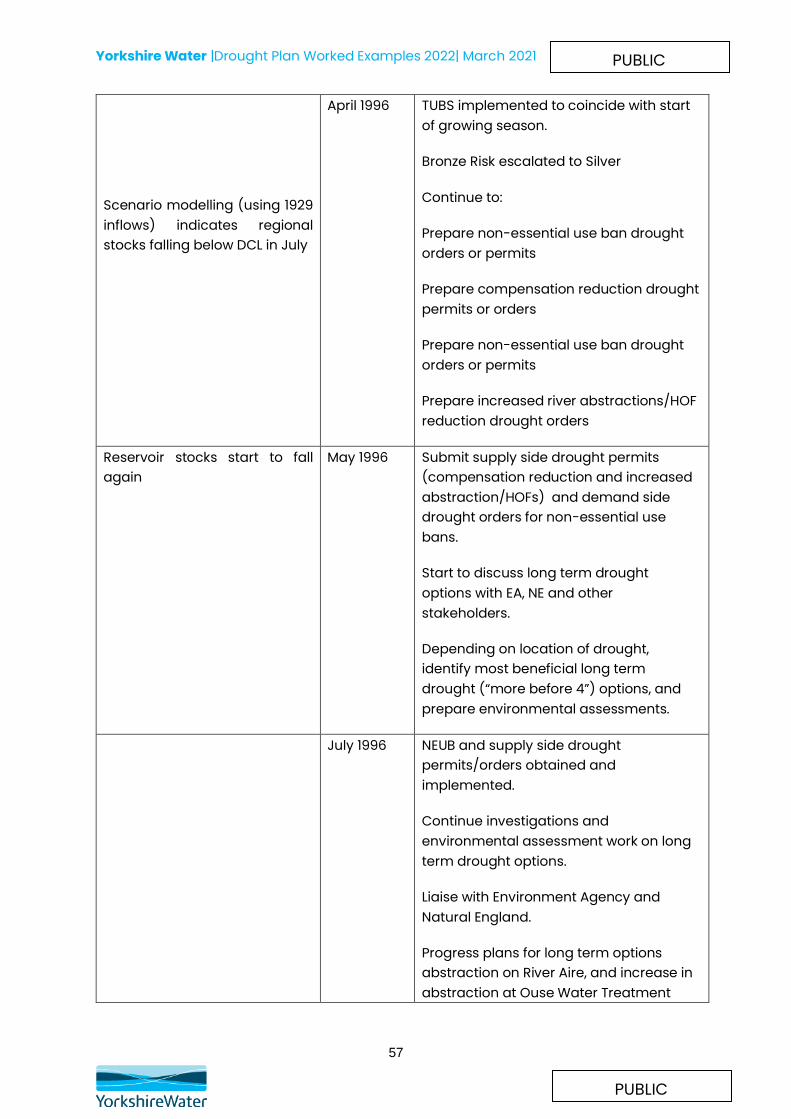
Yorkshire Water |Drought Plan Worked Examples 2022| March 2021
57
PUBLIC
PUBLIC
Scenario modelling (using 1929 inflows) indicates regional stocks falling below DCL in July
April 1996 TUBS implemented to coincide with start of growing season.
Bronze Risk escalated to Silver
Continue to:
Prepare non-essential use ban drought orders or permits
Prepare compensation reduction drought permits or orders
Prepare non-essential use ban drought orders or permits
Prepare increased river abstractions/HOF reduction drought orders
Reservoir stocks start to fall again
May 1996 Submit supply side drought permits (compensation reduction and increased abstraction/HOFs) and demand side drought orders for non-essential use bans.
Start to discuss long term drought options with EA, NE and other stakeholders.
Depending on location of drought, identify most beneficial long term drought (“more before 4”) options, and prepare environmental assessments.
July 1996 NEUB and supply side drought permits/orders obtained and implemented.
Continue investigations and environmental assessment work on long term drought options.
Liaise with Environment Agency and Natural England.
Progress plans for long term options abstraction on River Aire, and increase in abstraction at Ouse Water Treatment
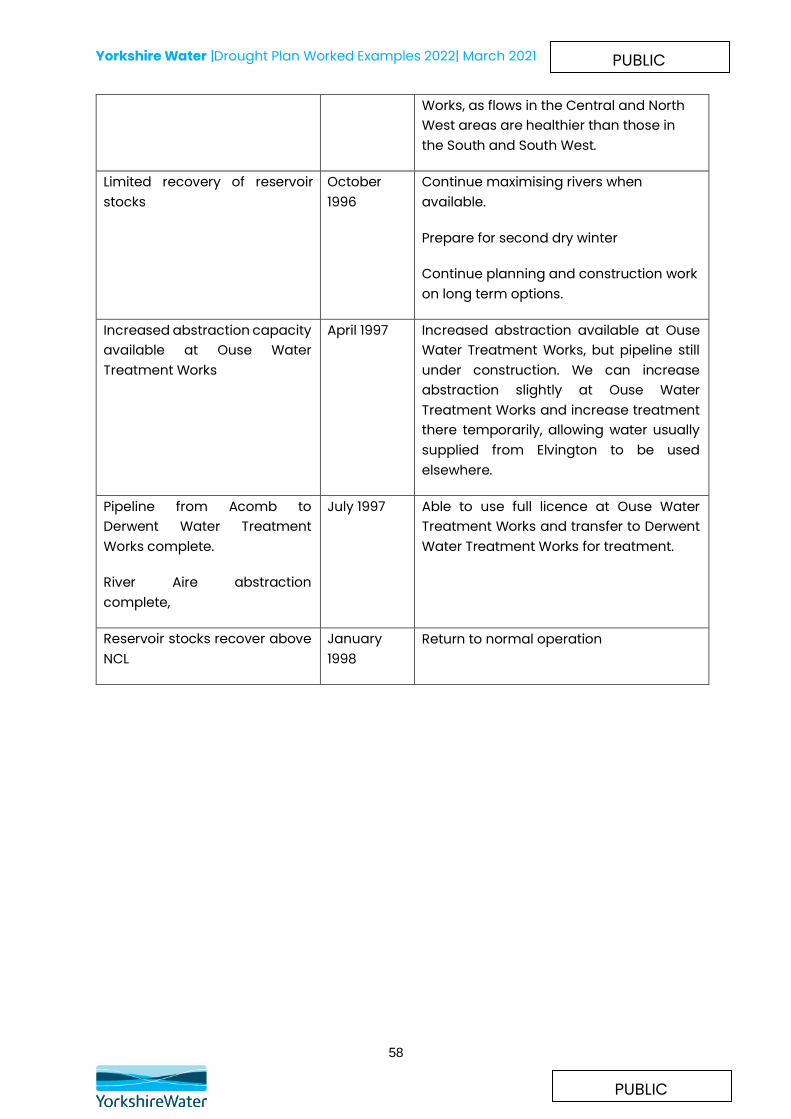
Yorkshire Water |Drought Plan Worked Examples 2022| March 2021
58
PUBLIC
PUBLIC
Works, as flows in the Central and North West areas are healthier than those in the South and South West.
Limited recovery of reservoir stocks
October 1996
Continue maximising rivers when available.
Prepare for second dry winter
Continue planning and construction work on long term options.
Increased abstraction capacity available at Ouse Water Treatment Works
April 1997 Increased abstraction available at Ouse Water Treatment Works, but pipeline still under construction. We can increase abstraction slightly at Ouse Water Treatment Works and increase treatment there temporarily, allowing water usually supplied from Elvington to be used elsewhere.
Pipeline from Acomb to Derwent Water Treatment Works complete.
River Aire abstraction complete,
July 1997 Able to use full licence at Ouse Water Treatment Works and transfer to Derwent Water Treatment Works for treatment.
Reservoir stocks recover above NCL
January 1998
Return to normal operation

Yorkshire Water |Drought Plan Worked Examples 2022| March 2021
59
PUBLIC
PUBLIC
Thank you