
Drop-on-Demand Single Cell Isolation and Total RNA Analysis · For stem cell characterization,...
10
Drop-on-Demand Single Cell Isolation and Total RNA Analysis Sangjun Moon 1 , Yun-Gon Kim 1 , Lingsheng Dong 2 , Michael Lombardi 2 , Edward Haeggstrom 3 , Roderick V. Jensen 4 , Li-Li Hsiao 2 *, Utkan Demirci 1,2,5 * 1 Demirci Bio-Acoustic-MEMS in Medicine (BAMM) Laboratory, Center for Bioengineering, Brigham and Women’s Hospital, Harvard Medical School, Boston, Massachusetts, United States of America, 2 Renal Division, Brigham and Women’s Hospital, Harvard Medical School, Boston, Massachusetts, United States of America, 3 Electronics Research Laboratory, Department of Physics, University of Helsinki, Helsinki, Finland, 4 Department of Biological Sciences, Virginia Tech, Blacksburg, Virginia, United States of America, 5 Harvard-MIT Division of Health Sciences and Technology, Massachusetts Institute of Technology, Cambridge, Massachusetts, United States of America Abstract Technologies that rapidly isolate viable single cells from heterogeneous solutions have significantly contributed to the field of medical genomics. Challenges remain both to enable efficient extraction, isolation and patterning of single cells from heterogeneous solutions as well as to keep them alive during the process due to a limited degree of control over single cell manipulation. Here, we present a microdroplet based method to isolate and pattern single cells from heterogeneous cell suspensions (10% target cell mixture), preserve viability of the extracted cells (97.060.8%), and obtain genomic information from isolated cells compared to the non-patterned controls. The cell encapsulation process is both experimentally and theoretically analyzed. Using the isolated cells, we identified 11 stem cell markers among 1000 genes and compare to the controls. This automated platform enabling high-throughput cell manipulation for subsequent genomic analysis employs fewer handling steps compared to existing methods. Citation: Moon S, Kim Y-G, Dong L, Lombardi M, Haeggstrom E, et al. (2011) Drop-on-Demand Single Cell Isolation and Total RNA Analysis. PLoS ONE 6(3): e17455. doi:10.1371/journal.pone.0017455 Editor: Dimas Covas, University of Sao Paulo - USP, Brazil Received September 13, 2010; Accepted February 3, 2011; Published March 11, 2011 Copyright: ß 2011 Moon et al. This is an open-access article distributed under the terms of the Creative Commons Attribution License, which permits unrestricted use, distribution, and reproduction in any medium, provided the original author and source are credited. Funding: The authors would like to acknowledge NIH R21 EB007707, and the W.H. Coulter Foundation Young Investigation Award. This was also partially supported by RO1 A1081534, R21 AI087107, and Integration of Medicine and Innovative Technology (CIMIT) under U.S. Army Medical Research Acquisition Activity Cooperative Agreement, as well as made possible by a research grant that was awarded and administered by the U.S. Army Medical Research & Materiel Command (USAMRMC) and the Telemedicine & Advanced Technology Research Center (TATRC), at Fort Detrick, MD. The funders had no role in study design, data collection and analysis, decision to publish, or preparation of the manuscript. Competing Interests: The authors have declared that no competing interests exist. * E-mail: [email protected] (UD); [email protected] (L-LH) Introduction For stem cell characterization, understanding single cell level functional genomics has become increasingly important [1,2,3,4,5,6,7,8]. As new regenerative therapies using tissue engi- neering [2] emerge, the existence of tissue-specific stem cells in adult organs has extensively been investigated in bone marrow, skin, heart, muscle, pancreas, lungs, and the nervous system. However, the characterization of differentiated progeny has been hampered by the lack of cell markers and low viability of the purified cells [9]. For instance, single cell transplantation methods can significantly benefit from efficient cell isolation and handling techniques [10]. Recent advances in mRNA amplification and cell sorting technologies offer insights into single cell genomics [1,2,3,4,5,6,11]. However, single cell level genomic studies require amplification by a factor of a billion to reach detection levels from a few femtograms of mRNA present in a single cell. Therefore, to accurately profile single cell genes from a heterogeneous cell solutions or a tissue sample, it is essential to minimize RNA contamination from surrounding cells by enriching the fraction of the target cell type. Cell pattering and encapsulation in droplets is a challenging and exciting field with multiple possible applications including tissue printing [12,13], cell sorting [14], and cryobiology [15]. Several approaches have been developed to isolate single cells (Table 1). The most common methods are microscale cell manipulation [16], serial dilutions of a culture or a co-culture of cells [17], laser capture microdissection (LCM) [18], and fluorescence-activated cell sorting (FACS) [19]. These methods have challenges with complexity, time consumption and inefficiencies in isolating cells that are contamination-free and viable. In addition, histological methods can damage mRNA both in frozen and paraffin- embedded sections [20]. Traditional FACS and LCM require large sample volumes (milliliters), and utilize expensive instruments used by skilled operators (Fig. 1a). FACS can sort cells, at a single cell level in nanoliter volumes. However, FACS does not pattern these cells. Recently, these traditional technologies have been modified and adapted towards microfluidics [21,22,23,24,25,26, 27]. Microengraving [27,28] has low complexity; it rapidly loads individual cells, and creates low mechanical stress during cell loading. However, it suffers from limited control over number of cells per well due to manual cell loading process. These new technologies have potential for single cell genomic analysis of target cells, e.g. stem cells and uncultured organisms [11]. However, these capabilities arrive at a substantial cost in increased design complexity, development cost [29]. Further, there are challenges to control the number of cells deposited to a predetermined location. The microfluidic systems are also great tools to handle and sort cells. Although the cell handling processes have been simplified in microfluidic systems, cell tracking for sorting on chip still requires peripheral setups followed by PLoS ONE | www.plosone.org 1 March 2011 | Volume 6 | Issue 3 | e17455
Transcript of Drop-on-Demand Single Cell Isolation and Total RNA Analysis · For stem cell characterization,...
Drop-on-Demand Single Cell Isolation and Total RNAAnalysisSangjun Moon1, Yun-Gon Kim1, Lingsheng Dong2, Michael Lombardi2, Edward Haeggstrom3, Roderick V.
Jensen4, Li-Li Hsiao2*, Utkan Demirci1,2,5*
1 Demirci Bio-Acoustic-MEMS in Medicine (BAMM) Laboratory, Center for Bioengineering, Brigham and Women’s Hospital, Harvard Medical School, Boston, Massachusetts,
United States of America, 2 Renal Division, Brigham and Women’s Hospital, Harvard Medical School, Boston, Massachusetts, United States of America, 3 Electronics
Research Laboratory, Department of Physics, University of Helsinki, Helsinki, Finland, 4 Department of Biological Sciences, Virginia Tech, Blacksburg, Virginia, United States
of America, 5 Harvard-MIT Division of Health Sciences and Technology, Massachusetts Institute of Technology, Cambridge, Massachusetts, United States of America
Abstract
Technologies that rapidly isolate viable single cells from heterogeneous solutions have significantly contributed to the fieldof medical genomics. Challenges remain both to enable efficient extraction, isolation and patterning of single cells fromheterogeneous solutions as well as to keep them alive during the process due to a limited degree of control over single cellmanipulation. Here, we present a microdroplet based method to isolate and pattern single cells from heterogeneous cellsuspensions (10% target cell mixture), preserve viability of the extracted cells (97.060.8%), and obtain genomic informationfrom isolated cells compared to the non-patterned controls. The cell encapsulation process is both experimentally andtheoretically analyzed. Using the isolated cells, we identified 11 stem cell markers among 1000 genes and compare to thecontrols. This automated platform enabling high-throughput cell manipulation for subsequent genomic analysis employsfewer handling steps compared to existing methods.
Citation: Moon S, Kim Y-G, Dong L, Lombardi M, Haeggstrom E, et al. (2011) Drop-on-Demand Single Cell Isolation and Total RNA Analysis. PLoS ONE 6(3):e17455. doi:10.1371/journal.pone.0017455
Editor: Dimas Covas, University of Sao Paulo - USP, Brazil
Received September 13, 2010; Accepted February 3, 2011; Published March 11, 2011
Copyright: � 2011 Moon et al. This is an open-access article distributed under the terms of the Creative Commons Attribution License, which permitsunrestricted use, distribution, and reproduction in any medium, provided the original author and source are credited.
Funding: The authors would like to acknowledge NIH R21 EB007707, and the W.H. Coulter Foundation Young Investigation Award. This was also partiallysupported by RO1 A1081534, R21 AI087107, and Integration of Medicine and Innovative Technology (CIMIT) under U.S. Army Medical Research AcquisitionActivity Cooperative Agreement, as well as made possible by a research grant that was awarded and administered by the U.S. Army Medical Research & MaterielCommand (USAMRMC) and the Telemedicine & Advanced Technology Research Center (TATRC), at Fort Detrick, MD. The funders had no role in study design, datacollection and analysis, decision to publish, or preparation of the manuscript.
Competing Interests: The authors have declared that no competing interests exist.
* E-mail: [email protected] (UD); [email protected] (L-LH)
Introduction
For stem cell characterization, understanding single cell level
functional genomics has become increasingly important
[1,2,3,4,5,6,7,8]. As new regenerative therapies using tissue engi-
neering [2] emerge, the existence of tissue-specific stem cells in adult
organs has extensively been investigated in bone marrow, skin, heart,
muscle, pancreas, lungs, and the nervous system. However, the
characterization of differentiated progeny has been hampered by the
lack of cell markers and low viability of the purified cells [9]. For
instance, single cell transplantation methods can significantly benefit
from efficient cell isolation and handling techniques [10]. Recent
advances in mRNA amplification and cell sorting technologies offer
insights into single cell genomics [1,2,3,4,5,6,11]. However, single cell
level genomic studies require amplification by a factor of a billion to
reach detection levels from a few femtograms of mRNA present in a
single cell. Therefore, to accurately profile single cell genes from a
heterogeneous cell solutions or a tissue sample, it is essential to
minimize RNA contamination from surrounding cells by enriching
the fraction of the target cell type.
Cell pattering and encapsulation in droplets is a challenging and
exciting field with multiple possible applications including tissue
printing [12,13], cell sorting [14], and cryobiology [15]. Several
approaches have been developed to isolate single cells (Table 1).
The most common methods are microscale cell manipulation [16],
serial dilutions of a culture or a co-culture of cells [17], laser
capture microdissection (LCM) [18], and fluorescence-activated
cell sorting (FACS) [19]. These methods have challenges with
complexity, time consumption and inefficiencies in isolating cells
that are contamination-free and viable. In addition, histological
methods can damage mRNA both in frozen and paraffin-
embedded sections [20]. Traditional FACS and LCM require
large sample volumes (milliliters), and utilize expensive instruments
used by skilled operators (Fig. 1a). FACS can sort cells, at a single
cell level in nanoliter volumes. However, FACS does not pattern
these cells. Recently, these traditional technologies have been
modified and adapted towards microfluidics [21,22,23,24,25,26,
27]. Microengraving [27,28] has low complexity; it rapidly loads
individual cells, and creates low mechanical stress during cell
loading. However, it suffers from limited control over number of
cells per well due to manual cell loading process. These new
technologies have potential for single cell genomic analysis of
target cells, e.g. stem cells and uncultured organisms [11].
However, these capabilities arrive at a substantial cost in increased
design complexity, development cost [29]. Further, there are
challenges to control the number of cells deposited to a
predetermined location. The microfluidic systems are also great
tools to handle and sort cells. Although the cell handling processes
have been simplified in microfluidic systems, cell tracking for
sorting on chip still requires peripheral setups followed by
PLoS ONE | www.plosone.org 1 March 2011 | Volume 6 | Issue 3 | e17455
subsequent cell separation steps. As the heterogeneity of sample
increases, the types of cells that need to be tracked in the sample
also increase. The outcome is that the tracking system requires
more complex peripheral setups and it can require high-end
computerized controls which has an impact on scalability. A great
example of such systems is best demonstrated by Quake and Hong
[29,30,31,32]. To address these challenges, we developed a simple,
high-throughput platform for single cell isolation with direct access
to patterned cells (Fig. 1b). The methodology is based on a ‘‘drop-
on-demand’’ cell patterning technology that follows simple
random sampling (SRS) [33,34,35]. The system patterned an
array of 10610 droplets that encapsulated single cells from a
heterogeneous cell mixture at a high-throughput of within
4 seconds. Subsequently, imaging systems with a wide field of
view are available to monitor the patterned droplet array within a
few seconds showing positions of target cells [36]. Since the
droplets are printed onto a glass surface, each encapsulated cell of
interest can then be accessed freely.
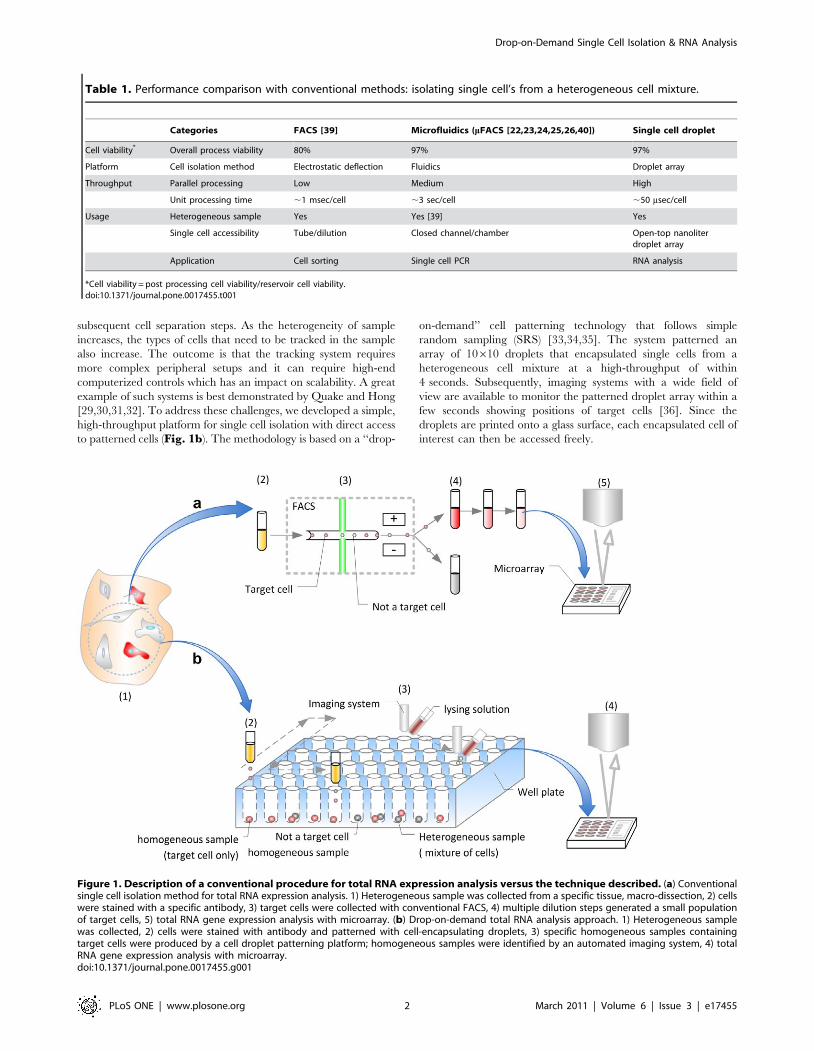
Figure 1. Description of a conventional procedure for total RNA expression analysis versus the technique described. (a) Conventionalsingle cell isolation method for total RNA expression analysis. 1) Heterogeneous sample was collected from a specific tissue, macro-dissection, 2) cellswere stained with a specific antibody, 3) target cells were collected with conventional FACS, 4) multiple dilution steps generated a small populationof target cells, 5) total RNA gene expression analysis with microarray. (b) Drop-on-demand total RNA analysis approach. 1) Heterogeneous samplewas collected, 2) cells were stained with antibody and patterned with cell-encapsulating droplets, 3) specific homogeneous samples containingtarget cells were produced by a cell droplet patterning platform; homogeneous samples were identified by an automated imaging system, 4) totalRNA gene expression analysis with microarray.doi:10.1371/journal.pone.0017455.g001
Table 1. Performance comparison with conventional methods: isolating single cell’s from a heterogeneous cell mixture.
Categories FACS [39] Microfluidics (mFACS [22,23,24,25,26,40]) Single cell droplet
Cell viability* Overall process viability 80% 97% 97%
Platform Cell isolation method Electrostatic deflection Fluidics Droplet array
Throughput Parallel processing Low Medium High
Unit processing time ,1 msec/cell ,3 sec/cell ,50 msec/cell
Usage Heterogeneous sample Yes Yes [39] Yes
Single cell accessibility Tube/dilution Closed channel/chamber Open-top nanoliterdroplet array
Application Cell sorting Single cell PCR RNA analysis
*Cell viability = post processing cell viability/reservoir cell viability.doi:10.1371/journal.pone.0017455.t001
Drop-on-Demand Single Cell Isolation & RNA Analysis
PLoS ONE | www.plosone.org 2 March 2011 | Volume 6 | Issue 3 | e17455
In this paper, we experimentally and theoretically analyzed the
cell encapsulation process in microdroplets. We analyzed the cell
encapsulating droplets for cell viability and performed genomic
analysis on the printed stem cells and compared them to the non-
patterned controls. Here, we present the first time genomic
analysis performed on cells patterned using cell printing indicating
that the cells are genomically functional through the printing
process compared to the controls. We used immunostaining prior
to patterning to distinguish target cells within the heterogeneous
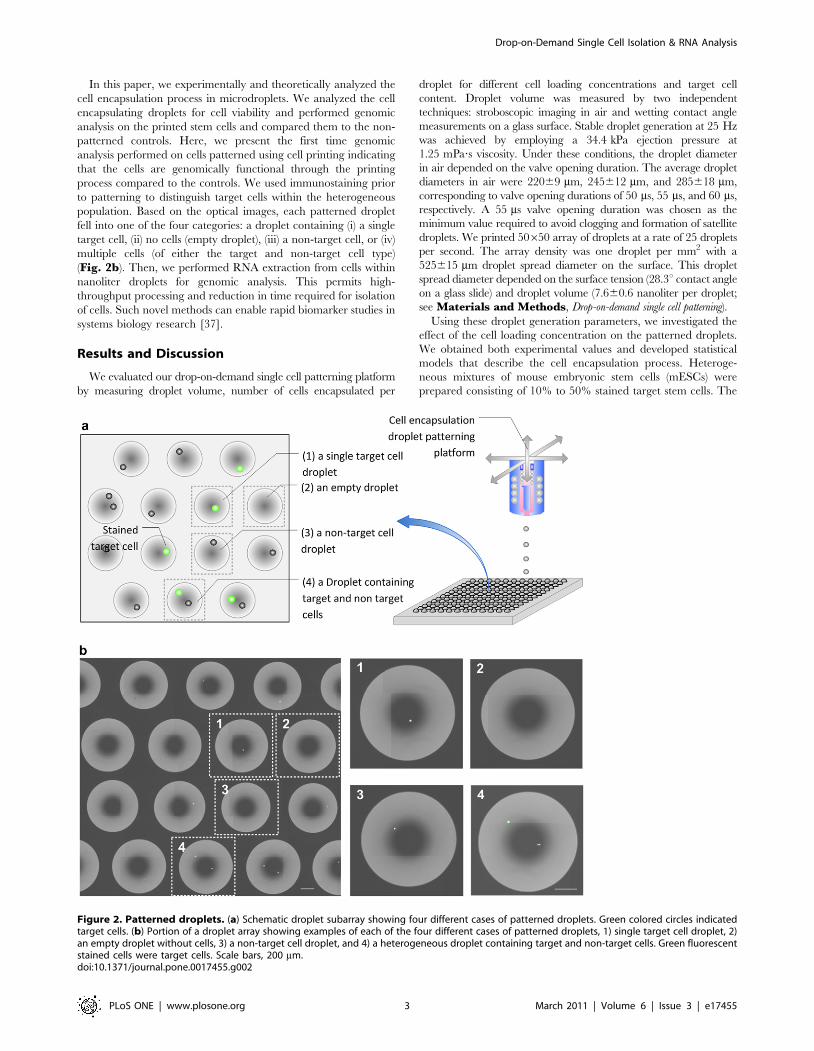
population. Based on the optical images, each patterned droplet
fell into one of the four categories: a droplet containing (i) a single
target cell, (ii) no cells (empty droplet), (iii) a non-target cell, or (iv)
multiple cells (of either the target and non-target cell type)
(Fig. 2b). Then, we performed RNA extraction from cells within
nanoliter droplets for genomic analysis. This permits high-
throughput processing and reduction in time required for isolation
of cells. Such novel methods can enable rapid biomarker studies in
systems biology research [37].
Results and Discussion
We evaluated our drop-on-demand single cell patterning platform
by measuring droplet volume, number of cells encapsulated per
droplet for different cell loading concentrations and target cell
content. Droplet volume was measured by two independent
techniques: stroboscopic imaging in air and wetting contact angle
measurements on a glass surface. Stable droplet generation at 25 Hz
was achieved by employing a 34.4 kPa ejection pressure at
1.25 mPa?s viscosity. Under these conditions, the droplet diameter
in air depended on the valve opening duration. The average droplet
diameters in air were 22069 mm, 245612 mm, and 285618 mm,
corresponding to valve opening durations of 50 ms, 55 ms, and 60 ms,
respectively. A 55 ms valve opening duration was chosen as the
minimum value required to avoid clogging and formation of satellite
droplets. We printed 50650 array of droplets at a rate of 25 droplets
per second. The array density was one droplet per mm2 with a
525615 mm droplet spread diameter on the surface. This droplet
spread diameter depended on the surface tension (28.3u contact angle
on a glass slide) and droplet volume (7.660.6 nanoliter per droplet;
see Materials and Methods, Drop-on-demand single cell patterning).
Using these droplet generation parameters, we investigated the
effect of the cell loading concentration on the patterned droplets.
We obtained both experimental values and developed statistical
models that describe the cell encapsulation process. Heteroge-
neous mixtures of mouse embryonic stem cells (mESCs) were
prepared consisting of 10% to 50% stained target stem cells. The
Figure 2. Patterned droplets. (a) Schematic droplet subarray showing four different cases of patterned droplets. Green colored circles indicatedtarget cells. (b) Portion of a droplet array showing examples of each of the four different cases of patterned droplets, 1) single target cell droplet, 2)an empty droplet without cells, 3) a non-target cell droplet, and 4) a heterogeneous droplet containing target and non-target cells. Green fluorescentstained cells were target cells. Scale bars, 200 mm.doi:10.1371/journal.pone.0017455.g002
Drop-on-Demand Single Cell Isolation & RNA Analysis
PLoS ONE | www.plosone.org 3 March 2011 | Volume 6 | Issue 3 | e17455

average number of target cells per droplet was calculated over 100
droplets (see Materials and Methods, Cell preparation and
staining). We tested cell loading concentrations ranging from a
0.56105 to 7.56105 cells/ml. Our theoretical and experimental
results indicated that the 1.06105 cells/ml concentration was
optimal to encapsulate single cells in droplets, since the resulting
average number of cells per droplet and the standard deviation
were 0.8860.14 (Fig. 3a). The model (see Fig. S5a online) agrees
with the experimental results Fig. 3a. These both indicate that the
maximum single cell encapsulation event is likely to take place at
the 16105 concentration. These statistics correspond to the case of
single cell encapsulation within a droplet (with 36.8% probability),
followed by other cases of an empty droplet (Fig. 3e, 36.8%), and
a droplet containing two cells (Fig. 3e, 18.4%). Further, the
number of cells per droplet was found to be independent of the
target cell fraction (Fig. 3a, 10–50%) in the heterogeneous cell
mixture. We observed that the standard deviation for the number
of encapsulated cells per droplet was higher than 61.5 cells when
the cell loading concentrations exceeded 2.56105 cells/ml
(Fig. 3b). However, the number of cells per droplet obtained by
merging multiple droplets by ejection to the same location showed
smaller standard deviation compared to ejecting a single droplet at
a higher cell loading concentration (less than 60.7 cells/droplet,
Fig. 3b). This result is due to a small cell-to-droplet volume
fraction of 1.7% using 7.6 nanoliter droplets. As we increase
number of droplets, the sampling process fulfills the law of large
numbers (LLN, n = 106, 90% confidence level and 15%
tolerance), the cell encapsulation mechanism can be treated as a
random cell sampling process from a large population of cells, i.e.
Student’s t-test and single factor analysis of variance (ANOVA).
These statistical results as shown in Fig. 3 indicate that our
random cell encapsulation and patterning methods follow the
central limit theorem (CLT) [33,34,35]. This allows us to conclude
that the average and standard deviation of sampled droplets can
be used for statistical estimation of entire sample volume. This
approach may provide a powerful tool for sampling single target
cells in a high-throughput manner without searching the entire cell
population in a reservoir.
We investigated the viability of the cells patterned in droplets.
The reservoir cell viability was 96.760.5% using a 10 ml volume at
7.56105 cells/ml. Following the 1.7 minutes of patterning process
using a 19 ml sample, cell viability was observed to be 93.861.1%
in a 50650 array of cell encapsulating droplets. When the optimal
cell concentration for single cell patterning (1.06105 cells/ml) was
used, the patterned cell viability was 97.060.8%. The relatively
higher patterning viability is due to reduced droplet packing
density, which minimizes possible exposure to mechanical shear
forces at the valve during cell encapsulation. Underlying this high
viability was the low (1.7%) cell-to-droplet volume fraction we
used during encapsulation process. Furthermore, we confirmed
that patterned cell viability does not depend on the target cell
concentration in the reservoir (see Fig. S4 online).
Based on our statistical analysis (see Materials and MethodsStatistical Modeling), the single target cell encapsulation process
followed Poisson distribution and matched with 90% confidence
level and 15% tolerance. These results show that our system can
be used to encapsulate single target cells from a heterogeneous
solution that has 961% target cells by using only 10610 array of
droplets. This reduces time to reach to target cells without
searching the entire sample volume in the ejection reservoir.
We validated that our patterning method produces droplet
arrays that conform to CLT by comparing the fraction of target
cells in the reservoir to the fraction in the patterned droplet array.
The comparison is conducted using 10610 droplet array subset
randomly chosen from a 50650 patterned droplet array. The
fraction of target cells in the reservoir cell mixture (10%) was
essentially mimicked (1062.2%) in the patterned droplet subarrays
(Fig. 3c). The other heterogeneous samples (20%, 30%, and 50%)
agreed with this result. Therefore, evaluating a 10610 droplet
array allowed us to infer the target cell concentration in the
reservoir. The fraction of empty droplets was also investigated with
concentrations ranging from 1.06105 to 2.56105 cells/ml.
Percentage of empty droplets determines the expected yield when
searching for target cells (i.e., cells to be isolated for further mRNA
extraction and analysis, Fig. 3d). At a low cell concentration,
0.56105 cells/ml, the probability of patterning empty droplets was
highest (72.8612.8%). We choose 1.06105 cells/ml concentration
to pattern single cell encapsulating droplets. The fraction of empty
droplets at this concentration ranged from 32.9% to 48.3% over
the range of cell mixture compositions studied. Despite these
values, high-throughput target cell isolation was achieved with the
automated rapid patterning capability.
The patterning process samples 10610 of droplets (of total
volume 0.76 mL) out of the total reservoir volume of 100 mL.
While characterizing the statistics governing the patterned target
cell droplets printed from a heterogeneous cell mixture, we
observed agreement (0.9%,7.0% difference) between the reser-
voir mixture composition and the composition observed in
patterned subarrays for 10% to 50% target cell containing
mixtures (Fig. 3e). Starting from a cell reservoir containing a
10% fraction of target cells, a target homogeneous droplet fraction
of 9.561.4% was observed in a 10610 droplet subarray at a
reservoir cell density of 1.06105 cells/ml. Experimental results
indicate that isolation of ‘‘a droplet containing a single target cell’’
within a 10610 array is likely (at .90% confidence level) for target
cell fractions down to 1% (Fig. 3e). This lower limit of sampling
fraction, 1% v/v, assumes the empty droplet percentage to be at
the maximum value that we experimentally observed to be as
48.3% at 1.06105 cells/ml concentration. Moreover, when a
droplet contained more than three cells, the fraction of droplets
containing only target cells became zero in the 10610 droplet
subarray. We also experimentally observed the highest probability
to pattern homogeneous droplets at the reservoir concentration of
1.06105 cells/ml. At the 1.06105 cells/ml reservoir concentration,
the values for homogeneous droplet occurrences were 4.760.6%,
9.061.9%, 12.761.6%, and 21.665.2% for 10%, 20%, 30%, and
50% target cell concentrations, respectively (Fig. 3f). Our results
demonstrate that higher single cell encapsulation probability yields
higher homogeneity as dictated by Poisson distribution and shown
by experimental results.
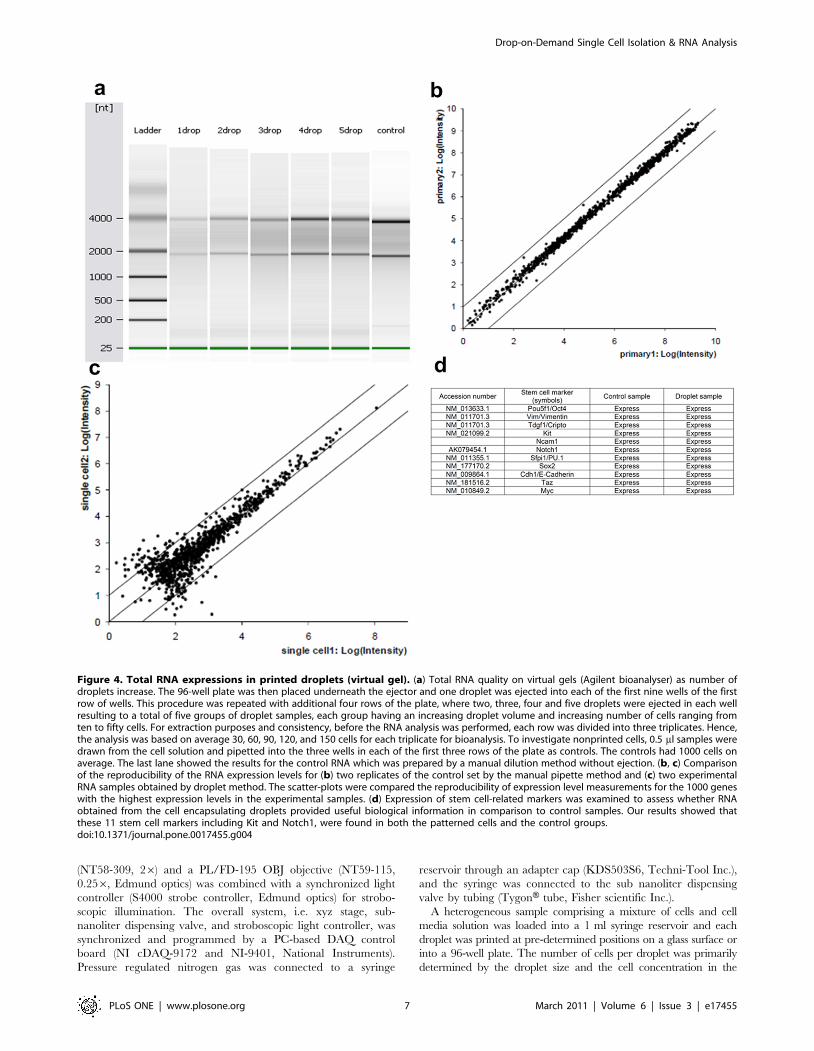
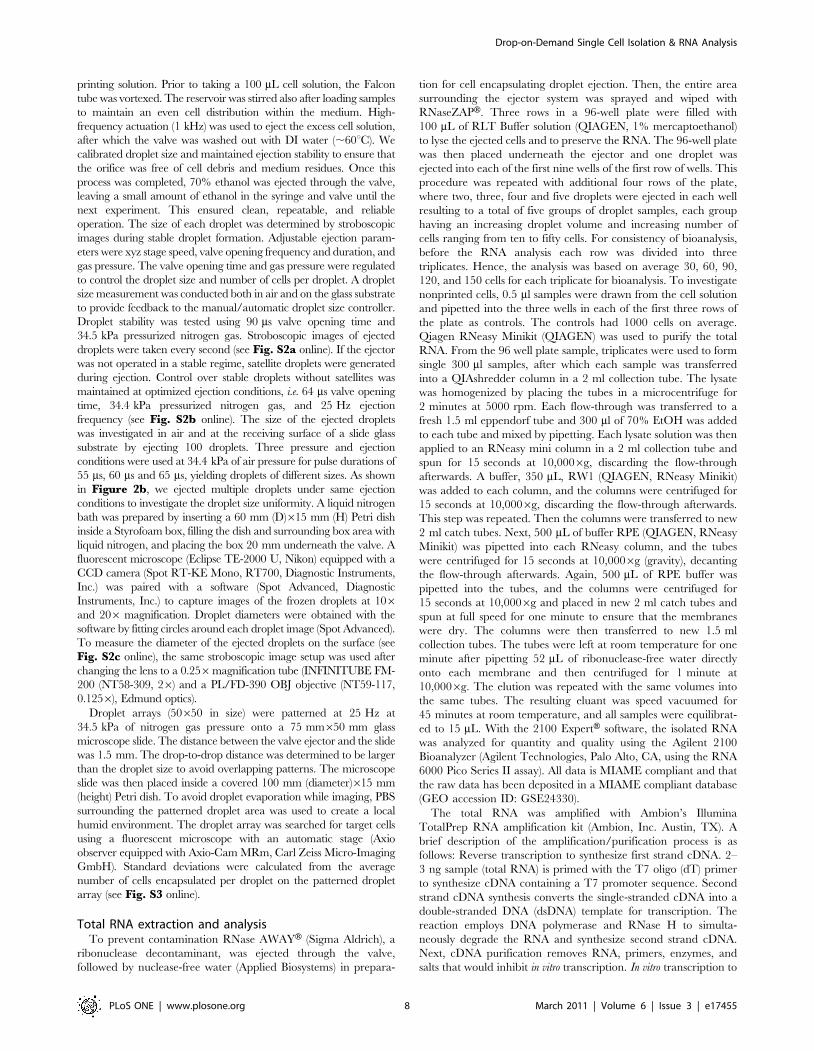
Finally, we evaluated the sensitivity and reproducibility of a
functional genomic analysis of stem cell encapsulating droplets.
For these evaluations, we used DNA microarrays to measure gene
expression levels in RNA samples extracted from mouse
embryonic stem cells obtained by using drop-on-demand. We
compared the results with RNA extracted from a control pool of
mESCs, which were isolated with serial dilution and manual
pipetting. The total RNA quality from the droplet-based isolated
cells was similar to that of the control when assessed with the
Agilent bioanalyser using the 28s/18s ratio (Fig. 4a). This
demonstrated that RNA remains intact throughout the patterning
process. In a genome-wide analysis, the 1000 genes with the
highest expression levels were measured on DNA microarrays for
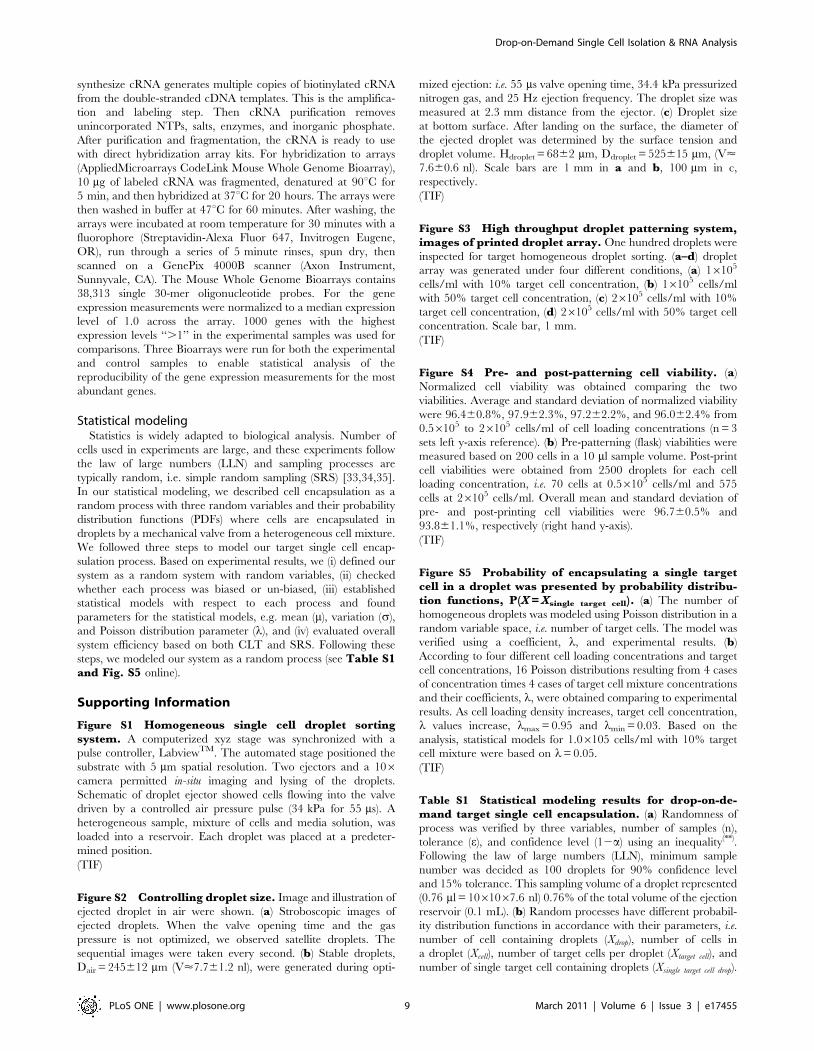
the printed and control cells. The reproducibility of the gene
expression is illustrated by the scatter plots of the microarray
measurements on replicate samples (Fig. 4b, c). Although the
expression levels exhibited greater variability at the lower
expression levels than the control samples, the median coefficient
Drop-on-Demand Single Cell Isolation & RNA Analysis
PLoS ONE | www.plosone.org 4 March 2011 | Volume 6 | Issue 3 | e17455
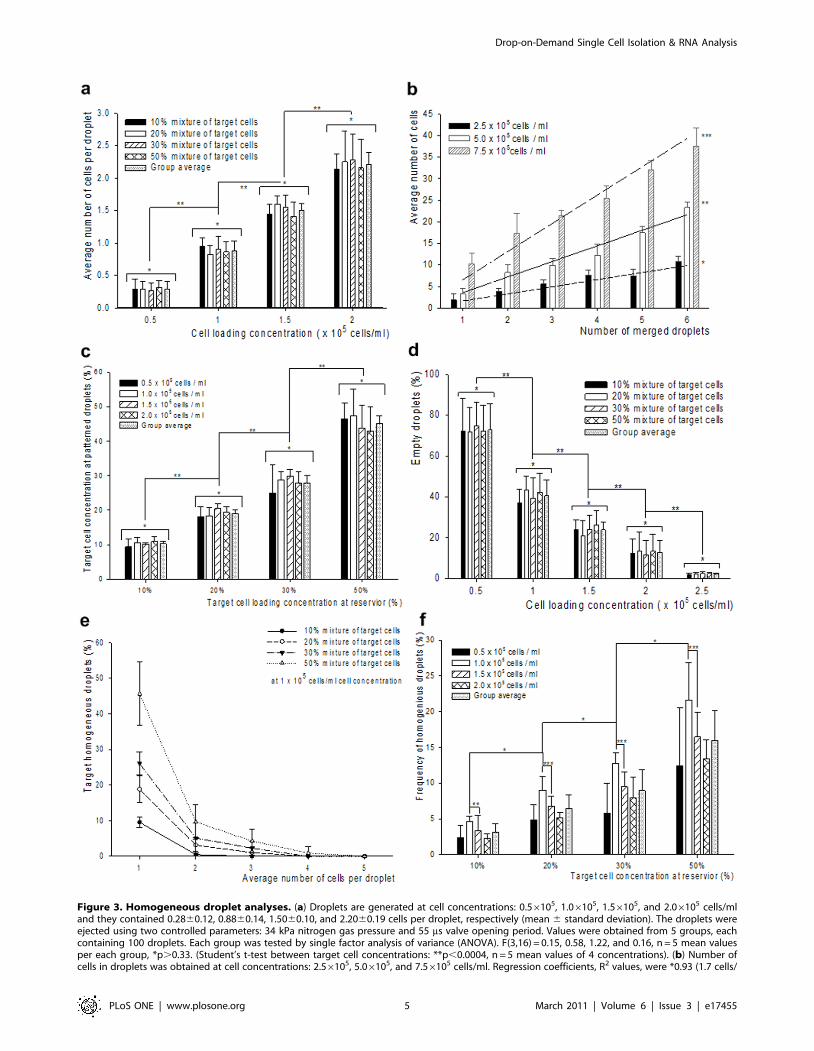
Figure 3. Homogeneous droplet analyses. (a) Droplets are generated at cell concentrations: 0.56105, 1.06105, 1.56105, and 2.06105 cells/mland they contained 0.2860.12, 0.8860.14, 1.5060.10, and 2.2060.19 cells per droplet, respectively (mean 6 standard deviation). The droplets wereejected using two controlled parameters: 34 kPa nitrogen gas pressure and 55 ms valve opening period. Values were obtained from 5 groups, eachcontaining 100 droplets. Each group was tested by single factor analysis of variance (ANOVA). F(3,16) = 0.15, 0.58, 1.22, and 0.16, n = 5 mean valuesper each group, *p.0.33. (Student’s t-test between target cell concentrations: **p,0.0004, n = 5 mean values of 4 concentrations). (b) Number ofcells in droplets was obtained at cell concentrations: 2.56105, 5.06105, and 7.56105 cells/ml. Regression coefficients, R2 values, were *0.93 (1.7 cells/
Drop-on-Demand Single Cell Isolation & RNA Analysis
PLoS ONE | www.plosone.org 5 March 2011 | Volume 6 | Issue 3 | e17455

of variation (CV) across three replicates was 5% in both cases.
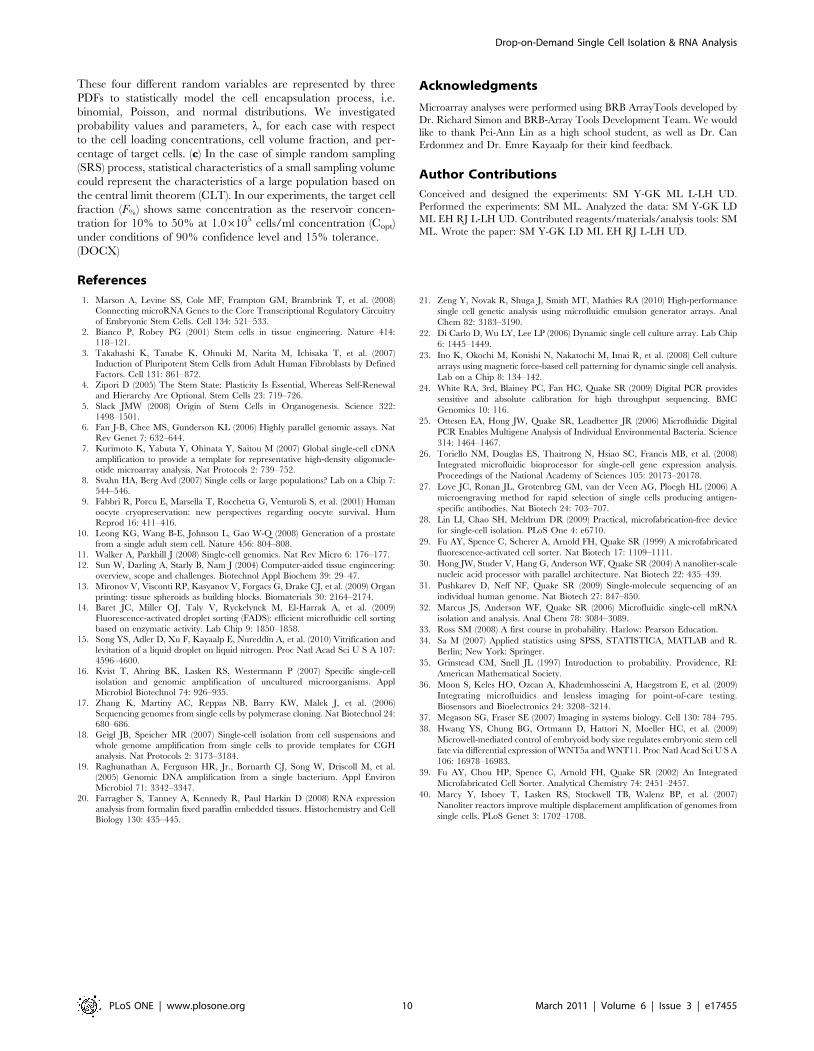
Stem cell-related markers were utilized to assess whether the RNA
obtained from the printed cell group provided useful biological
information in comparison to the control samples. Altogether
eleven stem cell markers including Kit and Notch1 were found in
both the printed cells and non-printed control groups (Fig. 4d).
These results indicate that we were able to successfully isolate and
analyze mRNA from cell encapsulating droplets for functional
genomic studies. (See Materials and Methods, Total RNA
extraction and analysis).
There are also limitations on the drop-on-demand approach for
single cell sorting compared to the microfluidic deterministic cell
encapsulation approaches. As the heterogeneity of sample
increases, the types of cells that need to be tracked in the sample
also increase for microfluidic systems. The outcome is that the
tracking system requires more complex peripheral setups and it
can require high-end computerized controls which has an impact
on scalability [29,30,31]. The drop-on-demand cell encapsulation
approach presented here has a trade-off from a deterministic
aspect, but on the other hand it offers lesser handling steps to sort
and pattern cells, where cells might be affected by the conditions in
the physical environment. For single cell encapsulation, micro-
fluidic method is more deterministic and may provide a better
control over cell encapsulation. Further, the deterministic
approach offers an efficient system to handle minimum number
of cells, i.e. single to ten cells. Second, microfluidic approach can
be convenient in case an integrated on-chip experiment requires
further cell handling steps after sorting such as on-chip polymerase
chain reactions (PCR). Finally, throughput of drop-on-demand
sorting process is limited by the parallel printing setup and the
wide field of view imaging method.
We demonstrated a high-throughput drop-on-demand single
cell isolation technology and presented how it fits to the statistical
models. Our data revealed that the drop-on-demand single cell
patterning platform can isolate viable target stem cells from a
heterogeneous sample. In addition, this patterning approach can
be adapted to generate multiple droplet arrays in parallel, further
enhancing throughput. This work marks the first genomic analysis
study on printed cells. Furthermore, we showed that functional
genomic information, specifically mRNA expression levels,
obtained from ejected cells was preserved throughout the entire
process.
Materials and Methods
Cell preparation and stainingThe work space is a HEPA filter equipped sterile hood
(Cleanroom International, 13202). All materials were decontam-
inated with 70% ethanol and RNaseZAPH (Applied Biosystems)
prior to introducing the cell solutions. Mouse embryonic stem cells
(mESCs, wild type R1 cell line, ,20% confluent) [38] were
trypsinized (1060.5 Trypsin-EDTA, Gibco, 15400) and passaged
from CorningH flask (Corning, CLS3150) into a FalconTM tube
(BD, 352096). The cell solution was centrifuged at 1000 rpm for
3 minutes and cells were washed with DPBS (Dulbecco’s
phosphate buffered saline, Dulbecco, P1010) and resuspended in
culture medium. The culture medium was prepared from 500 ml
Knockout ES Media (Gibco, 11965-092), 50 ml ES FBS (Gibco,
10439-024), 1 ml 2-Mercaptoethanol (Sigma, P4333), 5 ml NEAA
(Non-essential amino acid, Sigma, M7145), 5 ml L-Glutamin
(Gibco, 25030), 2 ml LIF/ml (Leukemia inhibitory factor, Milli-
pore, ESGROH), and 5 ml Pen/Strep (Sigma, P4333). All
components were passed through a sterile filter (500 ml Express
Plus 0.22 mm membrane, Millipore, SCGPU05RE). A sample/
aliquot of the cell solution was stained with 0.4% Trypan Blue
solution (Invitrogen, 15250061) and counted with a hemacytom-
eter (Hausser Scientific, 1483). Two sets of low (16105, 1.56105,
and 26105 cells/ml) and high (2.56105, 5.06105, and 7.56105
cells/ml) cell concentrations were prepared. Using a molecular
probes Live/Dead assay (Invitrogen, L-2334) for mammalian cells,
pre- and post-ejection cell viabilities were recorded. Also, to make
a heterogeneous cell mixture that contains both stained and non-
stained cells, two samples of each concentration of cells were
prepared and stored in separate test tubes. After staining with a
Live/Dead assay and washing with DPBS to remove excessive
staining solution, the stained and unstained cells were mixed to
prepare 10% to 50% volume fraction heterogeneous solutions.
These solutions served as models that represent different fractions
of target cells. Pre-ejection cell viability was measured from
samples taken directly from the cell solutions (see Fig. S4 online).
Post-ejection cell viability was measured from droplets ejected
through the 150 mm valve orifice with a frequency ranging from
1 Hz to 1 kHz. The pulse duration was 55 ms to 65 ms, at 34.5 kPa
of gas pressure.
Drop-on-demand single cell patterningDrop-on-demand can generate droplets both with spatial
control over position and temporal control over ejection. The
single cell droplet ejector system consists of an automated xyz stage
(NLS4 Series Precision Linear Stage, Newmark systems Inc.) and a
sub-nanoliter dispensing valve (TechElan LLC, G100), which were
synchronized with a control program, LabviewTM (Labview,
National Instruments Corporation) (see Fig. S1a online). The
spatial resolution and repeatability of the stage are 0.13 mm and
5 mm, respectively. To image in-situ cell encapsulating droplets
during the ejection process, a CCD camera (Edmund optics, EO-
1312M) equipped with a 0.56 lens (INFINITUBE FM-200
drop), **0.96 (3.6 cells/drop), and ***0.92 (6.6 cells/drop), n = 28 droplets. (c) Comparing target cell concentration in the reservoir and in the dropletpattern. Average and standard deviation of 10% to 50% target cell concentration in the reservoir were 10.360.6, 19.061.0, 27.862.0, and 45.162.1.F(3,16) = 0.82, 1.38, 0.98, and 0.52, *p.0.29, ANOVA for each cell concentration (student’s t-test for each target cell concentration: **p,0.001, n = 5mean values of 4 different target cell concentrations). (d) Fraction of empty droplets in droplet array as a function of cell concentration. Average andstandard deviation of empty droplets for 0.5 to 2.56105 cells/ml concentrations were 72.8612.8%, 40.667.7%, 23.864.0%, 12.765.8%, and 2.260.3%,respectively. F(3,16) = 0.05, 0.64, 0.56, 0.05, and 0.67, *p.0.58, ANOVA for each target cell concentration (student’s t-test for each cell concentration:**p,0.016, n = 5 mean values of 4 different target cell concentrations). (e) Fraction of target homogeneous droplets among the patterned dropletswas calculated as the ratio between the number of cells in homogenous droplets and the overall number of droplets for different cases: 1, 2, 3, 4, and5 cells per droplet. This excluded the empty droplets. At 1.06105, for the case of one cell per droplet, the average and standard deviation values ofhomogeneity were 9.561.4%, 18.863.7%, 26.063.1%, and 45.568.8% for 10 to 50% target cell concentration. The fractions were 0.460.9%,3.162.1%, 5.164.2%, and 9.664.8% for droplets containing two cells. (f) Frequency of homogeneous droplets based on cell concentration. Thisanalysis includes the empty droplets. Among the different target cell concentrations, the 16105 cells/ml concentration showed 4.760.6%, 9.061.9%,12.761.6%, and 21.665.2% homogeneous droplet occurrences. F(1,8) = 22.7, 11.2, and 13.3, *p,0.01, ANOVA for 16105 cells/ml through 10 to 50%target cell concentration (student t-test: **p = 0.12, ***p,0.05, n = 5). Error bars represented the standard deviation of the mean. The p values instudent’s t-test were calculated based on two-sided distributions with unequal variances.doi:10.1371/journal.pone.0017455.g003
Drop-on-Demand Single Cell Isolation & RNA Analysis
PLoS ONE | www.plosone.org 6 March 2011 | Volume 6 | Issue 3 | e17455
(NT58-309, 26) and a PL/FD-195 OBJ objective (NT59-115,
0.256, Edmund optics) was combined with a synchronized light
controller (S4000 strobe controller, Edmund optics) for strobo-
scopic illumination. The overall system, i.e. xyz stage, sub-
nanoliter dispensing valve, and stroboscopic light controller, was
synchronized and programmed by a PC-based DAQ control
board (NI cDAQ-9172 and NI-9401, National Instruments).
Pressure regulated nitrogen gas was connected to a syringe
reservoir through an adapter cap (KDS503S6, Techni-Tool Inc.),
and the syringe was connected to the sub nanoliter dispensing
valve by tubing (TygonH tube, Fisher scientific Inc.).
A heterogeneous sample comprising a mixture of cells and cell
media solution was loaded into a 1 ml syringe reservoir and each
droplet was printed at pre-determined positions on a glass surface or
into a 96-well plate. The number of cells per droplet was primarily
determined by the droplet size and the cell concentration in the
Figure 4. Total RNA expressions in printed droplets (virtual gel). (a) Total RNA quality on virtual gels (Agilent bioanalyser) as number ofdroplets increase. The 96-well plate was then placed underneath the ejector and one droplet was ejected into each of the first nine wells of the firstrow of wells. This procedure was repeated with additional four rows of the plate, where two, three, four and five droplets were ejected in each wellresulting to a total of five groups of droplet samples, each group having an increasing droplet volume and increasing number of cells ranging fromten to fifty cells. For extraction purposes and consistency, before the RNA analysis was performed, each row was divided into three triplicates. Hence,the analysis was based on average 30, 60, 90, 120, and 150 cells for each triplicate for bioanalysis. To investigate nonprinted cells, 0.5 ml samples weredrawn from the cell solution and pipetted into the three wells in each of the first three rows of the plate as controls. The controls had 1000 cells onaverage. The last lane showed the results for the control RNA which was prepared by a manual dilution method without ejection. (b, c) Comparisonof the reproducibility of the RNA expression levels for (b) two replicates of the control set by the manual pipette method and (c) two experimentalRNA samples obtained by droplet method. The scatter-plots were compared the reproducibility of expression level measurements for the 1000 geneswith the highest expression levels in the experimental samples. (d) Expression of stem cell-related markers was examined to assess whether RNAobtained from the cell encapsulating droplets provided useful biological information in comparison to control samples. Our results showed thatthese 11 stem cell markers including Kit and Notch1, were found in both the patterned cells and the control groups.doi:10.1371/journal.pone.0017455.g004
Drop-on-Demand Single Cell Isolation & RNA Analysis
PLoS ONE | www.plosone.org 7 March 2011 | Volume 6 | Issue 3 | e17455
printing solution. Prior to taking a 100 mL cell solution, the Falcon
tube was vortexed. The reservoir was stirred also after loading samples
to maintain an even cell distribution within the medium. High-
frequency actuation (1 kHz) was used to eject the excess cell solution,
after which the valve was washed out with DI water (,60uC). We
calibrated droplet size and maintained ejection stability to ensure that
the orifice was free of cell debris and medium residues. Once this
process was completed, 70% ethanol was ejected through the valve,
leaving a small amount of ethanol in the syringe and valve until the
next experiment. This ensured clean, repeatable, and reliable
operation. The size of each droplet was determined by stroboscopic
images during stable droplet formation. Adjustable ejection param-
eters were xyz stage speed, valve opening frequency and duration, and
gas pressure. The valve opening time and gas pressure were regulated
to control the droplet size and number of cells per droplet. A droplet
size measurement was conducted both in air and on the glass substrate
to provide feedback to the manual/automatic droplet size controller.
Droplet stability was tested using 90 ms valve opening time and
34.5 kPa pressurized nitrogen gas. Stroboscopic images of ejected
droplets were taken every second (see Fig. S2a online). If the ejector
was not operated in a stable regime, satellite droplets were generated
during ejection. Control over stable droplets without satellites was
maintained at optimized ejection conditions, i.e. 64 ms valve opening
time, 34.4 kPa pressurized nitrogen gas, and 25 Hz ejection
frequency (see Fig. S2b online). The size of the ejected droplets
was investigated in air and at the receiving surface of a slide glass
substrate by ejecting 100 droplets. Three pressure and ejection
conditions were used at 34.4 kPa of air pressure for pulse durations of
55 ms, 60 ms and 65 ms, yielding droplets of different sizes. As shown
in Figure 2b, we ejected multiple droplets under same ejection
conditions to investigate the droplet size uniformity. A liquid nitrogen
bath was prepared by inserting a 60 mm (D)615 mm (H) Petri dish
inside a Styrofoam box, filling the dish and surrounding box area with
liquid nitrogen, and placing the box 20 mm underneath the valve. A
fluorescent microscope (Eclipse TE-2000 U, Nikon) equipped with a
CCD camera (Spot RT-KE Mono, RT700, Diagnostic Instruments,
Inc.) was paired with a software (Spot Advanced, Diagnostic
Instruments, Inc.) to capture images of the frozen droplets at 106and 206 magnification. Droplet diameters were obtained with the
software by fitting circles around each droplet image (Spot Advanced).
To measure the diameter of the ejected droplets on the surface (see
Fig. S2c online), the same stroboscopic image setup was used after
changing the lens to a 0.256magnification tube (INFINITUBE FM-
200 (NT58-309, 26) and a PL/FD-390 OBJ objective (NT59-117,
0.1256), Edmund optics).
Droplet arrays (50650 in size) were patterned at 25 Hz at
34.5 kPa of nitrogen gas pressure onto a 75 mm650 mm glass
microscope slide. The distance between the valve ejector and the slide
was 1.5 mm. The drop-to-drop distance was determined to be larger
than the droplet size to avoid overlapping patterns. The microscope
slide was then placed inside a covered 100 mm (diameter)615 mm
(height) Petri dish. To avoid droplet evaporation while imaging, PBS
surrounding the patterned droplet area was used to create a local
humid environment. The droplet array was searched for target cells
using a fluorescent microscope with an automatic stage (Axio
observer equipped with Axio-Cam MRm, Carl Zeiss Micro-Imaging
GmbH). Standard deviations were calculated from the average
number of cells encapsulated per droplet on the patterned droplet
array (see Fig. S3 online).
Total RNA extraction and analysisTo prevent contamination RNase AWAYH (Sigma Aldrich), a
ribonuclease decontaminant, was ejected through the valve,
followed by nuclease-free water (Applied Biosystems) in prepara-
tion for cell encapsulating droplet ejection. Then, the entire area
surrounding the ejector system was sprayed and wiped with
RNaseZAPH. Three rows in a 96-well plate were filled with
100 mL of RLT Buffer solution (QIAGEN, 1% mercaptoethanol)
to lyse the ejected cells and to preserve the RNA. The 96-well plate
was then placed underneath the ejector and one droplet was
ejected into each of the first nine wells of the first row of wells. This
procedure was repeated with additional four rows of the plate,
where two, three, four and five droplets were ejected in each well
resulting to a total of five groups of droplet samples, each group
having an increasing droplet volume and increasing number of
cells ranging from ten to fifty cells. For consistency of bioanalysis,
before the RNA analysis each row was divided into three
triplicates. Hence, the analysis was based on average 30, 60, 90,
120, and 150 cells for each triplicate for bioanalysis. To investigate
nonprinted cells, 0.5 ml samples were drawn from the cell solution
and pipetted into the three wells in each of the first three rows of
the plate as controls. The controls had 1000 cells on average.
Qiagen RNeasy Minikit (QIAGEN) was used to purify the total
RNA. From the 96 well plate sample, triplicates were used to form
single 300 ml samples, after which each sample was transferred
into a QIAshredder column in a 2 ml collection tube. The lysate
was homogenized by placing the tubes in a microcentrifuge for
2 minutes at 5000 rpm. Each flow-through was transferred to a
fresh 1.5 ml eppendorf tube and 300 ml of 70% EtOH was added
to each tube and mixed by pipetting. Each lysate solution was then
applied to an RNeasy mini column in a 2 ml collection tube and
spun for 15 seconds at 10,0006g, discarding the flow-through
afterwards. A buffer, 350 mL, RW1 (QIAGEN, RNeasy Minikit)
was added to each column, and the columns were centrifuged for
15 seconds at 10,0006g, discarding the flow-through afterwards.
This step was repeated. Then the columns were transferred to new
2 ml catch tubes. Next, 500 mL of buffer RPE (QIAGEN, RNeasy
Minikit) was pipetted into each RNeasy column, and the tubes
were centrifuged for 15 seconds at 10,0006g (gravity), decanting
the flow-through afterwards. Again, 500 mL of RPE buffer was
pipetted into the tubes, and the columns were centrifuged for
15 seconds at 10,0006g and placed in new 2 ml catch tubes and
spun at full speed for one minute to ensure that the membranes
were dry. The columns were then transferred to new 1.5 ml
collection tubes. The tubes were left at room temperature for one
minute after pipetting 52 mL of ribonuclease-free water directly
onto each membrane and then centrifuged for 1 minute at
10,0006g. The elution was repeated with the same volumes into
the same tubes. The resulting eluant was speed vacuumed for
45 minutes at room temperature, and all samples were equilibrat-
ed to 15 mL. With the 2100 ExpertH software, the isolated RNA
was analyzed for quantity and quality using the Agilent 2100
Bioanalyzer (Agilent Technologies, Palo Alto, CA, using the RNA
6000 Pico Series II assay). All data is MIAME compliant and that
the raw data has been deposited in a MIAME compliant database
(GEO accession ID: GSE24330).
The total RNA was amplified with Ambion’s Illumina
TotalPrep RNA amplification kit (Ambion, Inc. Austin, TX). A
brief description of the amplification/purification process is as
follows: Reverse transcription to synthesize first strand cDNA. 2–
3 ng sample (total RNA) is primed with the T7 oligo (dT) primer
to synthesize cDNA containing a T7 promoter sequence. Second
strand cDNA synthesis converts the single-stranded cDNA into a
double-stranded DNA (dsDNA) template for transcription. The
reaction employs DNA polymerase and RNase H to simulta-
neously degrade the RNA and synthesize second strand cDNA.
Next, cDNA purification removes RNA, primers, enzymes, and
salts that would inhibit in vitro transcription. In vitro transcription to
Drop-on-Demand Single Cell Isolation & RNA Analysis
PLoS ONE | www.plosone.org 8 March 2011 | Volume 6 | Issue 3 | e17455
synthesize cRNA generates multiple copies of biotinylated cRNA
from the double-stranded cDNA templates. This is the amplifica-
tion and labeling step. Then cRNA purification removes
unincorporated NTPs, salts, enzymes, and inorganic phosphate.
After purification and fragmentation, the cRNA is ready to use
with direct hybridization array kits. For hybridization to arrays
(AppliedMicroarrays CodeLink Mouse Whole Genome Bioarray),
10 mg of labeled cRNA was fragmented, denatured at 90uC for
5 min, and then hybridized at 37uC for 20 hours. The arrays were
then washed in buffer at 47uC for 60 minutes. After washing, the
arrays were incubated at room temperature for 30 minutes with a
fluorophore (Streptavidin-Alexa Fluor 647, Invitrogen Eugene,
OR), run through a series of 5 minute rinses, spun dry, then
scanned on a GenePix 4000B scanner (Axon Instrument,
Sunnyvale, CA). The Mouse Whole Genome Bioarrays contains
38,313 single 30-mer oligonucleotide probes. For the gene
expression measurements were normalized to a median expression
level of 1.0 across the array. 1000 genes with the highest
expression levels ‘‘.1’’ in the experimental samples was used for
comparisons. Three Bioarrays were run for both the experimental
and control samples to enable statistical analysis of the
reproducibility of the gene expression measurements for the most
abundant genes.
Statistical modelingStatistics is widely adapted to biological analysis. Number of
cells used in experiments are large, and these experiments follow
the law of large numbers (LLN) and sampling processes are
typically random, i.e. simple random sampling (SRS) [33,34,35].
In our statistical modeling, we described cell encapsulation as a
random process with three random variables and their probability
distribution functions (PDFs) where cells are encapsulated in
droplets by a mechanical valve from a heterogeneous cell mixture.
We followed three steps to model our target single cell encap-
sulation process. Based on experimental results, we (i) defined our
system as a random system with random variables, (ii) checked
whether each process was biased or un-biased, (iii) established
statistical models with respect to each process and found
parameters for the statistical models, e.g. mean (m), variation (s),
and Poisson distribution parameter (l), and (iv) evaluated overall
system efficiency based on both CLT and SRS. Following these
steps, we modeled our system as a random process (see Table S1and Fig. S5 online).
Supporting Information
Figure S1 Homogeneous single cell droplet sortingsystem. A computerized xyz stage was synchronized with a
pulse controller, LabviewTM. The automated stage positioned the
substrate with 5 mm spatial resolution. Two ejectors and a 106camera permitted in-situ imaging and lysing of the droplets.
Schematic of droplet ejector showed cells flowing into the valve
driven by a controlled air pressure pulse (34 kPa for 55 ms). A
heterogeneous sample, mixture of cells and media solution, was
loaded into a reservoir. Each droplet was placed at a predeter-
mined position.
(TIF)
Figure S2 Controlling droplet size. Image and illustration of
ejected droplet in air were shown. (a) Stroboscopic images of
ejected droplets. When the valve opening time and the gas
pressure is not optimized, we observed satellite droplets. The
sequential images were taken every second. (b) Stable droplets,
Dair = 245612 mm (V<7.761.2 nl), were generated during opti-
mized ejection: i.e. 55 ms valve opening time, 34.4 kPa pressurized
nitrogen gas, and 25 Hz ejection frequency. The droplet size was
measured at 2.3 mm distance from the ejector. (c) Droplet size
at bottom surface. After landing on the surface, the diameter of
the ejected droplet was determined by the surface tension and
droplet volume. Hdroplet = 6862 mm, Ddroplet = 525615 mm, (V<7.660.6 nl). Scale bars are 1 mm in a and b, 100 mm in c,
respectively.
(TIF)
Figure S3 High throughput droplet patterning system,images of printed droplet array. One hundred droplets were
inspected for target homogeneous droplet sorting. (a–d) droplet
array was generated under four different conditions, (a) 16105
cells/ml with 10% target cell concentration, (b) 16105 cells/ml
with 50% target cell concentration, (c) 26105 cells/ml with 10%
target cell concentration, (d) 26105 cells/ml with 50% target cell
concentration. Scale bar, 1 mm.
(TIF)
Figure S4 Pre- and post-patterning cell viability. (a)
Normalized cell viability was obtained comparing the two
viabilities. Average and standard deviation of normalized viability
were 96.460.8%, 97.962.3%, 97.262.2%, and 96.062.4% from
0.56105 to 26105 cells/ml of cell loading concentrations (n = 3
sets left y-axis reference). (b) Pre-patterning (flask) viabilities were
measured based on 200 cells in a 10 ml sample volume. Post-print
cell viabilities were obtained from 2500 droplets for each cell
loading concentration, i.e. 70 cells at 0.56105 cells/ml and 575
cells at 26105 cells/ml. Overall mean and standard deviation of
pre- and post-printing cell viabilities were 96.760.5% and
93.861.1%, respectively (right hand y-axis).
(TIF)
Figure S5 Probability of encapsulating a single targetcell in a droplet was presented by probability distribu-tion functions, P(X = Xsingle target cell). (a) The number of
homogeneous droplets was modeled using Poisson distribution in a
random variable space, i.e. number of target cells. The model was
verified using a coefficient, l, and experimental results. (b)
According to four different cell loading concentrations and target
cell concentrations, 16 Poisson distributions resulting from 4 cases
of concentration times 4 cases of target cell mixture concentrations
and their coefficients, l, were obtained comparing to experimental
results. As cell loading density increases, target cell concentration,
l values increase, lmax = 0.95 and lmin = 0.03. Based on the
analysis, statistical models for 1.06105 cells/ml with 10% target
cell mixture were based on l= 0.05.
(TIF)
Table S1 Statistical modeling results for drop-on-de-mand target single cell encapsulation. (a) Randomness of
process was verified by three variables, number of samples (n),
tolerance (e), and confidence level (12a) using an inequality(**).
Following the law of large numbers (LLN), minimum sample
number was decided as 100 droplets for 90% confidence level
and 15% tolerance. This sampling volume of a droplet represented
(0.76 ml = 1061067.6 nl) 0.76% of the total volume of the ejection
reservoir (0.1 mL). (b) Random processes have different probabil-
ity distribution functions in accordance with their parameters, i.e.
number of cell containing droplets (Xdrop), number of cells in
a droplet (Xcell), number of target cells per droplet (Xtarget cell), and
number of single target cell containing droplets (Xsingle target cell drop).
Drop-on-Demand Single Cell Isolation & RNA Analysis
PLoS ONE | www.plosone.org 9 March 2011 | Volume 6 | Issue 3 | e17455
These four different random variables are represented by three
PDFs to statistically model the cell encapsulation process, i.e.
binomial, Poisson, and normal distributions. We investigated
probability values and parameters, l, for each case with respect
to the cell loading concentrations, cell volume fraction, and per-
centage of target cells. (c) In the case of simple random sampling
(SRS) process, statistical characteristics of a small sampling volume
could represent the characteristics of a large population based on
the central limit theorem (CLT). In our experiments, the target cell
fraction (F%) shows same concentration as the reservoir concen-
tration for 10% to 50% at 1.06105 cells/ml concentration (Copt)
under conditions of 90% confidence level and 15% tolerance.
(DOCX)
Acknowledgments
Microarray analyses were performed using BRB ArrayTools developed by
Dr. Richard Simon and BRB-Array Tools Development Team. We would
like to thank Pei-Ann Lin as a high school student, as well as Dr. Can
Erdonmez and Dr. Emre Kayaalp for their kind feedback.
Author Contributions
Conceived and designed the experiments: SM Y-GK ML L-LH UD.
Performed the experiments: SM ML. Analyzed the data: SM Y-GK LD
ML EH RJ L-LH UD. Contributed reagents/materials/analysis tools: SM
ML. Wrote the paper: SM Y-GK LD ML EH RJ L-LH UD.
References
1. Marson A, Levine SS, Cole MF, Frampton GM, Brambrink T, et al. (2008)Connecting microRNA Genes to the Core Transcriptional Regulatory Circuitry
of Embryonic Stem Cells. Cell 134: 521–533.
2. Bianco P, Robey PG (2001) Stem cells in tissue engineering. Nature 414:118–121.
3. Takahashi K, Tanabe K, Ohnuki M, Narita M, Ichisaka T, et al. (2007)Induction of Pluripotent Stem Cells from Adult Human Fibroblasts by Defined
Factors. Cell 131: 861–872.4. Zipori D (2005) The Stem State: Plasticity Is Essential, Whereas Self-Renewal
and Hierarchy Are Optional. Stem Cells 23: 719–726.
5. Slack JMW (2008) Origin of Stem Cells in Organogenesis. Science 322:1498–1501.
6. Fan J-B, Chee MS, Gunderson KL (2006) Highly parallel genomic assays. NatRev Genet 7: 632–644.
7. Kurimoto K, Yabuta Y, Ohinata Y, Saitou M (2007) Global single-cell cDNA
amplification to provide a template for representative high-density oligonucle-otide microarray analysis. Nat Protocols 2: 739–752.
8. Svahn HA, Berg Avd (2007) Single cells or large populations? Lab on a Chip 7:544–546.
9. Fabbri R, Porcu E, Marsella T, Rocchetta G, Venturoli S, et al. (2001) Humanoocyte cryopreservation: new perspectives regarding oocyte survival. Hum
Reprod 16: 411–416.
10. Leong KG, Wang B-E, Johnson L, Gao W-Q (2008) Generation of a prostatefrom a single adult stem cell. Nature 456: 804–808.
11. Walker A, Parkhill J (2008) Single-cell genomics. Nat Rev Micro 6: 176–177.12. Sun W, Darling A, Starly B, Nam J (2004) Computer-aided tissue engineering:
overview, scope and challenges. Biotechnol Appl Biochem 39: 29–47.
13. Mironov V, Visconti RP, Kasyanov V, Forgacs G, Drake CJ, et al. (2009) Organprinting: tissue spheroids as building blocks. Biomaterials 30: 2164–2174.
14. Baret JC, Miller OJ, Taly V, Ryckelynck M, El-Harrak A, et al. (2009)Fluorescence-activated droplet sorting (FADS): efficient microfluidic cell sorting
based on enzymatic activity. Lab Chip 9: 1850–1858.15. Song YS, Adler D, Xu F, Kayaalp E, Nureddin A, et al. (2010) Vitrification and
levitation of a liquid droplet on liquid nitrogen. Proc Natl Acad Sci U S A 107:
4596–4600.16. Kvist T, Ahring BK, Lasken RS, Westermann P (2007) Specific single-cell
isolation and genomic amplification of uncultured microorganisms. ApplMicrobiol Biotechnol 74: 926–935.
17. Zhang K, Martiny AC, Reppas NB, Barry KW, Malek J, et al. (2006)
Sequencing genomes from single cells by polymerase cloning. Nat Biotechnol 24:680–686.
18. Geigl JB, Speicher MR (2007) Single-cell isolation from cell suspensions andwhole genome amplification from single cells to provide templates for CGH
analysis. Nat Protocols 2: 3173–3184.
19. Raghunathan A, Ferguson HR, Jr., Bornarth CJ, Song W, Driscoll M, et al.(2005) Genomic DNA amplification from a single bacterium. Appl Environ
Microbiol 71: 3342–3347.20. Farragher S, Tanney A, Kennedy R, Paul Harkin D (2008) RNA expression
analysis from formalin fixed paraffin embedded tissues. Histochemistry and CellBiology 130: 435–445.
21. Zeng Y, Novak R, Shuga J, Smith MT, Mathies RA (2010) High-performance
single cell genetic analysis using microfluidic emulsion generator arrays. Anal
Chem 82: 3183–3190.
22. Di Carlo D, Wu LY, Lee LP (2006) Dynamic single cell culture array. Lab Chip
6: 1445–1449.
23. Ino K, Okochi M, Konishi N, Nakatochi M, Imai R, et al. (2008) Cell culture
arrays using magnetic force-based cell patterning for dynamic single cell analysis.
Lab on a Chip 8: 134–142.
24. White RA, 3rd, Blainey PC, Fan HC, Quake SR (2009) Digital PCR provides
sensitive and absolute calibration for high throughput sequencing. BMC
Genomics 10: 116.
25. Ottesen EA, Hong JW, Quake SR, Leadbetter JR (2006) Microfluidic Digital
PCR Enables Multigene Analysis of Individual Environmental Bacteria. Science
314: 1464–1467.
26. Toriello NM, Douglas ES, Thaitrong N, Hsiao SC, Francis MB, et al. (2008)
Integrated microfluidic bioprocessor for single-cell gene expression analysis.
Proceedings of the National Academy of Sciences 105: 20173–20178.
27. Love JC, Ronan JL, Grotenbreg GM, van der Veen AG, Ploegh HL (2006) A
microengraving method for rapid selection of single cells producing antigen-
specific antibodies. Nat Biotech 24: 703–707.
28. Lin LI, Chao SH, Meldrum DR (2009) Practical, microfabrication-free device
for single-cell isolation. PLoS One 4: e6710.
29. Fu AY, Spence C, Scherer A, Arnold FH, Quake SR (1999) A microfabricated
fluorescence-activated cell sorter. Nat Biotech 17: 1109–1111.
30. Hong JW, Studer V, Hang G, Anderson WF, Quake SR (2004) A nanoliter-scale
nucleic acid processor with parallel architecture. Nat Biotech 22: 435–439.
31. Pushkarev D, Neff NF, Quake SR (2009) Single-molecule sequencing of an
individual human genome. Nat Biotech 27: 847–850.
32. Marcus JS, Anderson WF, Quake SR (2006) Microfluidic single-cell mRNA
isolation and analysis. Anal Chem 78: 3084–3089.
33. Ross SM (2008) A first course in probability. Harlow: Pearson Education.
34. Sa M (2007) Applied statistics using SPSS, STATISTICA, MATLAB and R.
Berlin; New York: Springer.
35. Grinstead CM, Snell JL (1997) Introduction to probability. Providence, RI:
American Mathematical Society.
36. Moon S, Keles HO, Ozcan A, Khademhosseini A, Haegstrom E, et al. (2009)
Integrating microfluidics and lensless imaging for point-of-care testing.
Biosensors and Bioelectronics 24: 3208–3214.
37. Megason SG, Fraser SE (2007) Imaging in systems biology. Cell 130: 784–795.
38. Hwang YS, Chung BG, Ortmann D, Hattori N, Moeller HC, et al. (2009)
Microwell-mediated control of embryoid body size regulates embryonic stem cell
fate via differential expression of WNT5a and WNT11. Proc Natl Acad Sci U S A
106: 16978–16983.
39. Fu AY, Chou HP, Spence C, Arnold FH, Quake SR (2002) An Integrated
Microfabricated Cell Sorter. Analytical Chemistry 74: 2451–2457.
40. Marcy Y, Ishoey T, Lasken RS, Stockwell TB, Walenz BP, et al. (2007)
Nanoliter reactors improve multiple displacement amplification of genomes from
single cells. PLoS Genet 3: 1702–1708.
Drop-on-Demand Single Cell Isolation & RNA Analysis
PLoS ONE | www.plosone.org 10 March 2011 | Volume 6 | Issue 3 | e17455


