Drop Measurement System for Biomedical Application
5
Drop Measurement System for Biomedical Application Michele Norgia, Senior Member, IEEE , Alessandro Magnani, Dario Melchionni, and Alessandro Pesatori, Member, IEEE I. I NTRODUCTION I N CLINICAL practice, infusion systems are very common [1]–[4]. They are utilized to administer intravenous liquids and solutions to a patient. There are many different ways to administrate these medical liquids: via pumping systems [3] or using apparatuses that exploit the principle of drip by gravity. In these cases, there is a need for pumps specially built and regulated through electromechanical systems, with high performances in terms of precision of volume flowing out without any leakage. For this reason, these types of pumps have a very high cost of purchase, which when combined with the maintenance costs, makes their usage in hospitals very limited, preferring, where possible, the cheapest gravity drip systems. The infusion technique most widely used is the intravenous therapy. The intravenous [6], [7] apparatus is very simple and low cost, and it is formed by an intravenous bag on a pole connected to intravenous lines and an infusion needle, as shown in Fig. 1. The outflow of the medicinal solution occurs through a drop chamber and a terminal: the former is the responsible for the descent of the liquid, by force of gravity, in the form of drops and the latter regulates the flow velocity. The dosage requires the administration of a precise amount of active principle, but it is customary to prescribe this quantity in terms of drop rate, called the drop factor. The absence of electronic controls in the intravenous bags and the possibility of only a coarse adjustment of the drop Manuscript received October 1, 2014; revised December 10, 2014; accepted January 8, 2015. Date of publication February 17, 2015; date of current version August 7, 2015 The authors are with the Dipartimento di Elettronica, Informazione e Bioingegneria, Politecnico di Milano, Milan 20133, Italy (e-mail: [email protected]). Color versions of one or more of the figures in this paper are available online. Fig. 1. Intravenous bags on a pole connected to the intravenous lines. factor do not guarantee the administration of a precise amount of medication. It is also necessary to note that the dosages expressed in terms of drop factor do not consider several factors, such as morphological diversity of the drops; different speeds of the drop, variable in function of the amount of liquid in the bottle; different temperatures and viscosities of the liquid; and different specific weights, according to the quantity of active principle dissolved in the physiological substance. Thus, it results of great interest to the study of a system capable of making a low-cost intravenous drop system more accurate, maintaining the same ease of use and cost. Different strategies were implemented to address this problem: a capacitive system [8] or an optical mechanical system [9], but no system had the sufficient accuracy and robustness to work. Specifically, in this paper, an optical system was designed and developed for measuring the volume of liquid drops. The instrument was realized through a simple laser diode and a photoreceiver, and it is designed to be added on the typical intravenous infusion systems already present in the market, to constantly monitor the solution volumes with good accuracy and reliability. II. SYSTEM DESCRIPTION The design of the measuring system is based on the phenomena of reflection, refraction, and scattering of light that occurs as a result of the interaction of light with the
Transcript of Drop Measurement System for Biomedical Application

Drop Measurement System forBiomedical Application
Michele Norgia, Senior Member, IEEE, Alessandro Magnani, Dario Melchionni,and Alessandro Pesatori, Member, IEEE
I. INTRODUCTION
IN CLINICAL practice, infusion systems are verycommon [1]–[4]. They are utilized to administer
intravenous liquids and solutions to a patient. There are many different ways to administrate these medical liquids: via pumping systems [3] or using apparatuses that exploit the principle of drip by gravity. In these cases, there is a need for pumps specially built and regulated through electromechanical systems, with high performances in terms of precision of volume flowing out without any leakage. For this reason, these types of pumps have a very high cost of purchase, which when combined with the maintenance costs, makes their usage in hospitals very limited, preferring, where possible, the cheapest gravity drip systems.
The infusion technique most widely used is the intravenous therapy. The intravenous [6], [7] apparatus is very simple and low cost, and it is formed by an intravenous bag on a pole connected to intravenous lines and an infusion needle, as shown in Fig. 1. The outflow of the medicinal solution occurs through a drop chamber and a terminal: the former is the responsible for the descent of the liquid, by force of gravity, in the form of drops and the latter regulates the flow velocity. The dosage requires the administration of a precise amount of active principle, but it is customary to prescribe this quantity in terms of drop rate, called the drop factor.
The absence of electronic controls in the intravenous bags and the possibility of only a coarse adjustment of the drop
Manuscript received October 1, 2014; revised December 10, 2014; accepted January 8, 2015. Date of publication February 17, 2015; date of current version August 7, 2015
The authors are with the Dipartimento di Elettronica, Informazione e Bioingegneria, Politecnico di Milano, Milan 20133, Italy (e-mail: [email protected]).
Color versions of one or more of the figures in this paper are available online.
Fig. 1. Intravenous bags on a pole connected to the intravenous lines.
factor do not guarantee the administration of a precise amountof medication. It is also necessary to note that the dosagesexpressed in terms of drop factor do not consider severalfactors, such as morphological diversity of the drops; differentspeeds of the drop, variable in function of the amount ofliquid in the bottle; different temperatures and viscosities ofthe liquid; and different specific weights, according to thequantity of active principle dissolved in the physiologicalsubstance. Thus, it results of great interest to the study ofa system capable of making a low-cost intravenous dropsystem more accurate, maintaining the same ease of use andcost. Different strategies were implemented to address thisproblem: a capacitive system [8] or an optical mechanicalsystem [9], but no system had the sufficient accuracy androbustness to work. Specifically, in this paper, an opticalsystem was designed and developed for measuring the volumeof liquid drops. The instrument was realized through a simplelaser diode and a photoreceiver, and it is designed to be addedon the typical intravenous infusion systems already present inthe market, to constantly monitor the solution volumes withgood accuracy and reliability.
II. SYSTEM DESCRIPTION
The design of the measuring system is based on thephenomena of reflection, refraction, and scattering of lightthat occurs as a result of the interaction of light with the
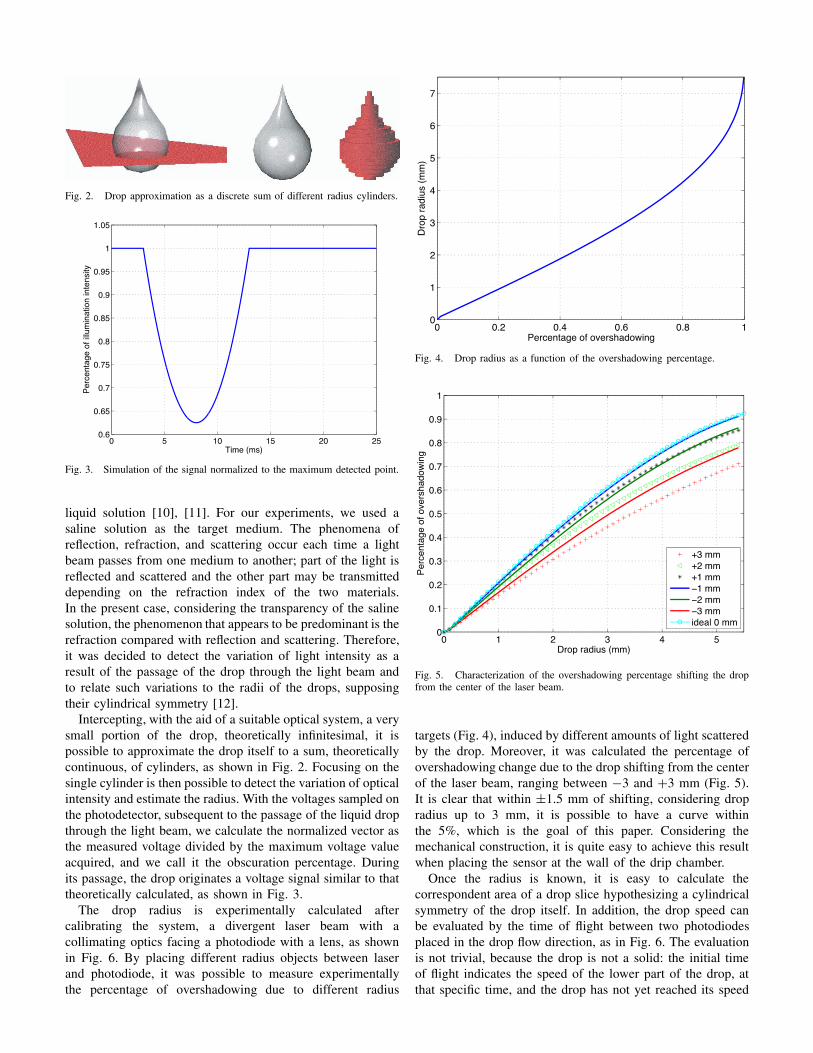
Fig. 2. Drop approximation as a discrete sum of different radius cylinders.
Fig. 3. Simulation of the signal normalized to the maximum detected point.
liquid solution [10], [11]. For our experiments, we used asaline solution as the target medium. The phenomena ofreflection, refraction, and scattering occur each time a lightbeam passes from one medium to another; part of the light isreflected and scattered and the other part may be transmitteddepending on the refraction index of the two materials.In the present case, considering the transparency of the salinesolution, the phenomenon that appears to be predominant is therefraction compared with reflection and scattering. Therefore,it was decided to detect the variation of light intensity as aresult of the passage of the drop through the light beam andto relate such variations to the radii of the drops, supposingtheir cylindrical symmetry [12].
Intercepting, with the aid of a suitable optical system, a verysmall portion of the drop, theoretically infinitesimal, it ispossible to approximate the drop itself to a sum, theoreticallycontinuous, of cylinders, as shown in Fig. 2. Focusing on thesingle cylinder is then possible to detect the variation of opticalintensity and estimate the radius. With the voltages sampled onthe photodetector, subsequent to the passage of the liquid dropthrough the light beam, we calculate the normalized vector asthe measured voltage divided by the maximum voltage valueacquired, and we call it the obscuration percentage. Duringits passage, the drop originates a voltage signal similar to thattheoretically calculated, as shown in Fig. 3.
The drop radius is experimentally calculated aftercalibrating the system, a divergent laser beam with acollimating optics facing a photodiode with a lens, as shownin Fig. 6. By placing different radius objects between laserand photodiode, it was possible to measure experimentallythe percentage of overshadowing due to different radius
Fig. 4. Drop radius as a function of the overshadowing percentage.
Fig. 5. Characterization of the overshadowing percentage shifting the dropfrom the center of the laser beam.
targets (Fig. 4), induced by different amounts of light scatteredby the drop. Moreover, it was calculated the percentage ofovershadowing change due to the drop shifting from the centerof the laser beam, ranging between −3 and +3 mm (Fig. 5).It is clear that within ±1.5 mm of shifting, considering dropradius up to 3 mm, it is possible to have a curve withinthe 5%, which is the goal of this paper. Considering themechanical construction, it is quite easy to achieve this resultwhen placing the sensor at the wall of the drip chamber.
Once the radius is known, it is easy to calculate thecorrespondent area of a drop slice hypothesizing a cylindricalsymmetry of the drop itself. In addition, the drop speed canbe evaluated by the time of flight between two photodiodesplaced in the drop flow direction, as in Fig. 6. The evaluationis not trivial, because the drop is not a solid: the initial timeof flight indicates the speed of the lower part of the drop, atthat specific time, and the drop has not yet reached its speed

Fig. 6. Design of a volume measurement system.
regime in air. For calculating the speed evolution during thefall, we considered two limit situation: the drop as a solid(all the sections moves at the same speed) and as completelyreleased shape (each section has its own speed independentof the other sections). These conditions lead to two differentcalculations of the speed for each drop section. We empiricallyfound the best approximation as a weighted averages betweenthe two cases. The coefficients of the averages have been foundexperimentally during the calibration described in Section IV.The measurement of the speed of single drop section plays afundamental role in the present discussion: in this way, it ispossible to calculate the height of the single cylinder and soto estimate the drop volume.
III. HARDWARE SETUP
To realize the described project, we must choose care-fully every single component of the setup. To reduce powerconsumption and the noise due to environmental light, sun-light, or artificial light sources, we decided to drive a laser(APCD 630, Roithner Lasertechnik, 650 nm) instead of a light-emitting diode in pulsed regime rather than in continuous one.
To facilitate the decoupling, during the light detection, ofthe useful from the unwanted light, it is necessary to makesome considerations. The sunlight in the short term is almostconstant: this behavior is thus similar to an offset in anelectrical point of view, and therefore, does not require specialconditions on the driving frequency of the light source. Theoptical sources, such as lamps, generate a light intensity thatis proportional to the square of the current that circulates inthem. Therefore, typically, they generate a spectral componentthat doubles the power line frequency.
To avoid this disturbance, it was decided to drive the sourcewith a working frequency of approximately 15 KHz and a dutycycle approximately equal to 10%, to scan correctly the dropradius. In fact, it takes a few milliseconds to the drop to travela few millimeters, the vertical drop dimension in front of thelight beam.
Afterward, it was studied with an optical system with thefewest number of optical elements, to lower the influence oftheir mechanical placement and the sensor cost.
This system, shown in Fig. 6, produces a large light beam.For reducing the light beam to a couple of lines on thephotodiodes, it is used a mechanical barrier with two slits.The quality of measured signal is still preserved as the lightbeam touching the two photodiodes is very thin.
Fig. 7. Signal acquired using one cylindrical lens measurement system.
Fig. 8. Signal measured by the two photodiodes during the falling of onedrop.
The system is realized using only two lenses, a convex lensand a cylindrical one. The first, with a diameter of 25 mm,is placed close to the drip point at a distance equal to thefocal distance from the light source; you get a light beam thatfollows the trend shown by the arrows, indicated as a drop,in Fig. 6. The cylindrical lens, with a diameter of 5 mm, hasthe task of laterally tightening the beam as in previous casesfocusing it on the photodiodes. To select two precise laserlines, the cylindrical lens is mounted on a special support withtwo slits in correspondence with the two photodiodes.
Fig. 7 shows an acquisition of the signal from the firstphotodiode, after an envelope detector, during the fall of a dropwith diameter of about 5 mm (the values are normalized to 1).The presented solution, realized by only two lenses, is capableof generating a light beam suitable to the purposes of theproject and solves the problem related to the bump shownin [13]: the light refracted by the drop is not collected by thetwo slits, and therefore, the drop generates a pure shadowingeffect, as observable from Fig. 7.
Fig. 8 shows an example of acquisition measured by the twophotodiodes after the envelope detector (the laser is pulsed).

Fig. 9. AC-coupled triggering circuits.
To synchronize the signal acquisition, a trigger signal isrealized through the circuits shown in Fig. 9: the peak signalis fed to a comparator through an ac coupling. In this way, thetrigger switches when the signal decreases to a certain amount,decided by the trimmer R8, independently of the dc level.This kind of triggering alleviates the mechanical and opticalrequirement: it works without the need for precise calibrationand even if the absolute light values changes due to laser agingor different transparencies of the employed drill chambers.
The system was tested through a data acquisition board(The National Instruments USB-6212, aggregate sampling rateof 400 kSa/s) with triggered acquisition. The final prototypewas realized with a DSPIC33 microcontroller (microchip).It drives the pulsed laser, acquires the signal from the twophotodiodes triggered by the circuit shown in Fig. 9, elaboratesthe data, and writes the results on a display.
IV. EXPERIMENTAL RESULTS
We make some volumetric measurements to calibrate thesystem and estimate the instrument accuracy. The calibrationmakes use of the data reported in Fig. 4, for calculatingthe radius of each drop section. To find the coefficients forthe weighted average between the fall as a solid and as acompletely free shape, we realized a measurement campaignfor different fall heights. Using an approximated drop speedevolution equal to 70% as free shape and 30% as a solid,the drop volume measurement becomes almost independentof the fall height and therefore of the initial speed; therefore,we implemented these coefficients in elaboration.
After the calibration of the instrument, we used a1-ml syringe filled with 1-ml of water, and we proceededto make the drip from the point prepared, as visible inthe photo of the prototype (Fig. 10), and a campaign ofone hundred measurements was performed. The results arereported in Fig. 11.
Subsequently, using the same calibration, fifty volumetricmeasurements were exploited also using a 2.5-ml syringe filledwith 2-ml of water (Fig. 12). In this way, it was possibleto verify the overall performance of the instrument also bychanging the drop dimensions very different between the
Fig. 10. Photo of the prototype.
Fig. 11. Acquisition histogram for a campaign of measurement done with adrop of about 0.04 ml for a volume of 1 ml. Thick line: normal distribution.
Fig. 12. Acquisition histogram for a campaign of measurement done with adrop of about 0.06 ml for a volume of 2 ml. Thick-line: normal distribution.
two syringes (about 0.04 ml for the first syringe and 0.06 mlfor the second one).
Observing the measurement results, reported in Table I,it was observed the repeatability of the measurement is guar-anteed. Small changes in the height of the point of drip donot affect the computation of the final volume. The measure-ments made with the 1-ml syringe are affected by increaseduncertainty for these reasons: the low number of drops passing

TABLE I
MEAN VALUE AND STANDARD DEVIATION OF THE
PERFORMED MEASUREMENTS
through the light beam, dependent on the total volume infused;the not precise vertical alignment of the syringe, function ofthe size of the small diameter of the syringe spout. It thenstates that the standard deviation relative to absolute volumeinfusions of 2 ml is estimated more accurately. To confirmthe robustness of the measurement technique adopted, weproceeded to do other measurements from a point of greaterheight than the previous ones, obtaining errors always below2%.
Finally, we performed different volumetric measurementson a continuous drop flow and also inside the plastic dripchamber shown in Fig. 10. We found an error below 2% forthe global volume between 10 and 100 ml and below 1% forthe volume higher than 100 ml. As expected, the drip chamberonly attenuates the laser signal, but do not affect the globalperformances. An error of 2% is indeed completely adequateto the application and is a good achievement, even if comparedwith the resolution of volumetric pumps.
V. CONCLUSION
The proposed volumetric sensor is based on themeasurement of the shadow induced by a drop duringits fall. After the campaign of measurements, it can be saidthat the principle of operation, though simple, proves to beof good precision (lower than 2% in infused volume) andadequate to the specific biomedical application. The realizedprototype is low cost, battery operated with very low powerconsumption (lower than 50 mW) and can be placed directlyto some commercial drip chambers. Future developmentsregard the complete engineering of the prototype verypromising for a future commercialized system.
REFERENCES
[1] G. Schenll, “Measurement of flow in infusion systems,” Med. BiologicalEng., vol. 35, no. 6, pp. 737–741, 1997.
[2] M. Husch et al., “Insights from the sharp end of intravenous medicationerrors: Implications for infusion pump technology,” Quality SafetyHealth Care, vol. 14, no. 2, pp. 80–86, 2005.
[3] S. T. Cho and K. D. Wise, “A high-performance microflowmeter withbuilt-in self test,” Sens. Actuators A, Phys., vol. 36, no. 1, pp. 47–56,1993.
[4] R. Ferrari, G. Ciddor, W. Cook, and W. Gilmore, “Reference dropdetector for infusion devices testing,” Med. Biological Eng. Comput.,vol. 32, no. 4, pp. 453–456, 1994.
[5] P. J. Blackshear, F. D. Dorman, P. L. Blackshear, Jr., R. L. Varco, andH. Buchwald, “The design and initial testing of an implantable infusionpump,” Surgery, Gynecol., Obstetrics, vol. 134, no. 1, pp. 51–56, 1972.
[6] M. Norgia, A. Pesatori, and L. Rovati, “Self-mixing laser doppler spectraof extracorporeal blood flow: A theoretical and experimental study,”IEEE Sensor J., vol. 12, no. 3, pp. 552–557, Mar. 2012.
[7] M. Norgia, A. Pesatori, and L. Rovati, “Low-cost optical flowmeter withanalog front-end electronics for blood extracorporeal circulators,” IEEETrans. Instrum. Meas., vol. 59, no. 5, pp. 1233–1239, May 2010.
[8] H. Brown and C. William Barnes, “Apparatus and methodfor measuring drop size in an intravenous drip chamber,”U.S. Patent 6 562 012, May 13, 2003.
[9] C. E. Lawler, Jr., “Drop volume measurement,” U.S. Patent 4 820 281,Apr. 11, 1989.
[10] M. Born and E. Wolf, Principles of Optics: Electromagnetic Theory ofPropagation, Interference and Diffraction of Light, 7th ed. Cambridge,U.K.: Cambridge Univ. Press, 1998, p. 985.
[11] M. Norgia and A. Pesatori, “Optical flow sensor through near-fieldgrating diffraction,” Sens. Actuators A, Phys., vol. 203, pp. 382–385,Dec. 2013.
[12] S. Donati, Electro-Optical Instrumentation: Sensing and Measuring WithLasers, 1st ed. Englewood Cliffs, NJ, USA: Prentice-Hall, 2004, p. 448.
[13] M. Norgia, A. Magnani, D. Melchionni, and A. Pesatori, “Optical systemfor drop volume measurement,” in Proc. I2MTC Conf., Montevideo,Uruguay, 2014, pp. 1322–1325.


![[14] Accelerator Mass Spectrometry for Biomedical …measurement of variousisotopes.(B) The1 MV accelerator mass spectrometry (AMS) system dedicated to the analysis of 14C in biomedical](https://static.fdocuments.in/doc/165x107/5f10edbbf5b3822f2b53dab7/14-accelerator-mass-spectrometry-for-biomedical-measurement-of-variousisotopesb.jpg)