Driving Renewable Energy Growth Through Effective Public ...
45
Driving Renewable Energy Growth Through Effective Public Policy A Financial and Policy Analysis of Cash Grants, Tax Credits and Pass-Through Tax Structures (MLPs and YieldCos) Ryan Buxbaum Undergraduate Honors Thesis Sanford School of Public Policy Duke University Durham, NC December 2014 Advisors: William Pizer and Donald Taylor
Transcript of Driving Renewable Energy Growth Through Effective Public ...
Driving Renewable Energy Growth Through Effective Public Policy
A Financial and Policy Analysis of Cash Grants, Tax Credits and Pass-Through Tax Structures (MLPs and YieldCos)
Ryan Buxbaum Undergraduate Honors Thesis
Sanford School of Public Policy Duke University
Durham, NC December 2014
Advisors: William Pizer and Donald Taylor

1
Acknowledgements
Thank you to my advisors, Professor William Pizer, and Professor Donald Taylor. Professor Pizer
served as a patient and essential voice of reason throughout the process, offering his encouraging support every
step of the way. Professor Pizer’s feedback and guidance played instrumental roles in crafting each version of
this thesis. I am grateful to have had the opportunity to collaborate with him. Professor Taylor facilitated a
constructive seminar environment as my peers and I navigated the undergraduate honors thesis process
throughout the past twelve-months. I am greatly appreciative for the support I received from both of my
advisors.
To my family, thank you for teaching me the value of service and citizenship. There is an old story of a
father and son walking up a mountain. The son turns to his father and says,
“Be careful where you walk, because I am following in your footsteps.”
As if words can suffice for a lifetime of inspiration and virtue: thank you for everything. To have the
opportunity to follow in the footsteps of my family remains one of the greatest privileges I have ever known.
2
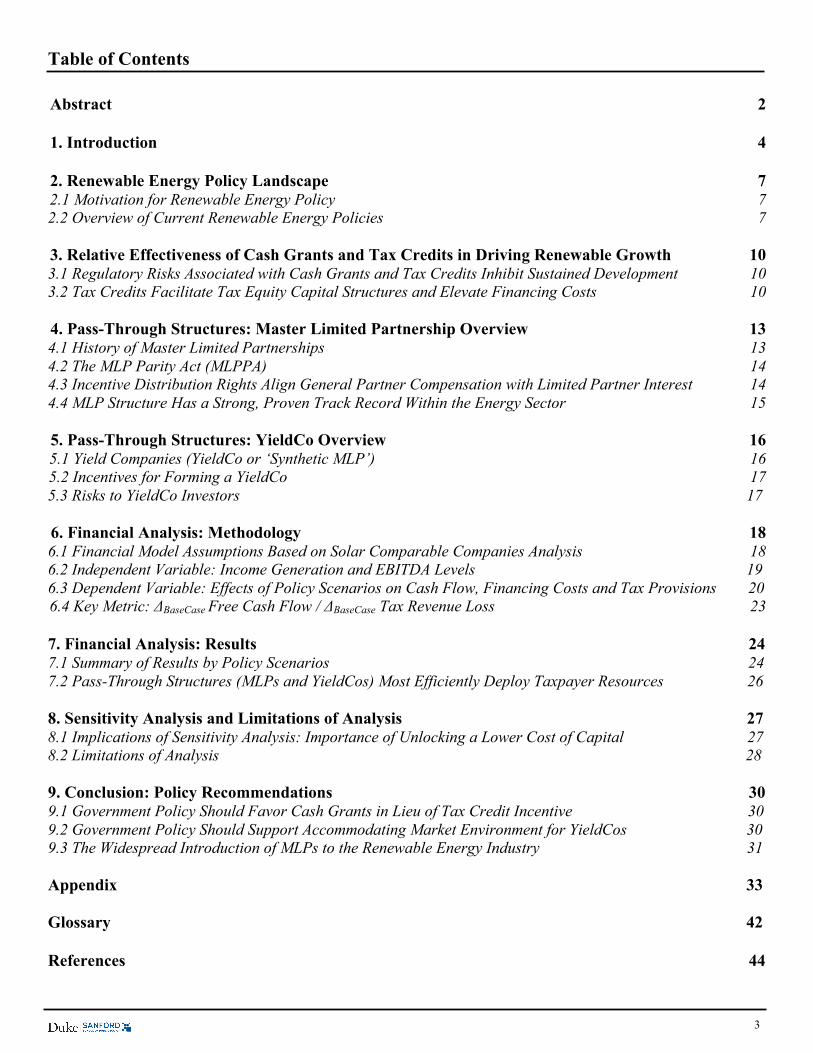
Abstract Energy and environmental concerns have motivated policymakers to support renewable energy
technology development through various tax policies. Currently, the majority of renewable energy projects in
the U.S. benefit from tax credit incentives. The associated tax equity financing structure has received criticism
for its inefficient use of taxpayer resources relative to other policies, including the Section 1603 Cash Grant.
The cash grant provided renewable energy developers with the option to receive a cash injection in lieu of the
prevailing tax credit during 2009 to 2011.
Conversely, renewable energy developers have begun to form dividend-oriented investment vehicles
that house renewable energy assets with long-term power purchase agreements in a manner that parallels the
master limited partnership (MLP) for conventional oil and gas companies. The relatively recent structure,
known as a YieldCo, has lowered financing costs while providing renewable developers with access to an
alternate investor base with a more competitive source of capital.
Through the contribution of a proprietary framework for evaluating the financial impact of various
public policies, this thesis seeks to evaluate the relative cost effectiveness of cash grants, tax credits and pass-
through tax structures (MLPs and YieldCos) in achieving government policy objectives. The financial model
helps determine how efficient each policy is in furthering renewable energy development for each dollar in
government tax expenditures. The analysis is supported by a sensitivity analysis of the parameters of the
financial model.
Although the financial model corroborated existing literature with regards to cash grants being
approximately twice as efficient as tax credit incentives, the financial analysis ultimately found pass-through
structures to be the most efficient policy solution for furthering renewable energy growth. The ancillary benefits
of the pass-through structure, including enhanced liquidity and borrowing cost improvements, propel the
business structure ahead of the other policy options in terms of their efficient use of taxpayer resources.
Government policy should support pass-through structures, either by facilitating market environments that
accommodate YieldCo growth or by legislating the widespread introduction of the MLP structure to the
renewable energy industry.
3
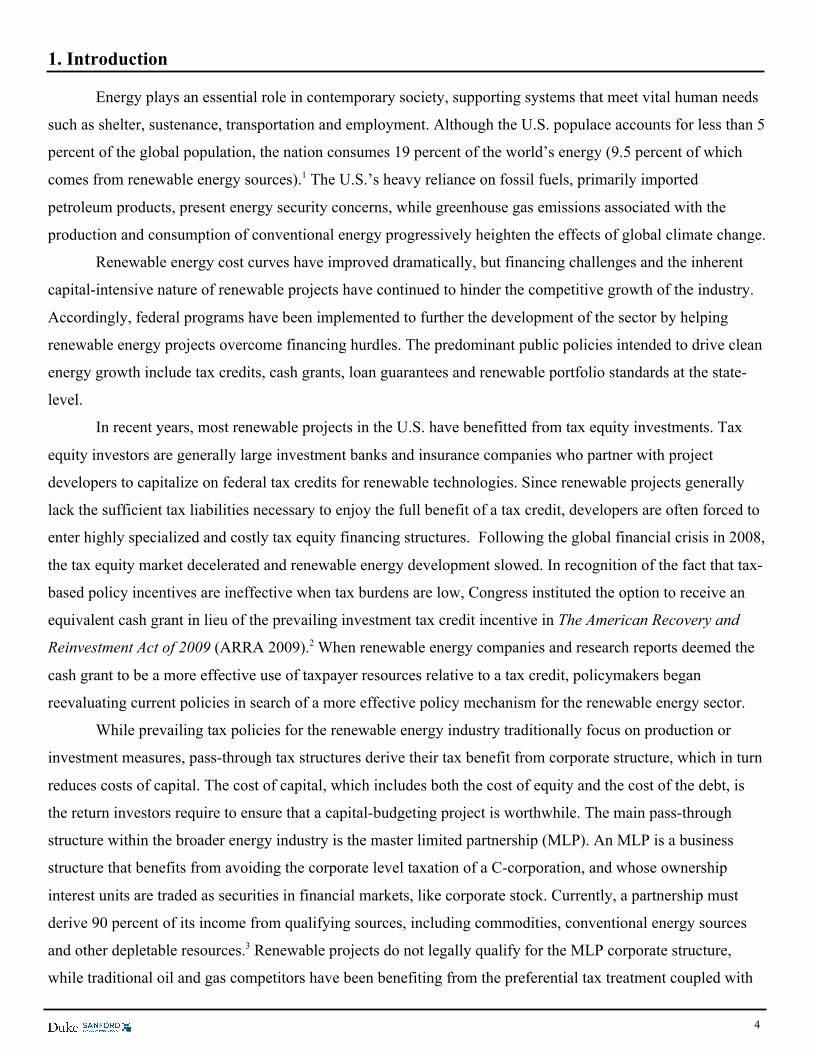
Table of Contents
Abstract 2 1. Introduction 4 2. Renewable Energy Policy Landscape 7 2.1 Motivation for Renewable Energy Policy 7 2.2 Overview of Current Renewable Energy Policies 7 3. Relative Effectiveness of Cash Grants and Tax Credits in Driving Renewable Growth 10 3.1 Regulatory Risks Associated with Cash Grants and Tax Credits Inhibit Sustained Development 10 3.2 Tax Credits Facilitate Tax Equity Capital Structures and Elevate Financing Costs 10 4. Pass-Through Structures: Master Limited Partnership Overview 13 4.1 History of Master Limited Partnerships 13 4.2 The MLP Parity Act (MLPPA) 14 4.3 Incentive Distribution Rights Align General Partner Compensation with Limited Partner Interest 14 4.4 MLP Structure Has a Strong, Proven Track Record Within the Energy Sector 15
5. Pass-Through Structures: YieldCo Overview 16 5.1 Yield Companies (YieldCo or ‘Synthetic MLP’) 16 5.2 Incentives for Forming a YieldCo 17 5.3 Risks to YieldCo Investors 17
6. Financial Analysis: Methodology 18 6.1 Financial Model Assumptions Based on Solar Comparable Companies Analysis 18 6.2 Independent Variable: Income Generation and EBITDA Levels 19 6.3 Dependent Variable: Effects of Policy Scenarios on Cash Flow, Financing Costs and Tax Provisions 20 6.4 Key Metric: ΔBaseCase Free Cash Flow / ΔBaseCase Tax Revenue Loss 23 7. Financial Analysis: Results 24 7.1 Summary of Results by Policy Scenarios 24 7.2 Pass-Through Structures (MLPs and YieldCos) Most Efficiently Deploy Taxpayer Resources 26 8. Sensitivity Analysis and Limitations of Analysis 27 8.1 Implications of Sensitivity Analysis: Importance of Unlocking a Lower Cost of Capital 27 8.2 Limitations of Analysis 28 9. Conclusion: Policy Recommendations 30 9.1 Government Policy Should Favor Cash Grants in Lieu of Tax Credit Incentive 30 9.2 Government Policy Should Support Accommodating Market Environment for YieldCos 30 9.3 The Widespread Introduction of MLPs to the Renewable Energy Industry 31 Appendix 33 Glossary 42 References 44
4
1. Introduction
Energy plays an essential role in contemporary society, supporting systems that meet vital human needs
such as shelter, sustenance, transportation and employment. Although the U.S. populace accounts for less than 5
percent of the global population, the nation consumes 19 percent of the world’s energy (9.5 percent of which
comes from renewable energy sources).1 The U.S.’s heavy reliance on fossil fuels, primarily imported
petroleum products, present energy security concerns, while greenhouse gas emissions associated with the
production and consumption of conventional energy progressively heighten the effects of global climate change.
Renewable energy cost curves have improved dramatically, but financing challenges and the inherent
capital-intensive nature of renewable projects have continued to hinder the competitive growth of the industry.
Accordingly, federal programs have been implemented to further the development of the sector by helping
renewable energy projects overcome financing hurdles. The predominant public policies intended to drive clean
energy growth include tax credits, cash grants, loan guarantees and renewable portfolio standards at the state-
level.
In recent years, most renewable projects in the U.S. have benefitted from tax equity investments. Tax
equity investors are generally large investment banks and insurance companies who partner with project
developers to capitalize on federal tax credits for renewable technologies. Since renewable projects generally
lack the sufficient tax liabilities necessary to enjoy the full benefit of a tax credit, developers are often forced to
enter highly specialized and costly tax equity financing structures. Following the global financial crisis in 2008,
the tax equity market decelerated and renewable energy development slowed. In recognition of the fact that tax-
based policy incentives are ineffective when tax burdens are low, Congress instituted the option to receive an
equivalent cash grant in lieu of the prevailing investment tax credit incentive in The American Recovery and
Reinvestment Act of 2009 (ARRA 2009).2 When renewable energy companies and research reports deemed the
cash grant to be a more effective use of taxpayer resources relative to a tax credit, policymakers began
reevaluating current policies in search of a more effective policy mechanism for the renewable energy sector.
While prevailing tax policies for the renewable energy industry traditionally focus on production or
investment measures, pass-through tax structures derive their tax benefit from corporate structure, which in turn
reduces costs of capital. The cost of capital, which includes both the cost of equity and the cost of the debt, is
the return investors require to ensure that a capital-budgeting project is worthwhile. The main pass-through
structure within the broader energy industry is the master limited partnership (MLP). An MLP is a business
structure that benefits from avoiding the corporate level taxation of a C-corporation, and whose ownership
interest units are traded as securities in financial markets, like corporate stock. Currently, a partnership must
derive 90 percent of its income from qualifying sources, including commodities, conventional energy sources
and other depletable resources.3 Renewable projects do not legally qualify for the MLP corporate structure,
while traditional oil and gas competitors have been benefiting from the preferential tax treatment coupled with
5
the liquidity of a publicly traded company for decades. The MLP Parity Act would provide the renewable
energy industry with the same advantageous tax status and with access to a larger pool of investors.
As the industry continues to mature, the market appetite for renewable investments continues to rise.
Accordingly, a handful of large renewable energy developers have begun to form Yield Companies (YieldCo),
an alternate pass-through structure known as ‘synthetic MLPs.’ Like MLPs, YieldCos also generate power
under long-term purchase agreements and distribute much of their cash flow to shareholders. The rise of the
YieldCo has further validated the pass-through structure and has incentivized developers to create yield-
oriented investment vehicles by offering exposure to an alternative investor pool with a more competitive
source of equity capital.
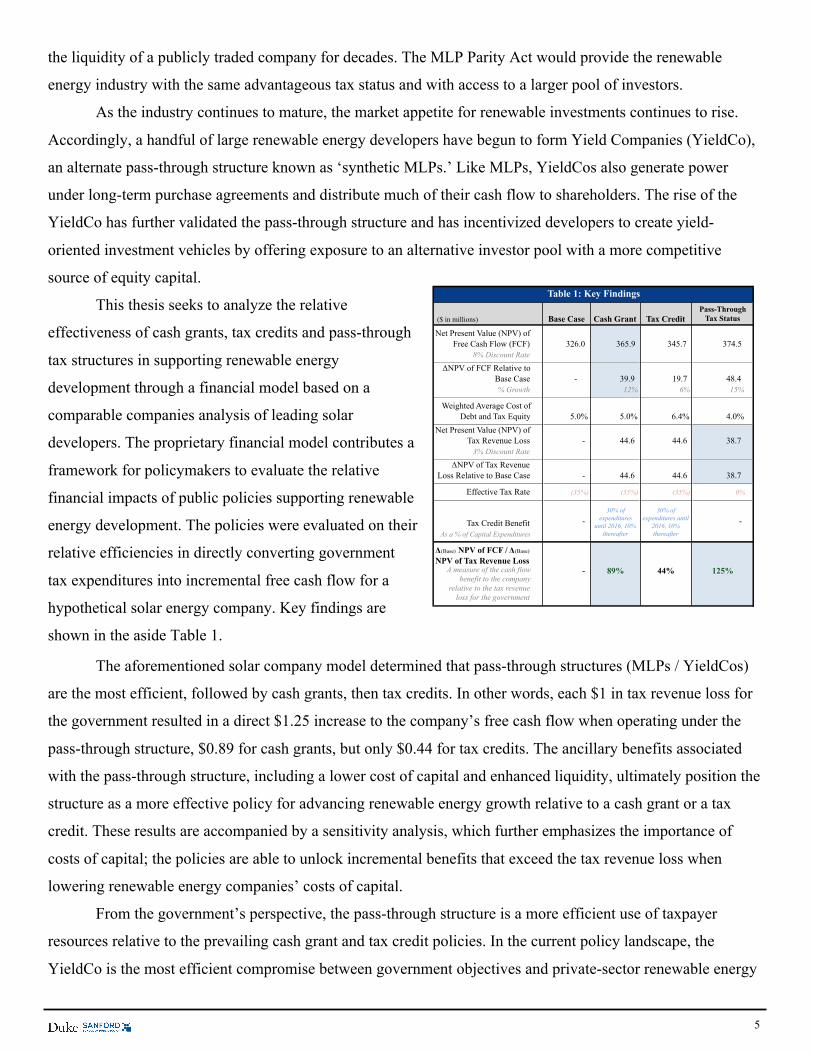
This thesis seeks to analyze the relative
effectiveness of cash grants, tax credits and pass-through
tax structures in supporting renewable energy
development through a financial model based on a
comparable companies analysis of leading solar
developers. The proprietary financial model contributes a
framework for policymakers to evaluate the relative
financial impacts of public policies supporting renewable
energy development. The policies were evaluated on their
relative efficiencies in directly converting government
tax expenditures into incremental free cash flow for a
hypothetical solar energy company. Key findings are
shown in the aside Table 1.
The aforementioned solar company model determined that pass-through structures (MLPs / YieldCos)
are the most efficient, followed by cash grants, then tax credits. In other words, each $1 in tax revenue loss for
the government resulted in a direct $1.25 increase to the company’s free cash flow when operating under the
pass-through structure, $0.89 for cash grants, but only $0.44 for tax credits. The ancillary benefits associated
with the pass-through structure, including a lower cost of capital and enhanced liquidity, ultimately position the
structure as a more effective policy for advancing renewable energy growth relative to a cash grant or a tax
credit. These results are accompanied by a sensitivity analysis, which further emphasizes the importance of
costs of capital; the policies are able to unlock incremental benefits that exceed the tax revenue loss when
lowering renewable energy companies’ costs of capital.
From the government’s perspective, the pass-through structure is a more efficient use of taxpayer
resources relative to the prevailing cash grant and tax credit policies. In the current policy landscape, the
YieldCo is the most efficient compromise between government objectives and private-sector renewable energy
($ in millions) Base Case Cash Grant Tax Credit
Net Present Value (NPV) of Free Cash Flow (FCF) 326.0 365.9 345.7 374.5
8% Discount Rate
ΔNPV of FCF Relative to Base Case - 39.9 19.7 48.4 % Growth 12% 6% 15%
Weighted Average Cost of Debt and Tax Equity 5.0% 5.0% 6.4% 4.0%
Net Present Value (NPV) of Tax Revenue Loss - 44.6 44.6 38.7
3% Discount Rate
ΔNPV of Tax Revenue Loss Relative to Base Case - 44.6 44.6 38.7
aEffective Tax Rate (35%) (35%) (35%) 0%
Tax Credit BenefitAs a % of Capital Expenditures
Δ(Base) NPV of FCF / Δ(Base) NPV of Tax Revenue Loss
Table 1: Key Findings
A measure of the cash flow benefit to the company
relative to the tax revenue loss for the government
- 89% 44% 125%
- - 30% of
expenditures until 2016, 10%
thereafter
30% of expenditures until
2016, 10% thereafter
Pass-Through Tax Status

6
growth. Accordingly, policymakers should further encourage renewable developers to benefit from pass-
through structures, either through supporting YieldCos or by passing the MLP Parity Act.
7
2. Renewable Energy Policy Landscape
2.1 Motivation for Renewable Energy Public Policy
Throughout much of American history, commerce and industrial energy needs were met entirely from
domestic reserves, as the United States contains an abundant supply of natural resources. However, a robust,
growing economy fueled by rapid industrialization and population growth eventually fostered the need to enlist
foreign energy sources to supplement domestic supplies.4 The implications of such dependence on foreign
energy importation, coupled with price volatility concerns driven by supply fluctuations, have underpinned the
importance of reliable energy sources in U.S. public policy discourse.
Since the 1970s, U.S. energy tax policy has sought to achieve two broad objectives. First, policymakers
have attempted to reduce dependence on oil imports by enhancing domestic energy investments and production
tax subsidies.28 Second, environmental concerns have resulted in tax code benefits for a variety of renewable
and energy efficiency technologies. The Obama Administration has since continued to stress the importance of
investments in renewable energy projects and infrastructure. As President Obama noted in his 2011 State of the
Union Address, clean energy investments can strengthen domestic energy security, facilitate job creation and
support environmental goals.5 Yet, the U.S. currently remains heavily reliant on fossil fuel energy sources. In
2011, approximately 48 percent of electricity was produced from coal-burning power plants.4
2.2 Overview of Current Renewable Energy Policies
Federal programs have been implemented to help capital-intensive renewable energy projects overcome
financing hurdles and further the development of the industry. The primary, federal policy mechanisms
encompass tax incentives and cash grants. Recent public policies that offer direct or indirect forms of financial
support to promote the large-scale commercialization of renewable energy technologies include:
(1) Investment Tax Credit (ITC),
(2) Section 1603 Cash Grant,
(3) Production Tax Credit (PTC),
(4) Department of Energy Loan Guarantee Program and
(5) Renewable Portfolio Standards (State-Level Policy)
Investment Tax Credit (ITC)
Although the ITC was first legislated to increase production of oil and natural gas, the oil embargo of
1973 and the Iranian Revolution ultimately led to a policy shift towards conservation and alternative energy. As
a result, the Energy Tax Act of 1978 first established ITCs for renewable energy.9 The current ITC is available
to a variety of renewable energy technologies (including solar, fuel cells, small wind turbines, geothermal
8
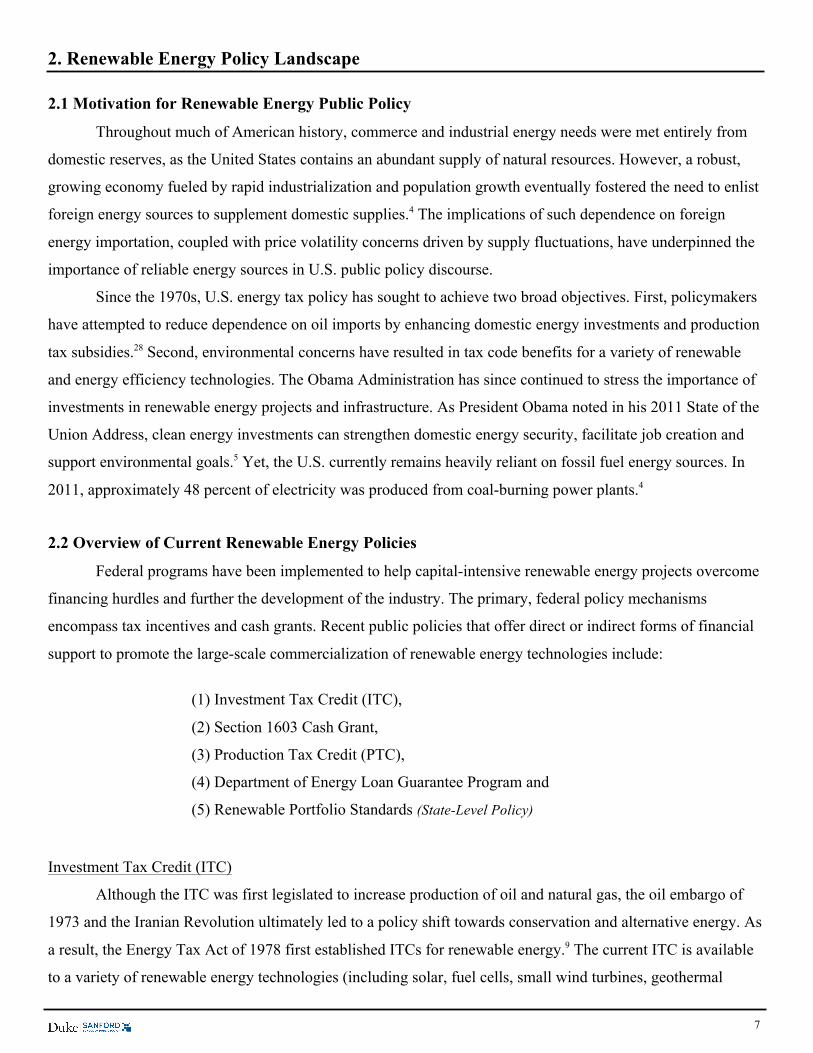
systems, micro-turbines and combined heat and power), from now through December 31, 2016.9 For solar
projects, the ITC is equal to 30 percent of total expenditures, with no maximum credit limit, but the credit
amount is expected to step down to 10 percent of expenditures in 2017. Contrary to the PTC, the ITC is not
linked to the actual generative performance of the project, but rather is derived from capital investments in
property and equipment. The JCT estimates that the ITC will generate $2.3 billion in tax revenue losses over the
2011 to 2015 budget window, nearly all of which is due to solar technology investments.10 The ITC has been
criticized for its inefficient use of taxpayer resources; the consequential tax equity financing structure often
prevents government tax expenditures from directly achieving its goal of driving renewable energy growth.
Section 1603 Cash Grant
Following the global financial crisis in 2008, tax equity investors were facing liquidity constraints, as
both the tax equity market and renewable energy development slowed. In order to fill the investment gap in
renewable energy markets, Congress established the Section 1603 Cash Grant in the ARRA 2009.2 The Section
1603 Cash Grant, which was authorized between 2009 and 2011, offered eligible renewable energy developers
with a cash grant equivalent to 30 percent of a project’s total eligible cost basis in place of the traditional ITC
incentive.11 During its tenure, the Section 1603 program funded $21.6 billion to over 95,000 projects, while
installing 29.6 GW in new electricity capacity.11
Production Tax Credit (PTC)
The Energy Policy Act of 1992 established the Renewable Electricity Production Tax Credit (PTC) as a
primary federal incentive for renewables. Although solar thermal is a qualifying technology under the PTC, the
policy has generally targeted wind energy projects in practice.6 The PTC is a per-kilowatt-hour tax credit
received by qualifying energy technologies for electricity generation. Therefore, the benefit of the PTC is
directly linked with project performance. In addition to wind technologies, the federal tax credit was extended
to also include biomass, geothermal, landfill gas, municipal solid waste, qualifying hydroelectric, and marine
Resource Type In Service Deadline Credit Amount
Solar December 31, 2016Fuel Cells December 31, 2016Small Wind Turbines December 31, 2016Geothermal Systems December 31, 2016Microturbines December 31, 2016Combined Heat and Power (CHP) December 31, 2016
Source: U.S. Department of Energy (DOE)
10% of expenditures
10% of expenditures
Table 2: Business Energy Investment Tax Credit (ITC)
30% of expenditures
30% of expenditures
30% of expenditures
10% of expenditures
9
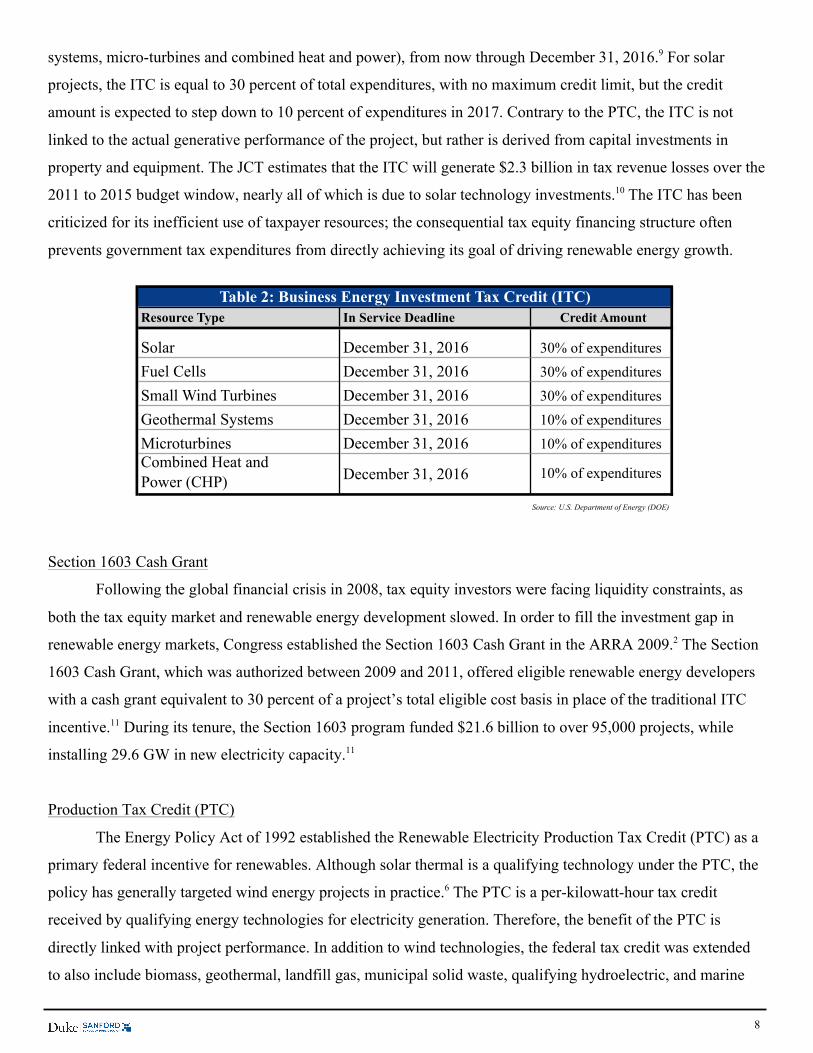
and hydrokinetic power generation.6 Prior to the PTC’s construction deadline on December 31, 2013, wind
projects received a 2.3¢ per-kilowatt-hour credit. Including the current lapse, the PTC has expired four times
during the past 15 years, leading to subsequent boom-and-bust investment cycles in wind energy.7
Department of Energy (DOE) Loan Guarantee Program
Title XVII of the Energy Policy Act of 2005 authorizes the DOE to provide support for innovative clean
energy technologies through loan guarantees.12 In a loan guarantee agreement, the federal government pledges
to cover the full debt obligation of a loan in the event of a borrower default, which materially reduces the
borrowing costs for the loan guarantee recipient. Federal loan guarantees fill a unique gap in the market by
increasing investments to clean energy projects that otherwise may not have been able to procure private sector
financing. The DOE program has authorized $32.4 billion in loan guarantees to companies including Tesla
Motors, Inc. and Solyndra, Inc.12 The Loan Guarantee Program helped establish one of the world’s largest wind
farms, the largest concentrated solar power plant in the world and the largest utility scale photovoltaic
generation facility.12 In December 2013, the DOE issued a solicitation for applications from qualifying
Advanced Fossil Energy Projects; under this solicitation, the DOE is authorized to grant loan guarantees
through November 30, 2016.13
Renewable Portfolio Standards (State-Level Policy)
A renewable portfolio standard (RPS) is a regulatory mandate, currently only at the state-level, to
increase energy production from renewable and other alternative energy sources to fossil and nuclear
generation. Currently, 29 states and Washington, D.C. have renewable portfolio standards, while 9 states have
renewable portfolio goals.14 RPSs are common at that state-level, and in some European countries, and are most
effective in driving renewable energy growth when coupled with accommodating federal policies (e.g. PTC).
Resource Type Begin Construction Deadline Credit Amount
Wind December 31, 2013 2.3¢/kWhClosed-Loop Biomass December 31, 2013 2.3¢/kWhOpen-Loop Biomass December 31, 2013 1.1¢/kWhGeothermal Energy December 31, 2013 2.3¢/kWhLandfill Gas December 31, 2013 1.1¢/kWhMunicipal Solid Waste December 31, 2013 1.1¢/kWhQualified Hydroelectric December 31, 2013 1.1¢/kWhMarine and Hydrokinetic (150 kW or larger) December 31, 2013 1.1¢/kWh
Source: U.S. Department of Energy (DOE)
Table 3: Renewable Energy Production Tax Credit (PTC)
10
3. Relative Effectiveness of Cash Grants and Tax Credits in Driving Renewable Growth This section aims to analyze the relative efficiencies of current public policies within the clean energy
sector, building on existing literature. Although current policies have helped grow total renewable energy
capacity, concerns persist regarding the consistent stability of recent public policies, the complexity of the tax
equity structure and the inefficiencies of the PTC and ITC relative to the Section 1603 Cash Grant.
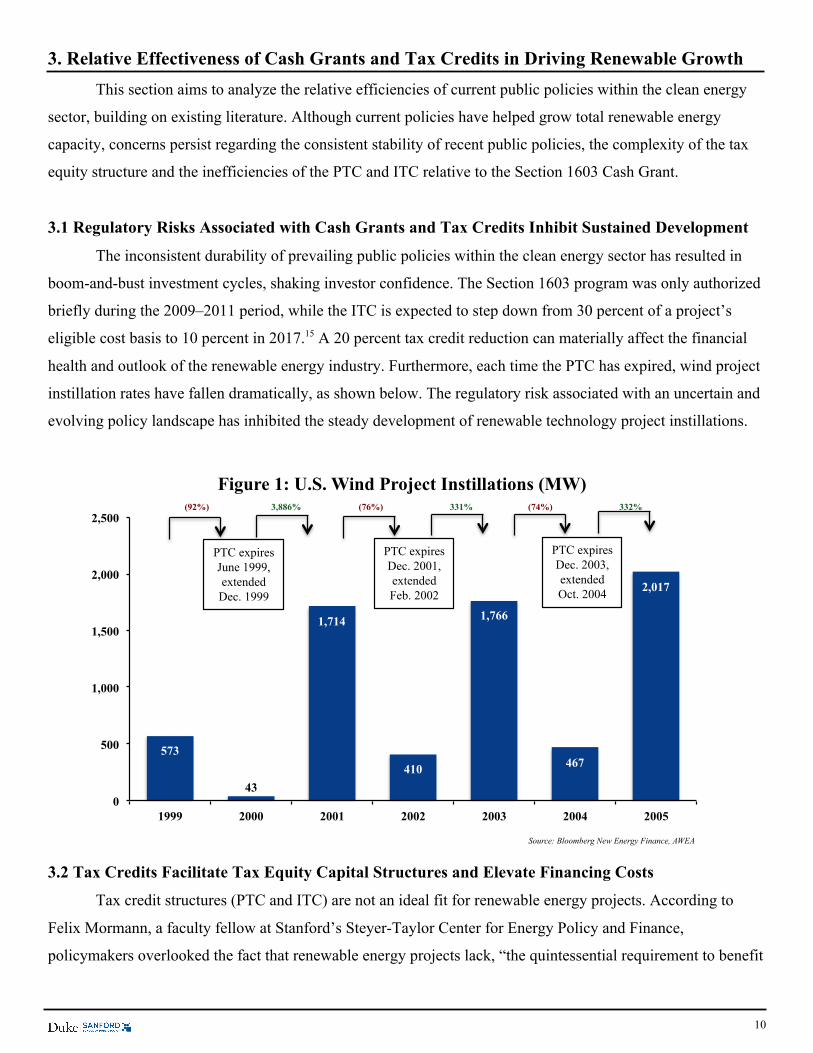
3.1 Regulatory Risks Associated with Cash Grants and Tax Credits Inhibit Sustained Development
The inconsistent durability of prevailing public policies within the clean energy sector has resulted in
boom-and-bust investment cycles, shaking investor confidence. The Section 1603 program was only authorized
briefly during the 2009–2011 period, while the ITC is expected to step down from 30 percent of a project’s
eligible cost basis to 10 percent in 2017.15 A 20 percent tax credit reduction can materially affect the financial
health and outlook of the renewable energy industry. Furthermore, each time the PTC has expired, wind project
instillation rates have fallen dramatically, as shown below. The regulatory risk associated with an uncertain and
evolving policy landscape has inhibited the steady development of renewable technology project instillations.
3.2 Tax Credits Facilitate Tax Equity Capital Structures and Elevate Financing Costs
Tax credit structures (PTC and ITC) are not an ideal fit for renewable energy projects. According to
Felix Mormann, a faculty fellow at Stanford’s Steyer-Taylor Center for Energy Policy and Finance,
policymakers overlooked the fact that renewable energy projects lack, “the quintessential requirement to benefit
Source: Bloomberg New Energy Finance, AWEA
573
43
1,714
410
1,766
467
2,017
0
500
1,000
1,500
2,000
2,500
1999 2000 2001 2002 2003 2004 2005
Figure 1: U.S. Wind Project Instillations (MW)
PTC expires Dec. 2001, extended Feb. 2002
PTC expires Dec. 2003, extended Oct. 2004
PTC expires June 1999, extended
Dec. 1999
(92%) 3,886% (76%) 331% (74%) 332%

11
from tax credits.”15 This quintessential requirement is a high enough tax bill to offset the tax credits. Most
renewable energy developers are either small in size or lack sufficient profitability to generate adequate tax
liabilities and reap the full benefits of the tax credit. Renewable projects have been incentivized to lower their
tax burdens even further to benefit from the Modified Accelerated Cost Recovery System (MACRS), which
enables developers to depreciate their project values on an accelerated five-year timetable.16 The accelerated
depreciation timetable allows companies to lower their Generally Accepted Accounting Principles (GAAP) Pre-
Tax Income, resulting in a lower tax provision or, in the presence of a net operating loss (NOL), an offsetting
tax benefit in the future.
Consequently, a specialized pool of third-party tax equity investors, primarily investment banks and
insurance companies led by JP Morgan and GE Capital, stepped in to provide tax equity financing in exchange
for interest payments and the tax credit benefit. A tax equity investment can help the project grow, allowing the
developer to incur larger tax liabilities and, consequently, more tax benefits. There have only been
approximately two-dozen sophisticated and highly profitable investors that are willing and able to provide tax
equity investments to renewable energy projects, and the market demand is highly cyclical.15 During the recent
global economic recession, the number of tax equity investors shrank to 11 investors from the already low pool
of around 20, as the tax equity investment market shrunk by over 80 percent (from $6.1 billion in 2007 to $1.2
billion in 2009).15 Following the financial crisis, the tax equity market rebounded to $6 billion in deal volume
for solar and wind projects in fiscal year 2011, but there are still less than 20 total investors in the tax equity
market.15 Due to the fact that a relatively small fraction of the greater investment community participates in the
tax equity market, project developers compete over a tight supply of potential tax equity investment. A power
imbalance protrudes between tax equity investors and project developers, which enables investors to secure
favorable deal terms. Consequently, the large financial firms are able to collect a 7+ percent share on each
dollar of tax expenditure associated with renewable energy projects.27 In addition, a tax equity investor must be
confident that a company is willing to produce tax liabilities through the maturity of the tax equity facility.
Accordingly, the risk and term structures associated with tax equity investments increase a project’s financing
costs above traditional debt financing levels.
In response to the halt in the tax equity market during the global financial crisis, Congress established
the Section 1603 Cash Grant program in ARRA 2009. The program enabled renewable energy companies to
receive an equivalent cash grant in lieu of the prevailing ITC incentive. Renewable projects were now faced
with the option to choose between the two policies. Consequently, the National Commission on Energy Policy
commissioned Bloomberg New Energy Finance (BNEF) to analyze the effectiveness of the ITC and PTC in
driving renewable energy growth relative to the Section 1603 Cash Grant. The study sought to determine which
policy deploys taxpayer resources in the most efficient manner by measuring capacity instillation additions
relative to government tax expenditures. During 2005–2008 there were nearly 19 GW of new wind capacity
12
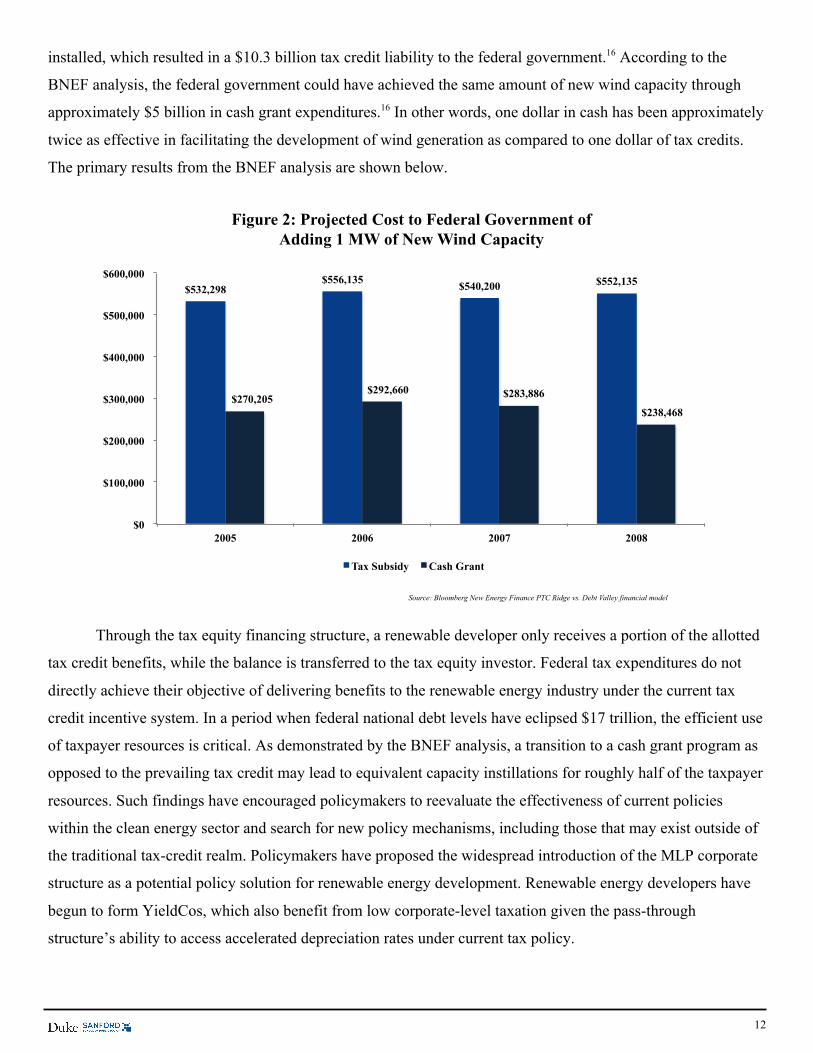
installed, which resulted in a $10.3 billion tax credit liability to the federal government.16 According to the
BNEF analysis, the federal government could have achieved the same amount of new wind capacity through
approximately $5 billion in cash grant expenditures.16 In other words, one dollar in cash has been approximately
twice as effective in facilitating the development of wind generation as compared to one dollar of tax credits.
The primary results from the BNEF analysis are shown below.
Through the tax equity financing structure, a renewable developer only receives a portion of the allotted
tax credit benefits, while the balance is transferred to the tax equity investor. Federal tax expenditures do not
directly achieve their objective of delivering benefits to the renewable energy industry under the current tax
credit incentive system. In a period when federal national debt levels have eclipsed $17 trillion, the efficient use
of taxpayer resources is critical. As demonstrated by the BNEF analysis, a transition to a cash grant program as
opposed to the prevailing tax credit may lead to equivalent capacity instillations for roughly half of the taxpayer
resources. Such findings have encouraged policymakers to reevaluate the effectiveness of current policies
within the clean energy sector and search for new policy mechanisms, including those that may exist outside of
the traditional tax-credit realm. Policymakers have proposed the widespread introduction of the MLP corporate
structure as a potential policy solution for renewable energy development. Renewable energy developers have
begun to form YieldCos, which also benefit from low corporate-level taxation given the pass-through
structure’s ability to access accelerated depreciation rates under current tax policy.
Source: Bloomberg New Energy Finance PTC Ridge vs. Debt Valley financial model
$532,298 $556,135 $540,200 $552,135
$270,205 $292,660 $283,886
$238,468
$0
$100,000
$200,000
$300,000
$400,000
$500,000
$600,000
2005 2006 2007 2008
Figure 2: Projected Cost to Federal Government of Adding 1 MW of New Wind Capacity
Tax Subsidy Cash Grant
13
4. Pass-Through Structures: Master Limited Partnership Overview
4.1 History of Master Limited Partnerships
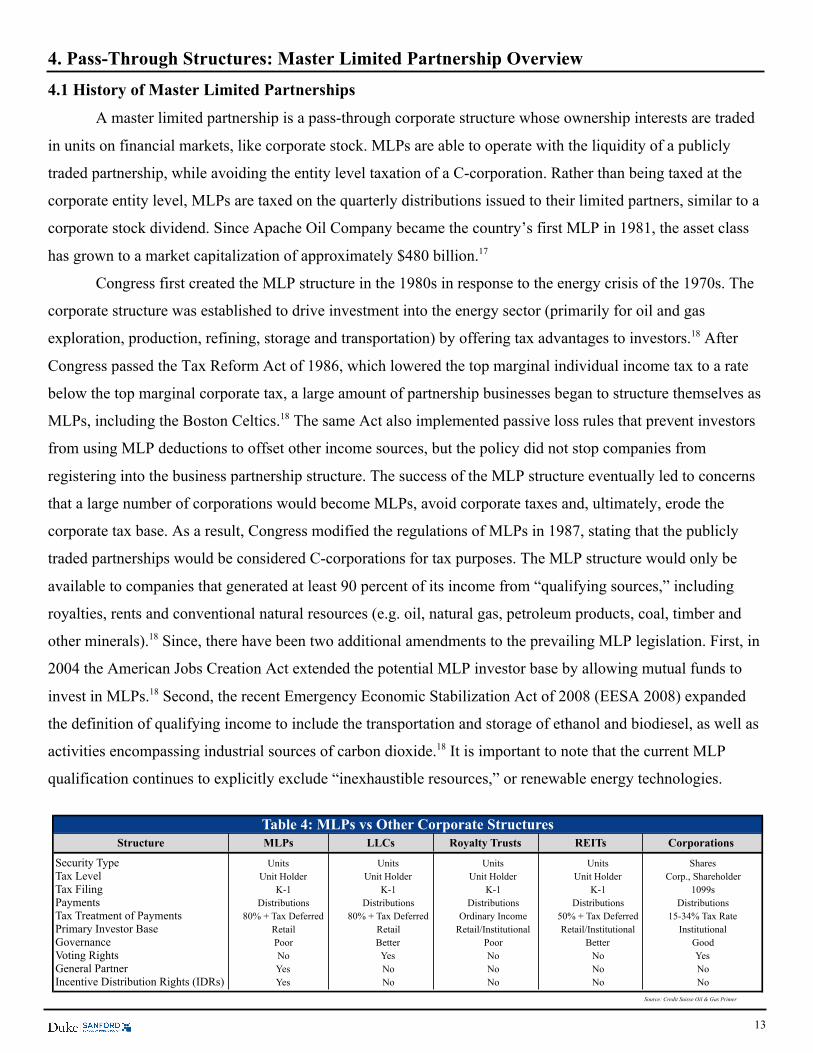
A master limited partnership is a pass-through corporate structure whose ownership interests are traded
in units on financial markets, like corporate stock. MLPs are able to operate with the liquidity of a publicly
traded partnership, while avoiding the entity level taxation of a C-corporation. Rather than being taxed at the
corporate entity level, MLPs are taxed on the quarterly distributions issued to their limited partners, similar to a
corporate stock dividend. Since Apache Oil Company became the country’s first MLP in 1981, the asset class
has grown to a market capitalization of approximately $480 billion.17
Congress first created the MLP structure in the 1980s in response to the energy crisis of the 1970s. The
corporate structure was established to drive investment into the energy sector (primarily for oil and gas
exploration, production, refining, storage and transportation) by offering tax advantages to investors.18 After
Congress passed the Tax Reform Act of 1986, which lowered the top marginal individual income tax to a rate
below the top marginal corporate tax, a large amount of partnership businesses began to structure themselves as
MLPs, including the Boston Celtics.18 The same Act also implemented passive loss rules that prevent investors
from using MLP deductions to offset other income sources, but the policy did not stop companies from
registering into the business partnership structure. The success of the MLP structure eventually led to concerns
that a large number of corporations would become MLPs, avoid corporate taxes and, ultimately, erode the
corporate tax base. As a result, Congress modified the regulations of MLPs in 1987, stating that the publicly
traded partnerships would be considered C-corporations for tax purposes. The MLP structure would only be
available to companies that generated at least 90 percent of its income from “qualifying sources,” including
royalties, rents and conventional natural resources (e.g. oil, natural gas, petroleum products, coal, timber and
other minerals).18 Since, there have been two additional amendments to the prevailing MLP legislation. First, in
2004 the American Jobs Creation Act extended the potential MLP investor base by allowing mutual funds to
invest in MLPs.18 Second, the recent Emergency Economic Stabilization Act of 2008 (EESA 2008) expanded
the definition of qualifying income to include the transportation and storage of ethanol and biodiesel, as well as
activities encompassing industrial sources of carbon dioxide.18 It is important to note that the current MLP
qualification continues to explicitly exclude “inexhaustible resources,” or renewable energy technologies.
Structure
Security Type Units Units Units SharesTax Level Unit Holder Unit Holder Unit Holder Unit Holder Corp., ShareholderTax Filing K-1 K-1 K-1 K-1 1099sPayments Distributions Distributions Distributions Distributions DistributionsTax Treatment of Payments 80% + Tax Deferred 80% + Tax Deferred Ordinary Income 50% + Tax Deferred 15-34% Tax RatePrimary Investor Base Retail Retail Retail/Institutional Retail/Institutional InstitutionalGovernance Poor Better Poor Better GoodVoting Rights No Yes No No YesGeneral Partner Yes No No No NoIncentive Distribution Rights (IDRs) Yes No No No No
Source: Credit Suisse Oil & Gas Primer
Units
Table 4: MLPs vs Other Corporate StructuresMLPs LLCs Royalty Trusts REITs Corporations
14
4.2 The MLP Parity Act (MLPPA)
Policymakers have proposed a potential change in the qualifying criteria for MLPs to include renewable
energy technologies. The widespread introduction of MLPs to the renewable energy industry can be legislated
through changes to the qualifying income criteria in a manner that parallels the qualification expansions in the
aforementioned EESA 2008. U.S. Senator Chris Coons (D-DE) has spearheaded the effort behind the MLPPA,
which would amend such qualifications. Senator Coons views the bill as a means to “level the playing field” by
granting renewable energy developers with access to the tax and financing advantages their fossil fuel-based
counterparts have been experiencing for decades.19 The bill initially received bipartisan co-sponsorship and, in
September 2012, was referred to the Committee on Finance; however, some critics have indicated that they
would not support the MLPPA until tax credit incentives for renewable energy projects are eliminated.17 Senator
Coons opposed the elimination of the PTC and ITC in exchange for MLPPA support, and the bill has since
remained trapped in committee.20
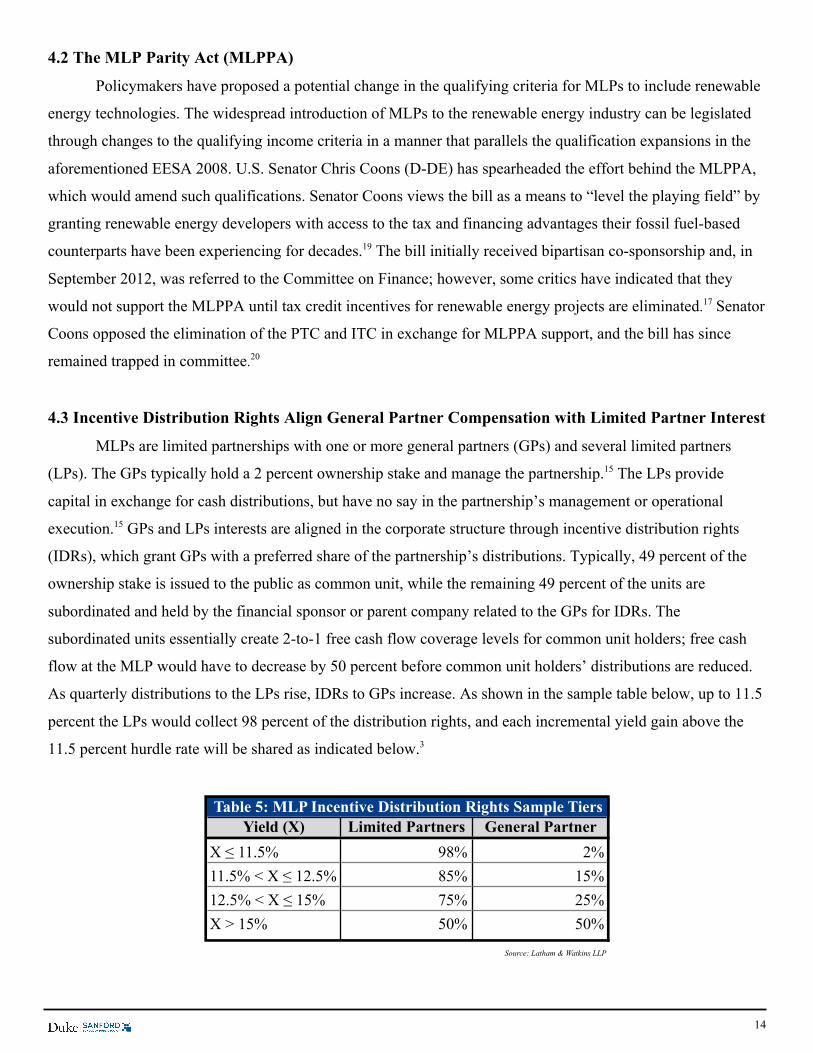
4.3 Incentive Distribution Rights Align General Partner Compensation with Limited Partner Interest
MLPs are limited partnerships with one or more general partners (GPs) and several limited partners
(LPs). The GPs typically hold a 2 percent ownership stake and manage the partnership.15 The LPs provide
capital in exchange for cash distributions, but have no say in the partnership’s management or operational
execution.15 GPs and LPs interests are aligned in the corporate structure through incentive distribution rights
(IDRs), which grant GPs with a preferred share of the partnership’s distributions. Typically, 49 percent of the
ownership stake is issued to the public as common unit, while the remaining 49 percent of the units are
subordinated and held by the financial sponsor or parent company related to the GPs for IDRs. The
subordinated units essentially create 2-to-1 free cash flow coverage levels for common unit holders; free cash
flow at the MLP would have to decrease by 50 percent before common unit holders’ distributions are reduced.
As quarterly distributions to the LPs rise, IDRs to GPs increase. As shown in the sample table below, up to 11.5
percent the LPs would collect 98 percent of the distribution rights, and each incremental yield gain above the
11.5 percent hurdle rate will be shared as indicated below.3
Yield (X) Limited Partners General Partner
X ≤ 11.5% 98% 2%11.5% < X ≤ 12.5% 85% 15%12.5% < X ≤ 15% 75% 25%X > 15% 50% 50%
Source: Latham & Watkins LLP
Table 5: MLP Incentive Distribution Rights Sample Tiers
15
MLPs often pay out virtually all of their distributable cash flows to LPs, except for the capital that
management considers necessary to conduct and grow business operations. Although the IDR structure
increases the likelihood that the parent-GP will ensure that the MLP reaches its dividend growth targets for LPs,
“high split,” IDRs can be problematic for the partnership. In high split IDR situations, the GP can claim 50
percent of incremental cash distributed by the MLP, stifling growth and burdening cash flow generation. The
IDRs incentivize GPs to grow distribution yields for LPs, but may increase the cost of capital in the long run, as
each new distribution must generate sufficient returns to cover both GP and LP shares.
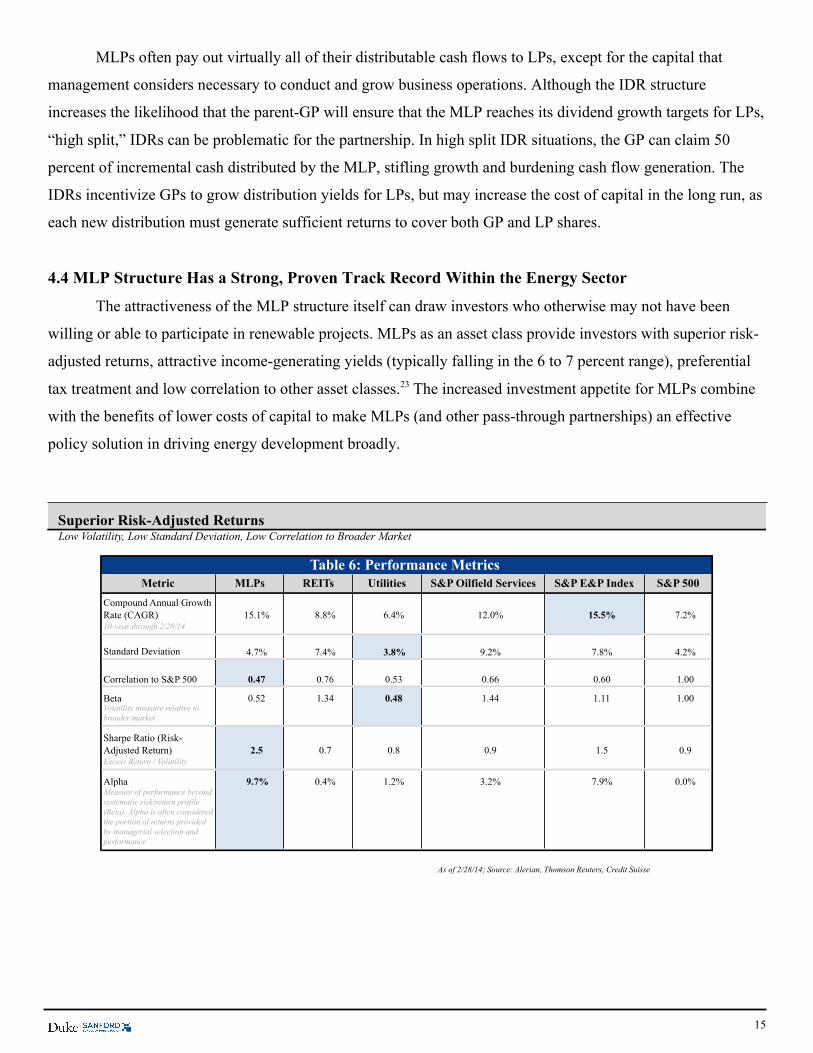
4.4 MLP Structure Has a Strong, Proven Track Record Within the Energy Sector
The attractiveness of the MLP structure itself can draw investors who otherwise may not have been
willing or able to participate in renewable projects. MLPs as an asset class provide investors with superior risk-
adjusted returns, attractive income-generating yields (typically falling in the 6 to 7 percent range), preferential
tax treatment and low correlation to other asset classes.23 The increased investment appetite for MLPs combine
with the benefits of lower costs of capital to make MLPs (and other pass-through partnerships) an effective
policy solution in driving energy development broadly.
Superior Risk-Adjusted Returns Low Volatility, Low Standard Deviation, Low Correlation to Broader Market
Metric
Compound Annual Growth Rate (CAGR) 15.1% 8.8% 6.4% 12.0% 15.5% 7.2%10-year through 2/28/14
Standard Deviation 4.7% 7.4% 3.8% 9.2% 7.8% 4.2%
Correlation to S&P 500 0.47 0.76 0.53 0.66 0.60 1.00
Beta 0.52 1.34 0.48 1.44 1.11 1.00Volatility measure relative to broader market
Sharpe Ratio (Risk-Adjusted Return) 2.5 0.7 0.8 0.9 1.5 0.9Excess Return / Volatility
Alpha 9.7% 0.4% 1.2% 3.2% 7.9% 0.0%Measure of performance beyond systematic risk/return profile (Beta). Alpha is often considered the portion of returns provided by managerial selection and performance
As of 2/28/14; Source: Alerian, Thomson Reuters, Credit Suisse
Table 6: Performance Metrics MLPs REITs Utilities S&P Oilfield Services S&P E&P Index S&P 500
16
5. Pass-Through Structures: YieldCo Overview
5.1 Yield Companies (YieldCo or ‘Synthetic MLP’)
While MLPs remain exclusive to oil, gas and other conventional energy competitors, renewable energy
developers have recently begun to create publicly traded yield-generating companies known as YieldCos.
Similar to an MLP, a YieldCo is a dividend-oriented company that distributes up to 90 percent of its available
cash flow to shareholders, including both GPs and LPs. The current MACRS tax depreciation system enables
renewable energy developers to use an accelerated depreciation timetable. Therefore, YieldCos can report
accounting losses, ultimately replicating the tax benefits of an MLP structure. Both YieldCos and MLPs are
characterized by the ownership of energy infrastructure with contracted long-term contracted cash flows, most
of which is distributed to shareholders. In addition, both business structures generally maintain close
partnerships with a parent or financial sponsor in order to drive growth through announced drop-downs.29
YieldCos typically enter Right-Of-First-Offer (ROFO) agreements with its sponsor/parent, which covers a
predetermined group of assets that are likely to be dropped-down over time to the YieldCo. For instance, NRG
Yield’s parent company, NRG Energy, would consider selling another 1,500MW to NRG Yield, or
approximately 50 percent of its current capacity levels.29
NRG Yield became the first publicly traded YieldCo in July 2013, when NRG Energy (the parent
company) sold approximately 35 percent of the company in an initial public offering (IPO).29 Since, YieldCos
have grown to reach a combined market capitalization of greater than $10 billion, with five new YieldCos going
public over the last twelve-month period.29 NRG Yield’s share price has more than doubled since its IPO, while
even the weakest performing YieldCo entities have impressively appreciated by approximately 25 percent.
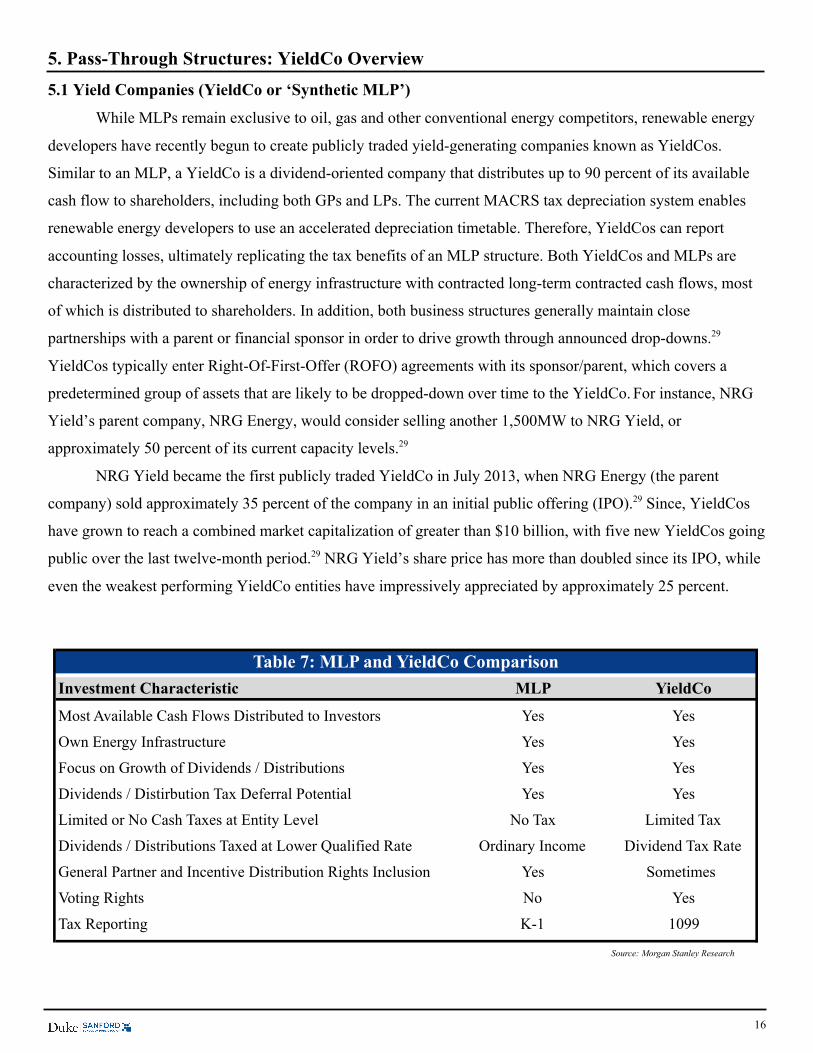
Investment Characteristic MLP YieldCo
Most Available Cash Flows Distributed to Investors Yes Yes
Own Energy Infrastructure Yes Yes
Focus on Growth of Dividends / Distributions Yes Yes
Dividends / Distirbution Tax Deferral Potential Yes Yes
Limited or No Cash Taxes at Entity Level No Tax Limited Tax
Dividends / Distributions Taxed at Lower Qualified Rate Ordinary Income Dividend Tax Rate
General Partner and Incentive Distribution Rights Inclusion Yes Sometimes
Voting Rights No Yes
Tax Reporting K-1 1099
Source: Morgan Stanley Research
Table 7: MLP and YieldCo Comparison
17
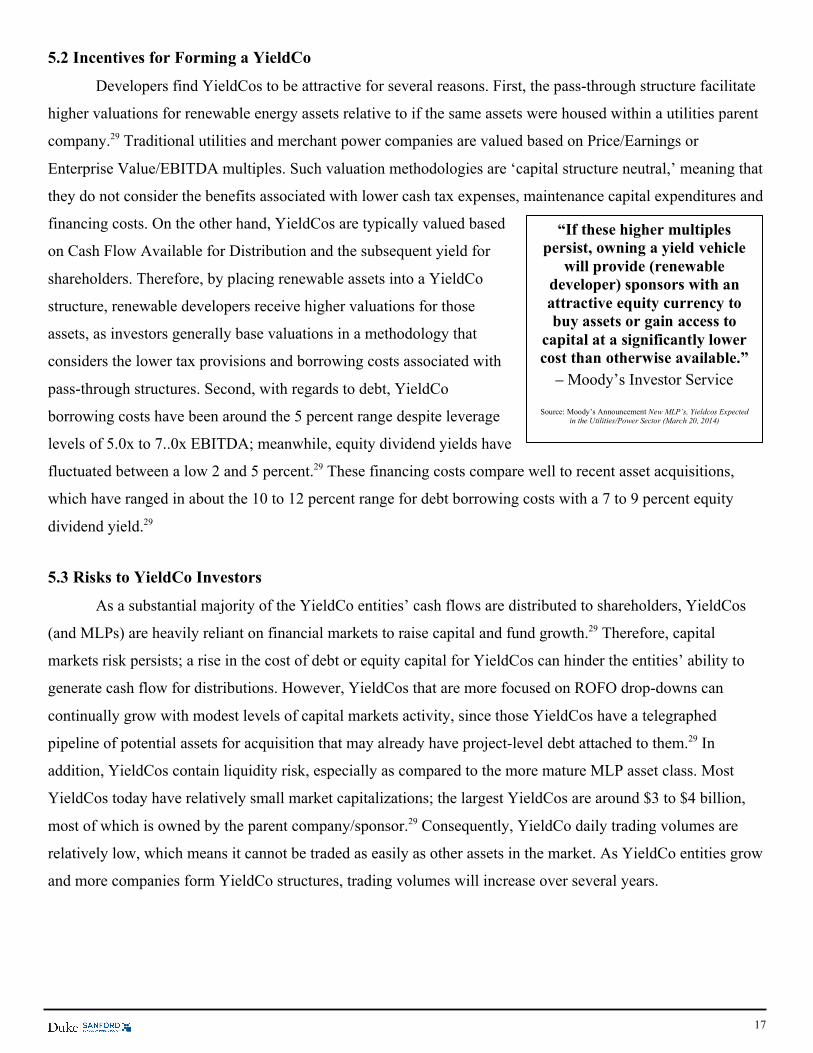
5.2 Incentives for Forming a YieldCo
Developers find YieldCos to be attractive for several reasons. First, the pass-through structure facilitate
higher valuations for renewable energy assets relative to if the same assets were housed within a utilities parent
company.29 Traditional utilities and merchant power companies are valued based on Price/Earnings or
Enterprise Value/EBITDA multiples. Such valuation methodologies are ‘capital structure neutral,’ meaning that
they do not consider the benefits associated with lower cash tax expenses, maintenance capital expenditures and
financing costs. On the other hand, YieldCos are typically valued based
on Cash Flow Available for Distribution and the subsequent yield for
shareholders. Therefore, by placing renewable assets into a YieldCo
structure, renewable developers receive higher valuations for those
assets, as investors generally base valuations in a methodology that
considers the lower tax provisions and borrowing costs associated with
pass-through structures. Second, with regards to debt, YieldCo
borrowing costs have been around the 5 percent range despite leverage
levels of 5.0x to 7..0x EBITDA; meanwhile, equity dividend yields have
fluctuated between a low 2 and 5 percent.29 These financing costs compare well to recent asset acquisitions,
which have ranged in about the 10 to 12 percent range for debt borrowing costs with a 7 to 9 percent equity
dividend yield.29
5.3 Risks to YieldCo Investors
As a substantial majority of the YieldCo entities’ cash flows are distributed to shareholders, YieldCos
(and MLPs) are heavily reliant on financial markets to raise capital and fund growth.29 Therefore, capital
markets risk persists; a rise in the cost of debt or equity capital for YieldCos can hinder the entities’ ability to
generate cash flow for distributions. However, YieldCos that are more focused on ROFO drop-downs can
continually grow with modest levels of capital markets activity, since those YieldCos have a telegraphed
pipeline of potential assets for acquisition that may already have project-level debt attached to them.29 In
addition, YieldCos contain liquidity risk, especially as compared to the more mature MLP asset class. Most
YieldCos today have relatively small market capitalizations; the largest YieldCos are around $3 to $4 billion,
most of which is owned by the parent company/sponsor.29 Consequently, YieldCo daily trading volumes are
relatively low, which means it cannot be traded as easily as other assets in the market. As YieldCo entities grow
and more companies form YieldCo structures, trading volumes will increase over several years.
“If these higher multiples persist, owning a yield vehicle
will provide (renewable developer) sponsors with an attractive equity currency to buy assets or gain access to
capital at a significantly lower cost than otherwise available.”
– Moody’s Investor Service
Source: Moody’s Announcement New MLP’s, Yieldcos Expected in the Utilities/Power Sector (March 20, 2014)
18
6. Financial Analysis: Methodology
6.1 Financial Model Assumptions Based on Solar Comparable Companies Analysis
The renewable energy industry has received a multitude of support from various public policies.
Throughout the sector, most direct financial support has come in the form of tax credits and cash grants.
Prevailing discourse has examined the relative effectiveness of cash grants and tax credits in achieving policy
objectives. The relative inefficiency of the tax credit incentive, especially compared to the cash grant program,
prompted policymakers to seek alternative policy solutions, including the MLP structure. Accordingly, this
thesis seeks to analyze the relative efficiency of cash grants, tax credits and pass-through tax structures (MLPs
and YieldCos) as policy options for facilitating renewable energy industry. Using a model based on existing
solar companies, this thesis contributes a detailed, fundamental analysis of the implications the various policies
can have on the financial health and outlook of a renewable energy developer (see Appendix). In addition this
thesis seeks to further renewable policy discourse by financially evaluating pass-through limited partnerships
side-by-side with cash grants and tax credits. The goal of the analysis was to determine how the different
policies affect a renewable developer’s free cash flow relative to the subsequent tax revenue loss to the
government. The most effective policies will convert tax expenditures directly into incremental free cash flow,
with minimal cash leakage (e.g. tax equity interest payments).
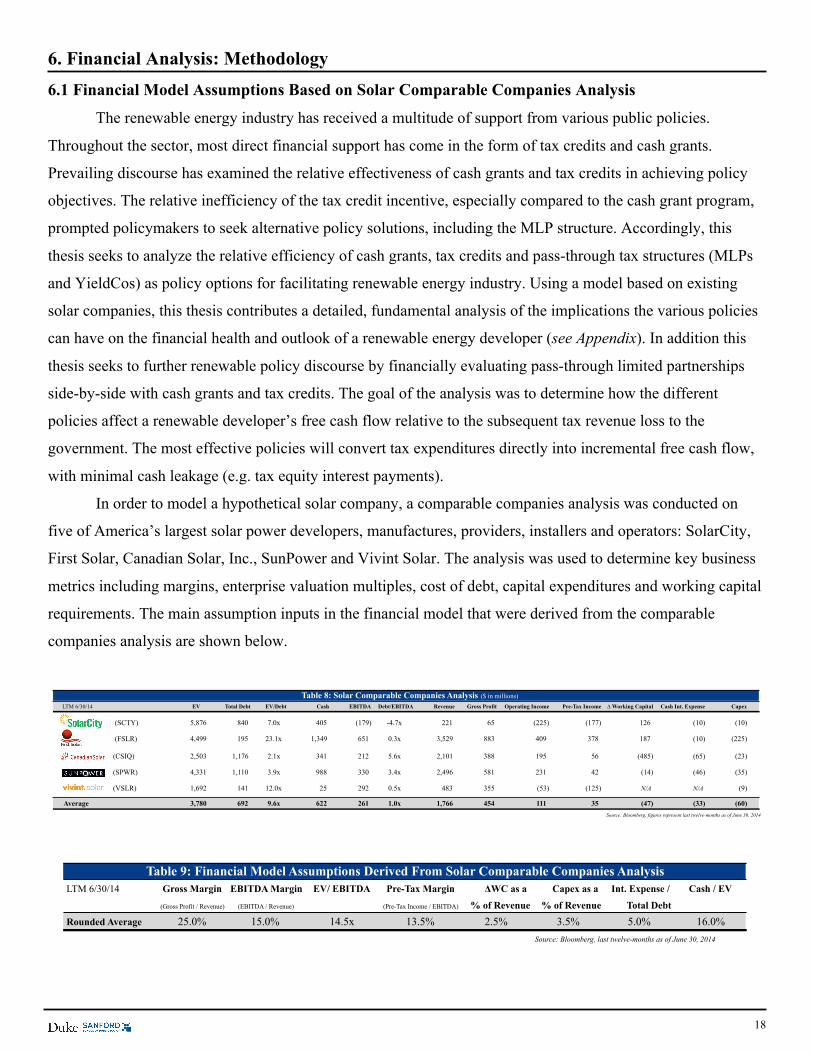
In order to model a hypothetical solar company, a comparable companies analysis was conducted on
five of America’s largest solar power developers, manufactures, providers, installers and operators: SolarCity,
First Solar, Canadian Solar, Inc., SunPower and Vivint Solar. The analysis was used to determine key business
metrics including margins, enterprise valuation multiples, cost of debt, capital expenditures and working capital
requirements. The main assumption inputs in the financial model that were derived from the comparable
companies analysis are shown below.
Table 8: Solar Comparable Companies Analysis ($ in millions) LTM 6/30/14 EV Total Debt EV/Debt Cash EBITDA Debt/EBITDA Revenue Gross Profit Operating Income Pre-Tax Income ∆ Working Capital Cash Int. Expense Capex
(SCTY) 5,876 840 7.0x 405 (179) -4.7x 221 65 (225) (177) 126 (10) (10)
(FSLR) 4,499 195 23.1x 1,349 651 0.3x 3,529 883 409 378 187 (10) (225)
(CSIQ) 2,503 1,176 2.1x 341 212 5.6x 2,101 388 195 56 (485) (65) (23)
(SPWR) 4,331 1,110 3.9x 988 330 3.4x 2,496 581 231 42 (14) (46) (35)
(VSLR) 1,692 141 12.0x 25 292 0.5x 483 355 (53) (125) N/A N/A (9)
Average 3,780 692 9.6x 622 261 1.0x 1,766 454 111 35 (47) (33) (60) Source: Bloomberg, figures represent last twelve-months as of June 30, 2014
LTM 6/30/14 Gross Margin EBITDA Margin EV/ EBITDA Pre-Tax Margin ΔWC as a Capex as a Int. Expense / Cash / EV
(Gross Profit / Revenue) (EBITDA / Revenue) (Pre-Tax Income / EBITDA) % of Revenue % of Revenue Total Debt
Rounded Average 25.0% 15.0% 14.5x 13.5% 2.5% 3.5% 5.0% 16.0%Source: Bloomberg, last twelve-months as of June 30, 2014
Table 9: Financial Model Assumptions Derived From Solar Comparable Companies Analysis
19
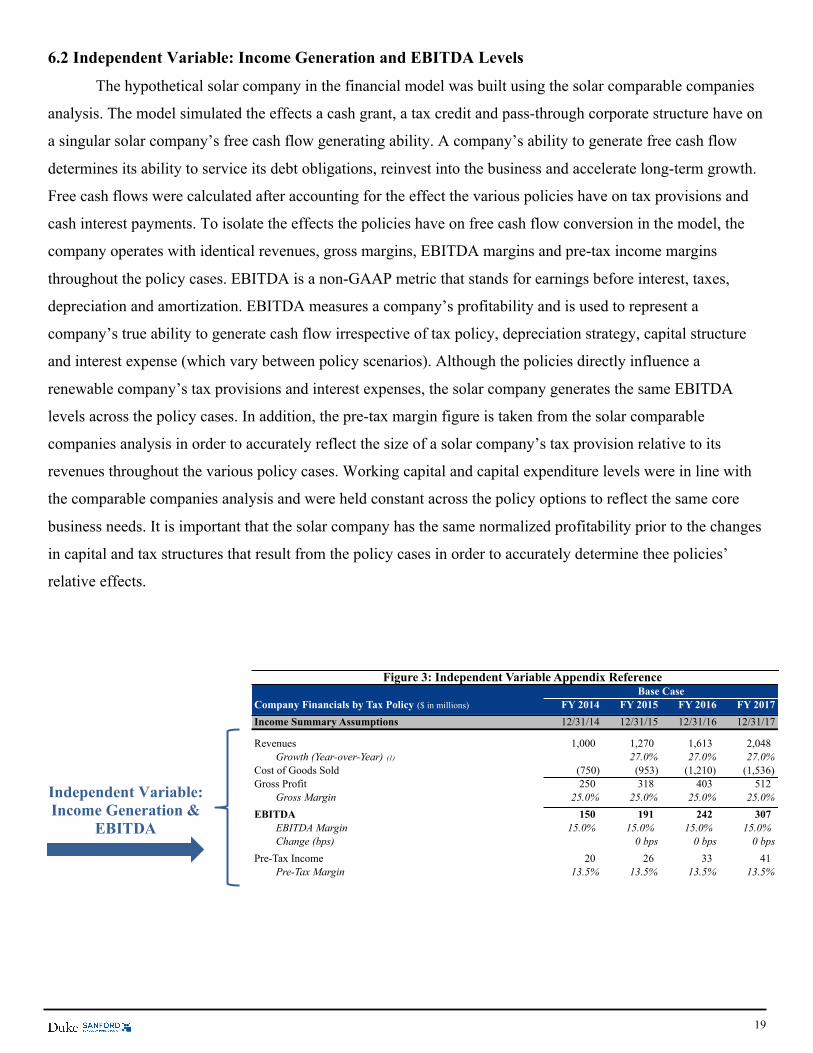
6.2 Independent Variable: Income Generation and EBITDA Levels
The hypothetical solar company in the financial model was built using the solar comparable companies
analysis. The model simulated the effects a cash grant, a tax credit and pass-through corporate structure have on
a singular solar company’s free cash flow generating ability. A company’s ability to generate free cash flow
determines its ability to service its debt obligations, reinvest into the business and accelerate long-term growth.
Free cash flows were calculated after accounting for the effect the various policies have on tax provisions and
cash interest payments. To isolate the effects the policies have on free cash flow conversion in the model, the
company operates with identical revenues, gross margins, EBITDA margins and pre-tax income margins
throughout the policy cases. EBITDA is a non-GAAP metric that stands for earnings before interest, taxes,
depreciation and amortization. EBITDA measures a company’s profitability and is used to represent a
company’s true ability to generate cash flow irrespective of tax policy, depreciation strategy, capital structure
and interest expense (which vary between policy scenarios). Although the policies directly influence a
renewable company’s tax provisions and interest expenses, the solar company generates the same EBITDA
levels across the policy cases. In addition, the pre-tax margin figure is taken from the solar comparable
companies analysis in order to accurately reflect the size of a solar company’s tax provision relative to its
revenues throughout the various policy cases. Working capital and capital expenditure levels were in line with
the comparable companies analysis and were held constant across the policy options to reflect the same core
business needs. It is important that the solar company has the same normalized profitability prior to the changes
in capital and tax structures that result from the policy cases in order to accurately determine thee policies’
relative effects.
Company Financials by Tax Policy ($ in millions) FY 2014 FY 2015 FY 2016 FY 2017
Income Summary Assumptions 12/31/14 12/31/15 12/31/16 12/31/17
Revenues 1,000 1,270 1,613 2,048 Growth (Year-over-Year) (1) 27.0% 27.0% 27.0%
Cost of Goods Sold (750) (953) (1,210) (1,536) Gross Profit 250 318 403 512
Gross Margin 25.0% 25.0% 25.0% 25.0%
EBITDA 150 191 242 307 EBITDA Margin 15.0% 15.0% 15.0% 15.0%Change (bps) 0 bps 0 bps 0 bps
Pre-Tax Income 20 26 33 41 Pre-Tax Margin 13.5% 13.5% 13.5% 13.5%
Base CaseFigure 3: Independent Variable Appendix Reference
Independent Variable: Income Generation &
EBITDA
20
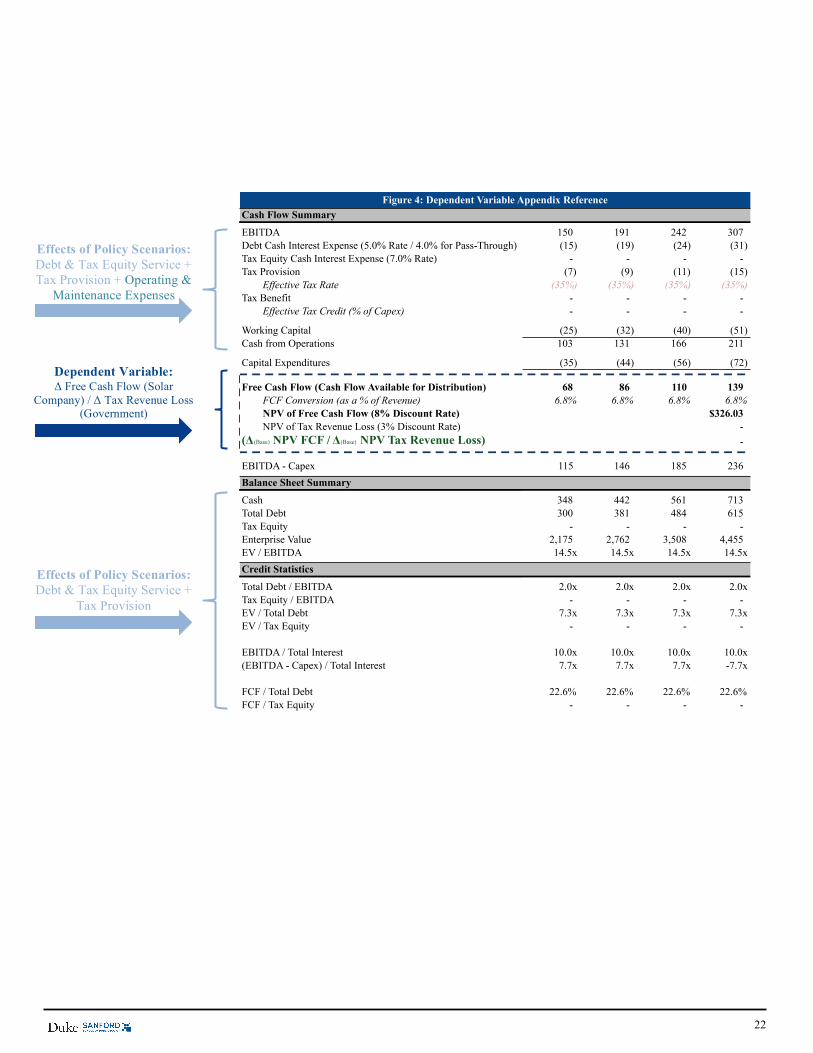
6.3 Dependent Variable: Effects of Policy Scenarios on Cash Flow, Financing Costs and Tax Provisions
Free cash flow (FCF) represents the cash that a company generates after outlaying the capital required to
maintain business operations, service debt obligations and cover tax provisions. In other words, FCF represents
EBITDA after considering tax policy and capital structure requirements. Free cash flow was selected as a means
of explaining how the different tax and corporate structures affect a company’s ability to convert its income into
growth. From the government’s perspective, measuring the amount of tax expenditures relative to the amount of
cash flow gained to the company provides insight into the portion of tax expenditures that reach the company
after accounting for federal taxes and other costs associated with the underlying policy scenario. Free cash flow
is the cash the company generates after realizing the effects of the tax policies. At a high level, free EBITDA
levels drive cash flow available to investors, less debt and tax equity service, as most other outflows are
relatively modest.
Base Case
The cost of debt in the base case is 5 percent (rounded average from the comparable companies analysis)
and the company incurs the conventional 35 percent corporate tax rate. The government does not experience
any tax revenue loss. A 5 percent interest rate was held consistent as a baseline for traditional debt financing
throughout the policy scenarios, except for in the pass-through status scenario (4 percent interest rate) to reflect
the structure’s affect on reducing costs of capital. The base case represents a solar company operating in an
environment without benefitting from any renewable energy tax policy (cash grant, tax credit, pass-through
structure). The solar company’s enterprise value was determined by the EBITDA multiple derived from the
solar comparable companies analysis. The model also assumes a constant, modest leverage level across all
policy scenarios. In the tax credit case, the same aggregate leverage level (2.0x EBITDA) was applied between
tax equity and traditional debt financing.
Cash Grant
In the cash grant case, the company incurs the same 35 percent corporate tax rate as in the base case, but
also receives a tax benefit equivalent to 30 percent of capital expenditures through 2016, until the benefit steps
down to 10 percent of expenditures. The tax revenue loss to the government is equal in value to the tax credit
benefits to the company. The cash grant does not necessitate tax equity financing (like in the tax credit
Free Cash Flow (FCF) = EBITDA – Cash Int. Expense – Cash Tax Provision – Δ Working Capital – Capital Expenditures Free Cash Flow (FCF) = Cash from Operations – Capital Expenditures
21
scenario), and thus incurs the same debt financing costs as the base case. The cash grant scenario replicates the
effects of receiving a cash injection in lieu of the prevailing investment tax credit incentive.
Tax Credit
In the tax credit scenario, the company experiences the same corporate tax provisions and tax benefits as
the cash grant, while the foregone government tax expenditure is the tax credit benefits to the company (equal
in value to the cash grant scenario). However, in the tax credit case the company enters a tax equity financing
structure. According to BNEF, the average tax equity yield jumped from a normalized 6 percent to 9 percent
following the recent global financial crisis. Accordingly, the model assumes a 7 percent interest rate for tax
equity financing.
The tax equity market is relatively opaque, but BNEF estimates that tax equity generally constitutes 60
percent of capital expenditures16 On the other hand, solar companies including SolarCity tend to have tax equity
leverage levels closer to 80 percent.25 Accordingly, the model assumes a 70 percent tax equity level relative to
its total financing, or the sum of both tax equity and debt facilities. The change in the company’s capital
structure composition to include more tax equity, and less debt, in the tax equity scenario ultimately leads to a
higher weighted average cost of capital for the company. A higher borrowing cost drags on both cash flow
generation and a company’s growth outlook. The extent to which tax equity financing hinders a renewable
energy development is dependent on the amount and cost of tax equity invested at the company level and the
cost of the tax equity facility itself. A sensitivities analysis was conducted to demonstrate how such assumptions
could affect the results of the financial model.
Pass-Through Structure
In the pass-through scenario, the solar company incurs no cash tax provision at the entity level.
Therefore, the tax revenue loss is equivalent to the corporate tax rate provision, which the government would
have collected had the entity not registered under the pass-through structure. Like the other policy scenarios, the
pass-through case assumes total financing levels of 2.0x EBITDA, but the accompanying lower cost of capital is
reflected through a lower 4 percent interest rate on the debt facility.
22
Cash Flow Summary
EBITDA 150 191 242 307 Debt Cash Interest Expense (5.0% Rate / 4.0% for Pass-Through) (15) (19) (24) (31) Tax Equity Cash Interest Expense (7.0% Rate) - - - - Tax Provision (7) (9) (11) (15)
Effective Tax Rate (35%) (35%) (35%) (35%)Tax Benefit - - - -
Effective Tax Credit (% of Capex) - - - -
Working Capital (25) (32) (40) (51) Cash from Operations 103 131 166 211
Capital Expenditures (35) (44) (56) (72)
Free Cash Flow (Cash Flow Available for Distribution) 68 86 110 139 FCF Conversion (as a % of Revenue) 6.8% 6.8% 6.8% 6.8%NPV of Free Cash Flow (8% Discount Rate) $326.03NPV of Tax Revenue Loss (3% Discount Rate) -
(Δ(Base) NPV FCF / Δ(Base) NPV Tax Revenue Loss) -
EBITDA - Capex 115 146 185 236 Balance Sheet Summary
Cash 348 442 561 713 Total Debt 300 381 484 615 Tax Equity - - - - Enterprise Value 2,175 2,762 3,508 4,455 EV / EBITDA 14.5x 14.5x 14.5x 14.5xCredit Statistics
Total Debt / EBITDA 2.0x 2.0x 2.0x 2.0xTax Equity / EBITDA - - - - EV / Total Debt 7.3x 7.3x 7.3x 7.3xEV / Tax Equity - - - -
EBITDA / Total Interest 10.0x 10.0x 10.0x 10.0x(EBITDA - Capex) / Total Interest 7.7x 7.7x 7.7x -7.7x
FCF / Total Debt 22.6% 22.6% 22.6% 22.6%FCF / Tax Equity - - - -
Figure 4: Dependent Variable Appendix Reference
Effects of Policy Scenarios: Debt & Tax Equity Service + Tax Provision + Operating &
Maintenance Expenses
Effects of Policy Scenarios: Debt & Tax Equity Service +
Tax Provision
Dependent Variable: Δ Free Cash Flow (Solar
Company) / Δ Tax Revenue Loss (Government)
23
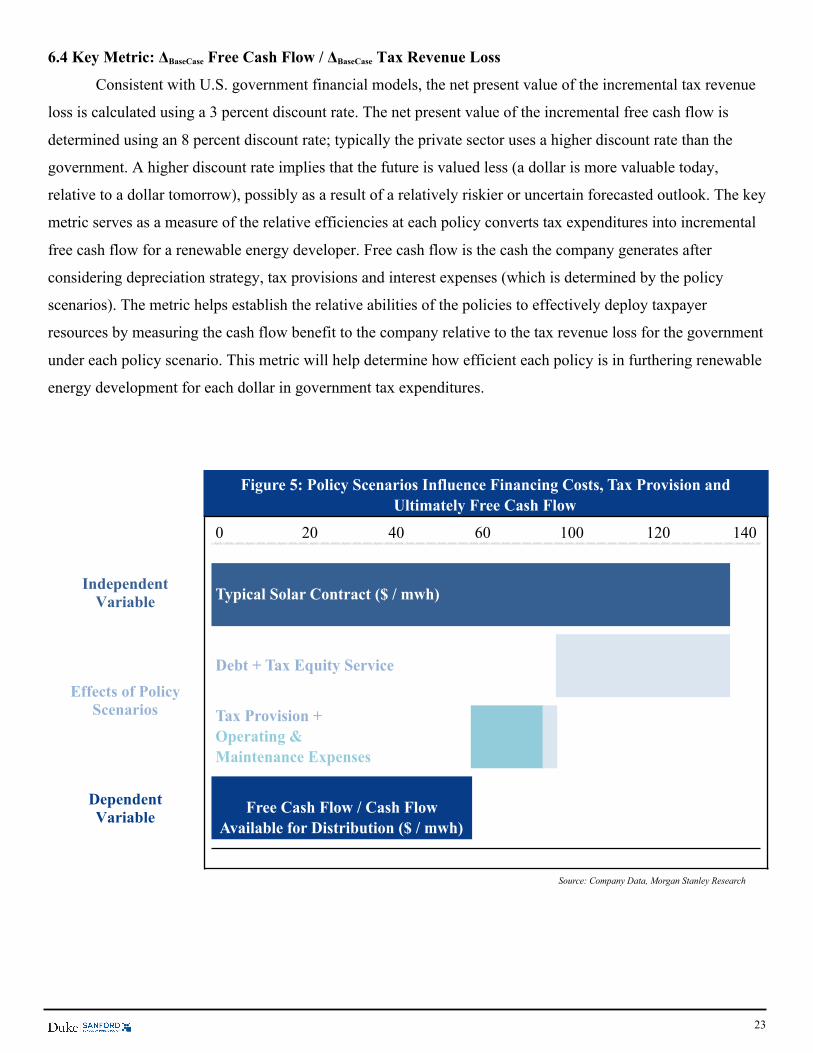
6.4 Key Metric: ΔBaseCase Free Cash Flow / ΔBaseCase Tax Revenue Loss
Consistent with U.S. government financial models, the net present value of the incremental tax revenue
loss is calculated using a 3 percent discount rate. The net present value of the incremental free cash flow is
determined using an 8 percent discount rate; typically the private sector uses a higher discount rate than the
government. A higher discount rate implies that the future is valued less (a dollar is more valuable today,
relative to a dollar tomorrow), possibly as a result of a relatively riskier or uncertain forecasted outlook. The key
metric serves as a measure of the relative efficiencies at each policy converts tax expenditures into incremental
free cash flow for a renewable energy developer. Free cash flow is the cash the company generates after
considering depreciation strategy, tax provisions and interest expenses (which is determined by the policy
scenarios). The metric helps establish the relative abilities of the policies to effectively deploy taxpayer
resources by measuring the cash flow benefit to the company relative to the tax revenue loss for the government
under each policy scenario. This metric will help determine how efficient each policy is in furthering renewable
energy development for each dollar in government tax expenditures.
0 20 40 60 100 120 140
Typical Solar Contract ($ / mwh)
Debt + Tax Equity Service
Source: Company Data, Morgan Stanley Research
Tax Provision + Operating & Maintenance Expenses
Free Cash Flow / Cash Flow Available for Distribution ($ / mwh)
Figure 5: Policy Scenarios Influence Financing Costs, Tax Provision and Ultimately Free Cash Flow
Independent Variable
Effects of Policy Scenarios
Dependent Variable
24
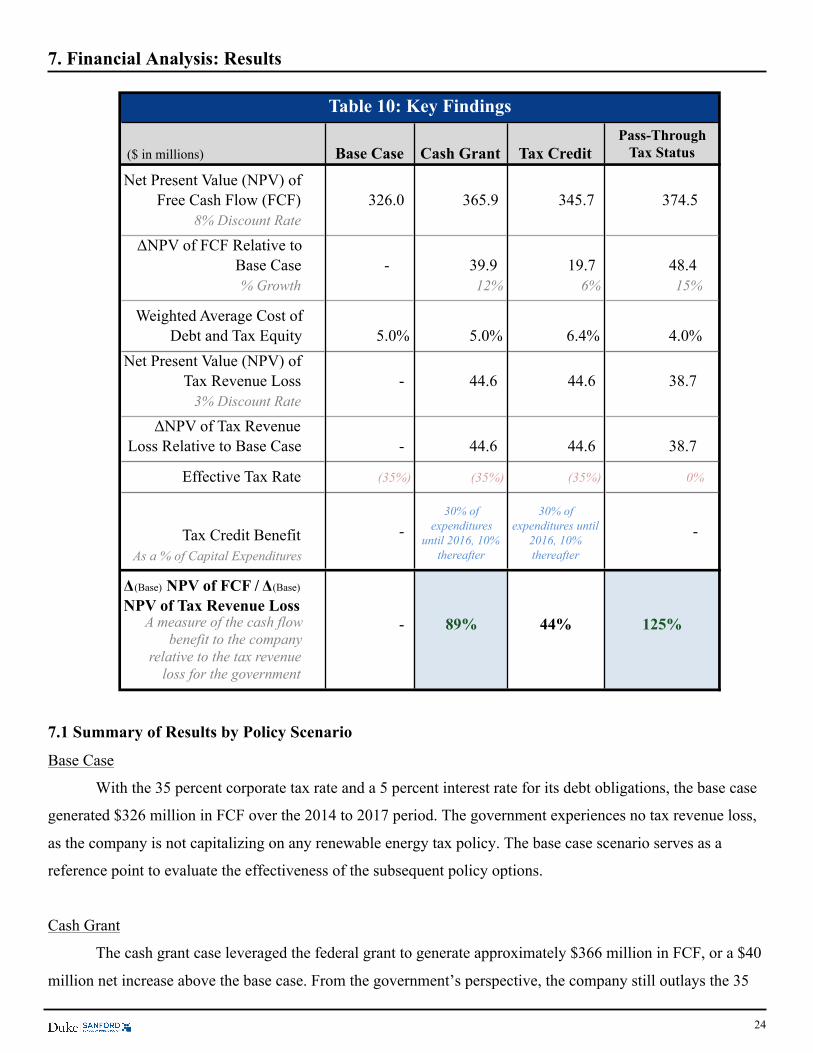
7. Financial Analysis: Results
7.1 Summary of Results by Policy Scenario
Base Case
With the 35 percent corporate tax rate and a 5 percent interest rate for its debt obligations, the base case
generated $326 million in FCF over the 2014 to 2017 period. The government experiences no tax revenue loss,
as the company is not capitalizing on any renewable energy tax policy. The base case scenario serves as a
reference point to evaluate the effectiveness of the subsequent policy options.
Cash Grant
The cash grant case leveraged the federal grant to generate approximately $366 million in FCF, or a $40
million net increase above the base case. From the government’s perspective, the company still outlays the 35
($ in millions) Base Case Cash Grant Tax Credit
Net Present Value (NPV) of Free Cash Flow (FCF) 326.0 365.9 345.7 374.5
8% Discount Rate
ΔNPV of FCF Relative to Base Case - 39.9 19.7 48.4 % Growth 12% 6% 15%
Weighted Average Cost of Debt and Tax Equity 5.0% 5.0% 6.4% 4.0%
Net Present Value (NPV) of Tax Revenue Loss - 44.6 44.6 38.7
3% Discount Rate
ΔNPV of Tax Revenue Loss Relative to Base Case - 44.6 44.6 38.7
aEffective Tax Rate (35%) (35%) (35%) 0%
Tax Credit BenefitAs a % of Capital Expenditures
Δ(Base) NPV of FCF / Δ(Base) NPV of Tax Revenue Loss
Table 10: Key Findings
A measure of the cash flow benefit to the company
relative to the tax revenue loss for the government
- 89% 44% 125%
- - 30% of
expenditures until 2016, 10%
thereafter
30% of expenditures until
2016, 10% thereafter
Pass-Through Tax Status
25
percent corporate tax rate but now receives a tax credit based on capital expenditures. The tax revenue loss is
equivalent to the tax credit benefit the company receives (30 percent of expenditures through 2016, 10 percent
thereafter). Accordingly, the government tax loss in the cash grant scenario was approximately $45 million.
Therefore, each $1 increase in tax revenue loss resulted in a direct $0.89 increase in free cash flow at the given
8 and 3 percent discount rates for free cash flow and tax revenue loss, respectively. The financial model reached
the same conclusion as BNEF in determining that cash grants are approximately twice as effective in deploying
taxpayer resources relative to tax credits.
Tax Credit
In the tax credit scenario, the government tax expenditures are equal to those in the cash grant ($45
million). However, the company’s higher cost of debt leads to higher cash interest expenses, which ultimately
drains FCF. Consequently, the company generated $346 million in FCF, or a $20 million net increase above the
base case scenario. Although tax credits have played, and continue to play, an instrumental role in renewable
energy growth, the policy inefficiently allocates taxpayer resources. The tax credit policy option was 44 percent
efficient in converting tax expenditures into incremental FCF to a renewable energy developer. Each $1
increase in tax revenue only resulted in a direct $0.44 increase in free cash flow. Accordingly, the financial
model corroborated Bloomberg’s conclusion, which stated that government expenditures through cash grants
are twice as effective in driving renewable energy development than expenditures through tax credits. From the
company’s perspective, the tax equity financing structure elevates costs of capital, hindering a renewable energy
project’s financial growth outlook and ability to attract investors.
Pass-Through Tax Status
In the pass-through case, the company incurs no tax provision at the entity level. Therefore, the tax
revenue loss is equivalent to the corporate tax rate provision, which the government would have collected had it
not been for the pas-through structure. The tax revenue loss for the pass-through scenario was $39 million,
lower than in both the tax credit and cash grant cases. The company leveraged its advantaged tax status to
generate $375 million in FCF, or a net gain of $48 million above the base case. Although the pass-through
structure resulted in lower FCF generation relative to the cash grant, pass-through structures are relatively more
efficient in directing tax expenditures towards their policy objectives. In the pass-through structure, there is no
actual transaction that takes place between the government and the company, as is the case with a cash grant or
a tax credit. Instead, the company keeps the tax revenue loss from the outset through its pass-through tax status,
limiting cash leakage inefficiencies in the process.
26
7.2 Pass-Through Structures (MLPs and YieldCos) Most Efficiently Deploy Taxpayer Resources Cash grants and the pass-through structures were both relatively efficient in their use of taxpayer
resources according to the financial model. However, the financial analysis revealed that pass-through tax
structures are more efficiently able to convert tax expenditures into free cash flow for renewable energy
developers. The ancillary benefits that come with a pass-through tax status position the business structure as the
optimal alignment of interests between policy objectives and investor incentives for the renewable energy
industry. Pass-through structures are more beneficial to both the government and the private sector in
facilitating renewable energy growth. The absence of taxes at the corporate level provides MLPs and YieldCos
with a lower cost of capital, or the cost of obtaining capital through debt, equity or tax equity.23 A lower cost of
capital increases the pass-through structure’s relative attractiveness to investors by enabling such companies to
pursue projects that might not be feasible for a taxable corporation. It is important to also note that the pass-
through structure is designed as a dividend-oriented mechanism; the company does not keep all of the cash flow
gain it receives from its tax benefit, but rather distributes most of its available cash flow to shareholders.
The pass-through structure serves as an efficient vehicle to manage steady, cash flow generating assets
for a parent company, who can then efficiently distribute yield-oriented dividends to investors and, ultimately,
attract a larger investor base. MLPs and YieldCos, for instance, raise capital from a retail investor base, which
helps democratize the future growth of the nation’s renewable energy. While the prevailing tax credit structure
limits investments to the small community of tax equity investors, pass-through structures open the renewable
energy industry to an alternative pool of investors with a competitive source of equity capital.
Certain renewable energy companies with relatively mature assets have already begun to capitalize on
pass-through tax advantages, as evident by the upsurge in publicly traded YieldCos.24 Similar to MLPs,
YieldCos are pass-through corporate structures that house assets and offer investors with dividends supported
by a high payout ratio and stable cash flows. Notable YieldCos include NRG Yield, Pattern Energy and
NextEra Energy Partners. Renewable developers are able to synthetically replicate the benefits of an MLP
through the YieldCo structure. Like an MLP, a YieldCo pays out most of its distributable cash flow, while
avoiding the corporate level taxation of a C-corporation. Unlike MLPs who derive their tax benefit from direct
IRS approval, YieldCos rely on the current depreciation system in America. The Modified Accelerated Cost
Recovery System (MACRS) allows renewable energy developers to depreciate qualifying assets on a five-year
timetable. An accelerated depreciation table allows the firm to continually incur accounting losses, while
receiving offsetting tax benefits in the future. The rise in the YieldCo structure offers a proof-of-concept for
pass-through business partnerships by demonstrating that the structures can effectively raise capital to drive
renewable energy development.
27
8. Sensitivity Analysis and Limitations of Analysis
8.1 Implications of Sensitivity Analysis: Importance of Unlocking a Lower Cost of Capital
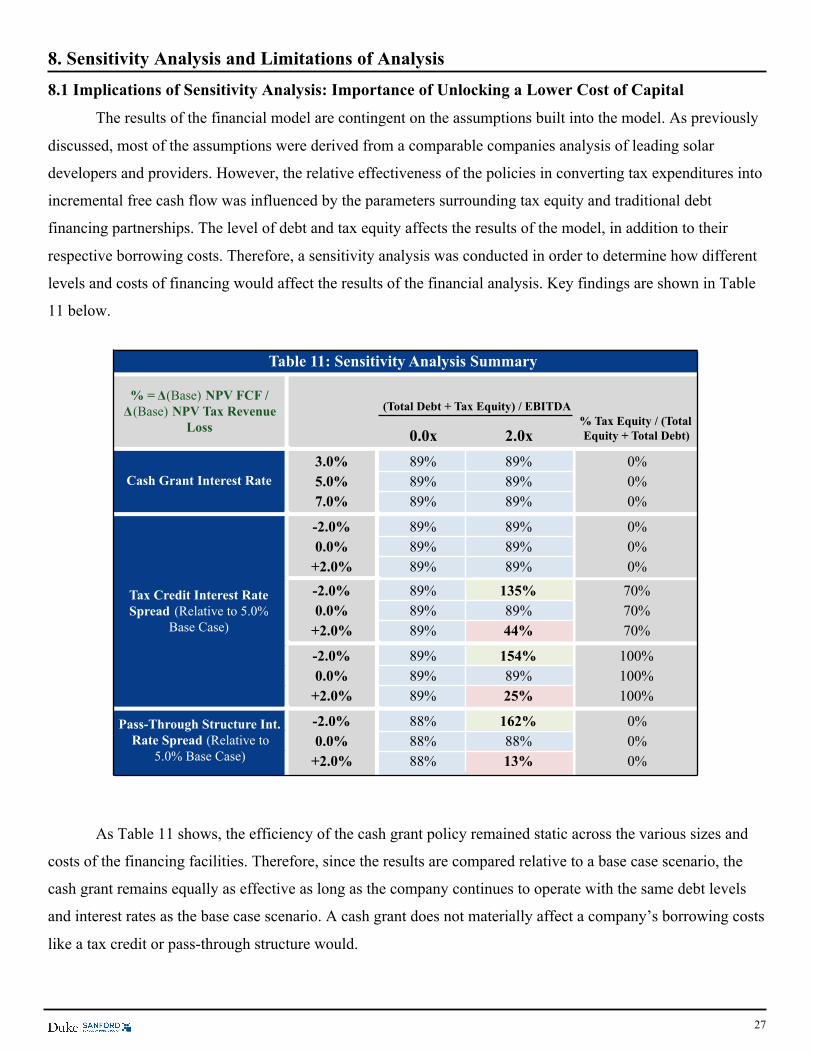
The results of the financial model are contingent on the assumptions built into the model. As previously
discussed, most of the assumptions were derived from a comparable companies analysis of leading solar
developers and providers. However, the relative effectiveness of the policies in converting tax expenditures into
incremental free cash flow was influenced by the parameters surrounding tax equity and traditional debt
financing partnerships. The level of debt and tax equity affects the results of the model, in addition to their
respective borrowing costs. Therefore, a sensitivity analysis was conducted in order to determine how different
levels and costs of financing would affect the results of the financial analysis. Key findings are shown in Table
11 below.
As Table 11 shows, the efficiency of the cash grant policy remained static across the various sizes and
costs of the financing facilities. Therefore, since the results are compared relative to a base case scenario, the
cash grant remains equally as effective as long as the company continues to operate with the same debt levels
and interest rates as the base case scenario. A cash grant does not materially affect a company’s borrowing costs
like a tax credit or pass-through structure would.
(Total Debt + Tax Equity) / EBITDA
0.0x 2.0x% Tax Equity / (Total Equity + Total Debt)
3.0% 89% 89% 0%5.0% 89% 89% 0%7.0% 89% 89% 0%
-2.0% 89% 89% 0%0.0% 89% 89% 0%
+2.0% 89% 89% 0%
-2.0% 89% 135% 70%0.0% 89% 89% 70%
+2.0% 89% 44% 70%
-2.0% 89% 154% 100%0.0% 89% 89% 100%
+2.0% 89% 25% 100%
-2.0% 88% 162% 0%0.0% 88% 88% 0%
+2.0% 88% 13% 0%
Cash Grant Interest Rate
Pass-Through Structure Int. Rate Spread (Relative to
5.0% Base Case)
% = Δ(Base) NPV FCF / Δ(Base) NPV Tax Revenue
Loss
Tax Credit Interest Rate Spread (Relative to 5.0%
Base Case)
Table 11: Sensitivity Analysis Summary
28
In addition, the sensitivity analysis revealed that each policy scenario would be equally efficient in the
absence of any financing facilities (either debt or tax equity) or when the size and borrowing cost of those
financing facilities is unchanged from the policies relative to a base case scenario. In practice, tax equity raises
cost of capital while advantages from valuation uplifts and low entity-level taxation help lower the cost of
capital for a pass-through tax structure. Rather than adjusting the base case scenario to match the cost of capital
of the company under the various policy scenarios, the sensitivity analysis measured the relative cost of capital
spreads between the policies and the base case scenario. The sensitivity analysis showed that both tax credits
and pass-through structures would most effectively deploy taxpayer resources when operating with a cost of
debt below that expected from traditional debt financing costs. Therefore, policymakers should search for policy
solutions that lower a company’s cost of capital, in order to receive the greatest benefits for each dollar of tax
revenue loss.
8.2 Limitations of Analysis
Hypothetical Company Based on Solar Developers Without YieldCos
The most substantial limitation to the financial analysis is that it was conducted on a hypothetical
company. In practice, the companies that operate under the various policy scenarios often contain very different
characteristics. For instance, a pass-through structure would generally incur greater debt levels as compared to a
company operating under a tax credit incentive as a result of the associated lower cost of capital. In the
proprietary financial model, the company’s key income generation metrics and financing levels were held
constant in order to isolate the effects of the policies. The solar companies that were used for the comparable
companies analysis do not have YieldCos or other pass-through structures, which facilitates the comparison of a
solar company before and after registering as a pass-through business partnership. The analysis into pass-
through structures can be further improved by using actual YieldCo companies’ data. Since there are relatively
few YieldCos in existence currently, it is possible to evaluate the entire asset class in a robust manner; an actual
analysis into the tax benefits received by each YieldCo can provide policymakers with exact metrics into the
effectiveness of the structure in converting tax expenditures into incremental free cash flow for a renewable
developer. A financial model of NRG Yield is included in the Appendix for reference. The effects of the policy
will vary from one entity to another depending on business needs and capital structure requirements.
Current Market Environment May Heighten Appeal of Pass-Through Structures
Largely a result of the monetary policy of the Federal Reserve, financial markets are currently in an
ultra-low interest rate environment. Therefore, dividend-oriented asset classes, including MLPs and YieldCos,
may be relatively more attractive to investors in search for yield. Although pass-through structures have
weathered business cycles in the past, it is important to note that the impressive recent performance of YieldCos
29
and other pass-through structures is partially supported by an equity-led bull market and low interest rate
environment. Renewable developers and policymakers alike should be concerned with how YieldCos will
perform in the strong likelihood of a rising rate environment over the next several years.
Emphasis on Debt Side of Cost of Capital Relative to the Cost of Equity
Most of the cost of capital analysis in the proprietary financial model focuses on the cost of debt rather
than the cost of equity. As pass-through structures facilitate liquidity enhancements by allowing shares to trade
publicly on an exchange with a more competitive source of equity capital. These structures can lower cost of
equity, in addition to the reduction in the cost of debt that was seen in the proprietary financial model. More
analysis can be conducted to determine the effects that publicly traded vehicles have on lowering the cost of
equity for renewable technology developers.
30
9. Conclusion: Policy Recommendations
9.1 Government Policy Should Favor Cash Grants in Lieu of Tax Credit Incentives
The financial analysis was in line with the BNEF conclusion in determining that cash grants are
approximately twice as effective in deploying taxpayer resources relative to tax credits. Although the tax credit
is likely to be renewed, policymakers should consider legislating an optional cash grant program in lieu of the
traditional tax credit incentive, particularly during turbulent periods in the tax equity market. An accompanying
low guarantee program can lower project funding costs for renewable developers while renewable portfolio
standards can encourage renewable technology investments. The federal government would more effectively
achieve its policy objectives with taxpayer resources by favoring cash grant policies over tax credit programs.
9.2 Government Policy Should Support Accommodating Market Environment for YieldCos
In the United States, approximately 30 states have some form of a renewable portfolio standard.
Accordingly, there will be a continual increase in renewable energy capacity, which has doubled over the last 5-
years.29 According to Morgan Stanley Research, renewable energy capacity is expected to double again by the
end of the decade, as approximately $150 billion will be invested into renewable technology projects.29
YieldCos are likely to be involved in the forecasted upsurge in renewable energy development. As YieldCos are
the only available pass-through structure to the renewable energy industry today, the structure can help drive
renewable energy growth by providing developers with lower financing costs and access to a broader investor
base.
Similar to MLPs, the performance of YieldCos can be tied to access to capital, including both equity and
debt. A rising rate environment is likely to present obstacles for YieldCos in meeting their growth objectives.
Therefore, the Federal Reserve can best support renewable energy development by facilitating a gradual
increase in interest rates, to ease the eventual increase in borrowing costs for YieldCos and their investors. In
addition, the government can benefit from supporting YieldCos who focus on Right-Of-First-Offer (ROFO)
drop-down asset acquisitions for growth, since those YieldCos are less dependent on access to capital markets.
Furthermore, the government can benefit from supporting YieldCos that have modest incentive distribution
right (IDR) agreements; ‘high split’ agreements that can result in up to a 50 percent distribution share for the
general partner can inhibit a renewable developer’s stable free cash flow generation.
YieldCos are able to replicate the tax advantages of an MLP due to the nature of the depreciation and tax
credits generated by the YieldCo structure. Technologies that qualify under the ITC are also eligible to
depreciate their assets on an accelerated 5-year timetable under the current Modified Accelerated Cost Recovery
System (MACRS). The accelerated depreciation allows renewable technology companies to create accounting
paper losses, which effectively reduces tax burdens through offsetting future tax credit benefits. Policymakers
should stress the importance of supporting this depreciation benefit for renewable energy technologies in order
31
to facilitate the formation of the YieldCo structure. In the current renewable energy policy landscape, the
intersection of government policy objectives and renewable energy development are best met by the significant
growth opportunity in YieldCos.
9.3 The Widespread Introduction of MLPs to the Renewable Energy Industry
Although cash grants (Section 1603 Cash Grant) and the pass-through structures (MLPs and YieldCos)
were both relatively efficient in their use of taxpayer resources, the financial analysis revealed that pass-through
tax structures are more efficiently able to convert tax expenditures into free cash flow for renewable energy
developers. Although MLPs are widely considered the gold standard for extracting yield in the energy industry,
it remains unavailable to the developing renewable industry. The introduction of MLPs (or other pass-through
tax structures) to renewable energy projects raises concerns regarding the corporate tax base, since MLPs would
allow such projects to forego corporate-level taxation. In 1987, the “qualifying income” stipulation for MLP
eligibility was implemented in direct response to concerns about corporate tax base erosion.21 Allowing
renewable energy companies to structure as MLPs would result in tax revenue losses, but the budget
implications of the MLP structure should be analyzed relative to the current policy options. According to the
Joint Committee on Taxation (JCT), the revenue impact of the MLPPA would be just $307 million over 5 years;
over the same period, the JCT estimates that tax credit support for renewable energy projects will result in $12.6
billion in tax revenue losses.22 The JCT forecast alleviates concerns regarding MLPs’ ability to erode the
corporate tax base and may boost support for the MLPPA. From the government perspective, MLPs can serve
as a cost effective policy solution for driving renewable energy growth.
Typically, MLPs have been used to finance proven technologies with stable cash flows. From the private
investor perspective, critics of the MLPPA contest that a renewable energy company’s cash flows are too
volatile for the MLP structure, whose valuation relies on stable, quarterly distributions.18 However, as the
technology and broader renewable industry continue to mature and earn the trust of more risk-averse investors,
like investment banks and corporations, renewable energy investments may rapidly increase. Once a renewable
energy asset is operating efficiently, it immediately begins to generate returns for investors. The MLP structure
would be a viable option for securing additional capital for renewable projects with long-term power purchase
agreements. Such projects would fit the MLP structure in a similar manner to a midstream pipeline with long-
term fee-based contracts.
From the renewable industry perspective, it is clear that the pass-through structure can drive renewable
energy growth by lowering the cost of capital and facilitating access to a greater investment base. Regardless of
the MLPPA, renewable energy companies will continue to create YieldCo entities. The government’s interests
are aligned with renewable energy companies in this instance, since taxpayer resources most effectively achieve
policy objectives through the pass-through structure, as shown in the financial model. Under the current policy
32
landscape (in the absence of the MLPPA), renewable energy companies are well positioned to capitalize on the
government tax expenditures being allocated to the renewable energy industry through the formation of
YieldCos.
The optimal policy solution for driving renewable energy growth is the pass-through tax structure
due to its ability to efficiently convert taxpayer resources into free cash flow, while lowering costs of
capital and offering access to an alternative investor base with a competitive source of capital.
Policymakers can help drive renewable energy growth by encouraging pass-through structures, either
through supporting the YieldCo business structure or through the widespread introduction of MLPs to
the renewable energy industry.
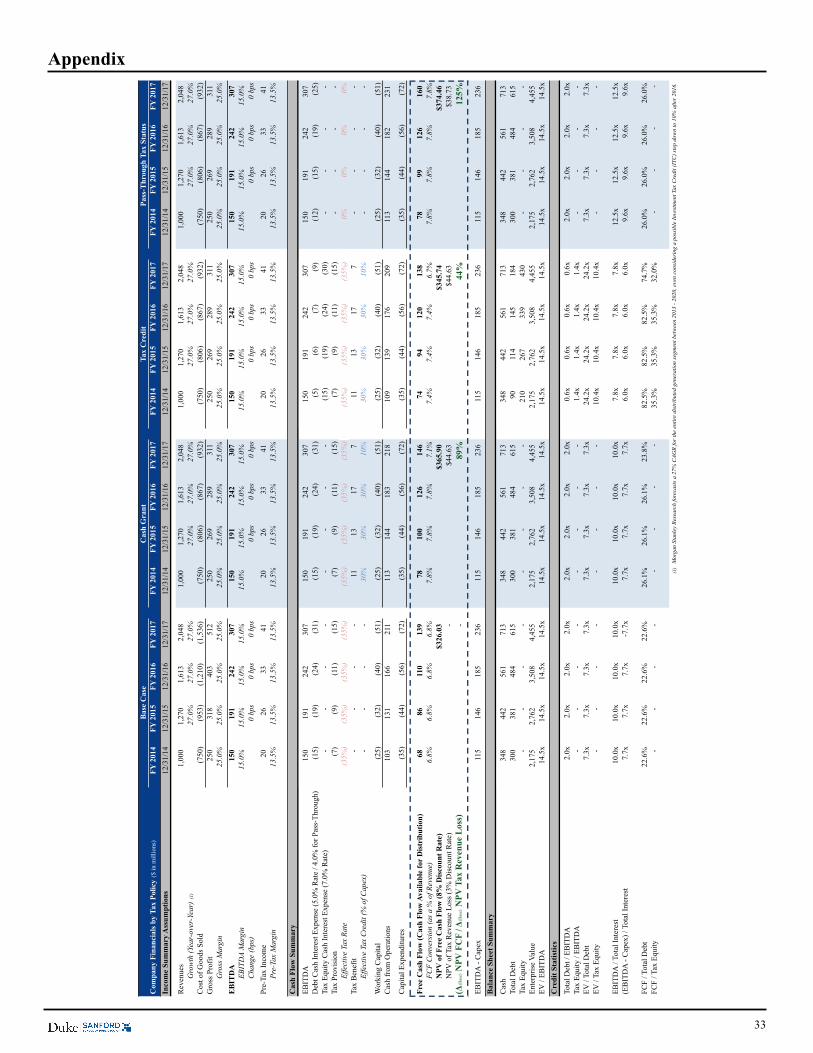
33
Com
pany
Fin
anci
als
by T
ax P
olic
y ($
in m
illio
ns)
FY 2
014
FY 2
015
FY 2
016
FY 2
017
FY 2
014
FY 2
015
FY 2
016
FY 2
017
FY 2
014
FY 2
015
FY 2
016
FY 2
017
FY 2
014
FY 2
015
FY 2
016
FY 2
017
Inco
me
Sum
mar
y A
ssum
ptio
ns12
/31/
1412
/31/
1512
/31/
1612
/31/
1712
/31/
1412
/31/
1512
/31/
1612
/31/
1712
/31/
1412
/31/
1512
/31/
1612
/31/
1712
/31/
1412
/31/
1512
/31/
1612
/31/
17
Rev
enue
s 1,
000
1,
270
1,
613
2,
048
1,
000
1,
270
1,
613
2,
048
1,
000
1,
270
1,
613
2,
048
1,
000
1,
270
1,
613
2,
048
G
row
th (Y
ear-
over
-Yea
r) (1
) 27
.0%
27.0
%27
.0%
27.0
%27
.0%
27.0
%27
.0%
27.0
%27
.0%
27.0
%27
.0%
27.0
%C
ost o
f Goo
ds S
old
(750
)
(953
)
(1,2
10)
(1
,536
)
(750
)
(806
)
(867
)
(932
)
(750
)
(806
)
(867
)
(932
)
(750
)
(806
)
(867
)
(932
)
Gro
ss P
rofit
250
318
403
512
250
269
289
311
250
269
289
311
250
269
289
311
Gro
ss M
argi
n25
.0%
25.0
%25
.0%
25.0
%25
.0%
25.0
%25
.0%
25.0
%25
.0%
25.0
%25
.0%
25.0
%25
.0%
25.0
%25
.0%
25.0
%
EB
ITD
A15
0
19
1
24
2
30
7
15
0
19
1
24
2
30
7
15
0
19
1
24
2
30
7
15
0
19
1
24
2
30
7
EB
ITD
A M
argi
n15
.0%
15.0
%15
.0%
15.0
%15
.0%
15.0
%15
.0%
15.0
%15
.0%
15.0
%15
.0%
15.0
%15
.0%
15.0
%15
.0%
15.0
%C
hang
e (b
ps)
0 bp
s0
bps
0 bp
s0
bps
0 bp
s0
bps
0 bp
s0
bps
0 bp
s0
bps
0 bp
s0
bps
Pre-
Tax
Inco
me
20
26
33
41
20
26
33
41
20
26
33
41
20
26
33
41
Pre-
Tax
Mar
gin
13.5
%13
.5%
13.5
%13
.5%
13.5
%13
.5%
13.5
%13
.5%
13.5
%13
.5%
13.5
%13
.5%
13.5
%13
.5%
13.5
%13
.5%
Cas
h Fl
ow S
umm
ary
EBIT
DA
150
191
242
307
150
191
242
307
150
191
242
307
150
191
242
307
Deb
t Cas
h In
tere
st E
xpen
se (5
.0%
Rat
e / 4
.0%
for P
ass-
Thro
ugh)
(15)
(19)
(24)
(31)
(15)
(19)
(24)
(31)
(5)
(6)
(7)
(9)
(12)
(15)
(19)
(25)
Tax
Equi
ty C
ash
Inte
rest
Exp
ense
(7.0
% R
ate)
-
-
-
-
-
-
-
-
(1
5)
(1
9)
(2
4)
(3
0)
-
-
-
-
Ta
x Pr
ovis
ion
(7)
(9)
(11)
(15)
(7)
(9)
(11)
(15)
(7)
(9)
(11)
(15)
-
-
-
-
Effe
ctiv
e Ta
x Ra
te
(35%
)(3
5%)
(35%
)(3
5%)
(35%
)(3
5%)
(35%
)(3
5%)
(35%
)(3
5%)
(35%
)(3
5%)
0%0%
0%0%
Tax
Ben
efit
-
-
-
-
11
13
17
7
11
13
17
7
-
-
-
-
Effe
ctiv
e Ta
x C
redi
t (%
of C
apex
)-
-
-
-
30
%30
%30
%10
%30
%30
%30
%10
%-
-
-
-
Wor
king
Cap
ital
(25)
(32)
(40)
(51)
(25)
(32)
(40)
(51)
(25)
(32)
(40)
(51)
(25)
(32)
(40)
(51)
Cas
h fr
om O
pera
tions
103
131
166
211
113
144
183
218
109
139
176
209
113
144
182
231
Cap
ital E
xpen
ditu
res
(35)
(44)
(56)
(72)
(35)
(44)
(56)
(72)
(35)
(44)
(56)
(72)
(35)
(44)
(56)
(72)
Free
Cas
h Fl
ow (C
ash
Flow
Ava
ilabl
e fo
r D
istr
ibut
ion)
68
86
110
139
78
10
0
12
6
14
6
74
94
12
0
13
8
78
99
12
6
16
0
FC
F C
onve
rsio
n (a
s a
% o
f Rev
enue
)6.
8%6.
8%6.
8%6.
8%7.
8%7.
8%7.
8%7.
1%7.
4%7.
4%7.
4%6.
7%7.
8%7.
8%7.
8%7.
8%N
PV o
f Fre
e C
ash
Flow
(8%
Dis
coun
t Rat
e)$3
26.0
3$3
65.9
0$3
45.7
4$3
74.4
6N
PV o
f Tax
Rev
enue
Los
s (3%
Dis
coun
t Rat
e)-
$4
4.63
$44.
63$3
8.73
(Δ(B
ase) N
PV F
CF
/ Δ(B
ase) N
PV T
ax R
even
ue L
oss)
-
89%
44%
125%
EBIT
DA
- C
apex
115
146
185
236
115
146
185
236
115
146
185
236
115
146
185
236
Bal
ance
She
et S
umm
ary
Cas
h34
8
44
2
56
1
71
3
34
8
44
2
56
1
71
3
34
8
44
2
56
1
71
3
34
8
44
2
56
1
71
3
To
tal D
ebt
300
381
484
615
300
381
484
615
90
11
4
14
5
18
4
30
0
38
1
48
4
61
5
Ta
x Eq
uity
-
-
-
-
-
-
-
-
210
267
339
430
-
-
-
-
Ente
rpris
e Va
lue
2,17
5
2,76
2
3,50
8
4,45
5
2,17
5
2,76
2
3,50
8
4,45
5
2,17
5
2,76
2
3,50
8
4,45
5
2,17
5
2,76
2
3,50
8
4,45
5
EV /
EBIT
DA
14.5
x14
.5x
14.5
x14
.5x
14.5
x14
.5x
14.5
x14
.5x
14.5
x14
.5x
14.5
x14
.5x
14.5
x14
.5x
14.5
x14
.5x
Cre
dit S
tatis
tics
Tota
l Deb
t / E
BIT
DA
2.0x
2.0x
2.0x
2.0x
2.0x
2.0x
2.0x
2.0x
0.6x
0.6x
0.6x
0.6x
2.0x
2.0x
2.0x
2.0x
Tax
Equi
ty /
EBIT
DA
-
-
-
-
-
-
-
-
1.4x
1.4x
1.4x
1.4x
-
-
-
-
EV /
Tota
l Deb
t7.
3x7.
3x7.
3x7.
3x7.
3x7.
3x7.
3x7.
3x24
.2x
24.2
x24
.2x
24.2
x7.
3x7.
3x7.
3x7.
3xEV
/ Ta
x Eq
uity
-
-
-
-
-
-
-
-
10.4
x10
.4x
10.4
x10
.4x
-
-
-
-
EBIT
DA
/ To
tal I
nter
est
10.0
x10
.0x
10.0
x10
.0x
10.0
x10
.0x
10.0
x10
.0x
7.8x
7.8x
7.8x
7.8x
12.5
x12
.5x
12.5
x12
.5x
(EB
ITD
A -
Cap
ex) /
Tot
al In
tere
st7.
7x7.
7x7.
7x-7
.7x
7.7x
7.7x
7.7x
7.7x
6.0x
6.0x
6.0x
6.0x
9.6x
9.6x
9.6x
9.6x
FCF
/ Tot
al D
ebt
22.6
%22
.6%
22.6
%22
.6%
26.1
%26
.1%
26.1
%23
.8%
82.5
%82
.5%
82.5
%74
.7%
26.0
%26
.0%
26.0
%26
.0%
FCF
/ Tax
Equ
ity-
-
-
-
!
""""""""""""""""""
!""""""""""""""""""
!""""""""""""""""""
!""""""""""""""""""
35.3
%35
.3%
35.3
%32
.0%
!""""""""""""""""""
!""""""""""""""""""
!""""""""""""""""""
!""""""""""""""""""
(1)
Mor
gan
Stan
ley
Rese
arch
fore
cast
s a
27%
CAG
R fo
r th
e en
tire
dist
ribu
ted
gene
ratio
n se
gmen
t bet
wee
n 20
13 -
2020
, eve
n co
nsid
erin
g a
poss
ible
Inve
stm
ent T
ax C
redi
t (IT
C) s
tep
dow
n to
10%
afte
r 20
16.
Bas
e C
ase
Cas
h G
rant
Tax
Cre
dit
Pass
-Thr
ough
Tax
Sta
tus
Appendix
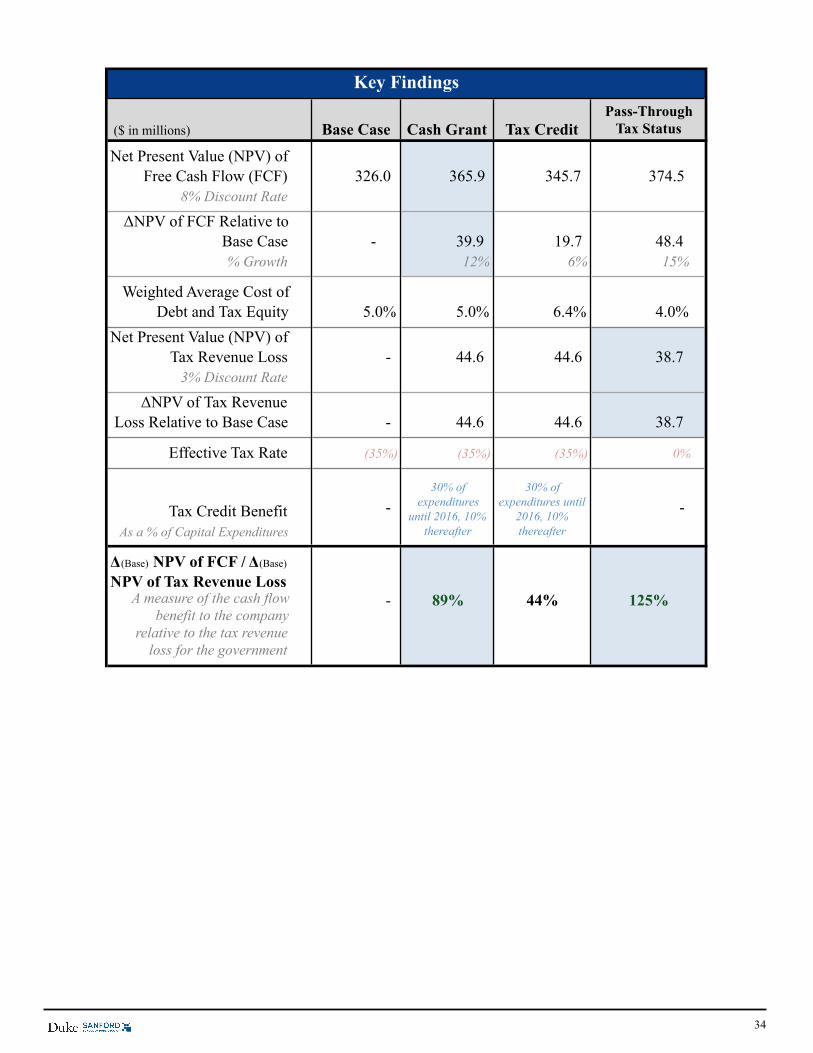
34
($ in millions) Base Case Cash Grant Tax Credit
Net Present Value (NPV) of Free Cash Flow (FCF) 326.0 365.9 345.7 374.5
8% Discount Rate
ΔNPV of FCF Relative to Base Case - 39.9 19.7 48.4 % Growth 12% 6% 15%
Weighted Average Cost of Debt and Tax Equity 5.0% 5.0% 6.4% 4.0%
Net Present Value (NPV) of Tax Revenue Loss - 44.6 44.6 38.7
3% Discount Rate
ΔNPV of Tax Revenue Loss Relative to Base Case - 44.6 44.6 38.7
aEffective Tax Rate (35%) (35%) (35%) 0%
Tax Credit BenefitAs a % of Capital Expenditures
Δ(Base) NPV of FCF / Δ(Base) NPV of Tax Revenue Loss
Key Findings
A measure of the cash flow benefit to the company
relative to the tax revenue loss for the government
- 89% 44% 125%
- - 30% of
expenditures until 2016, 10%
thereafter
30% of expenditures until
2016, 10% thereafter
Pass-Through Tax Status
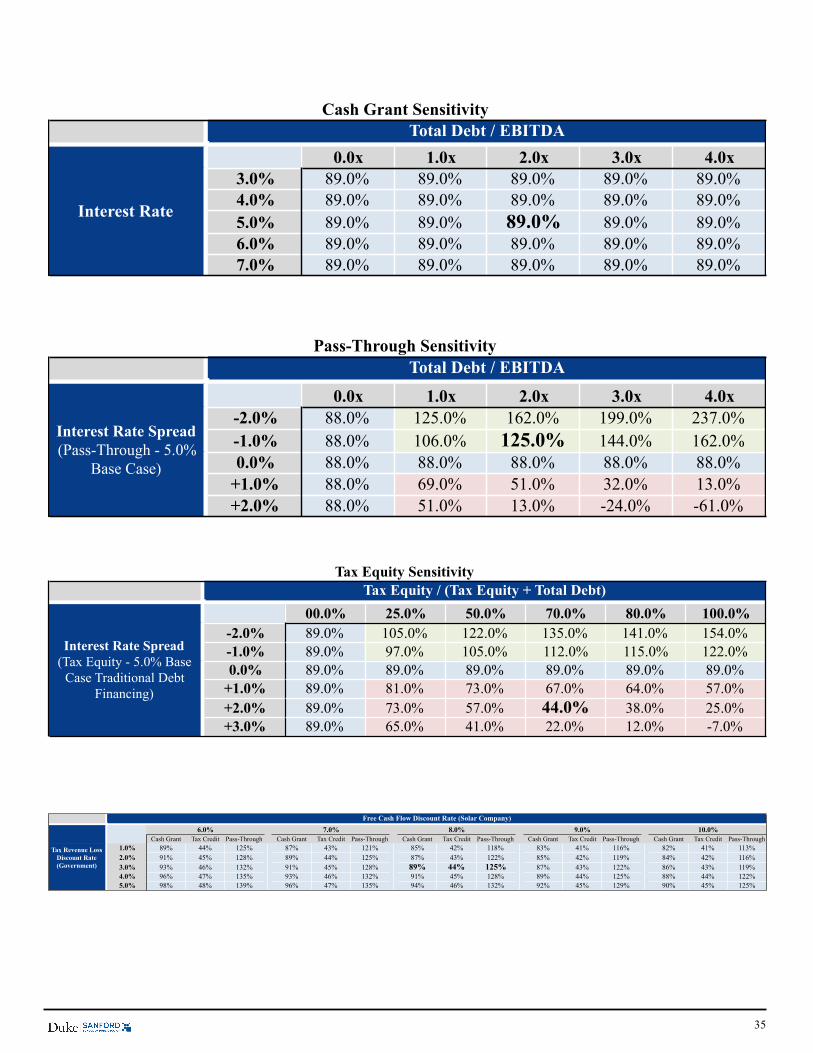
35
Total Debt / EBITDA
0.0x 1.0x 2.0x 3.0x 4.0x3.0% 89.0% 89.0% 89.0% 89.0% 89.0%4.0% 89.0% 89.0% 89.0% 89.0% 89.0%5.0% 89.0% 89.0% 89.0% 89.0% 89.0%6.0% 89.0% 89.0% 89.0% 89.0% 89.0%7.0% 89.0% 89.0% 89.0% 89.0% 89.0%
Interest Rate
Cash Grant Sensitivity
Total Debt / EBITDA
0.0x 1.0x 2.0x 3.0x 4.0x-2.0% 88.0% 125.0% 162.0% 199.0% 237.0%-1.0% 88.0% 106.0% 125.0% 144.0% 162.0%0.0% 88.0% 88.0% 88.0% 88.0% 88.0%
+1.0% 88.0% 69.0% 51.0% 32.0% 13.0%+2.0% 88.0% 51.0% 13.0% -24.0% -61.0%
Interest Rate Spread (Pass-Through - 5.0%
Base Case)
Pass-Through Sensitivity
Tax Equity / (Tax Equity + Total Debt)
00.0% 25.0% 50.0% 70.0% 80.0% 100.0%-2.0% 89.0% 105.0% 122.0% 135.0% 141.0% 154.0%-1.0% 89.0% 97.0% 105.0% 112.0% 115.0% 122.0%0.0% 89.0% 89.0% 89.0% 89.0% 89.0% 89.0%
+1.0% 89.0% 81.0% 73.0% 67.0% 64.0% 57.0%+2.0% 89.0% 73.0% 57.0% 44.0% 38.0% 25.0%+3.0% 89.0% 65.0% 41.0% 22.0% 12.0% -7.0%
Interest Rate Spread (Tax Equity - 5.0% Base
Case Traditional Debt Financing)
Tax Equity Sensitivity
Free Cash Flow Discount Rate (Solar Company)
Cash Grant Tax Credit Pass-Through Cash Grant Tax Credit Pass-Through Cash Grant Tax Credit Pass-Through Cash Grant Tax Credit Pass-Through Cash Grant Tax Credit Pass-Through1.0% 89% 44% 125% 87% 43% 121% 85% 42% 118% 83% 41% 116% 82% 41% 113%2.0% 91% 45% 128% 89% 44% 125% 87% 43% 122% 85% 42% 119% 84% 42% 116%3.0% 93% 46% 132% 91% 45% 128% 89% 44% 125% 87% 43% 122% 86% 43% 119%4.0% 96% 47% 135% 93% 46% 132% 91% 45% 128% 89% 44% 125% 88% 44% 122%5.0% 98% 48% 139% 96% 47% 135% 94% 46% 132% 92% 45% 129% 90% 45% 125%
10.0%
Tax Revenue Loss Discount Rate (Government)
6.0% 7.0% 8.0% 9.0%
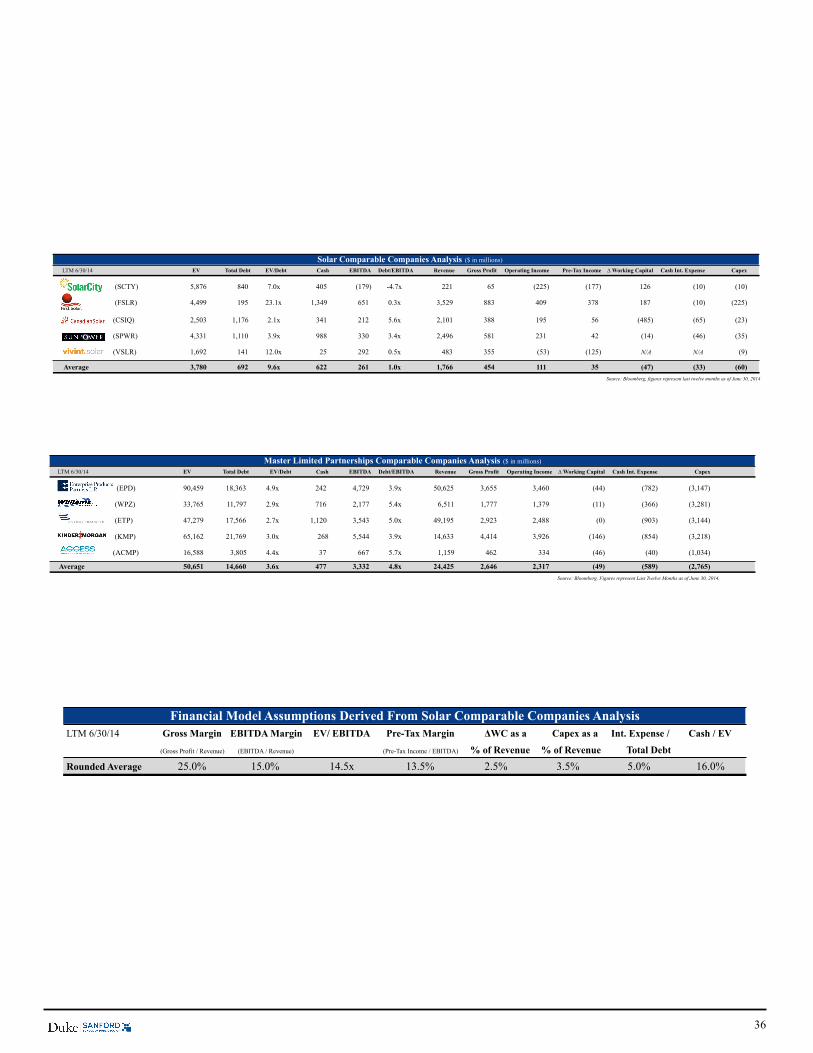
36
Master Limited Partnerships Comparable Companies Analysis ($ in millions) LTM 6/30/14 EV Total Debt EV/Debt Cash EBITDA Debt/EBITDA Revenue Gross Profit Operating Income ∆ Working Capital Cash Int. Expense Capex
(EPD) 90,459 18,363 4.9x 242 4,729 3.9x 50,625 3,655 3,460 (44) (782) (3,147)
(WPZ) 33,765 11,797 2.9x 716 2,177 5.4x 6,511 1,777 1,379 (11) (366) (3,281)
(ETP) 47,279 17,566 2.7x 1,120 3,543 5.0x 49,195 2,923 2,488 (0) (903) (3,144)
(KMP) 65,162 21,769 3.0x 268 5,544 3.9x 14,633 4,414 3,926 (146) (854) (3,218)
(ACMP) 16,588 3,805 4.4x 37 667 5.7x 1,159 462 334 (46) (40) (1,034)
Average 50,651 14,660 3.6x 477 3,332 4.8x 24,425 2,646 2,317 (49) (589) (2,765) Source: Bloomberg. Figures represent Last Twelve Months as of June 30, 2014.
Solar Comparable Companies Analysis ($ in millions) LTM 6/30/14 EV Total Debt EV/Debt Cash EBITDA Debt/EBITDA Revenue Gross Profit Operating Income Pre-Tax Income ∆ Working Capital Cash Int. Expense Capex
(SCTY) 5,876 840 7.0x 405 (179) -4.7x 221 65 (225) (177) 126 (10) (10)
(FSLR) 4,499 195 23.1x 1,349 651 0.3x 3,529 883 409 378 187 (10) (225)
(CSIQ) 2,503 1,176 2.1x 341 212 5.6x 2,101 388 195 56 (485) (65) (23)
(SPWR) 4,331 1,110 3.9x 988 330 3.4x 2,496 581 231 42 (14) (46) (35)
(VSLR) 1,692 141 12.0x 25 292 0.5x 483 355 (53) (125) N/A N/A (9)
Average 3,780 692 9.6x 622 261 1.0x 1,766 454 111 35 (47) (33) (60) Source: Bloomberg, figures represent last twelve months as of June 30, 2014
LTM 6/30/14 Gross Margin EBITDA Margin EV/ EBITDA Pre-Tax Margin ΔWC as a Capex as a Int. Expense / Cash / EV
(Gross Profit / Revenue) (EBITDA / Revenue) (Pre-Tax Income / EBITDA) % of Revenue % of Revenue Total Debt
Rounded Average 25.0% 15.0% 14.5x 13.5% 2.5% 3.5% 5.0% 16.0%
Financial Model Assumptions Derived From Solar Comparable Companies Analysis
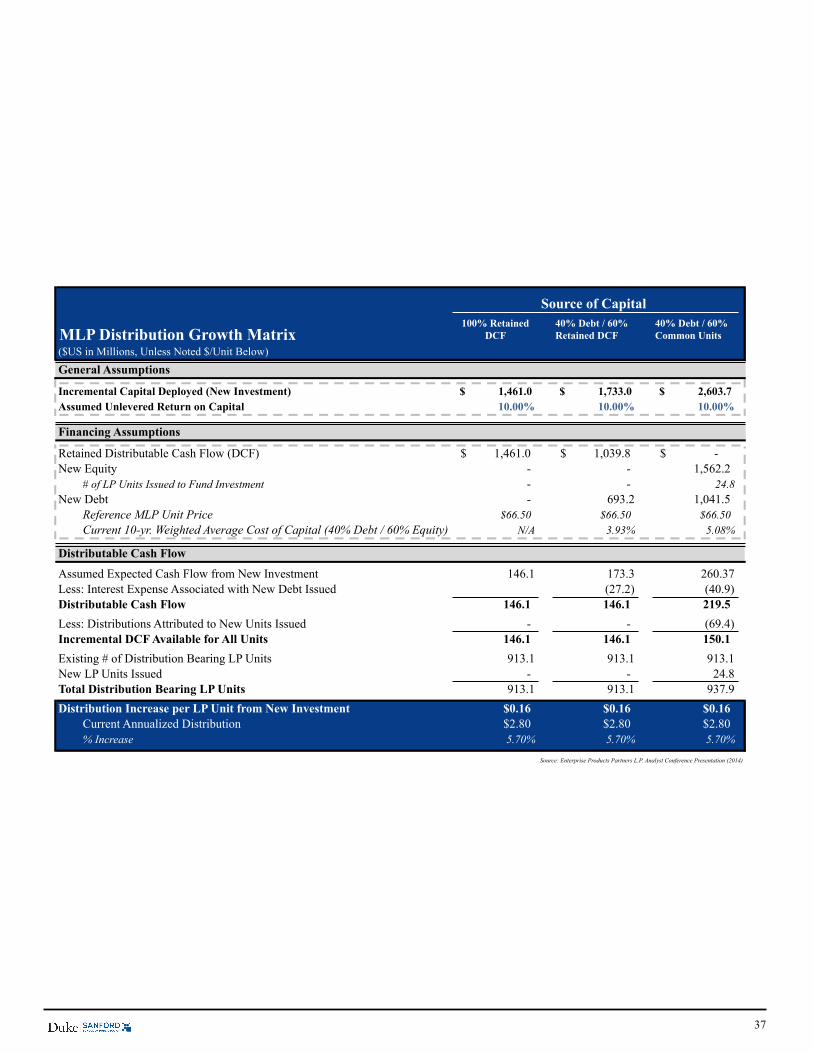
37
MLP Distribution Growth Matrix100% Retained
DCF40% Debt / 60% Retained DCF
40% Debt / 60% Common Units
($US in Millions, Unless Noted $/Unit Below)
General Assumptions
Incremental Capital Deployed (New Investment) 1,461.0$ 1,733.0$ 2,603.7$ Assumed Unlevered Return on Capital 10.00% 10.00% 10.00%
Financing Assumptions
Retained Distributable Cash Flow (DCF) 1,461.0$ 1,039.8$ -$ New Equity - - 1,562.2
# of LP Units Issued to Fund Investment - - 24.8New Debt - 693.2 1,041.5
Reference MLP Unit Price $66.50 $66.50 $66.50Current 10-yr. Weighted Average Cost of Capital (40% Debt / 60% Equity) N/A 3.93% 5.08%
Distributable Cash Flow
Assumed Expected Cash Flow from New Investment 146.1 173.3 260.37Less: Interest Expense Associated with New Debt Issued (27.2) (40.9) Distributable Cash Flow 146.1 146.1 219.5
Less: Distributions Attributed to New Units Issued - - (69.4) Incremental DCF Available for All Units 146.1 146.1 150.1
Existing # of Distribution Bearing LP Units 913.1 913.1 913.1New LP Units Issued - - 24.8Total Distribution Bearing LP Units 913.1 913.1 937.9
Distribution Increase per LP Unit from New Investment $0.16 $0.16 $0.16Current Annualized Distribution $2.80 $2.80 $2.80% Increase 5.70% 5.70% 5.70%
Source: Enterprise Products Partners L.P. Analyst Conference Presentation (2014)
Source of Capital
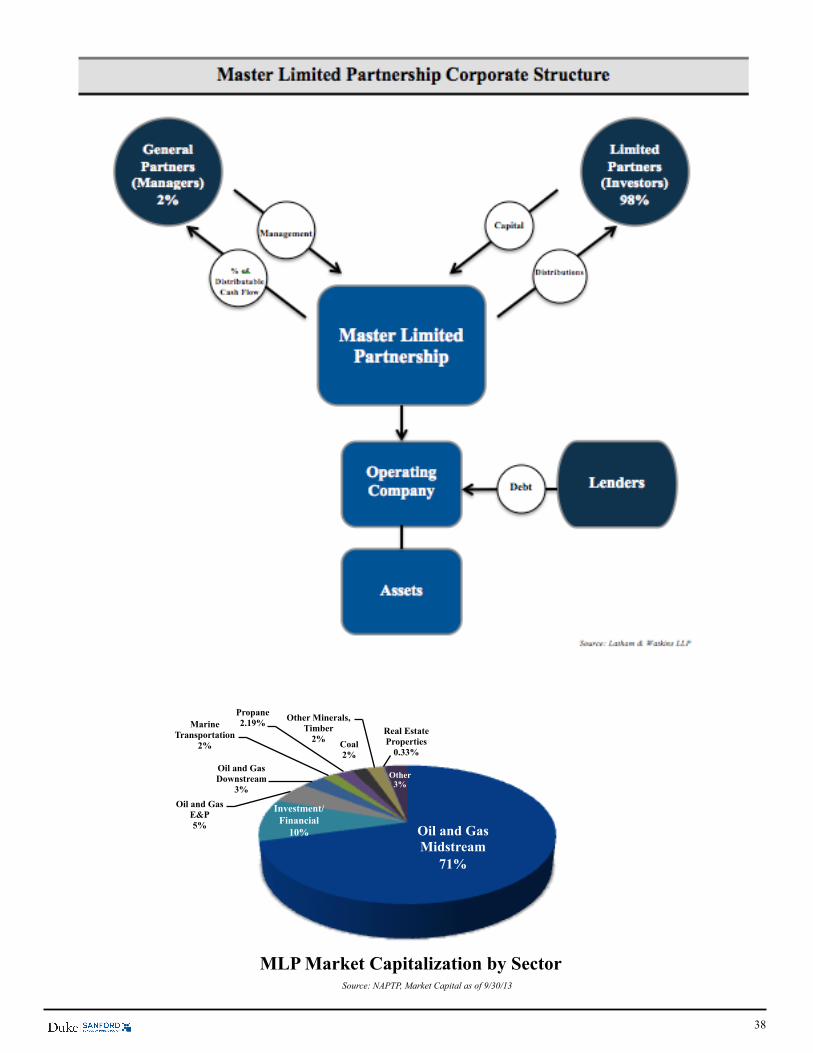
38
Source: NAPTP, Market Capital as of 9/30/13
Oil and Gas Midstream
71%
Investment/Financial
10%
Oil and Gas E&P 5%
Oil and Gas Downstream
3%
Marine Transportation
2%
Propane 2.19%
Coal 2%
Other Minerals, Timber
2% Real Estate Properties
0.33%
Other 3%
MLP Market Capitalization by Sector
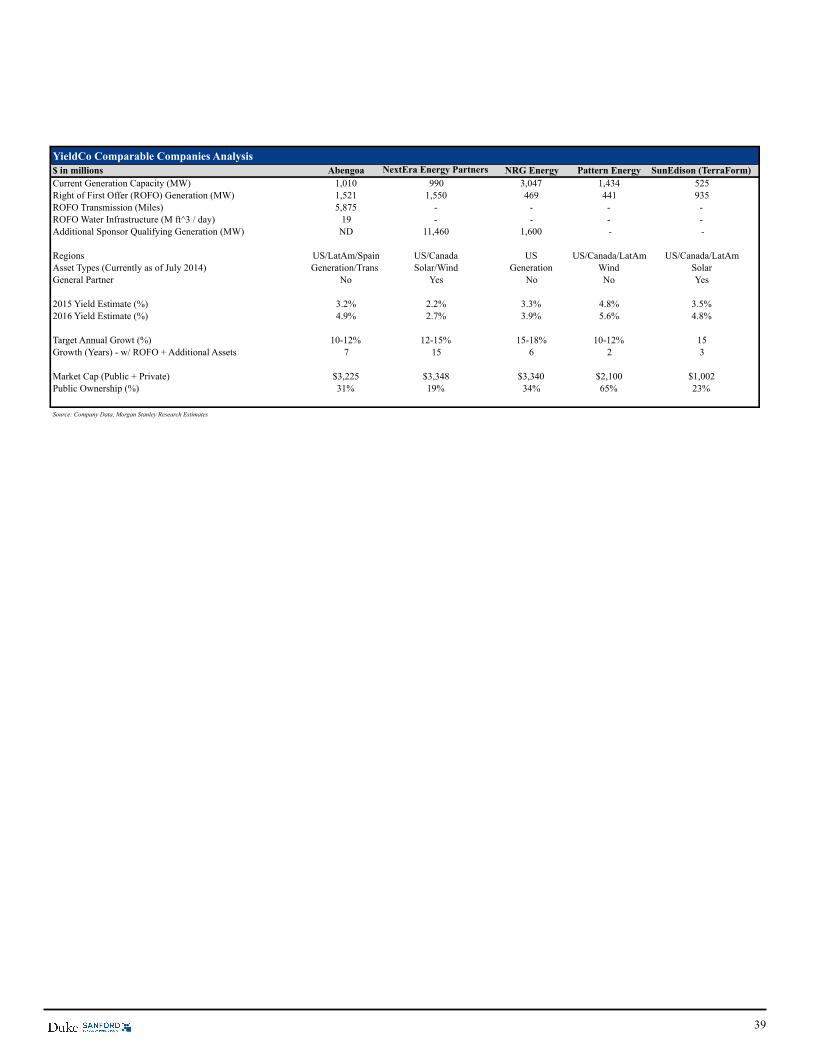
39
YieldCo Comparable Companies Analysis $ in millions Abengoa NextEra Energy Partners NRG Energy Pattern Energy SunEdison (TerraForm)Current Generation Capacity (MW) 1,010 990 3,047 1,434 525Right of First Offer (ROFO) Generation (MW) 1,521 1,550 469 441 935ROFO Transmission (Miles) 5,875 - - - -ROFO Water Infrastructure (M ft^3 / day) 19 - - - -Additional Sponsor Qualifying Generation (MW) ND 11,460 1,600 - -
Regions US/LatAm/Spain US/Canada US US/Canada/LatAm US/Canada/LatAmAsset Types (Currently as of July 2014) Generation/Trans. Solar/Wind Generation Wind SolarGeneral Partner No Yes No No Yes
2015 Yield Estimate (%) 3.2% 2.2% 3.3% 4.8% 3.5%2016 Yield Estimate (%) 4.9% 2.7% 3.9% 5.6% 4.8%
Target Annual Growt (%) 10-12% 12-15% 15-18% 10-12% 15Growth (Years) - w/ ROFO + Additional Assets 7 15 6 2 3
Market Cap (Public + Private) $3,225 $3,348 $3,340 $2,100 $1,002Public Ownership (%) 31% 19% 34% 65% 23%
Source: Company Data, Morgan Stanley Research Estimates
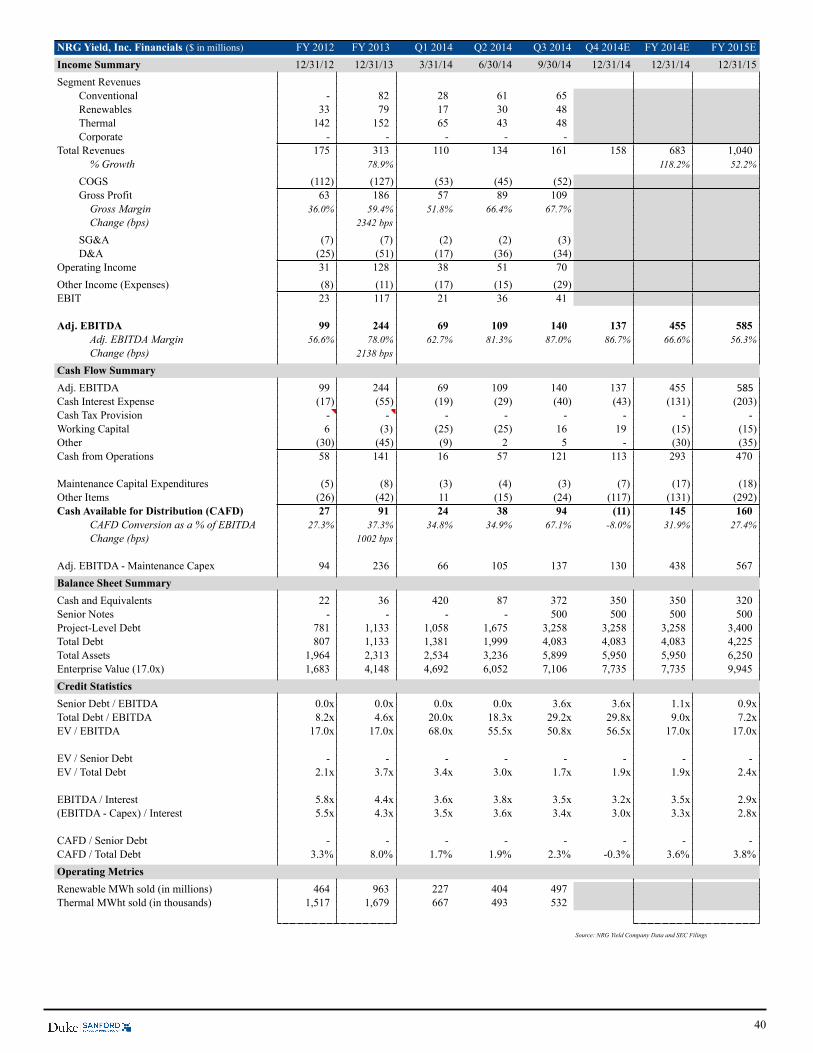
40
NRG Yield, Inc. Financials ($ in millions) FY 2012 FY 2013 Q1 2014 Q2 2014 Q3 2014 Q4 2014E FY 2014E FY 2015EIncome Summary 12/31/12 12/31/13 3/31/14 6/30/14 9/30/14 12/31/14 12/31/14 12/31/15Segment Revenues
Conventional - 82 28 61 65 Renewables 33 79 17 30 48 Thermal 142 152 65 43 48 Corporate - - - - -
Total Revenues 175 313 110 134 161 158 683 1,040 % Growth 78.9% 118.2% 52.2%
COGS (112) (127) (53) (45) (52) Gross Profit 63 186 57 89 109
Gross Margin 36.0% 59.4% 51.8% 66.4% 67.7%Change (bps) 2342 bps
SG&A (7) (7) (2) (2) (3) D&A (25) (51) (17) (36) (34)
Operating Income 31 128 38 51 70 Other Income (Expenses) (8) (11) (17) (15) (29) EBIT 23 117 21 36 41
Adj. EBITDA 99 244 69 109 140 137 455 585 Adj. EBITDA Margin 56.6% 78.0% 62.7% 81.3% 87.0% 86.7% 66.6% 56.3%Change (bps) 2138 bps
Cash Flow Summary Adj. EBITDA 99 244 69 109 140 137 455 585################Cash Interest Expense (17) (55) (19) (29) (40) (43) (131) (203) Cash Tax Provision - - - - - - - - Working Capital 6 (3) (25) (25) 16 19 (15) (15) Other (30) (45) (9) 2 5 - (30) (35) Cash from Operations 58 141 16 57 121 113 293 470
Maintenance Capital Expenditures (5) (8) (3) (4) (3) (7) (17) (18) Other Items (26) (42) 11 (15) (24) (117) (131) (292) Cash Available for Distribution (CAFD) 27 91 24 38 94 (11) 145 160
CAFD Conversion as a % of EBITDA 27.3% 37.3% 34.8% 34.9% 67.1% -8.0% 31.9% 27.4%Change (bps) 1002 bps
Adj. EBITDA - Maintenance Capex 94 236 66 105 137 130 438 567 Balance Sheet Summary Cash and Equivalents 22 36 420 87 372 350 350 320 Senior Notes - - - - 500 500 500 500 Project-Level Debt 781 1,133 1,058 1,675 3,258 3,258 3,258 3,400 Total Debt 807 1,133 1,381 1,999 4,083 4,083 4,083 4,225 Total Assets 1,964 2,313 2,534 3,236 5,899 5,950 5,950 6,250 Enterprise Value (17.0x) 1,683 4,148 4,692 6,052 7,106 7,735 7,735 9,945 Credit StatisticsSenior Debt / EBITDA 0.0x 0.0x 0.0x 0.0x 3.6x 3.6x 1.1x 0.9xTotal Debt / EBITDA 8.2x 4.6x 20.0x 18.3x 29.2x 29.8x 9.0x 7.2xEV / EBITDA 17.0x 17.0x 68.0x 55.5x 50.8x 56.5x 17.0x 17.0x
EV / Senior Debt - - - - - - - - EV / Total Debt 2.1x 3.7x 3.4x 3.0x 1.7x 1.9x 1.9x 2.4x
EBITDA / Interest 5.8x 4.4x 3.6x 3.8x 3.5x 3.2x 3.5x 2.9x(EBITDA - Capex) / Interest 5.5x 4.3x 3.5x 3.6x 3.4x 3.0x 3.3x 2.8x
CAFD / Senior Debt - - - - - - - - CAFD / Total Debt 3.3% 8.0% 1.7% 1.9% 2.3% -0.3% 3.6% 3.8%Operating MetricsRenewable MWh sold (in millions) 464 963 227 404 497 Thermal MWht sold (in thousands) 1,517 1,679 667 493 532
Source: NRG Yield Company Data and SEC Filings
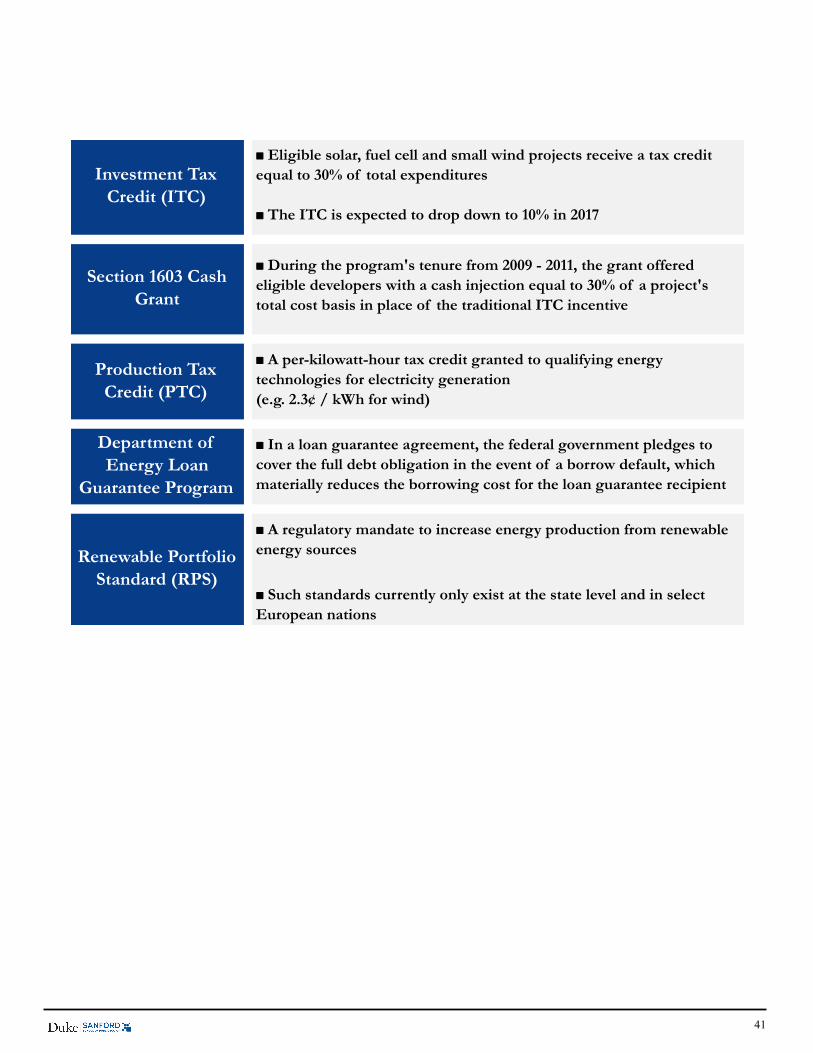
41
Eligible solar, fuel cell and small wind projects receive a tax credit equal to 30% of total expenditures
The ITC is expected to drop down to 10% in 2017
During the program's tenure from 2009 - 2011, the grant offeredeligible developers with a cash injection equal to 30% of a project'stotal cost basis in place of the traditional ITC incentive
A per-kilowatt-hour tax credit granted to qualifying energytechnologies for electricity generation(e.g. 2.3¢ / kWh for wind)
In a loan guarantee agreement, the federal government pledges to cover the full debt obligation in the event of a borrow default, which materially reduces the borrowing cost for the loan guarantee recipient
A regulatory mandate to increase energy production from renewable energy sources
Such standards currently only exist at the state level and in selectEuropean nations
Investment Tax Credit (ITC)
Section 1603 Cash Grant
Production Tax Credit (PTC)
Department of Energy Loan
Guarantee Program
Renewable Portfolio Standard (RPS)
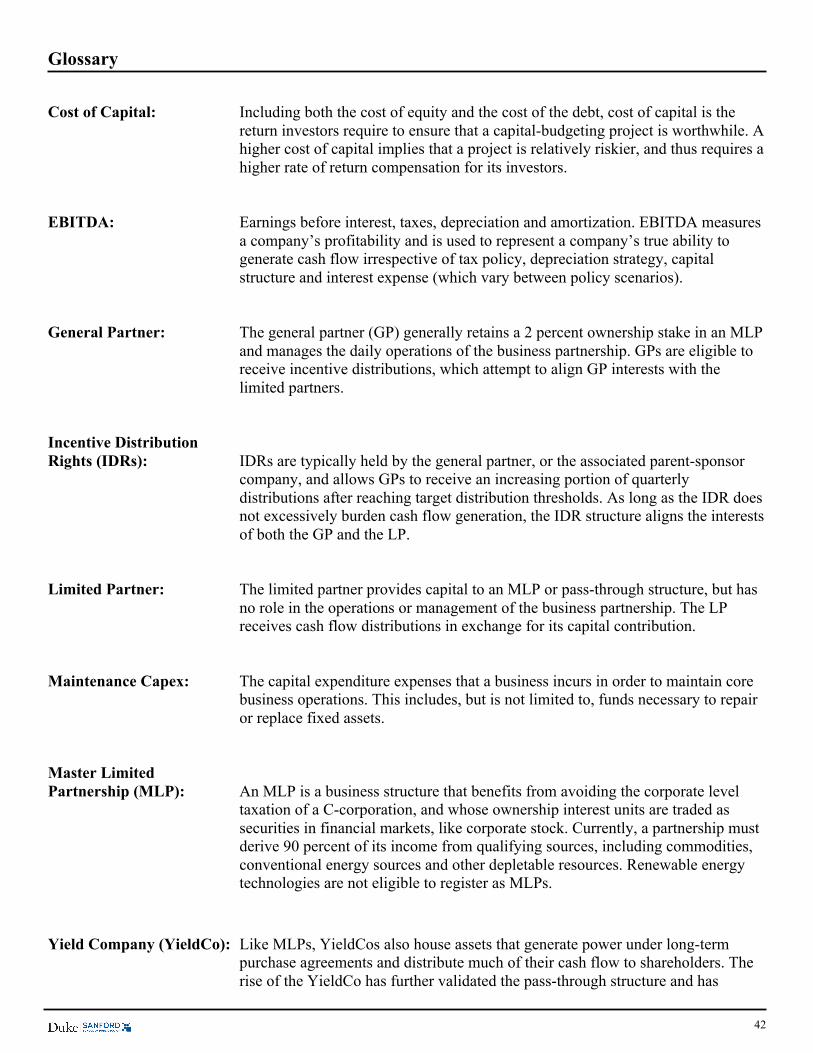
42
Glossary Cost of Capital: Including both the cost of equity and the cost of the debt, cost of capital is the
return investors require to ensure that a capital-budgeting project is worthwhile. A higher cost of capital implies that a project is relatively riskier, and thus requires a higher rate of return compensation for its investors.
EBITDA: Earnings before interest, taxes, depreciation and amortization. EBITDA measures
a company’s profitability and is used to represent a company’s true ability to generate cash flow irrespective of tax policy, depreciation strategy, capital structure and interest expense (which vary between policy scenarios).
General Partner: The general partner (GP) generally retains a 2 percent ownership stake in an MLP
and manages the daily operations of the business partnership. GPs are eligible to receive incentive distributions, which attempt to align GP interests with the limited partners.
Incentive Distribution Rights (IDRs): IDRs are typically held by the general partner, or the associated parent-sponsor
company, and allows GPs to receive an increasing portion of quarterly distributions after reaching target distribution thresholds. As long as the IDR does not excessively burden cash flow generation, the IDR structure aligns the interests of both the GP and the LP.
Limited Partner: The limited partner provides capital to an MLP or pass-through structure, but has
no role in the operations or management of the business partnership. The LP receives cash flow distributions in exchange for its capital contribution.
Maintenance Capex: The capital expenditure expenses that a business incurs in order to maintain core
business operations. This includes, but is not limited to, funds necessary to repair or replace fixed assets.
Master Limited Partnership (MLP): An MLP is a business structure that benefits from avoiding the corporate level
taxation of a C-corporation, and whose ownership interest units are traded as securities in financial markets, like corporate stock. Currently, a partnership must derive 90 percent of its income from qualifying sources, including commodities, conventional energy sources and other depletable resources. Renewable energy technologies are not eligible to register as MLPs.
Yield Company (YieldCo): Like MLPs, YieldCos also house assets that generate power under long-term
purchase agreements and distribute much of their cash flow to shareholders. The rise of the YieldCo has further validated the pass-through structure and has

43
incentivized developers to create publicly traded yield-oriented investment vehicles by offering exposure to an alternative investor pool with a more competitive source of equity capital. The current tax depreciation system enables renewable developers to use an accelerated 5-year depreciation timetable; therefore, YieldCos can report accounting losses, ultimately replicating the tax benefits of an MLP structure through offsetting future tax credits.
44
References
1. http://css.snre.umich.edu/css_doc/CSS03-11.pdf 2. http://emp.lbl.gov/sites/all/files/lbnl-1642e.pdf 3. http://www.naptp.org/documentlinks/Investor_Relations/MLP_101.pdf 4. Cunningham, Lynn J., and Beth A. Roberts. Renewable Energy and Energy Efficiency Incentives: A
Summary of Federal Programs. Rep. Washington, D.C.: Congressional Research Service, 2013. 5. (Obama, Barack. "2011 State of the Union Address." State of the Union. U.S. Capitol, Washington, D.C.
25 Jan. 2011. Speech. 6. "Renewable Electricity Production Tax Credit (PTC)." DSIRE. Database of State Incentives for
Renewables & Efficiency, 02 Oct. 2013. Web. 10 Apr. 2014. <http://dsireusa.org/incentives/incentive.cfm?Incentive_Code=US13F>.
7. House Committee on Oversight and Government Reform Subcommittee on Energy Policy, Health Care and Entitlements Hearing on Oversight of the Wind Energy Production Tax Credit (2013) (testimony of Dan W. Reicher).
8. http://nationalaglawcenter.org/wp-content/uploads//assets/crs/R43453.pdf 9. "Business Energy Investment Tax Credit (ITC)." DSIRE. Database of State Incentives for Renewables
& Efficiency, 13 Mar. 2014. Web. 10 Apr. 2014. <http://www.dsireusa.org/incentives/incentive.cfm?Incentive_Code=US02F>.
10. https://science.house.gov/sites/republicans.science.house.gov/files/documents/hearings/HHRG-112-SY21-WState-MSherlock-20120419.pdf
11. http://www.treasury.gov/initiatives/recovery/Documents/Status percent20overview.pdf 12. http://energy.gov/lpo/services/section-1703-loan-program 13. http://energy.gov/sites/prod/files/2014/03/f14/Fossil-Solicitation-FINAL.pdf 14. http://www.dsireusa.org/documents/summarymaps/RPS_map.pdf 15. Mormann, Felix. "Beyond Tax Credits – Smarter Tax Policy for a Cleaner, More Democratic Energy
Future." Social Science Research Network, 1 Oct. 2013. Web. 10 Apr. 2014. <http://ssrn.com/abstract percent3D2367780>.
16. http://www.novoco.com/energy/resource_files/advocacy/ncoep_testimony_042710.pdf 17. http://www.morganstanleyfa.com/public/projectfiles/4735a09e-c35d-4545-a059-8873c8d057f0.pdf 18. Sorice, Jeannette. Adapting Master Limited Partnerships as a Policy Option for the Renewable Energy
Industry. Thesis. Duke University, 2012. Durham: Duke University, 2012. 19. Coons, Chris. Master Limited Partnerships Parity Act. Rep. U.S. Senator Chris Coons of Delaware, 24
Apr. 2013. Web. 11 Feb. 2014. <www.coons.senate.gov/mlp>. 20. http://www.energytrendsinsider.com/2014/05/29/the-mlp-parity-act-is-a-no-brainer/ 21. Sherlock, Molly F., and Mark P. Keightley. Master Limited Partnerships: A Policy Option for the
Renewable Energy Industry. Rep. Washington, D.C.: Congressional Research Service, 2011. 22. http://www.brookings.edu/research/opinions/2013/12/19-clean-energy-mormann-reicher-muro 23. https://www.google.com/?gws_rd=ssl#safe=off&q=cost+of+capital+definition 24. http://online.barrons.com/articles/SB50001424053111904329504580080520057069024 25. Morgan Stanley Research SolarCity Corporation Note (August 14, 2014) 26. http://www.nrel.gov/docs/gen/fy02/30845.pdf – Still using it?? 27. http://www.rff.org/documents/RFF-DP-12-03.pdf 28. http://www.leahy.senate.gov/imo/media/doc/R41227EnergyLegReport.pdf 29. Morgan Stanley Research, Diversified Utilities/IPPs: YieldCos Have Arrived; Initiatie on NEP & ABY
at EW (July 22, 2014) 30. https://www.moodys.com/research/Moodys-New-MLPs-yieldcos-expected-in-the-utilitiespower-sector--
PR_295325?WT.mc_id=NLTITLE_YYYYMMDD_PR_295325