Application of the finite element groundwater model FEWA ...
Upload
trankhuongCategory
view
214download
0
Driving Productivity & Profitability of Energy Efficiency in the UAE

1

Authored by:Youssef Al Abd1
Omar Saif1
Majid Al Jasmi1
Supervised by:Dr. Sameh El Khatib1
Dr. Steve Griffiths2
Dr. Marwan Al-Roub3
1Analysis & Simulation of Engineering Systems (ASES) Laboratory Institute, Center for Smart and Sustainable Systems (iSMART), Masdar Institute of Science & Technology.
2Executive Director of Institute Initiatives, Masdar Institute of Science & Technology
3Ecomagination Center Director General Electric
2
Since the unification and founding of the U.A.E., the country has witnessed rapid population growth and economic development, brought on by sharp increases in oil revenues. Such growth coupled with increased urbanization and industrialization, has resulted in a precipitous rise in energy demand. While the country has done well in the past to match national energy supply with the ever rising demand, should electricity consumption continue to rise at the current rate, the county is expected to face a supply-demand deficit by 2030. Given that the current power generation in the country is almost exclusively reliant on natural gas, a resource which is now being partially imported, the electricity balance challenge is not merely an issue of energy security but one of national wealth as well.
Cognizant of this, the U.A.E. has begun working, both on increasing its generation capacity as well as diversifying the electricity profile of the country through renewables and nuclear, with the ultimate aim of decreasing dependency on natural gas (which currently represents around 98 percent of the used feedstock for power generation).
The above highlights the country’s effort at addressing the energy challenge from a supply point of view. However, this white paper will highlight possible national wealth savings which the U.A.E. can achieve through a number of selected efficiency enhancement interventions over its electricity value chain - from primary energy extraction (oil & gas), to power generation (captive and non-captive), and lastly to electricity end-use. The paper explores various interventions which can help decrease the net energy demand - resulting in cost savings, lower carbon footprint, and reduced reliance on fossil fuels. Together, this will lead to greater energy security for the country.
While the interventions analyzed by no means represent an exhaustive list, they were identified by the collaborative team at Masdar Institute and General Electric as major sources for national wealth savings and an appropriate stepping stone for future research. In the paper, the potential national wealth savings for the U.A.E. government are calculated across different energy efficiency interventions using an in-house model developed at Masdar Institute. The savings are broken down according to their type, which include: fossil fuel subsidy savings (FSS) – from natural gas and diesel; electricity tariff subsidy savings (TSS); and opportunity cost savings (OCS) from the potential export of natural gas and diesel at a higher international market price.
The findings from the study are consistent with existing research in the field that cites energy efficiency enhancement as not only environmentally beneficial, but profitable as well.
According to the findings of this paper, electricity end-use showed the highest potential annual savings, particularly from interventions in cooling and lighting. The technical “market size” of savings from energy efficiency at end-use was estimated at around AED 20 billion annually. Interventions in oil & gas generated the second largest savings at around AED 3 billion per year, with savings from power generation being the lowest standing anywhere between AED 200 million to AED 600 million annually, depending on the efficiency enhancement scenario.
EXECUTIVE SUMMARY
3
CONTENTSCHAPTER ONE: Introduction 7
1.1. Motivations 7 1.2. Research objectives and scope 7 1.3. Approach to savings calculations 9 1.4. U.A.E. Electricity sector overview 10
CHAPTER TWO: Efficiency Enhancements in the Electricity Value Chain 11
2.1. Explored retrofits in oil & gas sector 12 2.1.1. Waste heat to power (WHP) 12 2.1.2. NG Engines for gas-flare utilization 12 2.2. Explored retrofits in power generation 13 2.2.1. NG Turbine enhancements 13 2.2.2. Industrial Internet 13 2.3. Explored retrofits in electricity end-use 13 2.3.1. Lighting 13 2.3.2. Wall insulation 14 2.3.3. Cooling 14 2.3.4. Set-point temperature 14 2.3.5. Industrial Internet 14
CHAPTER THREE: Efficiency Enhancement Potential in the Oil & Gas Sector 15
3.1. Approach & model 15 3.2. Scenario analysis 16 3.2.1. NG engines 16 3.2.2. Waste heat to power 16
CHAPTER FOUR: Efficiency Enhancement Potential in Power Generation 19
4.1. Approach & model 19 4.2. Scenario analysis 19 4.2.1. Utility-level power generation 19 4.2.2. Industry-level power generation 22 4.2.3. Total savings and break-even-investment of efficiency enhancements 23 4.2.4. Potential savings and break-even-investment for U.A.E. by manufacturer 24
CHAPTER FIVE: Efficiency Enhancement Potentials in Electricity End-use 26
5.1. Approach & model 26 5.2. Scenario analysis 27 5.2.1. National savings from end-use efficiency enhancement 29 5.2.2. Potential national savings from end-use efficiency enhancement by manufacturer 30
CHAPTER SIX: Comparative Analysis of Electricity Value Chain Interventions 31
CHAPTER SEVEN: Conclusion 35
Key Findings 35 Future work 36
4

LIST OF FIGURES
5
Figure 1: U.A.E.’s NG supply-demand gap (2003-2013) 7
Figure 2: U.A.E. 2012 Energy Balance [4] 8
Figure 3: U.A.E. Utility agencies 10
Figure 4: Proportion of electricity generation capacity in the U.A.E. (2011) 10
Figure 5: Map of introduced retrofits along the U.A.E. energy value chain 11
Figure 6: Schematic of a Rankin Cycle heat engine 12
Figure 7: General Electric Organic Heat Recovery System [12] 12
Figure 8: GE's Jenbacher (A) and Waukesha (B) engines 13
Figure 9: NG engines vs. gas flaring for off-shore/on-shore oil rigs 15
Figure 10: Potential electricity production from AG in U.A.E. 16
Figure 11: Potential cost savings from NG engines in U.A.E. 16
Figure 12: U.A.E. Refinery waste heat, 2013 17
Figure 13: Potential cost savings from WHP 18
Figure 14: CO2 Abated from oil & gas interventions 18
Figure 15: Break-eveninvestment for NG engine installment at all oil rigs & WHP at all oil refineries in the U.A.E.
18
Figure 16: U.A.E. Power generation savings model 19
Figure 17: NG & cost savings from ADWEA plants under three efficiency increase scenarios 20
Figure 18: NG & cost savings from DEWA plants under three efficiency increase scenarios 21
Figure 19: NG & cost savings from SEWA plants under three efficiency increase scenarios 21
Figure 20: NG & cost savings from FEWA plants under three efficiency increase scenarios 21
Figure 21: NG & cost savings for U.A.E. plants under three efficiency increase scenarios 22
Figure 22: 2014 Electricity generation by industry 23
Figure 23: U.A.E. NG and cost savings from aluminum industry at various efficiency enhancements
23
Figure 24: Break-even investment for all U.A.E. plants by efficiency scenario 24
Figure 25: Potential cost savings for U.A.E. by GE under various efficiency enhancement scenarios
25
Figure 26: Potential CO2 reductions for U.A.E. by GE under various efficiency enhancement scenarios
25
Figure 27: Break-even investment for GE’s share of power generation by efficiency enhancement scenario
25
Figure 28: End-use model overview 27
Figure 29: BAU electricity consumption break down 27
Figure 30: MACC for residential buildings 20 years, 4% discount rate 28
Figure 31: MACC for office buildings 20 years, 4% discount rate 28

Table 1: U.A.E. Key country statistics 7
Table 2: Renewable and nuclear projects in the U.A.E. 8
Table 3: Number of power plants in the U.A.E. according to off-taker and plant ownership 10
Table 4: Tariff structures of U.A.E. utility agencies 10
Table 5: Lighting technology energy and cost comparison 14
Table 6: Wall insulation retrofits summary 14
Table 7: Cooling retrofits summary 14
Table 8: NG engines model parameters 16
Table 9: Heat recovery model parameters 17
Table 10: Summary of cost savings in oil & gas for U.A.E. government 18
Table 11: Assumed natural gas costs and model parameters for utility-level power generation 20
Table 12: Assumed natural gas costs and model parameters for industry-level power generation
23
Table 13: Summary of cost savings in power generation for U.A.E. government 23
Table 14: GE technology penetration in U.A.E. power generation facilities 24
Table 15: Scenario parameters for different building type technology combinations and penetration rates
30
Table 16: Assumed parameters for comparative analysis 31
LIST OF TABLES
6
Figure 32: MACC for retail buildings 20 years, 4% discount rate 28
Figure 33: MACC for villa 20 years, 4% discount rate 28
Figure 34: Potential market size of savings by technology and building-type for the cities of Dubai, Abu Dhabi & Sharjah
29
Figure 35: Technical market size of savings by building-type for the cities of Dubai, Abu Dhabi & Sharjah
30
Figure 36: Potential savings from LED retrofits by building type at various penetration rates for Abu Dhabi, Dubai & Sharjah
30
Figure 37: Energy losses within electricity value chain 31
Figure 38 (A): Unit level SS & OCS by intervention, (B): Absolute TSS by intervention, (C): Absolute TSS and unit level FFSS & OCS by intervention
32
Figure 39 (A): Unit level BEI on the FFSS & OCS; (B): Absolute BEI on the TSS; (C): Total BEI on the absolute TSS and unit level FFSS & OCS
33
Figure 40: U.A.E. NG and CO2 savings by intervention 34

D E V E L O P M E N TE C O N O M I C
CHAPTER ONE: Introduction1.1. Motivations:The U.A.E is classified as a high-income developing country, depending highly on hydrocarbon products in supporting its economical accomplishments. In 2013, the U.A.E.’s oil and gas activities accounted for 45% of its $383 billion GDP, standing at $42K per capita. Given the country’s strong economic activities, its population has been undergoing a continuous increase at a 7.7% annual growth rate, accumulating a total of 9.35 million people in 2014[1][2][3].
With the abundance of fossil fuel resources, the country passed on cheaper energy prices, both on stationary as well as non-stationary means of utilization, and by that contributed to an inefficient use of energy across the country. Subsequently, the U.A.E. stands at one of the highest countries of energy consumption, as well as CO2 emissions per capita as shown in the below figure.
13
YEAR
23
YEAR
The U.A.E holds one of the highest levels of per capita consumption of energy and greenhouse gas production globally.
CO2 Emissions Energy Consumption
Elaborating on the aforementioned, the country has historically installed a highly-subsidized electricity tariff structure, which has led to high electricity consumption mainly driven by cheap electricity tariffs. In addition, and in parallel to the country’s economic and population growth, electricity consumption is expected to grow by 7-10% annually at 2,425 GWh/year, from 2014-2020.
To meet the country’s electricity demand, the U.A.E. depends 98% on natural gas (NG) for its power generation. Despite the country’s abundant NG resources, the U.A.E. began importing gas from Qatar through the Dolphin Project to meet the NG supply-demand deficit shown in Figure 1.
In addition, Figure 2 illustrates U.A.E.’s 2012 energy balance. The energy balance highlights the prominent role fossil fuels play in meeting the country’s internal demand, as well as the high level of fossil fuels exports that generate wealth for the country.
Figure 1: U.A.E’s NG supply-demand gap (2013-2003)
Table 1: U.A.E. key country statistics
7

E N E R G YS E C U R I T Y
L O W E R C A R B O N F O O T P R I N T
1) 26% of the country’s NG production is re-injected for enhanced oil recovery (EOR), presented under industry in Figure 2.
2) Long term contract with Japan, accounting for 281 Bcf of the country’s NG production.
3) The U.A.E’s NG is high in sulfur which makes it economically less feasible when compared to gas imported from Qatar.
Furthermore, both figures highlight the domestic NG deficit which can be attributed to a number of factors, including, but not limited to [5]:
Figure 2: U.A.E. 2012 Energy Balance [4]
Nevertheless, the country is still expected to face challenges
in meeting its growing demand given the country’s soaring
population and consumptive habits. Consequently, in
conjunction with other cost and resource saving initiatives,
a vital component of achieving long-term energy security
within the U.A.E. is the transition towards higher efficiency
technologies along the electricity value chain, which is the prime objective of the white paper.
1.2. Research objectives and scopeThe objective of this collaborative Masdar Institute – General Electric (MI-GE) project is to demonstrate how the adoption of higher efficiency products throughout the electricity value chain can generate national wealth savings for the U.A.E. government by decreasing NG consumption and hence decreasing the carbon intensity of the electricity value chain.
To achieve the research objective, a bottom-up holistic U.A.E. energy sector model was created at Masdar Institute to simulate the adoption of different efficiency retrofits and their economic impact on the country’s national wealth. The model looks at the current technologies utilized over the U.A.E. electricity value chain and compares them with higher efficiency alternatives.
The scope of the research is defined primarily for the electricity sector of the U.A.E., represented in Figure 2 and Figure 5. The electricity sector was chosen specifically as it presents the greatest concern for the U.A.E. in terms of long term sustainability and security, resultant on the 98% dependency on NG for power generation. Consequently, the report provides a snapshot of the electricity sector for the country as a whole according to the three segments of the electricity value chain: primary energy extraction (provides fuels for power generation); power generation; and end-use.
The initial stage explores energy use in primary energy extraction; which in the case of the U.A.E. encompasses oil
Table 2: Renewable and nuclear projects in the U.A.E.
8

D E V E L O P M E N TE C O N O M I C
and gas, as little to no other fuel/resource types are currently extracted in the country (i.e. uranium or coal).
The second stage of the value chain reflects power generation. Given the structure of the electricity sector in the U.A.E., the research scope for power generation is centered on gas-fired power plants overseen by the country’s utility agencies which handle the purchase, transmission, and distribution of electricity. However, it is worth noting that much of the power generation occurs on-site (captive) by heavy industries such as aluminum. Consequently, captive industry-level power generation was also included in the model.
The last stage of the value chain explores on-grid electricity end-use for the greatest electricity-consuming building types in the U.A.E. according to the Abu Dhabi Urban Planning Council (UPC). The building types include: residential; retail; offices; and villas. The geographic scope of research on end-use is city level, and includes the cities of Abu Dhabi, Dubai, and Sharjah. The on-grid electricity demand from the industrial sector is not included in the analysis due to its relatively low consumption compared with the rest of industry; with most electricity consumption by industry being captive and self-generated, either through diesel or NG.
1.3. Approach to savings calculationsThe study depended on calculating: 1 - NG/Diesel subsidy savings, 2 - Opportunity cost, 3 - Tariff subsidy savings and 4 - Break-even investment, which are described below.
Fossil fuel prices/costs for the country, utilities, and consumers were all assumed in an informative manner through both internal discussions (Masdar internal discussions), as well as external (Masdar-GE) discussions to assure the most possible accuracy despite the lack of certain data. In addition to fuel pricing assumptions, a number of other assumptions were considered as will be seen in following sections.
1. NG/Diesel subsidy savingsUnder the study, subsidy savings are calculated as the difference between the U.A.E cost of NG or diesel and the price in which the country supplies them for domestic utilization. Calculation equations are summarized below, which are applicable if, and only if, the U.A.E. fuel cost is higher than their domestically supplied price.
SSji = FCi – FPji SSji: Subsidy Savings from domestic fuel i supplied to jFCi: Fuel i U.A.E Cost FPji: Fuel i domestic supply Price to j i: Natural gas,Diesel j: DEWA,SEWA,FEWA,ADWEA
2. Opportunity costOpportunity cost is calculated as the difference between the U.A.E. domestically supplied fossil fuel price and the international market price. Therefore, the following equations are applicable if, and only if, the market price is higher than the supplied resource domestic price.
OCji = FPji – FMPi OCji: Opportunity Cost on fuel i supplied to j FPji: Fuel i U.A.E domestic supply Price to j FMPi: Fuel i international Market Price i:Natural gas,Diesel j:DEWA,SEWA,FEWA,ADWEA
3. Tariff subsidy savings As mentioned in the above sections, the U.A.E. subsidizes up to 85% of the electricity cost.
Therefore, and since the current tariff structures of different utilities are available, the tariff subsidies were calculated based on the following equation:
TSSi = CEPi - ETi CEPi = ETi / (85%) TSSi:Tariff Subsidy Savings at utility i CEPi:Cost of Electricity Production (Utility i) ETi:Electricity Tariff structure (Utility i) i:DEWA,SEWA,FEWA,ADWEA
4- Break-even investment “BEI”Finally, the break-even investment (synonymous with the net present value – NPV) was calculated, which gives an indication of what the investment value of intervention is worth given the potential DHS savings, interest rate, and life time of the technology deployed. Once the above mentioned savings are calculated, the BEI/NPV is calculated through the following equation:
NPVi = ai/r (1-1/1+rn) NPVi :BEI/Net Present Value form adopting intervention i ai: Annuity savings from intervention i r: Discount Rate
9

E N E R G YS E C U R I T Y
L O W E R C A R B O N F O O T P R I N T
There are four main utility providers in the country: ADWEA, DEWA, SEWA, and FEWA. In terms of operational size and organizational structure, ADWEA is the largest followed by DEWA, SEWA, and then FEWA. Figure 4 highlights the contribution of each agency to the national electricity supply.
As previously mentioned under the study’s motivation, NG utilization for power generation is a major issue for the U.A.E. Procurement of NG is being carried out at both the national and Emirate utility-level, depending on the source. It is worth noting that each utility pays a different rate for the NG it receives, with some being subsidized at various rates.
In addition to the domestic trading of NG that is carried out between Emirates, electricity trading also occurs through the Emirates National Grid (ENG) established in 2000 – owned by the four utility agencies at different shares [9].
In the U.A.E., two general power plant financing models exist, which include consortium owned plants and utility owned plants. Consortium owned plants include independent water and power producers (IWPPs) and independent power producers (IPPs) – the former representing cogeneration facilities. Within the U.A.E., only ADWEA utilizes IWPPs and IPPs, usually holding 60% ownership within the development consortium. Other utility agencies in the country own their power plants entirely, though DEWA has shown interest in establishing IWPP/IPP projects. Table 3 summarizes the number of power plant under each utility agency, along with financing structure employed by the utility agencies.
A shared factor among the U.A.E.’s utility agencies is the high level of subsidies that take place. In the electricity value chain, subsidies occur at two levels. Subsidization occurs both at NG procurement/generation and at electricity distribution.
Firstly, NG is imported or domestically produced at a cost below that of the international market price and is sold to utility agencies at a price lower or comparable to the procured cost, depending on the utility agency.
The second subsidy occurs during the distribution of electricity from the utility agencies to end users. The level of subsidization varies for each utility agency, with each one following a different tariff structure. Table 4 highlights the major differences and similarities in tariff structure between
1.4. U.A.E. Electricity sector overviewThe U.A.E. has a number of agencies that oversee the role of electricity generation, transmission, and distribution, covering the country’s seven Emirates. Their structure is highlighted in Figure 3.
Figure 3: U.A.E. utility agencies
Figure 4: Proportion of electricity generation capacity in the U.A.E. (2011)
Table 3: Number of power plants in the U.A.E. according to off-taker and plant ownership
IWPP/IPP Utility owned power plant
ADWEA 14 -
DEWA - 10SEWA - 6FEWA - 5
Table 4: Tariff structures of U.A.E. utility agencies
Tariff Structure
ADWEA Fixed tariff for 9 customer segments
DEWA Rising block tariff for 4 customer segments
SEWA Fixed tariff for 3 customer segmentsRising block tariff for commercial segment
FEWA Rising block tariff for 3 costumer segmentFixed tariff for U.A.E. nationals segment
It is worth noting that in the case of ADWEA, a recent reform to the tariff structure will see the adoption of a rising block tariff structure for all customer segments, in closer alignment with other utility agencies.
10
D E V E L O P M E N TE C O N O M I C
CHAPTER TWO:
Efficiency Enhancements in the Electricity Value Chain
Figure 5: Map of introduced retrofits along the U.A.E. energy value chain
11
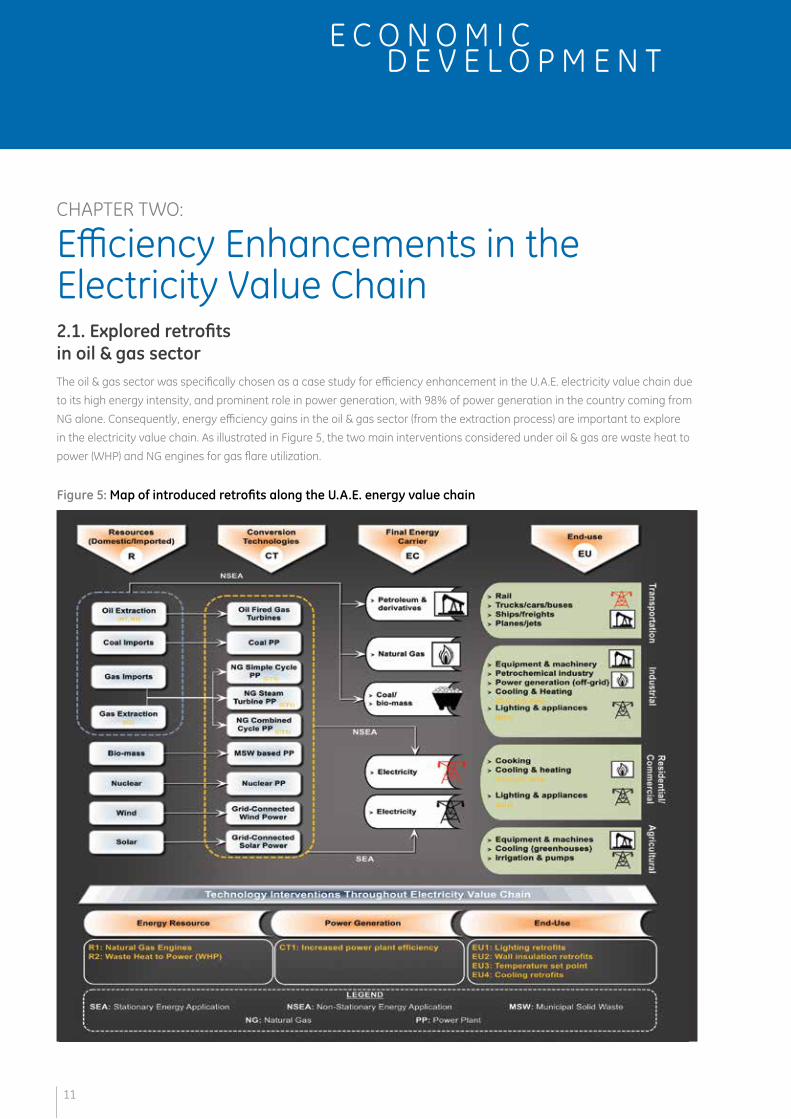
2.1. Explored retrofits in oil & gas sectorThe oil & gas sector was specifically chosen as a case study for efficiency enhancement in the U.A.E. electricity value chain due to its high energy intensity, and prominent role in power generation, with 98% of power generation in the country coming from NG alone. Consequently, energy efficiency gains in the oil & gas sector (from the extraction process) are important to explore in the electricity value chain. As illustrated in Figure 5, the two main interventions considered under oil & gas are waste heat to power (WHP) and NG engines for gas flare utilization.

E N E R G YS E C U R I T Y
L O W E R C A R B O N F O O T P R I N T
2.1.1. Waste heat to power (WHP)The process of recovering heat from an industrial application to generate power is known as waste heat to power (WHP). The three primary heat engine technologies analyzed in the study include: the Steam Rankine Cycle (SRC); the Organic Rankine Cycle (ORC); and the Kalina cycle [10][11].
I. SRC Cycle [10]: The SRC is one of the most utilized heat recovery technologies in the market. The system follows the Rankine thermal cycle with water as the main working fluid in the system.
III.Kalina Cycle: The Kalina cycle is also Rankine cycle based, however, the working fluid is a mixture between ammonia and water which enhances the cycle efficiency by enhancing the cycle heat extraction capabilities. The cycle is 15-20%, more efficient when compared to ORC at a similar waste heat temperature.
2.1.2. NG engines for gas-flare utilizationWhile some oil rigs have already re-structured their plants to eliminate gas flaring in the U.A.E., many sites continue the practice due to the intermittency of the associated gas (AG) and the expensive process of separating out the sulfur. For sites that still flare, efficiency gains can be captured by utilizing the AG for on-site energy applications at oil rigs through NG engines. Examples of NG engines used in industry that are capable of using flare gas include:
I. GE Jenbacher & Waukesha engines [13][14] II. Wärtsilä engines [15] III. Caterpillar engines [16]
Such engines (shown in Figure 8) couple well with AG as they can utilize a wide spectrum of fuel types that can be used for captive power generation. Given that oil rigs are not usually electrified and do not utilize NG turbines for captive power generation, the use of NG engines will present savings in diesel use.
Figure 6: Schematic of a Rankin Cycle heat engine
II. ORC Cycle: The ORC system follows the same concept as the SRC with the noticeable exception being that ORC Cycle uses organic working fluids that have a lower boiling point, higher vapor pressure, higher molecular mass, and higher mass flow when compared to water. The cycle is preferred when the waste heat is relatively low, lower than 500oF which is the limiting temperature for the steam cycle [10].
Figure 7: General Electric Organic Heat Recovery System [12]
Electrical energy
Condensor
Clean Cycle
Heat exchangers
12

D E V E L O P M E N TE C O N O M I C
2.2. Explored retrofits in power generation
2.2.1. NG Turbine enhancementsEfficiency enhancements at gas-fired power plants can have considerable national wealth savings for the U.A.E. government. Power plants can be tuned and optimized at many stages including: turbines; boilers; condensers; and operational software, among other points. While the report looks at raising power plant efficiencies as a whole, some notable retrofits/enhancements that can be applied to increase the overall power plant efficiency by up to 3% (as claimed by GE) include turbine specific enhancements such as GE’s advanced gas path (AGP) for 9E and 6FA turbines and 9E-Max for 9E turbines [17].
2.2.2. Industrial internetAnother potential for efficiency enhancement is through the integration of power plant hardware and software through leading to what has been described as the “Industrial Internet.” The integration of software to existing hardware allows for big data analysis and consequently: machine learning; predictive maintenance; and system optimization – all of which allow for industrial-scale resource savings as well as fuel consumption and emission reductions [18].
2.3. Explored retrofits in electricity end-use
2.3.1. LightingSince the invention of the first practical electric, incandescent lamp by GE’s founder, Thomas Edison, in 1879, human lives have been transformed. Rather than having to
toil or dwell in dimly lit environments using gas or oil lamps that emit toxic fumes, the electric light gave modern societies access to new levels of comfort and opened up tremendous increases in workplace productivity.
The potential for energy savings through lighting efficiency enhancements in the U.A.E. is highly ranked compared to countries in Europe and North America. This is due to the current lighting technology used, which is provided by traditional incandescent bulbs [19]. Energy consumption in lighting can be greatly reduced through the use of new technologies in lighting such as LEDs, Halogen and CFL lighting. Such technologies can provide less energy intensive lighting with a lower operational cost [20]. The following technologies are the lighting retrofits considered in the study: LED; new halogen; and CFL.
I. LED: LED stands for light-emitting diode. LEDs have taken electric lighting into the next realm: into the digital age, and into the 21st century. The world of lamps and ballasts has become the universe of chips and drivers; analog technology has become digital. The importance and significance of this change cannot be underestimated. It has revolutionized not only the lighting industry, but countless other industries and human endeavours that rely on lighting. LED lighting is a well-established lighting technology in both developed and developing markets [21]. LED has received large scale application in the country due to its versatile use and applications. The technology can be utilized in office lighting, street lighting, and decorations [22]. The variety of colors and the varying intensities which the technology can employ has increased its penetration across a number of sectors globally.
II. New Halogen: New halogen technology utilizes the use of halogens on the tungsten and filaments. The most commonly used halogens are bromine and chlorine. The halogens develop a cycle enabling the lamp to produce brighter light at high temperatures. A typical application of the technology is in projectors.
III. CFL: CFL refers to compact fluorescent lighting that has been developed to replace traditional incandescent lamps. The lamps are curved and are designed in different shapes. Some of the existing shapes fit on the traditional lamp holders which were designed for incandescent. CFL bulbs offer the same level of luminescence at a lower wattage in comparison with traditional fluorescent lamps, along with the advantage of a longer lifetime when compared to traditional lamps [23].
Figure 8: GE's Jenbacher (A) and Waukesha (B) engines
13

E N E R G YS E C U R I T Y
L O W E R C A R B O N F O O T P R I N T
Capital Cost (AED) LifetimeXPS R-5 51.8/m2 +20 years
XPS R-10 67.7/m2 +20 years
2.3.2. Wall insulationIn order to propose more efficient building envelope assemblies, enhancement of wall insulation was performed as part of this study. The enhancement was performed through the utilization of two foam based insulation materials. The comparison with the exiting insulation was based on the U-value calculated; U-value being the heat flow calculated from different building elements such as wall, roof, and floor. Table 6 summarizes the two insulation materials used in the study.
2.3.3. CoolingGiven the hot desert climate of the U.A.E., much energy is needed to maintain the indoor environment at a comfortable level. This energy requirement is known as the cooling load and is represented through “COP” - a dimensionless measure of the efficiency of air conditioning products. COP essentially provides an evaluation of the performance of the air conditioning unit in which cooling/heating provided (in watts) is divided by the power input (in watts).
In the study, two COP values with values of +15% and +35% respective to the business-as-usual COP were used. A summary of the two cooling retrofits is found in Table 7.
Table 6: Wall insulation retrofits summary
COP Value Fixed Cost (AED) LifetimeCOP +15% 2.875 3185 19 years
COP +35% 3.375 3185 19 years
Table 7: Cooling retrofits summary
Incan-descents
New Halogens
CFLs LEDs
-
45 Lumens
40 W 29 W 10 W 5 W$3.87/yr $3.87/yr $1.34/yr $0.67/yr
800 Lumens
60 W 43 W 13 W 10 W$8.02/yr $5.74/yr $1.74/yr $1.34/yr
1100 Lumens
75 W 53 W 16 W 15 W$10.02/yr $7.08/yr $2.14/yr $2.00/yr
1600 Lumens
100 W 72 W 20 W 19 W$13.36/yr $9.62/yr $2.67/yr $2.54/yrlife time
1 yrslife time1.2 yrs
life time 10 yrs
life time15–25 yrs
Table 5: Lighting technology energy and cost comparison
2.3.4. Set-point temperatureThe last retrofit/intervention explored in electricity end-use was the adoption of higher set-point temperatures (SPT) for the various building types explored in the study (Residential, offices, retail and villas). According to the BAU scenario, the average SPT in the U.A.E. equals 22°C. Consequently, any shift to a higher SPT will result in energy and cost savings. The two scenarios explored in the analysis include a shift to 23°C and 24°C.
2.3.5. Industrial InternetWhile not included in the analysis or model, the potential of the Industrial Internet in savings at end-use is also significant. Network driven demand side management (NDDSM), which links appliances, homes, districts, and so forth through a smart network can allow for multiple cost and energy savings. Having access to real time consumption data at various levels of granularity can allow for better demand forecasting, which in turn optimizes the power generation process.
Furthermore, NDDSM offers the potential for centralized control of electricity consumption at the household, district, city, Emirate, or even national level. Centralized monitoring and control of lighting, SPT, and appliance consumption can contribute to peak shaving, reduce non-utilized energy, and can also perform as an educational tool for behavioral change.
14

D E V E L O P M E N TE C O N O M I C
CHAPTER THREE:
Efficiency Enhancement Potential in the Oil & Gas Sector3.1. Approach & modelA significant potential for energy and cost savings in the U.A.E.’s oil & gas sector is possible through efficiency enhancements in the extraction process. Energy saving retrofits for oil & gas extraction were explored in section 2.1.
Figure 9: NG engines vs. gas flaring for off-shore/on-shore oil rigs
The two retrofits considered in the energy and cost savings analysis are NG engines (utilizing associated gas that is otherwise flared) at oil rigs and heat recovery at oil refineries through waste heat to power systems.
For NG engines, the analysis was conducted for the U.A.E.’s 58 off-shore and on-shore oil rigs, as they do not receive electricity from the grid and could consequently benefit from any fuels savings. Figure 9 illustrates how an NG engine could reduce the diesel energy load for an oil rig. AG that would normally be flared under business-as-usual can be redirected towards an NG engine that would generate electricity to be used on-site by the rig, consequently reducing the required diesel. The saved amount of diesel is then used to calculate the subsidy and opportunity
cost savings to the country based on the price of diesel internationally, domestically, and to industry.
For WHP, the model uses waste heat values gathered from U.A.E. refineries which is segmented according to the various stages of the oil refining process (outlined in Figure 12) to calculate the potential electricity generation from WHP which can then be utilized on-site. After which, the potential tariff subsidy savings (TSS), fossil fuel subsidy savings (FFSS) and opportunity cost (OCS) savings are calculated based on the various energy prices assumed in Table 8.
15

E N E R G YS E C U R I T Y
L O W E R C A R B O N F O O T P R I N T
1 Given the complexity of fossil fuel dynamics in the country, informative assumptions for utilities/consumers fuel cost were assumed. The assumptions might suggest a bias (+/-) in the national wealth savings estimated. The highlighted bias indicates the importance of revisiting these assumptions in future work once more accurate data is available.
3.2. Scenario analysis
3.2.1. NG Engines1
For the use of NG engines opposed to gas flaring, the potential savings were generated based on inputs found in Table 8, which can be adjusted within the model. It is worth noting that savings to the U.A.E. government will only be present if diesel is supplied to the oil rigs domestically via a government entity/subsidiary. If diesel is bought at international market price by the rigs, then savings will only occur for the oil rig operating companies. If the diesel at the oil rigs is purchased below international market price an opportunity cost saving (OCS) will occur. If the purchased diesel is also below the domestic price, then it means a fossil fuel subsidy saving (FFSS) will occur for the government.
Oil Rig Parameters Value
UAE Gas Flare 1.3 BCM
Avg Gas Flare Fuel Value 8400 Kj/m3Gas Engine Efficiency 45%Oil Rig Operation hrs/Yr 8000Avg Oil Rig Power 5600 KwDiesel Engine Efficiency 34%
Diesel Price Parameters ValueDiesel Price (international) $4.00 Diesel domestic production cost $2.10Diesel cost to Oil & Gas $1.90
BEI Parameters ValueAvg. remaining lifetime of oil rig 5 yearsDiscount rate 4.5%
Table 8: NG engines model parametersFigure 10: Potential electricity production from AG in U.A.E.
Figure 11: Potential cost savings from NG engines in U.A.E.
3.2.2. Waste Heat to PowerThe potential for WHP is summarized in Figure 12 and is based on averaged waste heat values from the U.A.E.’s oil refineries throughout the refining process. It was assumed that oil production occurs at a constant rate throughout the year with the total available waste heat also being constant. To calculate the various savings including TSS, FFSS and OCS,
NG and electricity prices found in Table 9 were used along with heat recovery process parameters and break-even-investment parameters. The FFSS and OCS were calculated using the power generation model explored in Chapter Four.
TOTAL SAVINGSFFSS: AED 19.73 million OCS: AED 187.42 million
BEAK-EVEN-INVESTMENTTotal (w/o OCS): AED 86.6 million Total: AED 822.8 million
16

D E V E L O P M E N TE C O N O M I C
It is worth noting that in the cases of oil refineries, some are electrified from the grid (non-captive) while others generate their own electricity on-site (captive) through NG turbines. For oil rigs that generate their own power, savings to the government are affected based on the price at which NG is sold to the oil refineries for power generation. If NG is purchased at a higher cost than what ADWEA (main provider to refineries) would purchase it at, a lower FFSS would occur and the TSS would be negated, as electricity from the grid would no longer be required. In the model, it was assumed that non-captive oil refineries acquired NG at the same price as ADWEA, leading to the same subsidy saving as electrified refineries, but had their TSS removed.
Table 9: Heat recovery model parameters
Oil Rig Parameters Value
Avg. Waste Heat/refinery 43,631,733.82 MM-Btu
Heat recovery efficiency 30% 1 Kwh equals 0.003409510641
MM-Btu
NG Cost Parameters Value
International market cost of NG2 $10.00 USD/MM-Btu
Domestic cost of NG3 $5.00 USD/MM-Btu
Cost of NG to ADWEA/oil refinery $2.50 USD/MM-Btu
Electricity Cost parameters Value
On-Peak Off-Peak
Summer 48.7 Fils/kWh 14.6 Fils/kWhWinter 8.7 Fils/kWh 5.1 Fils/kWh
Break-even-investment Parameters Value
Avg. remaining lifetime of refineries 30 years
Discount rate 4.5%
2 Given the complexity of fossil fuel dynamics in the country, informative assumptions for utilities/consumers fuel cost were assumed. The assumptions might suggest a bias (+/-) in the national wealth savings estimated. The highlighted bias indicates the importance of revisiting these assumptions in future work once more accurate data is available.3 This paper assumes a domestic NG price of $5.00 USD/MM-Btu of which falls within the lower bound cost of local production ($2.00 USD/MM-Btu) along with the upper bound of LNG imports (>$10.00 USD/MM-Btu).
Figure 12: U.A.E. Refinery Waste Heat, 2013
17
E N E R G YS E C U R I T Y
L O W E R C A R B O N F O O T P R I N T
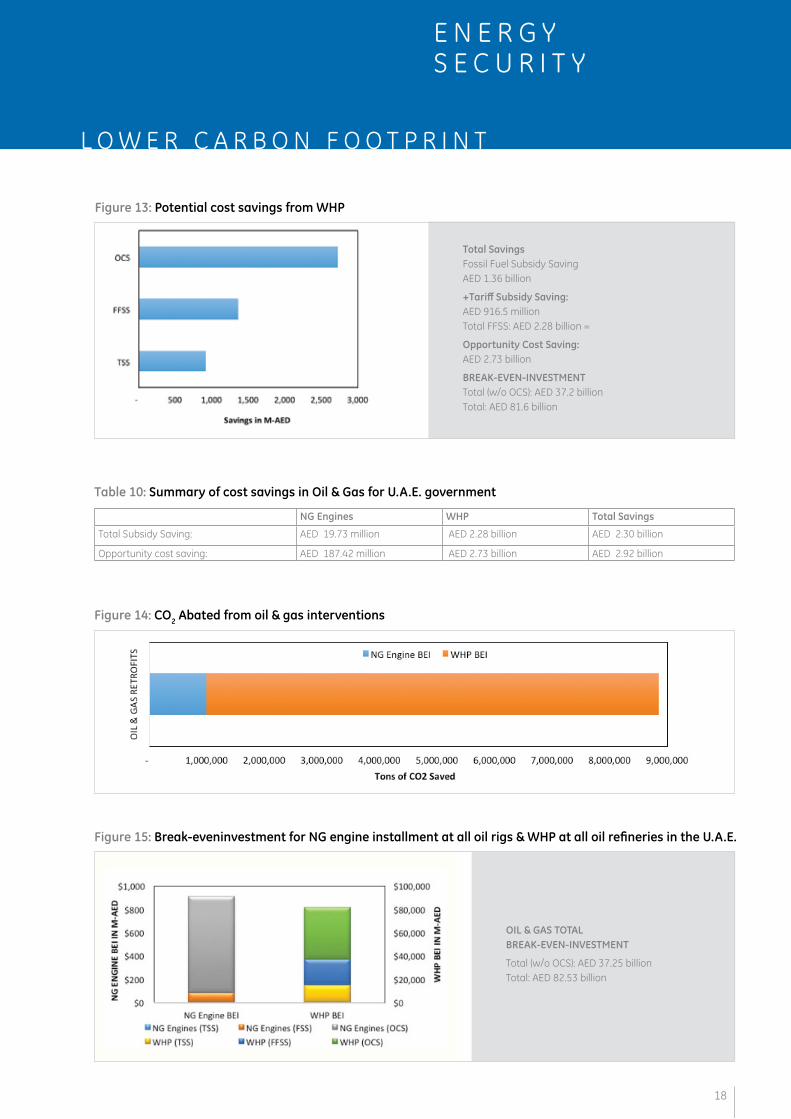
Total SavingsFossil Fuel Subsidy Saving AED 1.36 billion
+Tariff Subsidy Saving: AED 916.5 million Total FFSS: AED 2.28 billion =
Opportunity Cost Saving: AED 2.73 billion
BREAK-EVEN-INVESTMENTTotal (w/o OCS): AED 37.2 billion Total: AED 81.6 billion
Figure 13: Potential cost savings from WHP
NG Engines WHP Total Savings
Total Subsidy Saving: AED 19.73 million AED 2.28 billion AED 2.30 billion
Opportunity cost saving: AED 187.42 million AED 2.73 billion AED 2.92 billion
Table 10: Summary of cost savings in Oil & Gas for U.A.E. government
Figure 14: CO2 Abated from oil & gas interventions
OIL & GAS TOTAL BREAK-EVEN-INVESTMENT
Total (w/o OCS): AED 37.25 billion Total: AED 82.53 billion
Figure 15: Break-eveninvestment for NG engine installment at all oil rigs & WHP at all oil refineries in the U.A.E.
18
D E V E L O P M E N TE C O N O M I C
CHAPTER FOUR:
Efficiency Enhancement Potential in Power Generation4.1. Approach & modelThe potential for national wealth savings through efficiency gains in power generation are both significant and technically possible through both retrofits and software enhancements at the power plant level. The potential efficiency gains by such interventions were explored in Section 2.2.
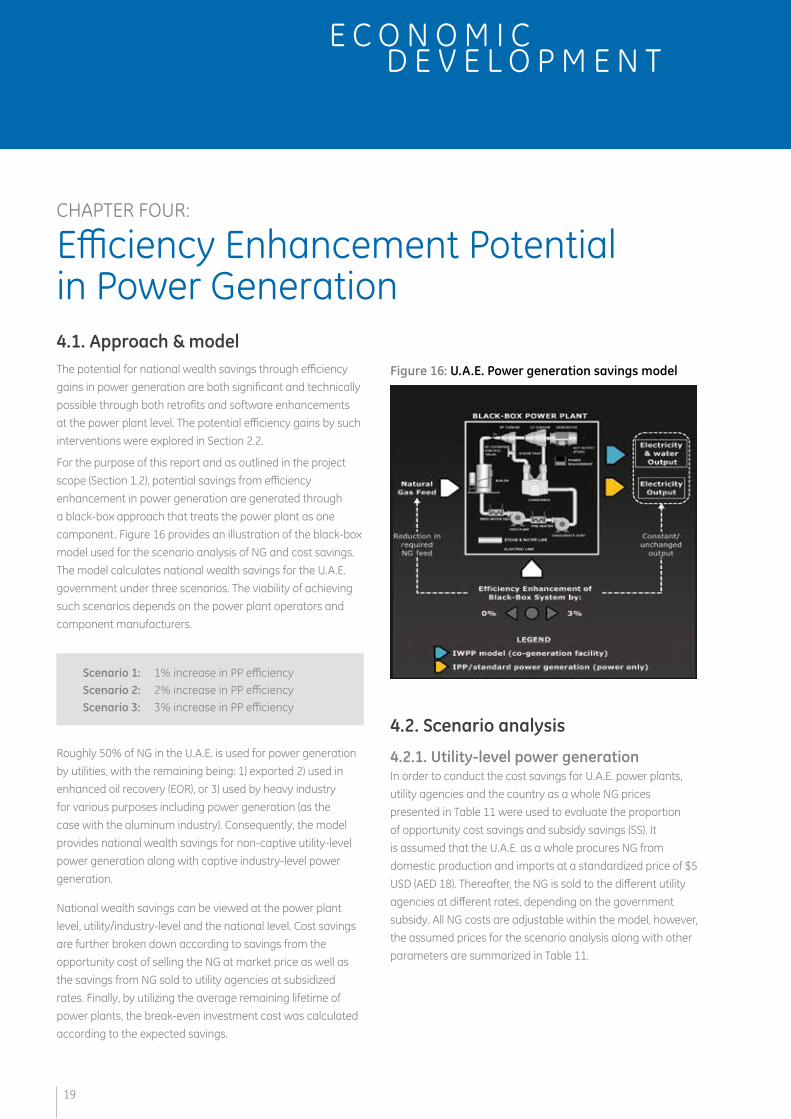
For the purpose of this report and as outlined in the project scope (Section 1.2), potential savings from efficiency enhancement in power generation are generated through a black-box approach that treats the power plant as one component. Figure 16 provides an illustration of the black-box model used for the scenario analysis of NG and cost savings. The model calculates national wealth savings for the U.A.E. government under three scenarios. The viability of achieving such scenarios depends on the power plant operators and component manufacturers.
Scenario 1: 1% increase in PP efficiency Scenario 2: 2% increase in PP efficiency Scenario 3: 3% increase in PP efficiency
Roughly 50% of NG in the U.A.E. is used for power generation by utilities, with the remaining being: 1) exported 2) used in enhanced oil recovery (EOR), or 3) used by heavy industry for various purposes including power generation (as the case with the aluminum industry). Consequently, the model provides national wealth savings for non-captive utility-level power generation along with captive industry-level power generation.
National wealth savings can be viewed at the power plant level, utility/industry-level and the national level. Cost savings are further broken down according to savings from the opportunity cost of selling the NG at market price as well as the savings from NG sold to utility agencies at subsidized rates. Finally, by utilizing the average remaining lifetime of power plants, the break-even investment cost was calculated according to the expected savings.
4.2. Scenario analysis
4.2.1. Utility-level power generationIn order to conduct the cost savings for U.A.E. power plants, utility agencies and the country as a whole NG prices presented in Table 11 were used to evaluate the proportion of opportunity cost savings and subsidy savings (SS). It is assumed that the U.A.E. as a whole procures NG from domestic production and imports at a standardized price of $5 USD (AED 18). Thereafter, the NG is sold to the different utility agencies at different rates, depending on the government subsidy. All NG costs are adjustable within the model, however, the assumed prices for the scenario analysis along with other parameters are summarized in Table 11.
Figure 16: U.A.E. Power generation savings model
19

E N E R G YS E C U R I T Y
L O W E R C A R B O N F O O T P R I N T
The robustness of the savings model allows all the above parameters to be adjusted by the user, and allows for extensive sensitivity analysis based on changes in power plant utilization rates, efficiencies, lifetime; discount rate; and the NG prices at various points of delivery. Furthermore, while the model is meant to act as a snapshot of the country’s power generation – rising demand is accounted for through the power plant’s base utilization rates. Increased demand can be reflected through increased utilization rates of the power plant, the growth being a function of the new utilization rate divided by the old rate.
Figures 17 through 20 demonstrate the potential U.A.E. national wealth savings under 1, 2, and 3 percent efficiency enhancement scenarios in power generation.
Base plant utilization rate by utility
Cost of NG to utility (USD/MM-Btu)
ADWEA 48.0% $2.50 Average cost of NG obtained in U.A.E. $5.00/MM-Btu
DEWA 44.0% $5.30 International market price of NG $10.00/MM-BtuSEWA 44.0% $4.90 Discount rate 4.5%FEWA 36.0% $10.00 Average plant efficiency 50%U.A.E. 46.0% - Average remaining plant lifetime 20 years
Table 11: Assumed natural gas costs and model parameters for utility-level power generation
An assumption made in the model is that the NG obtained in the U.A.E. before being sold to utility agencies is singular, given a value of $5.00 USD/MM-Btu (an intermediary value taken between the local product cost of $2.00 USD/MM-Btu and the cost of LNG imports >$10.00 USD/MM-Btu). However, the model allows for multiple price inputs for each utility agency to better reflect the complex dynamics of NG procurement in the country.
Figure 17: NG & cost savings from ADWEA plants under three efficiency increase scenarios
20
120 AED
100 AED
80 AED
60 AED
40 AED
20 AED
0 AED
D E V E L O P M E N TE C O N O M I C
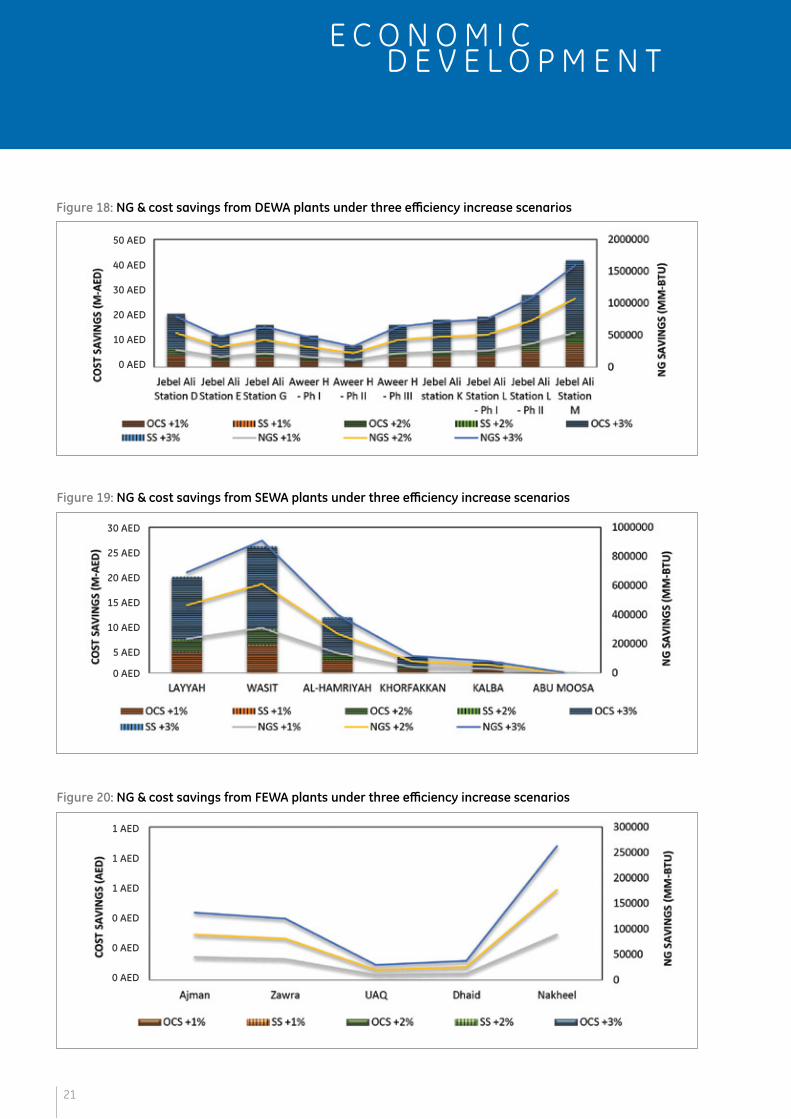
Figure 18: NG & cost savings from DEWA plants under three efficiency increase scenarios
Figure 19: NG & cost savings from SEWA plants under three efficiency increase scenarios
Figure 20: NG & cost savings from FEWA plants under three efficiency increase scenarios
21
50 AED
40 AED
30 AED
20 AED
10 AED
0 AED
30 AED
1 AED
25 AED
1 AED
20 AED
1 AED
15 AED
0 AED
10 AED
0 AED
5 AED
0 AED
0 AED

E N E R G YS E C U R I T Y
L O W E R C A R B O N F O O T P R I N T
As can be seen through these figures, the largest savings are captured at plants with high annual outputs. The opportunity cost of selling NG through exports can be viewed as the price difference between the international market price of NG and the price at which utility agencies purchased the NG. Consequently, the opportunity cost savings (OCS) are greater for utility agencies who acquire NG at cheaper rates (i.e. ADWEA). Conversely, the fossil fuel subsidy saving (FFSS) is subject to the difference between the price at which the utility agencies purchase the NG and the price at which it is obtained within the country. Hence, the greater the difference, the greater the subsidy saving when NG is saved.
Figure 21 provides an overview of the potential cost and NG savings for the whole country according to each utility agency. The savings for each utility is further broken down to opportunity cost savings (OCS) and subsidy savings (SS). However, given the inputted parameters in Table 11, not all utility agencies possess OCS and SS. Since DEWA and FEWA purchase NG at a higher cost than it enters the country (or is domestically produced), no SS exist. In addition, since FEWA buys NG at market price, it possesses no OCS, explaining the blank data in Figures 20 and 21. However, it is worth noting that NG savings remain, irrespective of whether cost savings exist or not, as NG savings are a function of the original power plant efficiency and the efficiency enhancements it receives under the various scenarios.
4.2.2. Industry-level power generationModelling and computing the NG and cost savings from industry-level power generation that occurs off-grid followed the same approach as in utility-level power generation. The primary difference was in the source of the data for the annual GWh for industrial power plant, which was acquired from EnerData (as opposed to utility agencies) and segmented
according to four industries: aluminum; oil & gas; cement; and other, which collectively represent the bulk of industrial power generation. While power generation values were obtained for the four industries (illustrated in Figure 22), the potential cost savings were only calculated for the aluminum industry. Unlike the aluminum industry which utilizes NG for its power generation, other industries including oil & gas and cement, utilize diesel generators for power generation which was not deemed as a major potential for efficiency enhancement during the MI-GE consultation process. Furthermore, cost savings for oil & gas, the next biggest industrial generator of electricity after aluminum, were explored through the utilization of AG in gas engines and heat recovery in oil refineries in Chapter Three. Table 12 summarizes the parameters and assumptions used for the aluminum industry national wealth savings.
Figure 21: NG & cost savings for U.A.E. plants under three efficiency increase scenarios
TOTAL SAVINGS
+1% efficiency gain: FFSS: AED 43.61 million OCS: AED 138.58 million
+2% efficiency gain: FFSS: AED 86.37 million OCS: AED 274.45 million
+3% efficiency gain: FFSS: AED 128.30 million OCS: AED 407.68 million
22
600 AED
500 AED
400 AED
300 AED
200 AED
100 AED
0 AED

D E V E L O P M E N TE C O N O M I C
Table 12: Assumed natural gas costs and model parameters for industry-level power generation
Figure 22: 2014 Electricity generation by industry
Parameter Value
Average cost of NG obtained in U.A.E. $5.00/MM-Btu
Cost of NG to Aluminum Industry (USD/MM-Btu) $5.00/MM-Btu
International market price of NG $10.00/MM-Btu
Discount rate 4.5%
Average plant efficiency 50%
Average remaining plant lifetime 20 years
Furthermore, as Table 12 illustrates, the cost of NG to the aluminum industry was assumed to be the same as the average domestic/imported cost of $5.00 USD/MM-Btu. Consequently, it was assumed that no subsidies take place at the industry-level, though NG is still purchased below international market price – presenting an opportunity cost saving.
The NG and cost savings for the aluminum industry are presented in Figure 23 under the three efficiency enhancement scenarios.
TOTAL SAVINGS
+1% efficiency gain: SS: AED 0 million OCS: AED 26.28 million
+2% efficiency gain: SS: AED 0 million OCS: AED 52.04 million
+3% efficiency gain: SS: AED 0 million OCS: AED 77.30 million
Figure 23: U.A.E. NG and cost savings from aluminum industry at various efficiency enhancements
4.2.3. Total savings and break-even-investment of efficiency enhancementsCombining the total savings from utility-level power generation and industry-level power generation for the three efficiency enhancement scenarios, yields the following savings as presented in Table 13.
+1% efficiency gain +2% efficiency gain +3% efficiency gain
Subsidy Saving: AED 43.61 million AED 86.37 million AED 128.30 million
Opportunity Cost Saving: AED 164.86 million AED 326.49 million AED 484.98 million
Table 13: Summary of cost savings in power generation for U.A.E. government
23
E N E R G YS E C U R I T Y
L O W E R C A R B O N F O O T P R I N T
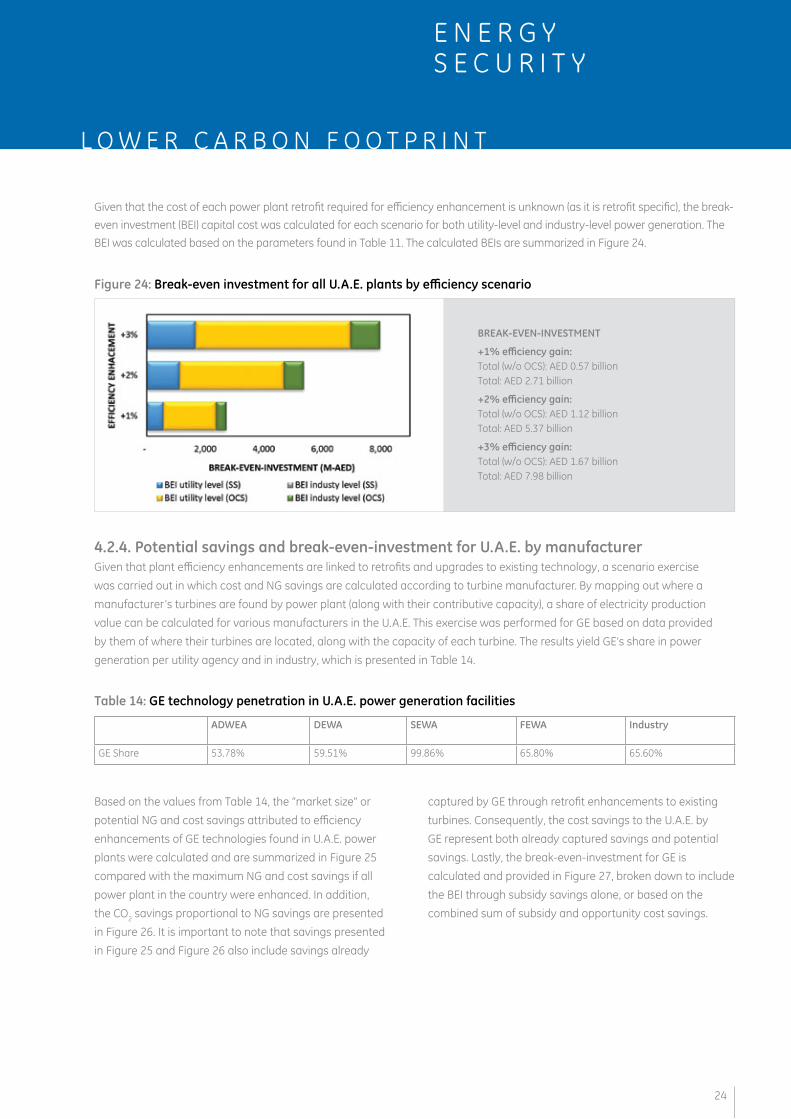
Given that the cost of each power plant retrofit required for efficiency enhancement is unknown (as it is retrofit specific), the break-even investment (BEI) capital cost was calculated for each scenario for both utility-level and industry-level power generation. The BEI was calculated based on the parameters found in Table 11. The calculated BEIs are summarized in Figure 24.
BREAK-EVEN-INVESTMENT
+1% efficiency gain: Total (w/o OCS): AED 0.57 billion Total: AED 2.71 billion
+2% efficiency gain: Total (w/o OCS): AED 1.12 billion Total: AED 5.37 billion
+3% efficiency gain: Total (w/o OCS): AED 1.67 billion Total: AED 7.98 billion
ADWEA DEWA SEWA FEWA Industry
GE Share 53.78% 59.51% 99.86% 65.80% 65.60%
Figure 24: Break-even investment for all U.A.E. plants by efficiency scenario
4.2.4. Potential savings and break-even-investment for U.A.E. by manufacturerGiven that plant efficiency enhancements are linked to retrofits and upgrades to existing technology, a scenario exercise was carried out in which cost and NG savings are calculated according to turbine manufacturer. By mapping out where a manufacturer’s turbines are found by power plant (along with their contributive capacity), a share of electricity production value can be calculated for various manufacturers in the U.A.E. This exercise was performed for GE based on data provided by them of where their turbines are located, along with the capacity of each turbine. The results yield GE’s share in power generation per utility agency and in industry, which is presented in Table 14.
Based on the values from Table 14, the “market size” or potential NG and cost savings attributed to efficiency enhancements of GE technologies found in U.A.E. power plants were calculated and are summarized in Figure 25 compared with the maximum NG and cost savings if all power plant in the country were enhanced. In addition, the CO2 savings proportional to NG savings are presented in Figure 26. It is important to note that savings presented in Figure 25 and Figure 26 also include savings already
Table 14: GE technology penetration in U.A.E. power generation facilities
captured by GE through retrofit enhancements to existing turbines. Consequently, the cost savings to the U.A.E. by GE represent both already captured savings and potential savings. Lastly, the break-even-investment for GE is calculated and provided in Figure 27, broken down to include the BEI through subsidy savings alone, or based on the combined sum of subsidy and opportunity cost savings.
24

D E V E L O P M E N TE C O N O M I C
Figure 25: Potential cost savings for U.A.E. by GE under various efficiency enhancement scenarios
Figure 26: Potential CO2 reductions for U.A.E. by GE under various efficiency enhancement scenarios
Figure 27: Break-even investment for GE’s share of power generation by efficiency enhancement scenario
BREAK-EVEN-INVESTMENT
+1% efficiency gain: Total (w/o OCS): AED 0.16 billion Total: AED 0.90 billion
+2% efficiency gain: Total (w/o OCS): AED 0.32 billion Total: AED 1.78 billion
+3% efficiency gain: Total (w/o OCS): AED 0.47 billion Total: AED 2.65 billion
25

E N E R G YS E C U R I T Y
L O W E R C A R B O N F O O T P R I N T
CHAPTER FIVE:
Efficiency Enhancement Potentials in Electricity End-use5.1. Approach & modelThe potential of energy and cost savings through electricity end-use interventions are not only significant, but usually the most cost-effective according to existing research. A previous study done at Masdar Institute concluded that “A consensus is forming among experts that the best way to achieve emission reductions in the near and mid-term future is by increasing demand-side energy efficiency.”
The objective of this chapter is to analyze energy and cost savings that can be obtained from the implementation of different retrofits in the U.A.E. building sector, as well as the evaluation of their respective costs.
The analysis utilizes four building types:
Residential Retail Offices Villas
The four building types were specifically identified due to their high contribution to electricity consumption in the U.A.E.
The residential, retail and offices building characteristics were provided by the Abu Dhabi Urban Planning Council (UPC), while the villa model was provided by the Rochester Institute of Technology in Dubai. The provided four building type models represent the business-as-usual (BAU) case in the U.A.E. that will be used as a baseline for scenario analysis.
The retrofits/strategies studied for each building type are the following:
1. Lighting retrofits
2. Cooling retrofits
3. Temperature set point
4. Wall insulation (U-Value)
A complete list of the retrofits and their corresponding descriptions can be found in Section 2.3. In order to construct the four building types according to the BAU specifications, the software DesignBuilder was used. Once the models were created, the models, in addition to the Abu Dhabi weather profile, were fed to the software EnergyPlus in order to generate the building electricity demand profiles (monthly and yearly) according to different retrofit scenario combinations.
Matlab was then used to manage and organize the generated demand profiles, covering a number of scenarios for each building type. Finally, the data was entered into excel which performs a life cycle costing (LCC) on each of the retrofits, draws retrofit marginal abatement cost curves (MACC), and finally provides a platform for scenario analysis and comparison. Figure 28 summarizes the overall model used for generating the retrofit scenarios.
26

D E V E L O P M E N TE C O N O M I C
Figure 28: End-use model overview
5.2. Scenario analysisUtilizing the design specifications for the building types that were gathered from UPC and the Rochester Institute of Technology in Dubai, electricity consumption by building type was broken down and categorized by major uses. This represents the business-as-usual (BAU) scenario and is reflected in Figure 29.
Figure 29: BAU electricity consumption break down
Based on the individual electricity consumption by building type (and usage), the total electricity consumption by building type was estimated for the cities of Abu Dhabi, Dubai, and Sharjah based on the total number of built units in the city by building types (i.e. retail vs. residential).
The retrofits applied for efficiency enhancement in electricity end-use were previously outlined and discussed in Section 2.3. The cost of these technologies were coupled with their respective CO2 abatements for each building type through consumption data derived from DesignBuilder (reflected in Figure 29). This allowed for the generation of marginal abatement cost curves (MAC), originally developed by McKinsey & Co. MAC curves plot the tons of CO2 abated by a technology in relation to the unit cost at which that CO2 is abated. Once technology lifetimes and discount rates are factored, the return on investment for each technology along with the total CO2 abated can be generated. MAC curves for each building type: retail, villa, residential, and offices are presented in Figure 30 through Figure 33.
27

E N E R G YS E C U R I T Y
L O W E R C A R B O N F O O T P R I N T
Figure 30: MACC for residential buildings 20 years, 4% discount rate
Figure 31: MACC for office buildings 20 years, 4% discount rate
Figure 32: MACC for retail buildings 20 years, 4% discount rate
Figure 33: MACC for villa 20 years, 4% discount rate
28

D E V E L O P M E N TE C O N O M I C
The MAC curve for each building type provides insightful information about which technologies are best suited for which kind of building(s). Given that changing the set temperature comes at no cost, it offers savings across all building types with sizeable CO2 abatement. However, the cost effectiveness of the other three interventions are subject to each initial investment cost, average building size, and the electricity use profile. For example, high efficiency air conditioning with a COP value of +35% offers no cost savings given the large initial investment for smaller building types such as residential, villa, and office – only for retail
5.2.1. National savings from end-use efficiency enhancement
where building size is significantly larger can the return on initial investment be seen. Technologies with lower initial investments such as wall insulation and lighting are more likely to result in cost savings over the short term.
Such MAC curves are particularly useful for policy making as they allow decision makers to see which technologies offer the greatest CO2 savings, along with the associated costs. The technologies with large CO2 savings but no immediate return on investment can potentially be subsidized through something like a rebate program.
Figure 34: Potential market size of savings by technology and building-type for the cities of Dubai, Abu Dhabi & Sharjah
Figure 34 illustrates the potential savings market size (100% technology adoption) for each intervention. The savings account for opportunity cost savings (OCS) along with subsidy savings at the power generation level (natural gas subsidy - SS) and distribution level (tariff subsidy - TS) by back-calculating the amount of NG saved through avoided electricity usage. The model allows for estimating the potential savings to the country by modifying the adoption rate for each technology according to the building type in each major U.A.E. city (Dubai, Abu Dhabi, and Sharjah). Using the generated MAC curves as a guideline for adoption rates, a “technical market size” scenario was chosen for each building type to reflect a realistic technology adoption based on the effectiveness and cost. Retrofits/interventions that yielded no net savings
over the 20 year assessment (positive values in MAC curves) were discounted and deemed N/A. Retrofits/interventions that yielded savings were chosen based on their total savings provided along with total CO2 abated.
Table 15 summarizes the parameters used in conducting the cost savings scenarios. A technology combination of different efficiencies and penetration rates is presented for each building category which was then used to generate the combined potential savings for Abu Dhabi, Dubai, and Sharjah.
29

E N E R G YS E C U R I T Y
L O W E R C A R B O N F O O T P R I N T
Table 15: Scenario parameters for different building type technology combinations and penetration rates
Residential Buildings
XPS-R5 XPS-R10 COP+15% COP+35% SP 23°C SP 24°C New Halogen CFL LED
0% 100% N/A N/A 0% 100% 0% 50% 50%
Office Buildings
XPS-R5 XPS-R10 COP+15% COP+35% SP 23°C SP 24°C New Halogen CFL LED
0% 100% N/A N/A 0% 100% 0% 50% 50%
Retail
XPS-R5 XPS-R10 COP+15% COP+35% SP 23°C SP 24°C New Halogen CFL LED
0% 100% 0% 100% 50% 50% 0% 50% 50%
Villas
XPS-R5 XPS-R10 COP+15% COP+35% SP 23°C SP 24°C New Halogen CFL LED
N/A 100% 0% 100% 50% 50% 0% 50% 50%
5.2.2. Potential national savings from end-use efficiency enhancement by manufacturerFigure 36 presents the potential savings for GE from LED retrofitting at various penetration rates per building type for the cities of Abu Dhabi, Dubai and Sharjah.
TECHNICAL MARKET SIZE
Natural Gas Subsidy Saving AED 1.32 billion
+Tariff Subsidy Saving: AED 13.45 billion
Total SS: AED 14.77 trillion =
Opportunity Cost Saving: AED 6.17 billion
Figure 35: Technical market size of savings by building type for the cities of Dubai, Abu Dhabi & Sharjah
Figure 36: Potential savings from LED retrofits by building type at various penetration rates for Abu Dhabi, Dubai & Sharjah
30

D E V E L O P M E N TE C O N O M I C
Parameter Value
International market price of NG/Diesel X + $1.00/MM-Btu
Domestic cost of NG/Diesel X
Cost of NG/Diesel to utilities/industry X - $1.00/MM-Btu
Electricity Tariff Subsidy Based on customer segments per utility
Discount rate 4.5%
Remaining lifetime of intervention Intervention dependent
CHAPTER SIX:
Comparative Analysis of Electricity Value Chain InterventionsAs Figure 37 illustrates, energy losses occur throughout the entire electricity value chain, most profoundly in the power generation stage. While it may be assumed that stages with the highest energy losses represent the low hanging fruit and should therefore be pursued from a policy perspective, the reality is quite different. Different technology penetration rates, potential for efficiency gains, and cost of increasing efficiency affect how policy interventions will be prioritized from a government perspective.
Figure 37: Energy losses within electricity value chain
Table 16: Assumed parameters for comparative analysis
In order to fairly compare the national wealth savings by various policy interventions across the electricity value chain, a common metric was developed that controls for data inconsistency/unavailability in NG and diesel prices and subsidies within the U.A.E.
Table 16 summarizes the approach taken in the comparative analysis. To avoid underestimating or overestimating the subsidy and opportunity cost savings, savings were based on
a unit difference of $1.00 USD/MM-Btu between: the national average cost NG/diesel sold to utilities and industry; the production/imported cost of NG/diesel; and the international market price of NG/diesel. The electricity tariff subsidy, on the other hand, was based on absolute values from the tariff cost data provided on utility agency websites for the various customer categories.
31
E N E R G YS E C U R I T Y
L O W E R C A R B O N F O O T P R I N T
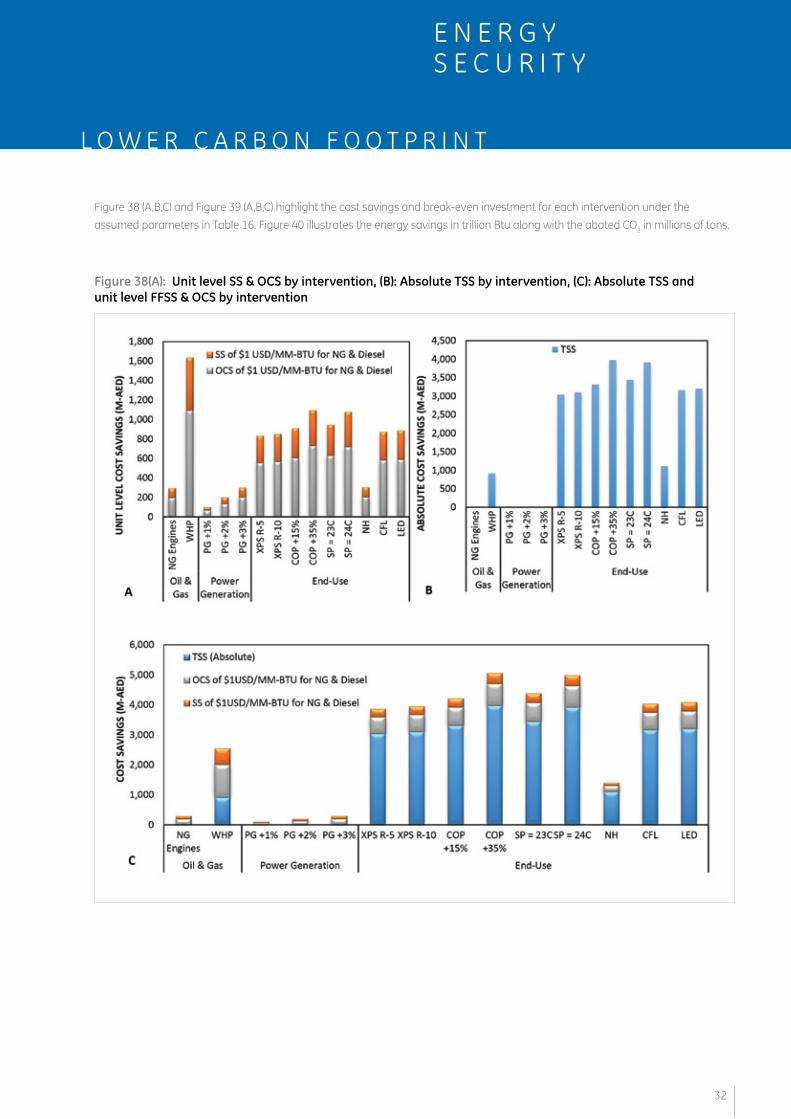
Figure 38 (A,B,C) and Figure 39 (A,B,C) highlight the cost savings and break-even investment for each intervention under the assumed parameters in Table 16. Figure 40 illustrates the energy savings in trillion Btu along with the abated CO2 in millions of tons.
Figure 38(A): Unit level SS & OCS by intervention, (B): Absolute TSS by intervention, (C): Absolute TSS and unit level FFSS & OCS by intervention
32

D E V E L O P M E N TE C O N O M I C
Figure 39 (A): Unit level BEI on the FFSS & OCS; (B): Absolute BEI on the TSS; (C): Total BEI on the absolute TSS and unit level FFSS & OCS
33

E N E R G YS E C U R I T Y
L O W E R C A R B O N F O O T P R I N T
Figure 38 illustrates the savings across the electricity value chain by the interventions selected in the research, however, it is imperative to mention that the exact amount of OCS and FFSS will vary greatly depending on the cost of NG and diesel at the various exchange points. Nevertheless, key trends can be extrapolated from the analysis. Firstly, as Figure 38 demonstrates, the potential for national wealth savings is highest at the end of the electricity value chain in end-use - which can be explained by several factors. Initially, reductions in electricity demand reverberate back into power generation and oil & gas extraction. Furthermore, the efficiency gains at end-use interventions are generally much higher (and technically possible) in comparison to those in power generation and oil & gas extraction which tend to be more incremental. Lastly, the initial investment required for demand side interventions are often insignificant in comparison to investments made in oil & gas or power generation, which is corroborated by existing research in the field.
From Figure 38, it can also be seen that the most effective interventions are those related to cooling, the largest consumer of electricity in the U.A.E. across all building types. Increasing the efficiency of chillers and air conditioners in the country or increasing the set point temperature by a degree or two Celsius can realize cost savings in the billions (AED).
It is worth noting that while the research did not look into the cost savings passed on to consumers, the MAC curves presented in Section 5.2 illustrate which interventions end-users are expected to save money from over a 20 year lifetime. For interventions with negative NPVs (positive in the MACC) but significant savings to the government, such as COP+35%, policy instruments such as rebates, cash rewards etc. can be used by the government to incentivize end-users to adopt higher efficiency products. The same strategy can be used to promote the adoption of interventions with positive NPVs (negative in the MACC) but with low adoption rates, such as increasing the set point temperature.
The break-even investment per intervention, shown in Figure 40 can be viewed as the maximum budget the U.A.E. government can allocate per intervention to reap the national wealth savings. The break-even investments were calculated according to the parameters in Table 16, at a discount rate of 4.5% and at various lifetimes according to each intervention.
Figure 40: U.A.E. NG and CO2 savings by intervention
34

D E V E L O P M E N TE C O N O M I C
CHAPTER SEVEN:
ConclusionThis white paper assessed the national wealth savings to the U.A.E. government across the electricity value chain using a number of interventions in oil & gas extraction, power generation, and electricity end-use. The in-house model devised at Masdar Institute calculated national wealth savings according to different types, which include: fossil fuel subsidy savings (from natural gas and diesel); electricity tariff subsidy savings; and the opportunity cost savings from potential sale of natural gas and diesel abroad. The model allows for the modification of an array of prices reflecting the complex fossil fuel procurement and subsidy dynamics of the country. Furthermore, the model allows for different penetration rates per intervention across the electricity value chain, to reflect various adoption scenarios.
The interventions in oil & gas extraction include the installment of natural gas engines as an alternative to the flaring of associated gases at onshore and offshore oil rigs, along with the installment of waste heat to power systems at oil refineries.
For power generation, three efficiency enhancement scenarios were explored of +1%, +2% and +3% to the overall power plant performance. While the power plants were treated as a black box, interventions within power plants that could lead to such efficiency enhancements were explored, such as enhancements to the natural gas turbines (through technologies such as advanced gas path (AGP)) and the optimization of power plant processes through the integration of hardware and software (Industrial Internet).
For end-use, multiple interventions were explored that are benchmarked to a business-as-usual scenario and included a combination of technical and behavioral aspects. The interventions generally fall under the categories of cooling/heating as well as lighting. They are applied across the different building types in the country and at a city level, reflecting the different dynamics per Emirate. Cooling/heating include changes to the wall insulation values, set point temperature, and the efficiency value of chillers and air conditioners (COP value). Lighting include the assessment of new halogen lighting, compact fluorescent lighting (CFL), and Light Emitting Diodes (LED), all benchmarked to the business-as-usual scenario of incandescent lighting.
Key Findings Based on the findings from the developed model and scenario analysis carried out, it is clear that the absolute national wealth savings from efficiency enhancements are highly dependent on the complex dynamics of natural gas and diesel procurement along with the associated costs. However, the key findings of this preliminary work suggest that the highest savings to be reaped are at electricity end-use, followed by oil & gas, and power generation – a relationship that is relatively independent from changes in energy costs or subsidies.
Electricity end-use market size revealed high annual savings (in the tens of billions AED), particularly from higher cooling efficiencies (COP values), and from increasing the set point temperature from 22°C to 23/24°C as well as the adoption of CFL/LED lighting. Furthermore, based on the use of marginal abatement cost curves (MACC) developed for each intervention, we were able to asses from which interventions end-users/customers would see a positive return on investment. Interventions with a negative return on investment for customers (indicating that the market would not encourage such adoption) could potentially be incentivized by the government through various policy instruments.
Following electricity end-use, savings from interventions in the oil & gas sector were found to be the most significant (in the order of billions AED), particularly from waste heat to power at the country’s oil refineries. Such findings are unsurprising given the scale of the oil & gas industry in the country and the huge volumes of crude oil processed on a daily basis.
Power generation saw the least national wealth savings (in the hundreds of millions AED), due to marginal opportunities for efficiency enhancement hindering natural gas savings.
35

E N E R G YS E C U R I T Y
L O W E R C A R B O N F O O T P R I N T
Future work The findings from this report provide a good sense of the potential magnitude of national wealth savings for the U.A.E. from energy efficiency measures, and will act as a stepping stone for assessing the full market size of energy efficiency enhancement savings in the country. Continuing the MI-GE collaboration, it is the intent of both sides to expand the research into more sectors and fields that were not covered in the research. One example being exploring interventions in the end-use of the water sector (i.e. network distribution, irrigation, appliances etc.) that would result in reduced electricity and natural gas consumption, and hence generate national wealth savings.
Furthermore, a limitation in the research conducted was the lack of accurate data pertaining to the economics of the fossil fuel dynamics of the country. As such, going forward, engaging further with relevant private and government energy-related entities will allow for more precise analysis and savings calculations.
In addition, the in-house built model does not allow for nuclear or renewable energy resources adoption. Given the introduction of nuclear power generation in the U.A.E. energy mix, and the demonstrated national motivation to depend on renewable sources of energy (renewables are positioning themselves as an economically feasible alternative given the progressively higher natural gas price), extending the work to incorporate non-conventional power generation resources is crucial to allow for a more accurate model of the energy dynamics in the country. The model developed to pursue the analysis and conclusions in this paper can be further developed to capture future forecasts of natural gas prices as well as demand growth.
Finally, the research covered the following original equipment manufacturer technologies: GE, Wartsila, and Caterpillar. Exploring additional manufacturers as well as mapping other existing technologies will allow for more accurate depiction of potential national wealth savings in the U.A.E. from energy efficiency enhancement measures.
36

D E V E L O P M E N TE C O N O M I C
AcknowledgmentsThe “Driving Productivity & Profitability of Energy Efficiency in thE UAE” white paper is a product of the ASES laboratory with a close collaboration with Dr. Toufic Mezher’s lab, with a specific highlight of his student Maryam Al Hosani who contributed to the process of data gathering under the power generation analysis. In addition, ASES collaborated with Dr. Afshin Afshari’s lab which contributed to the end-use demand analysis. Dr. Afshin and his lab supported the study with the needed data and experience to perform all needed analysis and generate the potential national wealth savings from the adoption of different measures at the demand side in the U.A.E.
The GE team that contributed to this white paper includes Sami Kamel, Marketing Executive, GE Power & Water; Samer Haddad, Sales Manager, GE Power & Water; Lana El Chaar, Service Product Line Manager, GE Power & Water; Riccardo Schiappacasse, Senior Engineer, GE Oil & Gas; Maha Chaouachi, Field Marketing Manager, GE Lighting; and Brandon Owens, Manager, Ecomagination Strategy, GE.
Dr. Toufic Mezher Professor Masdar Institute
Dr. Afshin Afshari Program Lead & Professor of Practice Masdar Institute
37

E N E R G YS E C U R I T Y
L O W E R C A R B O N F O O T P R I N T
References
1. N. Pick, U. P. In, C. Confidence, A. With, and I. G. Pace, “UAE ECONOMIC REPORT NOTABLE PICK UP IN CONSUMER CONFIDENCE ALONG WITH STRENGTHENING INVESTMENT GROWTH PACE,” power plant. 1–19, 2014.
2. G. Economics and B. K. Ward, “The World in 2050 to the Top 100,” no. January, 2012.
3. “The Report: Abu Dhabi 2014,” Gr. Oxford Bus., 2014.
4. “Energy Balance,” International Energy Agency, 2012. [Online]. Available: http://www.iea.org/Sankey/.
5. “United Arab Emirates,” US Energy Inf. Adm., vol. 2013, 2013.
6. “Nuclear Power in the United Arab Emirates,” World Nuclear Association, 2014. [Online]. Available: http://www.world-nuclear.org/info/Country-Profiles/Countries-T-Z/United-Arab-Emirates/.
7. “Shams 1 Project,” Shams Power Company. [Online]. Available: http://www.shamspower.ae/en/about-us/overview/.
8. S. Al Makahleh, “Sir Bani Yas Island is home to largest wind turbine in the region,” Gulf News. [Online]. Available: http://gulfnews.com/news/gulf/uae/government/sir-bani-yas-island-is-home-to-largest-wind-turbine-in-the-region-1.973143.
9. “Emirates National Grid (ENG),” Ministry of Economy. [Online]. Available: http://www.uaetrade-usa.org/index.php?page=economic-sectors-in-uae&cmsid=58.
10. “Waste Heat to Power Systems,” US Environ. Prot. Agency, power plant. 1–9, 2012.
11. T. Of, W. Heat, R. Equipment, A. Of, E. E. Opportunities, and O. Checklist, “Waste heat recovery 1.,” power plant. 1–18, 2004.
12. “Turning heat into power,” GE Power Water.
13. “Waukesha gas engines production facility,” GE Power & Water. [Online]. Available: https://www.ge-distributedpower.com/about/visitor-information/waukesha-wisconsin.
14. GE, “GE’s Jenbacher Gas Engines.” [Online]. Available: http://site.ge-energy.com/prod_serv/products/recip_engines/en/index.htm.
15. “Wartsila Gas Fired Engines,” Wartsila. [Online]. Available: http://www.wartsila.com/en/power-plants/technology/combustion-engines/gas-engines.
16. “Gas Engines,” Caterpillar. [Online]. Available: http://www.cat.com/en_US/power-systems/industrial-oem/gas-engines.html.
17. “Fact sheet: 9E Advanced Gas Path,” GE Power Water, power plant. 10–11.
18. “Industrial Internet,” GE. [Online]. Available: http://www.ge.com/stories/industrial-internet.
19. “Your Guide to More Efficient and Money-Saving Light Bulbs CFLs,” NRDC, 2012.
20. L. Abdullatif and T. Alam, “Policy Brief UAE REGULATION ON LIGHTING PRODUCTS AND RECOMMENDATIONS TO FACILITATE ITS,” no. August, 2014.
21. D. Zdvorak, “The New Standard for Indoor Incandescent Light Bulbs in the United Arab Emirates.”
22. Jeffrey Bausch, “The long history of light-emitting diodes,” 2011. [Online]. Available: http://www.electronicproducts.com/Optoelectronics/LEDs/The_long_history_of_light-emitting_diodes.aspx.
23. “The Best Compact Fluorescent Light Bulbs: PM Lab Test,” Popular Mechanics, 2007. [Online]. Available: http://www.popularmechanics.com/home/reviews/news/4215199.
38

ge.com/aege.com/ecomagination
masdar.ac.ae