Driving innovation through big open linked data (BOLD ... · Driving innovation through big open...
16
Driving innovation through big open linked data (BOLD): Exploring antecedents using interpretive structural modelling Yogesh K. Dwivedi 1 & Marijn Janssen 2 & Emma L. Slade 1 & Nripendra P. Rana 1 & Vishanth Weerakkody 3 & Jeremy Millard 3,4 & Jan Hidders 5 & Dhoya Snijders 6 Published online: 13 July 2016 # The Author(s) 2016. This article is published with open access at Springerlink.com Abstract Innovation is vital to find new solutions to prob- lems, increase quality, and improve profitability. Big open linked data (BOLD) is a fledgling and rapidly evolving field that creates new opportunities for innovation. However, none of the existing literature has yet considered the interrelation- ships between antecedents of innovation through BOLD. This research contributes to knowledge building through utilising interpretive structural modelling to organise nineteen factors linked to innovation using BOLD iden- tified by experts in the field. The findings show that almost all the variables fall within the linkage cluster, thus having high driving and dependence powers, dem- onstrating the volatility of the process. It was also found that technical infrastructure, data quality, and external pressure form the fundamental foundations for innovation through BOLD. Deriving a framework to encourage and man- age innovation through BOLD offers important theoretical and practical contributions. Keywords Big data . Open data . Linked data . Innovation . Interpretive structural modelling 1 Introduction ‘We only have to imagine a world without Google searches, online weather forecasts or GPS technologies to realize the current impact of data on our lives’ (Jetzek et al. 2014, p.101). The rapid advancement of ICTs together with electronic publishing has enabled wide distribution of large amounts of data previously held in closed, internal systems. ‘Big data’ consists of datasets so large and complex that they require advanced capture, storage, management, and analysis technol- ogies (Chen et al. 2012; Hota et al. 2015). While big data is * Yogesh K. Dwivedi [email protected]; [email protected] Marijn Janssen [email protected] Emma L. Slade [email protected] Nripendra P. Rana [email protected] Vishanth Weerakkody [email protected] Jeremy Millard [email protected]; [email protected] Jan Hidders [email protected] Dhoya Snijders [email protected] 1 School of Management, Swansea University, Swansea, Wales, UK 2 Section of Information & Communication Technology, Faculty of Technology, Policy, and Management, Delft University of Technology, Delft, The Netherlands 3 Business School, Brunel University, Uxbridge, UK 4 Danish Technological Institute, Anker Engelunds Vej 1, Building 101A, 2800 Kgs. Lyngby, Denmark 5 Web and Information Systems Engineering Lab, Department of Computer Science, Vrije Universiteit Brussel, Boulevard de la Plaine 2, 1050 Ixelles, Belgium 6 Researcher Data & Society, The Dutch Study Center for Technology Trends (STT), Prinsessegracht 23, 2514, AP Den Haag, The Netherlands Inf Syst Front (2017) 19:197–212 DOI 10.1007/s10796-016-9675-5
Transcript of Driving innovation through big open linked data (BOLD ... · Driving innovation through big open...
Driving innovation through big open linked data (BOLD):Exploring antecedents using interpretive structural modelling
Yogesh K. Dwivedi1 & Marijn Janssen2& Emma L. Slade1 & Nripendra P. Rana1 &
Vishanth Weerakkody3 & Jeremy Millard3,4& Jan Hidders5 & Dhoya Snijders6
Published online: 13 July 2016# The Author(s) 2016. This article is published with open access at Springerlink.com
Abstract Innovation is vital to find new solutions to prob-lems, increase quality, and improve profitability. Big openlinked data (BOLD) is a fledgling and rapidly evolving fieldthat creates new opportunities for innovation. However, noneof the existing literature has yet considered the interrelation-ships between antecedents of innovation through BOLD. Thisresearch contributes to knowledge building throughutilising interpretive structural modelling to organisenineteen factors linked to innovation using BOLD iden-tified by experts in the field. The findings show thatalmost all the variables fall within the linkage cluster,thus having high driving and dependence powers, dem-onstrating the volatility of the process. It was also foundthat technical infrastructure, data quality, and externalpressure form the fundamental foundations for innovationthrough BOLD. Deriving a framework to encourage and man-age innovation through BOLD offers important theoreticaland practical contributions.
Keywords Big data . Open data . Linked data . Innovation .
Interpretive structural modelling
1 Introduction
‘We only have to imagine a world without Googlesearches, online weather forecasts or GPS technologiesto realize the current impact of data on our lives’ (Jetzeket al. 2014, p.101).
The rapid advancement of ICTs together with electronicpublishing has enabled wide distribution of large amounts ofdata previously held in closed, internal systems. ‘Big data’consists of datasets so large and complex that they requireadvanced capture, storage, management, and analysis technol-ogies (Chen et al. 2012; Hota et al. 2015). While big data is
* Yogesh K. [email protected]; [email protected]
Marijn [email protected]
Emma L. [email protected]
Nripendra P. [email protected]
Vishanth [email protected]
Jeremy [email protected]; [email protected]
Dhoya [email protected]
1 School of Management, Swansea University, Swansea, Wales, UK2 Section of Information & Communication Technology, Faculty of
Technology, Policy, and Management, Delft University ofTechnology, Delft, The Netherlands
3 Business School, Brunel University, Uxbridge, UK4 Danish Technological Institute, Anker Engelunds Vej 1, Building
101A, 2800 Kgs. Lyngby, Denmark5 Web and Information Systems Engineering Lab, Department of
Computer Science, Vrije Universiteit Brussel, Boulevard de la Plaine2, 1050 Ixelles, Belgium
6 Researcher Data & Society, The Dutch Study Center for TechnologyTrends (STT), Prinsessegracht 23, 2514, AP DenHaag, The Netherlands
Inf Syst Front (2017) 19:197–212DOI 10.1007/s10796-016-9675-5
characterised by its size and variety (Gandomi and Haider2015; Kankanhalli et al. 2016), ‘open data’ is characterisedby its free availability and absence of privacy restrictions(Janssen et al. 2012). Although large volumes of raw opendata published in an electronic format are machine-readableand can be shared online and re-used, on its own open dataoffers limited potential for decision making. However, whendispersed open data is interlinked to provide more context,greater opportunities for stakeholders to exploit the data forinnovative purposes are provided, for example through col-laboration and co-creation (Behkamal et al. 2014).
‘Big open linked data’ (BOLD) is a recent and rapidlyemerging field in the technology oriented business world(Janssen et al. 2015). It refers to the integration of diverse data,without predefined restrictions or conditions of use, to createnew insights (Janssen and Kuk 2016). BOLD can be releasedby public and private organizations or individuals (Janssenet al. 2015) and can increase the reach of statistical and oper-ational information, and deepen analysis of outcomes and im-pacts. Realising the variety of potential benefits (Hossain et al.2016), governments are keen to adopt open data policies, doc-umented by the increasing number of countries committing tothe Open Government Partnership, with 65 countries collec-tively developing more than 2000 policy initiatives by 2014(Open Government Partnership 2014). McKinsey andCompany (2011) estimate that the value of big data to UShealthcare could be more than $300 billion through drivingefficiency and quality, and in the private sector using big dataeffectively has the potential to increase retailers’ operatingmargins by 60 %. The use of BOLD is often tied toevidence-based policymaking (Ferro et al. 2013; Janssen andKuk 2016); however, unlike public sector actors, private or-ganizations can view data as a strategic asset, providing achallenge to greater information sharing (Sayogo et al. 2014).
It is widely recognised that innovation is key to growth andperformance (Hauser et al. 2006; Van der Panne et al. 2003).BOLD creates innovation opportunities for both the publicand private sectors, from innovation of processes and productsto developments in the supply chain and new markets (Jetzeket al. 2014; Zuiderwijk et al. 2014). However, Janssen et al.(2015, p.87) state that ‘creating innovations with data is acomplex process in which both the available data and theusers’ demands need to be taken into account’. Despite thecomplexities, research has not yet attempted to draw togetherthe factors affecting innovation through BOLD. Industry-focussed research highlights issues that need to be addressedto capture the full potential of big data - such as innovation -including data policies, technology infrastructure, organiza-tional change and talent, access to data, and competitive ad-vantage (McKinsey and Company 2011). Although providinga useful starting point for further investigation, the interrela-tionships between the issues have not been explored, which isnecessary for avoiding failure and maximising success of new
initiatives in this area (Dwivedi et al. 2015a; Hughes et al.2015). Therefore, adopting the interpretive structural model-ling (ISM) method, this research seeks to attend to this gap.
The remainder of the paper is as follows. First, a lit-erature review of research regarding BOLD and innova-tion is undertaken. Next is a section detailing the ISMmethod employed to determine the power of differentfactors in driving innovation through BOLD, followedby further sections discussing the results and their impli-cations. Finally, the paper is concluded, outlining limita-tions and discussing future lines of research.
2 Literature review
In their analysis of the literature, Chen et al. (2012) foundresearch regarding ‘big data’ began to gain traction from2007. Similarly, Zuiderwijk et al. (2014) report a sharp in-crease in publications regarding ‘open data’ from 2009.However, research combining the concepts of big, open, andlinked data has only recently begun to emerge, and studiesconsidering innovation through BOLD are even more scarce.
This review of the literature finds support for Zuiderwijket al.’s (2014) suggestions that much of the existing researchhas oriented towards data provision. Shadbolt et al. (2012)consider how to bring open government data into the linked-data web. They report that licensing restrictions are one of thebiggest obstacles, management of an influx of heterogeneousdata a challenge, and ease of citizen access and betterinfrastructure is critical to realize value. Considering datadisclosure in the private sector, Sayogo et al. (2014) foundseveral challenges and motivating factors regarding marketdynamics, information policies, data challenges, and techno-logical capability. Nevertheless, research is beginning toemerge regarding the acceptance and use of data and opendata technologies (Zuiderwijk et al. 2015). Juell-Skielseet al.’s (2014) study investigates the role and functions ofdigital innovation contests and explores the support providedfollowing such contests to finalise and implement the partici-pants’ ideas. Susha et al. (2015) examined the organisationalmeasures to facilitate the use of open data. Their findingsindicated that most public organisations have no or limitedinteraction with data users and are often found selective interms of with whom and how to communicate.
Given the novelty of the area, many existing studies adopt acase study method. Lassinantti et al. (2014) used two in-depthcase studies of Swedish municipalities to consider how localopen data initiatives can stimulate innovation. Analysis of thecases revealed different drivers for open data initiatives –‘techno-economic growth’ and ‘co-created societal growth’.The authors note that although targeted innovation activitiesinitially render quicker results, excluding potential innovatorscan inhibit more radical innovations. Janssen et al. (2015)
198 Inf Syst Front (2017) 19:197–212
explored the link between BOLD and smart cities based oncase studies of Amsterdam and Rio de Janeiro and found thatBOLD combined with predictive analytics enables improveduse of resources in the urban area. It was found that a mainchallenge of using BOLD to create smart cities is in identify-ing data sources and the availability of the data. The authorsnoted that much can be accomplished with simple analytictechniques but in order to take advantage of the methods cit-izens must be smart with the knowledge provided.
Nugroho et al. (2015) provided a comprehensive cross-national comparative framework to compare the open datapolicies from different countries. The comparison highlightedvarious lessons including actions related to strong legal frame-work, generic operational policies, data providers and datausers, data quality, designated agencies and initiatives, andincentives for stimulating demand for data. Jetzek et al.(2014) devise a framework of value generation strategies fromthe data provider’s perspective. The four identified mecha-nisms are transparency, participation, efficiency, andinnovation. Jetzek et al. (2014) propose a conceptual modelof the data driven innovation mechanism consisting of threefundamental phases: idea generation, idea conversion,and idea diffusion. They determine four multi-dimensional ‘enabling factors’ capable of influencingthe innovation mechanism, namely absorptive capacity,such as organizational capabilities; openness, such asease of access to data; resource governance, includingleadership and privacy; and technical connectivity, forinstance number of platforms. However, the conceptual modelis presented at a high level of abstraction, failing to account forinterrelationships between individual factors, and is based ona single-case study.
Following Dwivedi et al.’s (2015a) approach, a recent pan-el discussion held at the 14th IFIP I3E Conference broughttogether invited academic and practitioner experts to considerhow BOLD can be utilised to drive innovation and the obsta-cles and challenges that might be implicated (Dwivedi et al.2015b). Several of the panellists noted the diverging interestsof different stakeholders and the risks of forgetting users’needs as a result of data-driven solutions. As disadvantagesof BOLD are often overlooked (see Zuiderwijk and Janssen2014), panellists discussed the technical, legal, regulatory, andethical challenges. This panel discussion provides furtherfoundations for the development of a conceptual model ofinnovation through BOLD.
Zuiderwijk et al. (2014) argue that the diversity of theoriesthat are currently implicated in open data research is likely tobe a result of the topic being an emerging phenomenon. Theauthors recommend that future research should focus on the-ory development and stimulating the use of open data.Therefore, this paper responds to these recommendations bytaking pioneering steps to develop a theory of driving innova-tion through BOLD.
3 Methods
Interpretive structural modelling (ISM) is a well-establishedmethod for identifying relationships among specific items,which define a problem or an issue (Jharkharia and Shankar2005). A number of factors may be related to any complexproblem under consideration. However, the direct and indirectrelationships between the factors describe the situation farmore accurately than a specific factor taken in isolation.Therefore, ISM develops insight into collective understandingof these relationships (Attri et al. 2013). The method is inter-pretive in the sense that a group’s adjudication decides wheth-er and how the variables are related. It is structural in the sensethat an overall structure is extracted from the complex set ofvariables based on their relationships. Finally, it is modellingin the sense that the specific relationships and overall structureare portrayed in a digraph model through a hierarchicalconfiguration.
The ISMmethod helps to impose order and direction on thecomplexity of the relationships among the variables of a sys-tem (Attri et al. 2013; Sage 1977; Warfield 1974). For acomplex and emerging problem, such as innovation throughBOLD, a number of factors may be implicated. However, thedirect and indirect relationships between the factors describingthe situation are far more precise than the individual factorsconsidered in isolation. Therefore, ISM develops insight intothe collective understanding of these relationships. Forexample, Singh et al. (2007) used ISM to develop structuralrelationships between competitiveness factors to aid small andmedium enterprises’ strategic decisions. Similarly, Agarwalet al. (2007) applied ISM to identify and analyse theinterrelationships of the variables influencing supply chainagility. Moreover, Talib et al. (2011) employed ISM to analysethe interactions among the barriers to total quality manage-ment implementation. The application of ISM typically forcesmanagers to review perceived priorities and improves theirunderstanding of the linkages among key concerns. The var-ious steps involved in the ISMmethod are (Singh et al. 2007):
[1] Identification of elements relevant to the problem or is-sue; this could be undertaken through a literature reviewor any group problem solving technique (such as paneldiscussion).
[2] Establishing a contextual relationship between variableswith respect to which pairs of variables will be examined.
[3] [3] Developing a Structural Self-Interaction Matrix(SSIM) of elements to indicate pair-wise relationshipsbetween variables of the system.
[4] Developing a reachability matrix from the SSIM andchecking the matrix for transitivity. Transitivity of thecontextual relation is a basic assumption in ISM, whichstates that if element A is related to B, and B is related toC, then Awill be necessarily related to C.
Inf Syst Front (2017) 19:197–212 199

[5] Partitioning of the reachability matrix into differentlevels.
[6] Based on the relationships given above in the reachabil-ity matrix, drawing a directed graph (digraph), and re-moving transitive links.
[7] Converting the resultant digraph into an ISM-basedmodel, by replacing element nodes with statements.
[8] Reviewing the ISM-based model to check for conceptualinconsistency and making the necessary modifications.
The above outlined steps that lead to the development ofthe ISM model are discussed below.
3.1 Identification of elements
The literature review revealed that a comprehensive identifi-cation of the factors related to innovation through BOLD hasnot previously been undertaken. Therefore, expert opinionswere sought to identify elements and develop contextual rela-tionships among relevant variables.
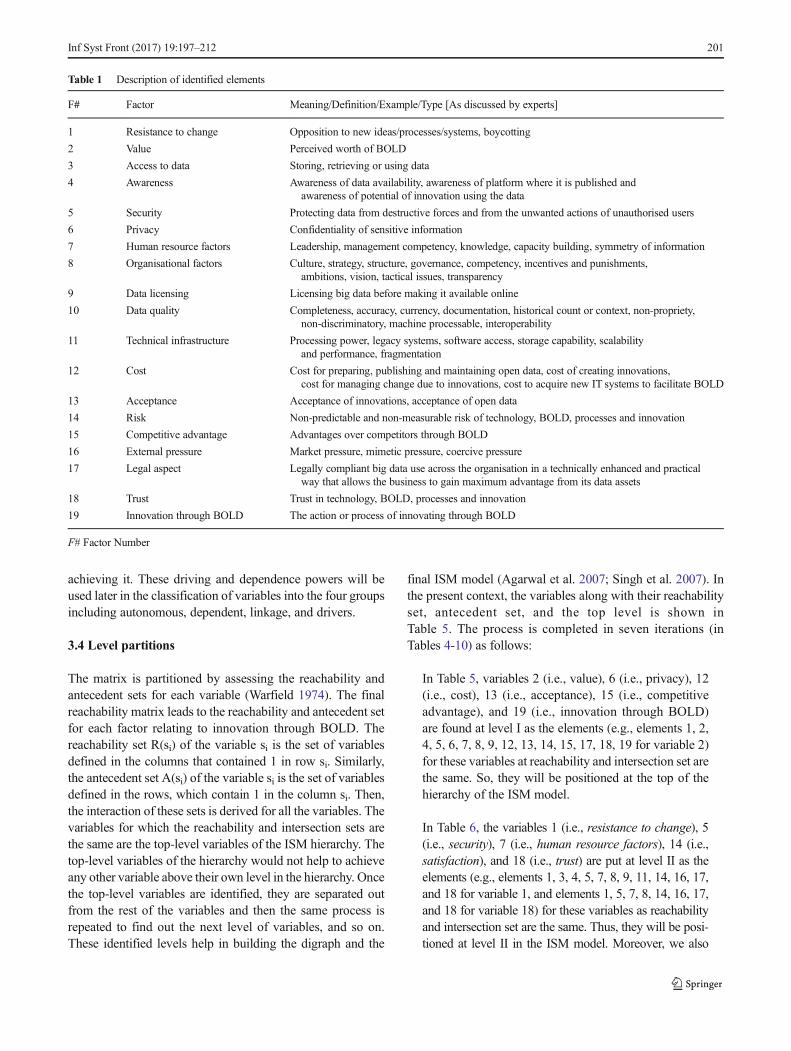
The first step involved identifying all relevant facets ofinnovation through BOLD via a panel session with interestedBOLD experts attending the first day of the 14th IFIP I3EConference in Delft, The Netherlands. Every element wasdiscussed thoroughly to develop a common understanding.The factors that experts finally agreed on were: resis-tance to change, value, access to data, awareness, secu-rity, privacy, human resource factors, organisational fac-tors, data licensing, data quality, technology infrastruc-ture, cost, acceptance, risk, competitive advantage, ex-ternal pressure, legal aspect, trust, and innovation throughBOLD. As the aim of the research is to identify and analysefactors driving Binnovation through BOLD^, it is consideredas an ultimate variable and the impact of all other variables areexplored around it. Table 1 presents the meaning/definition/example/type of various factors as discussed and finalised bythe panel of experts.
3.2 Structural self-interaction matrix (SSIM)
Once the elements had been identified it was necessary todetermine contextual relationships between the factors to de-velop the SSIM. In total seven specialists, including threeprofessionals with diverse industry experience related toBOLD and four highly proficient academics with mixed ex-perience of teaching, researching, and advising governmenton policy and on BOLD related matters, were chosen to pro-vide their expert views. The diversity among participantshelped to ensure a holistic view was achieved.
To analyse variables associated with innovation throughBOLD, a contextual relationship of ‘helps achieve’ or ‘influ-ences’ is chosen. To express the relationships between differ-ent factors on innovation through BOLD, four symbols were
used to denote the directions of relationships between the pa-rameters i and j (here, i < j):
V – Construct i helps achieve or influences j.A – Construct j helps achieve or influences i.X – Constructs i and j help achieve or influence eachother.O – Constructs i and j are unrelated.
For example, the following statements explain the use ofsymbols V, A, X, O in SSIM:
[1] Resistance to change (Variable 1) helps achieve or influ-ences innovation through BOLD (Variable 19) = V
[2] Legal aspect (Variable 17) helps achieve or influencessecurity (Variable 5) = A
[3] Technical infrastructure (Variable 11) and privacy(Variable 6) help achieve or influence each other = X
[4] Data quality (Variable 10) and access to data (Variable 3)are unrelated = O
Based on contextual relationships, the SSIM is developed(see Table 2).
3.3 Reachability matrix
The SSIM is converted into a binary matrix, called the initialreachability matrix, by substituting V, A, X, and O with 1 and0 as per the case. The substitution of 1 s and 0 s are as per thefollowing rules:
[1] If the (i, j) entry in the SSIM is V, the (i, j) entry in thereachability matrix becomes 1 and the (j, i) entry be-comes 0.
[2] If the (i, j) entry in the SSIM is A, the (i, j) entry in thereachability matrix becomes 0 and the (j, i) entry be-comes 1.
[3] If the (i, j) entry in the SSIM is X, the (i, j) entry in thereachability matrix becomes 1 and the (j, i) entry be-comes 1.
[4] If the (i, j) entry in the SSIM is O, the (i, j) entry in thereachability matrix becomes 0 and the (j, i) entry be-comes 0.
Following these rules, the initial reachability matrix forinnovation through BOLD is shown in Table 3.
After including transitivity as explained in Step 4 of theISM method, the final reachability matrix is shown inTable 4. Table 4 also shows the driving and dependence powerof each variable. The driving power for each variable is thetotal number of variables (including itself), which it may helpto achieve. On the other hand, dependence power is the totalnumber of variables (including itself), which may help in
200 Inf Syst Front (2017) 19:197–212
achieving it. These driving and dependence powers will beused later in the classification of variables into the four groupsincluding autonomous, dependent, linkage, and drivers.
3.4 Level partitions
The matrix is partitioned by assessing the reachability andantecedent sets for each variable (Warfield 1974). The finalreachability matrix leads to the reachability and antecedent setfor each factor relating to innovation through BOLD. Thereachability set R(si) of the variable si is the set of variablesdefined in the columns that contained 1 in row si. Similarly,the antecedent set A(si) of the variable si is the set of variablesdefined in the rows, which contain 1 in the column si. Then,the interaction of these sets is derived for all the variables. Thevariables for which the reachability and intersection sets arethe same are the top-level variables of the ISM hierarchy. Thetop-level variables of the hierarchy would not help to achieveany other variable above their own level in the hierarchy. Oncethe top-level variables are identified, they are separated outfrom the rest of the variables and then the same process isrepeated to find out the next level of variables, and so on.These identified levels help in building the digraph and the
final ISM model (Agarwal et al. 2007; Singh et al. 2007). Inthe present context, the variables along with their reachabilityset, antecedent set, and the top level is shown inTable 5. The process is completed in seven iterations (inTables 4-10) as follows:
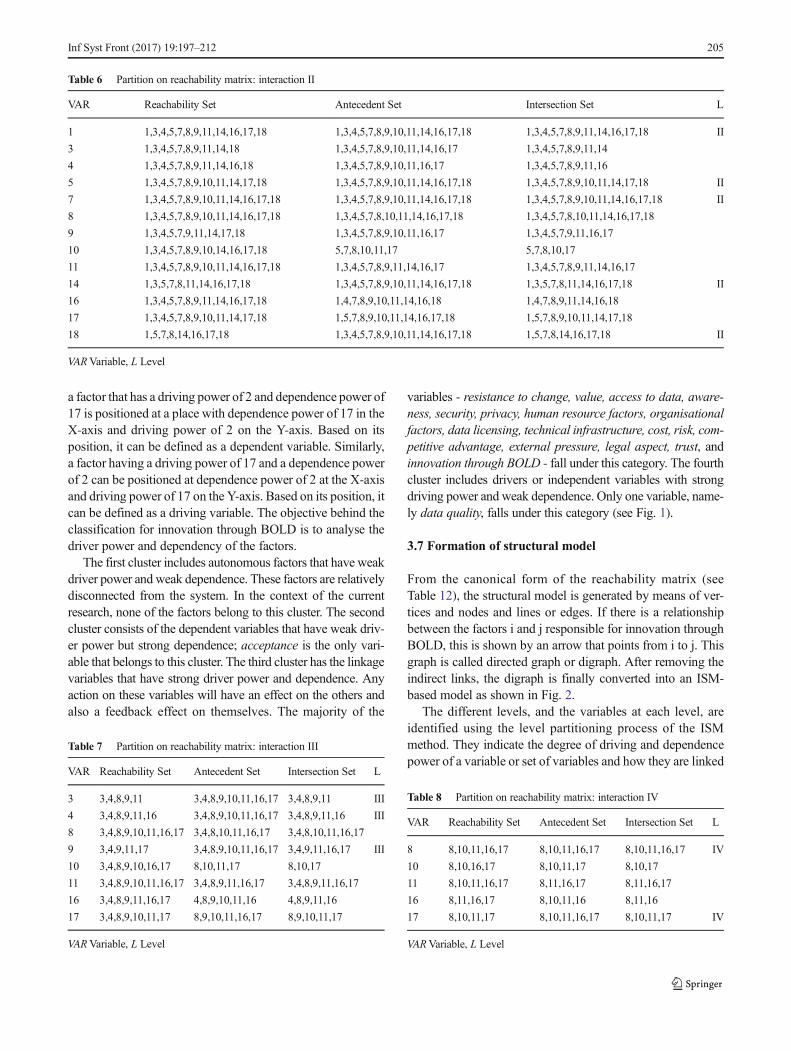
In Table 5, variables 2 (i.e., value), 6 (i.e., privacy), 12(i.e., cost), 13 (i.e., acceptance), 15 (i.e., competitiveadvantage), and 19 (i.e., innovation through BOLD)are found at level I as the elements (e.g., elements 1, 2,4, 5, 6, 7, 8, 9, 12, 13, 14, 15, 17, 18, 19 for variable 2)for these variables at reachability and intersection set arethe same. So, they will be positioned at the top of thehierarchy of the ISM model.
In Table 6, the variables 1 (i.e., resistance to change), 5(i.e., security), 7 (i.e., human resource factors), 14 (i.e.,satisfaction), and 18 (i.e., trust) are put at level II as theelements (e.g., elements 1, 3, 4, 5, 7, 8, 9, 11, 14, 16, 17,and 18 for variable 1, and elements 1, 5, 7, 8, 14, 16, 17,and 18 for variable 18) for these variables as reachabilityand intersection set are the same. Thus, they will be posi-tioned at level II in the ISM model. Moreover, we also
Table 1 Description of identified elements
F# Factor Meaning/Definition/Example/Type [As discussed by experts]
1 Resistance to change Opposition to new ideas/processes/systems, boycotting
2 Value Perceived worth of BOLD
3 Access to data Storing, retrieving or using data
4 Awareness Awareness of data availability, awareness of platform where it is published andawareness of potential of innovation using the data
5 Security Protecting data from destructive forces and from the unwanted actions of unauthorised users
6 Privacy Confidentiality of sensitive information
7 Human resource factors Leadership, management competency, knowledge, capacity building, symmetry of information
8 Organisational factors Culture, strategy, structure, governance, competency, incentives and punishments,ambitions, vision, tactical issues, transparency
9 Data licensing Licensing big data before making it available online
10 Data quality Completeness, accuracy, currency, documentation, historical count or context, non-propriety,non-discriminatory, machine processable, interoperability
11 Technical infrastructure Processing power, legacy systems, software access, storage capability, scalabilityand performance, fragmentation
12 Cost Cost for preparing, publishing and maintaining open data, cost of creating innovations,cost for managing change due to innovations, cost to acquire new IT systems to facilitate BOLD
13 Acceptance Acceptance of innovations, acceptance of open data
14 Risk Non-predictable and non-measurable risk of technology, BOLD, processes and innovation
15 Competitive advantage Advantages over competitors through BOLD
16 External pressure Market pressure, mimetic pressure, coercive pressure
17 Legal aspect Legally compliant big data use across the organisation in a technically enhanced and practicalway that allows the business to gain maximum advantage from its data assets
18 Trust Trust in technology, BOLD, processes and innovation
19 Innovation through BOLD The action or process of innovating through BOLD
F# Factor Number
Inf Syst Front (2017) 19:197–212 201

remove the rows corresponding to variables 2, 6, 12, 13,15, and 19 from Table 5, which are already positioned atthe top level (i.e., level I). The same process of deleting
the rows corresponding to the previous level and mark-ing the next level position to the new table is repeateduntil we reach the final variable in the table.
Table 2 Structural self-interaction matrix (SSIM)
V[i/j] 19 18 17 16 15 14 13 12 11 10 9 8 7 6 5 4 3 2 1
1 V X X A O X V X A A A X X A A O O A
2 A X A O X V V X A A A O O A A O A
3 V V A A V O V A A O A X X X X V
4 V V O A X V V O O O O X X O O
5 V V A A O X V X X O A X X X
6 X V A A O V V X X O V X X
7 V V O A V V V O V O O X
8 V V O A X V V O X O O
9 V V A A X V O V O O
10 V V O O V V V V A
11 V O A A V V V V
12 X O A A X V O
13 V A A A X A
14 V X A O O
15 X O O O
16 X O O
17 O V
18 V
19
1 = Resistance to Change, 2 = Value, 3 = Access to Data, 4 = Awareness, 5 = Security, 6 = Privacy, 7 = HR Factors, 8 = Organisational Factors, 9 = DataLicensing, 10 =Data Quality, 11 = Technical Infrastructure, 12 = Cost, 13 =Acceptance, 14 = Risk, 15 = Competitive Advantage, 16 = External Pressure,17 = Legal Aspect, 18 = Trust, 19 = Innovation through BOLD, V[i/j] = Variable i/Variable j
Table 3 Initial reachabilitymatrix VAR 1 2 3 4 5 6 7 8 9 10 11 12 13 14 15 16 17 18 19
1 1 0 0 0 0 0 1 1 0 0 0 1 1 1 0 0 1 1 1
2 1 1 0 0 0 0 0 0 0 0 0 1 1 1 1 0 0 1 0
3 0 1 1 1 1 1 1 1 0 0 0 0 1 0 1 0 0 1 1
4 0 0 0 1 0 0 1 1 0 0 0 0 1 1 1 0 0 1 1
5 1 1 1 0 1 1 1 1 0 0 1 1 1 1 0 0 0 1 1
6 1 1 1 0 1 1 1 1 1 0 1 1 1 1 0 0 0 1 1
7 1 0 1 1 1 1 1 1 0 0 1 0 1 1 1 0 0 1 1
8 1 0 1 1 1 1 1 1 0 0 1 0 1 1 1 0 0 1 1
9 1 1 1 0 1 0 0 0 1 0 0 1 0 1 1 0 0 1 1
10 1 1 0 0 0 0 0 0 0 1 0 1 1 1 1 0 0 1 1
11 1 1 1 0 1 1 0 1 0 1 1 1 1 1 1 0 0 0 1
12 1 1 1 0 1 1 0 0 0 0 0 1 0 1 1 0 0 0 1
13 0 0 0 0 0 0 0 0 0 0 0 0 1 0 1 0 0 0 1
14 1 0 0 0 1 0 0 0 0 0 0 0 1 1 0 0 0 1 1
15 0 1 0 1 0 0 0 1 1 0 0 1 1 0 1 0 0 0 1
16 1 0 1 1 1 1 1 1 1 0 1 1 1 0 0 1 0 0 1
17 1 1 1 0 1 1 0 0 1 0 1 1 1 1 0 0 1 1 0
18 1 1 0 0 0 0 0 0 0 0 0 0 1 1 0 0 0 1 1
19 0 1 0 0 0 1 0 0 0 0 0 1 0 0 1 1 0 0 1
202 Inf Syst Front (2017) 19:197–212

In Table 7, variables 3 (i.e., access to data), 4 (i.e.,awareness), and 9 (i.e., data licensing) are put at levelIII as the elements (i.e., elements 3, 4, 8, 9, and 11 forvariable 3, elements 3, 4, 8, 9, 11, 16 for variable 4, andelements 3, 4, 9, 11, and 17 for variable 9) at reachabilityset and intersection set for these variables are the same.Thus, it will be positioned at level III in the ISM model.
In Table 8, variables 8 (i.e., organisational factors) and17 (i.e., legal aspect) are put at level IVas the elements(i.e., elements 8, 10, 11, 16, 17 for variable 8 andelements 8, 10, 11, 17 for variable 17) at reach-ability set and intersection set for these variables are thesame. Thus, it will be positioned at level IV in the ISMmodel.
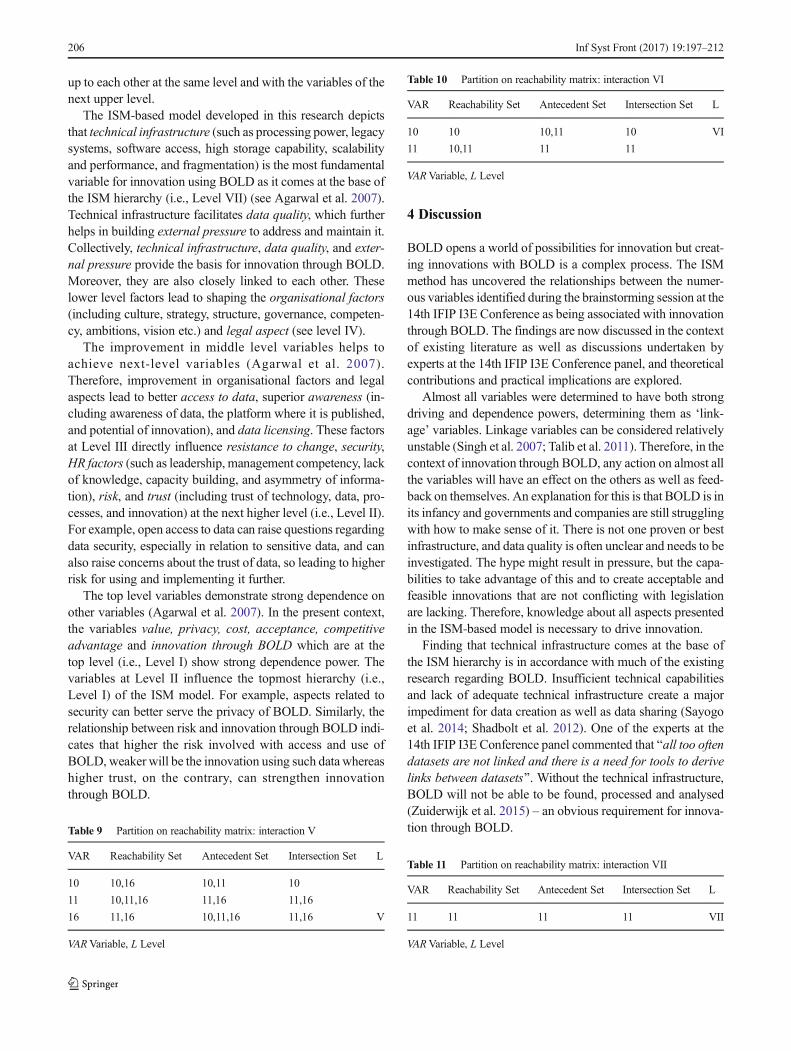
In Table 9, variable 16 (i.e., external pressure) isput at level V, as the elements (i.e., 11 and 16) atreachability set and intersection set for this vari-able are the same. Thus, it will be positioned atlevel V in the ISM model.
In Table 10, variable 10 (i.e., data quality) is put at levelVI as the element (i.e., 10) at reachability set and inter-section set for this variable is the same. Thus, it will bepositioned at level VI in the ISM model.
In Table 11, variable 11 (i.e., technical infrastructure) isput at level VII as the element (i.e., 11) at reachability setand intersection set for this variable is the same. Thus, itwill be positioned at level VII in the ISM model.
3.5 Developing canonical matrix
A canonical matrix is developed by clustering variablesin the same level, across the rows and columns of thefinal reachability matrix as shown in Table 12. Thismatrix is just another, more convenient, form of the finalreachability matrix (i.e., Table 3) as far as drawing the ISMmodel is concerned.
3.6 Classification of factors influencing innovationusing BOLD
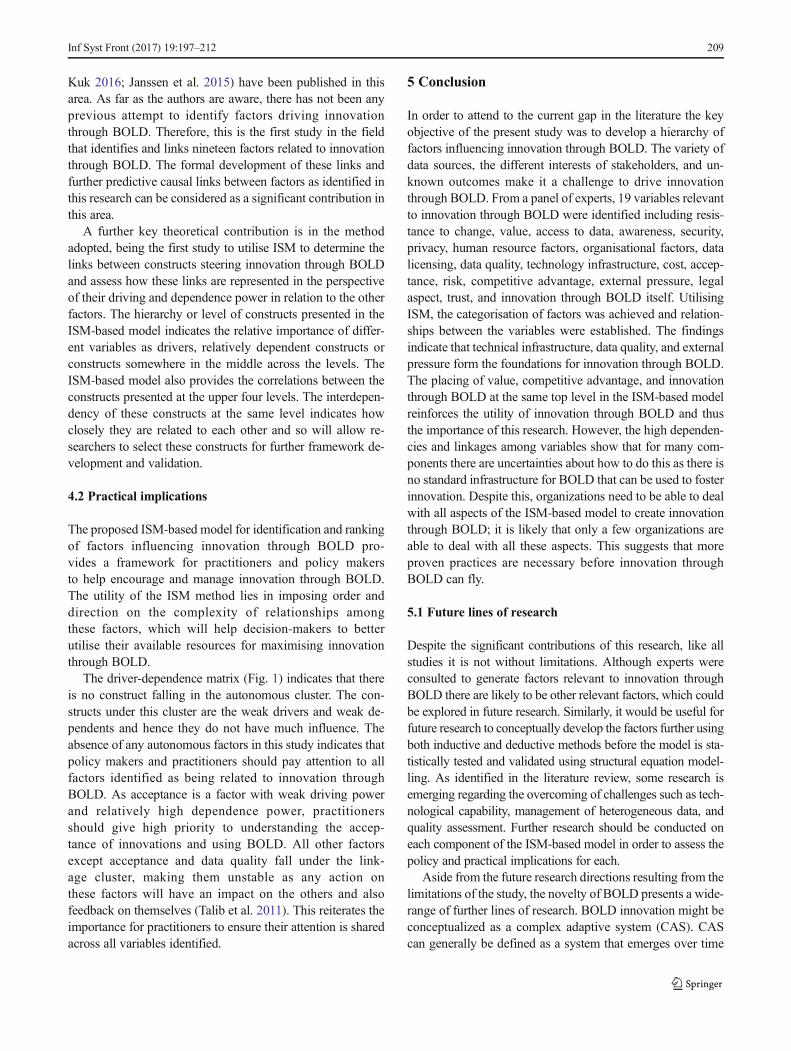
The factors for innovation using BOLD are classified into fourcategories based on driving power and dependence power:autonomous, dependent, linkage, and drivers (Mandal andDeshmukh 1994). The driving power and dependence powerof each of these BOLD factors is shown in Table 4. The driverpower – dependence power diagram is shown in Fig. 1.
This figure has four quadrants that represent the autono-mous, dependent, linkage, and driver categories. For example,
Table 4 Final reachability matrix
VAR 1 2 3 4 5 6 7 8 9 10 11 12 13 14 15 16 17 18 19 DRP
1 1 1* 1* 1* 1* 1* 1 1 1* 0 1* 1 1 1 1* 1* 1 1 1 18
2 1 1 0 1* 1* 1* 1* 1* 1* 0 0 1 1 1 1 0 1* 1 1* 15
3 1* 1 1 1 1 1 1 1 1* 0 1* 1* 1 1* 1 0 0 1 1 16
4 1* 1* 1* 1 1* 1* 1 1 1* 0 1* 1* 1 1 1 1* 0 1 1 17
5 1 1 1 1* 1 1 1 1 1* 1* 1 1 1 1 1* 0 1* 1 1 18
6 1 1 1 1* 1 1 1 1 1 0 1 1 1 1 1* 0 1* 1 1 17
7 1 1* 1 1 1 1 1 1 1* 1* 1 1* 1 1 1 1* 1* 1 1 19
8 1 1* 1 1 1 1 1 1 1* 1* 1 1* 1 1 1 1* 1* 1 1 19
9 1 1 1 1* 1 1* 1* 0 1 0 1* 1 1* 1 1 1* 1* 1 1 17
10 1 1 1* 1* 1* 1* 1* 1* 1* 1 0 1 1 1 1 1* 1* 1 1 18
11 1 1 1 1* 1 1 1* 1 1* 1 1 1 1 1 1 1* 1* 1* 1 19
12 1 1 1 1* 1 1 1* 1* 1* 0 1* 1 1* 1 1 1* 1* 0 1 17
13 0 1* 0 1* 0 1* 0 1* 1* 0 0 1* 1 0 1 1* 0 0 1 10
14 1 1* 1* 0 1 1* 1* 1* 0 0 1* 1* 1 1 1* 1* 1* 1 1 16
15 1* 1 1* 1 1* 1* 1* 1 1 0 1* 1 1* 0 1 1* 0 1* 1 16
16 1 1* 1 1 1 1 1 1 1 0 1 1 1 1* 1* 1 1* 1* 1 18
17 1 1 1 1* 1 1 1* 1* 1 1* 1 1 1 1 1* 0 1 1 1* 18
18 1 1 0 0 1* 1* 1* 1* 0 0 0 1* 1 1 1* 1* 1* 1 1 14
19 1* 1 1* 1* 1* 1 1* 1* 1* 0 1* 1 1* 1* 1 1 0 1* 1 17
DNP 18 19 16 17 18 19 18 18 17 6 15 19 19 17 19 14 14 17 19 319
1* shows transitivity
DNP Dependence Power, DRP Driving Power, VARVariable
Inf Syst Front (2017) 19:197–212 203

Tab
le5
Partition
onreachabilitymatrix:
interactionI
VAR
Reachability
AntecedentS
etIntersectio
nSet
L
11,2,3,4,5,6,7,8,9,11,12,13,14,15,16,17,18,19
1,2,3,4,5,6,7,8,9,10,11,12,14,15,16,17,18,19
1,2,3,4,5,6,7,8,9,11,12,14,15,16,17,18,19
21,2,4,5,6,7,8,9,12,13,14,15,17,18,19
1,2,3,4,5,6,7,8,9,10,11,12,13,14,15,16,17,18,19
1,2,4,5,6,7,8,9,12,13,14,15,17,18,19
I
31,2,3,4,5,6,7,8,9,11,12,13,14,15,18,19
1,3,4,5,6,7,8,9,10,11,12,14,15,16,17,19
1,3,4,5,6,7,8,9,11,12,14,15,19
41,2,3,4,5,6,7,8,9,11,12,13,14,15,16,18,19
1,2,3,4,5,6,7,8,9,10,11,12,13,15,16,17,19
1,2,3,4,5,6,7,8,9,11,12,13,15,16,19
51,2,3,4,5,6,7,8,9,10,11,12,13,14,15,17,18,19
1,2,3,4,5,6,7,8,9,10,11,12,14,15,16,17,18,19
1,2,3,4,5,6,7,8,9,10,11,12,14,15,17,18,19
61,2,3,4,5,6,7,8,9,11,12,13,14,15,17,18,19
1,2,3,4,5,6,7,8,9,10,11,12,13,14,15,16,17,18,19
1,2,3,4,5,6,7,8,9,11,12,13,14,15,17,18,19
I
71,2,3,4,5,6,7,8,9,10,11,12,13,14,15,16,17,18,19
1,2,3,4,5,6,7,8,9,10,11,12,14,15,16,17,18,19
1,2,3,4,5,6,7,8,9,10,11,12,14,15,16,17,18,19
81,2,3,4,5,6,7,8,9,10,11,12,13,14,15,16,17,18,19
1,2,3,4,5,6,7,8,10,11,12,13,14,15,16,17,18,19
1,2,3,4,5,6,7,8,10,11,12,13,14,15,16,17,18,19
91,2,3,4,5,6,7,9,11,12,13,14,15,17,18,19
1,2,3,4,5,6,7,8,9,10,11,12,13,15,16,17,19
1,2,3,4,5,6,7,9,11,12,13,15,16,17,19
101,2,3,4,5,6,7,8,9,10,12,13,14,15,16,17,18,19
5,7,8,10,11,17
5,7,8,10,17
111,2,3,4,5,6,7,8,9,10,11,12,13,14,15,16,17,18,19
1,3,4,5,6,7,8,9,11,12,14,15,16,17,19
1,3,4,5,6,7,8,9,11,12,14,15,16,17,19
121,2,3,4,5,6,7,8,9,11,12,13,14,15,16,17,19
1,2,3,4,5,6,7,8,9,10,11,12,13,14,15,16,17,18,19
1,2,3,4,5,6,7,8,9,11,12,13,14,15,16,17,19
I
132,4,6,8,9,12,13,15,16,19
1,2,3,4,5,6,7,8,9,10,11,12,13,14,15,16,17,18,19
2,4,6,8,9,12,13,15,16,19
I
141,2,3,5,6,7,8,11,12,13,14,15,16,17,18,19
1,2,3,4,5,6,7,8,9,10,11,12,14,16,17,18,19
1,2,3,5,6,7,8,11,12,14,16,17,18,19
151,2,3,4,5,6,7,8,9,11,12,13,15,16,18,19
1,2,3,4,5,6,7,8,9,10,11,12,13,14,15,16,17,18,19
1,2,3,4,5,6,7,8,9,11,12,13,15,16,18,19
I
161,2,3,4,5,6,7,8,9,11,12,13,14,15,16,17,18,19
1,4,7,8,9,10,11,12,13,14,15,16,18,19
1,4,7,8,9,11,12,13,14,15,16,18,19
171,2,3,4,5,6,7,8,9,10,11,12,13,14,15,17,18,19
1,2,5,6,7,8,9,10,11,12,14,16,17,18
1,2,5,6,7,8,9,10,11,12,14,17,18
181,2,5,6,7,8,12,13,14,15,16,17,18,19
1,2,3,4,5,6,7,8,9,10,11,14,15,16,17,18,19
1,2,5,6,7,8,14,15,16,17,18,19
191,2,3,4,5,6,7,8,9,11,12,13,14,15,16,18,19
1,2,3,4,5,6,7,8,9,10,11,12,13,14,15,16,17,18,19
1,2,3,4,5,6,7,8,9,11,12,13,14,15,16,18,19
I
VARVariable,LLevel
204 Inf Syst Front (2017) 19:197–212
a factor that has a driving power of 2 and dependence power of17 is positioned at a place with dependence power of 17 in theX-axis and driving power of 2 on the Y-axis. Based on itsposition, it can be defined as a dependent variable. Similarly,a factor having a driving power of 17 and a dependence powerof 2 can be positioned at dependence power of 2 at the X-axisand driving power of 17 on the Y-axis. Based on its position, itcan be defined as a driving variable. The objective behind theclassification for innovation through BOLD is to analyse thedriver power and dependency of the factors.
The first cluster includes autonomous factors that have weakdriver power and weak dependence. These factors are relativelydisconnected from the system. In the context of the currentresearch, none of the factors belong to this cluster. The secondcluster consists of the dependent variables that have weak driv-er power but strong dependence; acceptance is the only vari-able that belongs to this cluster. The third cluster has the linkagevariables that have strong driver power and dependence. Anyaction on these variables will have an effect on the others andalso a feedback effect on themselves. The majority of the
variables - resistance to change, value, access to data, aware-ness, security, privacy, human resource factors, organisationalfactors, data licensing, technical infrastructure, cost, risk, com-petitive advantage, external pressure, legal aspect, trust, andinnovation through BOLD - fall under this category. The fourthcluster includes drivers or independent variables with strongdriving power and weak dependence. Only one variable, name-ly data quality, falls under this category (see Fig. 1).
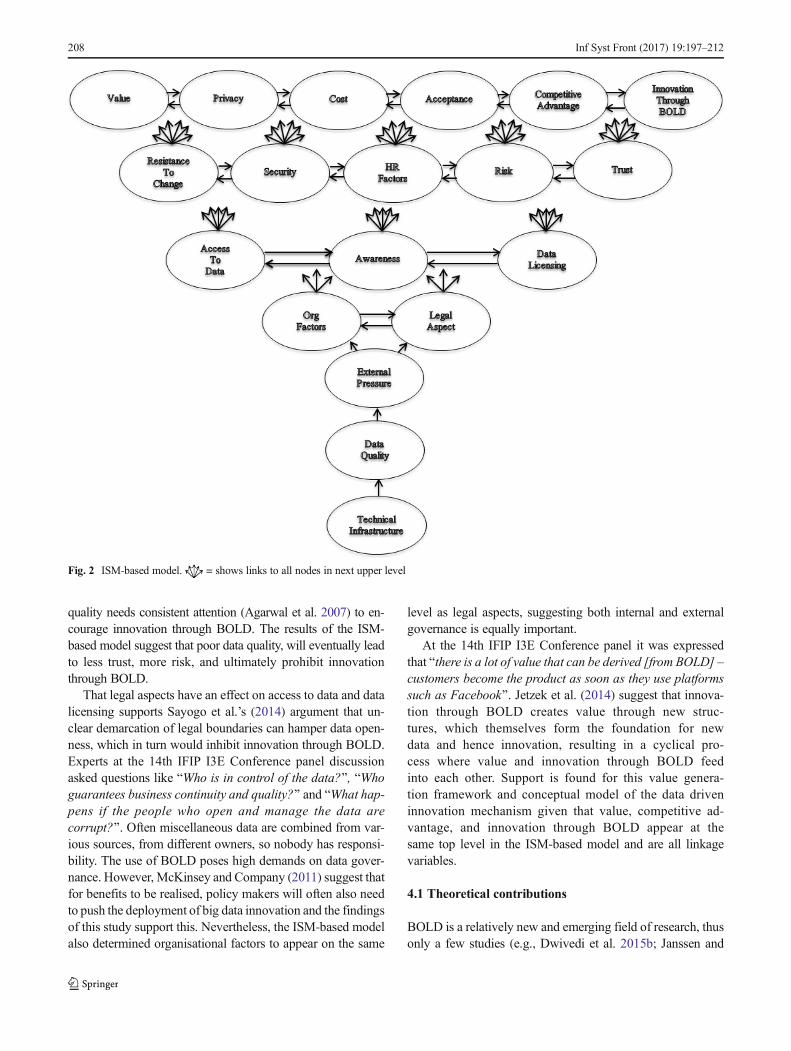
3.7 Formation of structural model
From the canonical form of the reachability matrix (seeTable 12), the structural model is generated by means of ver-tices and nodes and lines or edges. If there is a relationshipbetween the factors i and j responsible for innovation throughBOLD, this is shown by an arrow that points from i to j. Thisgraph is called directed graph or digraph. After removing theindirect links, the digraph is finally converted into an ISM-based model as shown in Fig. 2.
The different levels, and the variables at each level, areidentified using the level partitioning process of the ISMmethod. They indicate the degree of driving and dependencepower of a variable or set of variables and how they are linked
Table 6 Partition on reachability matrix: interaction II
VAR Reachability Set Antecedent Set Intersection Set L
1 1,3,4,5,7,8,9,11,14,16,17,18 1,3,4,5,7,8,9,10,11,14,16,17,18 1,3,4,5,7,8,9,11,14,16,17,18 II
3 1,3,4,5,7,8,9,11,14,18 1,3,4,5,7,8,9,10,11,14,16,17 1,3,4,5,7,8,9,11,14
4 1,3,4,5,7,8,9,11,14,16,18 1,3,4,5,7,8,9,10,11,16,17 1,3,4,5,7,8,9,11,16
5 1,3,4,5,7,8,9,10,11,14,17,18 1,3,4,5,7,8,9,10,11,14,16,17,18 1,3,4,5,7,8,9,10,11,14,17,18 II
7 1,3,4,5,7,8,9,10,11,14,16,17,18 1,3,4,5,7,8,9,10,11,14,16,17,18 1,3,4,5,7,8,9,10,11,14,16,17,18 II
8 1,3,4,5,7,8,9,10,11,14,16,17,18 1,3,4,5,7,8,10,11,14,16,17,18 1,3,4,5,7,8,10,11,14,16,17,18
9 1,3,4,5,7,9,11,14,17,18 1,3,4,5,7,8,9,10,11,16,17 1,3,4,5,7,9,11,16,17
10 1,3,4,5,7,8,9,10,14,16,17,18 5,7,8,10,11,17 5,7,8,10,17
11 1,3,4,5,7,8,9,10,11,14,16,17,18 1,3,4,5,7,8,9,11,14,16,17 1,3,4,5,7,8,9,11,14,16,17
14 1,3,5,7,8,11,14,16,17,18 1,3,4,5,7,8,9,10,11,14,16,17,18 1,3,5,7,8,11,14,16,17,18 II
16 1,3,4,5,7,8,9,11,14,16,17,18 1,4,7,8,9,10,11,14,16,18 1,4,7,8,9,11,14,16,18
17 1,3,4,5,7,8,9,10,11,14,17,18 1,5,7,8,9,10,11,14,16,17,18 1,5,7,8,9,10,11,14,17,18
18 1,5,7,8,14,16,17,18 1,3,4,5,7,8,9,10,11,14,16,17,18 1,5,7,8,14,16,17,18 II
VARVariable, L Level
Table 7 Partition on reachability matrix: interaction III
VAR Reachability Set Antecedent Set Intersection Set L
3 3,4,8,9,11 3,4,8,9,10,11,16,17 3,4,8,9,11 III
4 3,4,8,9,11,16 3,4,8,9,10,11,16,17 3,4,8,9,11,16 III
8 3,4,8,9,10,11,16,17 3,4,8,10,11,16,17 3,4,8,10,11,16,17
9 3,4,9,11,17 3,4,8,9,10,11,16,17 3,4,9,11,16,17 III
10 3,4,8,9,10,16,17 8,10,11,17 8,10,17
11 3,4,8,9,10,11,16,17 3,4,8,9,11,16,17 3,4,8,9,11,16,17
16 3,4,8,9,11,16,17 4,8,9,10,11,16 4,8,9,11,16
17 3,4,8,9,10,11,17 8,9,10,11,16,17 8,9,10,11,17
VARVariable, L Level
Table 8 Partition on reachability matrix: interaction IV
VAR Reachability Set Antecedent Set Intersection Set L
8 8,10,11,16,17 8,10,11,16,17 8,10,11,16,17 IV
10 8,10,16,17 8,10,11,17 8,10,17
11 8,10,11,16,17 8,11,16,17 8,11,16,17
16 8,11,16,17 8,10,11,16 8,11,16
17 8,10,11,17 8,10,11,16,17 8,10,11,17 IV
VARVariable, L Level
Inf Syst Front (2017) 19:197–212 205
up to each other at the same level and with the variables of thenext upper level.
The ISM-based model developed in this research depictsthat technical infrastructure (such as processing power, legacysystems, software access, high storage capability, scalabilityand performance, and fragmentation) is the most fundamentalvariable for innovation using BOLD as it comes at the base ofthe ISM hierarchy (i.e., Level VII) (see Agarwal et al. 2007).Technical infrastructure facilitates data quality, which furtherhelps in building external pressure to address and maintain it.Collectively, technical infrastructure, data quality, and exter-nal pressure provide the basis for innovation through BOLD.Moreover, they are also closely linked to each other. Theselower level factors lead to shaping the organisational factors(including culture, strategy, structure, governance, competen-cy, ambitions, vision etc.) and legal aspect (see level IV).
The improvement in middle level variables helps toachieve next-level variables (Agarwal et al. 2007).Therefore, improvement in organisational factors and legalaspects lead to better access to data, superior awareness (in-cluding awareness of data, the platform where it is published,and potential of innovation), and data licensing. These factorsat Level III directly influence resistance to change, security,HR factors (such as leadership, management competency, lackof knowledge, capacity building, and asymmetry of informa-tion), risk, and trust (including trust of technology, data, pro-cesses, and innovation) at the next higher level (i.e., Level II).For example, open access to data can raise questions regardingdata security, especially in relation to sensitive data, and canalso raise concerns about the trust of data, so leading to higherrisk for using and implementing it further.
The top level variables demonstrate strong dependence onother variables (Agarwal et al. 2007). In the present context,the variables value, privacy, cost, acceptance, competitiveadvantage and innovation through BOLD which are at thetop level (i.e., Level I) show strong dependence power. Thevariables at Level II influence the topmost hierarchy (i.e.,Level I) of the ISM model. For example, aspects related tosecurity can better serve the privacy of BOLD. Similarly, therelationship between risk and innovation through BOLD indi-cates that higher the risk involved with access and use ofBOLD, weaker will be the innovation using such data whereashigher trust, on the contrary, can strengthen innovationthrough BOLD.
4 Discussion
BOLD opens a world of possibilities for innovation but creat-ing innovations with BOLD is a complex process. The ISMmethod has uncovered the relationships between the numer-ous variables identified during the brainstorming session at the14th IFIP I3E Conference as being associated with innovationthrough BOLD. The findings are now discussed in the contextof existing literature as well as discussions undertaken byexperts at the 14th IFIP I3E Conference panel, and theoreticalcontributions and practical implications are explored.
Almost all variables were determined to have both strongdriving and dependence powers, determining them as ‘link-age’ variables. Linkage variables can be considered relativelyunstable (Singh et al. 2007; Talib et al. 2011). Therefore, in thecontext of innovation through BOLD, any action on almost allthe variables will have an effect on the others as well as feed-back on themselves. An explanation for this is that BOLD is inits infancy and governments and companies are still strugglingwith how to make sense of it. There is not one proven or bestinfrastructure, and data quality is often unclear and needs to beinvestigated. The hype might result in pressure, but the capa-bilities to take advantage of this and to create acceptable andfeasible innovations that are not conflicting with legislationare lacking. Therefore, knowledge about all aspects presentedin the ISM-based model is necessary to drive innovation.
Finding that technical infrastructure comes at the base ofthe ISM hierarchy is in accordance with much of the existingresearch regarding BOLD. Insufficient technical capabilitiesand lack of adequate technical infrastructure create a majorimpediment for data creation as well as data sharing (Sayogoet al. 2014; Shadbolt et al. 2012). One of the experts at the14th IFIP I3E Conference panel commented that Ball too oftendatasets are not linked and there is a need for tools to derivelinks between datasets^. Without the technical infrastructure,BOLD will not be able to be found, processed and analysed(Zuiderwijk et al. 2015) – an obvious requirement for innova-tion through BOLD.Table 9 Partition on reachability matrix: interaction V
VAR Reachability Set Antecedent Set Intersection Set L
10 10,16 10,11 10
11 10,11,16 11,16 11,16
16 11,16 10,11,16 11,16 V
VARVariable, L Level
Table 10 Partition on reachability matrix: interaction VI
VAR Reachability Set Antecedent Set Intersection Set L
10 10 10,11 10 VI
11 10,11 11 11
VARVariable, L Level
Table 11 Partition on reachability matrix: interaction VII
VAR Reachability Set Antecedent Set Intersection Set L
11 11 11 11 VII
VARVariable, L Level
206 Inf Syst Front (2017) 19:197–212

Park et al. (2012) argue that business intelligence systemsare of limited value when they deal with inaccurate and
unreliable data, which are common characteristics of self-reported data. As the only ‘driver’ according to Fig. 1, data
Table 12 Canonical form of final reachability matrix
VAR 2 6 12 13 15 19 1 5 7 14 18 3 4 9 8 17 16 10 11 L
2 1 1 1 1 1 1 1 1 1 1 1 0 1 1 1 1 0 0 0 I
6 1 1 1 1 1 1 1 1 1 1 1 1 1 1 1 1 0 0 1 I
12 1 1 1 1 1 1 1 1 1 1 0 1 1 1 1 1 1 0 1 I
13 1 1 1 1 1 1 0 0 0 0 0 0 1 1 1 0 1 0 0 I
15 1 1 1 1 1 1 1 1 1 0 1 1 1 1 1 0 1 0 1 I
19 1 1 1 1 1 1 1 1 1 1 1 1 1 1 1 0 1 0 1 I
1 1 1 1 1 1 1 1 1 1 1 1 1 1 1 1 1 1 0 1 II
5 1 1 1 1 1 1 1 1 1 1 1 1 1 1 1 1 0 1 1 II
7 1 1 1 1 1 1 1 1 1 1 1 1 1 1 1 1 1 1 1 II
14 1 1 1 1 1 1 1 1 1 1 1 1 0 0 1 1 1 0 1 II
18 1 1 1 1 1 1 1 1 1 1 1 0 0 0 1 1 1 0 0 II
3 1 1 1 1 1 1 1 1 1 1 1 1 1 1 1 0 0 0 1 III
4 1 1 1 1 1 1 1 1 1 1 1 1 1 1 1 0 1 0 1 III
9 1 1 1 1 1 1 1 1 1 1 1 1 1 1 0 1 1 0 1 III
8 1 1 1 1 1 1 1 1 1 1 1 1 1 1 1 1 1 1 1 IV
17 1 1 1 1 1 1 1 1 1 1 1 1 1 1 1 1 0 1 1 IV
16 1 1 1 1 1 1 1 1 1 1 1 1 1 1 1 1 1 0 1 V
10 1 1 1 1 1 1 1 1 1 1 1 1 1 1 1 1 1 1 0 VI
11 1 1 1 1 1 1 1 1 1 1 1 1 1 1 1 1 1 1 1 VII
L I I I I I I II II II II II III III III IV IV V VI VII
VARVariable, L Level
Fig. 1 Driving power and dependence diagram
Inf Syst Front (2017) 19:197–212 207
quality needs consistent attention (Agarwal et al. 2007) to en-courage innovation through BOLD. The results of the ISM-based model suggest that poor data quality, will eventually leadto less trust, more risk, and ultimately prohibit innovationthrough BOLD.
That legal aspects have an effect on access to data and datalicensing supports Sayogo et al.’s (2014) argument that un-clear demarcation of legal boundaries can hamper data open-ness, which in turn would inhibit innovation through BOLD.Experts at the 14th IFIP I3E Conference panel discussionasked questions like BWho is in control of the data?^, BWhoguarantees business continuity and quality?^ and BWhat hap-pens if the people who open and manage the data arecorrupt?^. Often miscellaneous data are combined from var-ious sources, from different owners, so nobody has responsi-bility. The use of BOLD poses high demands on data gover-nance. However, McKinsey and Company (2011) suggest thatfor benefits to be realised, policy makers will often also needto push the deployment of big data innovation and the findingsof this study support this. Nevertheless, the ISM-based modelalso determined organisational factors to appear on the same
level as legal aspects, suggesting both internal and externalgovernance is equally important.
At the 14th IFIP I3E Conference panel it was expressedthat Bthere is a lot of value that can be derived [from BOLD] –customers become the product as soon as they use platformssuch as Facebook^. Jetzek et al. (2014) suggest that innova-tion through BOLD creates value through new struc-tures, which themselves form the foundation for newdata and hence innovation, resulting in a cyclical pro-cess where value and innovation through BOLD feedinto each other. Support is found for this value genera-tion framework and conceptual model of the data driveninnovation mechanism given that value, competitive ad-vantage, and innovation through BOLD appear at thesame top level in the ISM-based model and are all linkagevariables.
4.1 Theoretical contributions
BOLD is a relatively new and emerging field of research, thusonly a few studies (e.g., Dwivedi et al. 2015b; Janssen and
Fig. 2 ISM-based model. = shows links to all nodes in next upper level
208 Inf Syst Front (2017) 19:197–212
Kuk 2016; Janssen et al. 2015) have been published in thisarea. As far as the authors are aware, there has not been anyprevious attempt to identify factors driving innovationthrough BOLD. Therefore, this is the first study in the fieldthat identifies and links nineteen factors related to innovationthrough BOLD. The formal development of these links andfurther predictive causal links between factors as identified inthis research can be considered as a significant contribution inthis area.
A further key theoretical contribution is in the methodadopted, being the first study to utilise ISM to determine thelinks between constructs steering innovation through BOLDand assess how these links are represented in the perspectiveof their driving and dependence power in relation to the otherfactors. The hierarchy or level of constructs presented in theISM-based model indicates the relative importance of differ-ent variables as drivers, relatively dependent constructs orconstructs somewhere in the middle across the levels. TheISM-based model also provides the correlations between theconstructs presented at the upper four levels. The interdepen-dency of these constructs at the same level indicates howclosely they are related to each other and so will allow re-searchers to select these constructs for further framework de-velopment and validation.
4.2 Practical implications
The proposed ISM-based model for identification and rankingof factors influencing innovation through BOLD pro-vides a framework for practitioners and policy makersto help encourage and manage innovation through BOLD.The utility of the ISM method lies in imposing order anddirection on the complexity of relationships amongthese factors, which will help decision-makers to betterutilise their available resources for maximising innovationthrough BOLD.
The driver-dependence matrix (Fig. 1) indicates that thereis no construct falling in the autonomous cluster. The con-structs under this cluster are the weak drivers and weak de-pendents and hence they do not have much influence. Theabsence of any autonomous factors in this study indicates thatpolicy makers and practitioners should pay attention to allfactors identified as being related to innovation throughBOLD. As acceptance is a factor with weak driving powerand relatively high dependence power, practitionersshould give high priority to understanding the accep-tance of innovations and using BOLD. All other factorsexcept acceptance and data quality fall under the link-age cluster, making them unstable as any action onthese factors will have an impact on the others and alsofeedback on themselves (Talib et al. 2011). This reiterates theimportance for practitioners to ensure their attention is sharedacross all variables identified.
5 Conclusion
In order to attend to the current gap in the literature the keyobjective of the present study was to develop a hierarchy offactors influencing innovation through BOLD. The variety ofdata sources, the different interests of stakeholders, and un-known outcomes make it a challenge to drive innovationthrough BOLD. From a panel of experts, 19 variables relevantto innovation through BOLD were identified including resis-tance to change, value, access to data, awareness, security,privacy, human resource factors, organisational factors, datalicensing, data quality, technology infrastructure, cost, accep-tance, risk, competitive advantage, external pressure, legalaspect, trust, and innovation through BOLD itself. UtilisingISM, the categorisation of factors was achieved and relation-ships between the variables were established. The findingsindicate that technical infrastructure, data quality, and externalpressure form the foundations for innovation through BOLD.The placing of value, competitive advantage, and innovationthrough BOLD at the same top level in the ISM-based modelreinforces the utility of innovation through BOLD and thusthe importance of this research. However, the high dependen-cies and linkages among variables show that for many com-ponents there are uncertainties about how to do this as there isno standard infrastructure for BOLD that can be used to fosterinnovation. Despite this, organizations need to be able to dealwith all aspects of the ISM-based model to create innovationthrough BOLD; it is likely that only a few organizations areable to deal with all these aspects. This suggests that moreproven practices are necessary before innovation throughBOLD can fly.
5.1 Future lines of research
Despite the significant contributions of this research, like allstudies it is not without limitations. Although experts wereconsulted to generate factors relevant to innovation throughBOLD there are likely to be other relevant factors, which couldbe explored in future research. Similarly, it would be useful forfuture research to conceptually develop the factors further usingboth inductive and deductive methods before the model is sta-tistically tested and validated using structural equation model-ling. As identified in the literature review, some research isemerging regarding the overcoming of challenges such as tech-nological capability, management of heterogeneous data, andquality assessment. Further research should be conducted oneach component of the ISM-based model in order to assess thepolicy and practical implications for each.
Aside from the future research directions resulting from thelimitations of the study, the novelty of BOLD presents a wide-range of further lines of research. BOLD innovation might beconceptualized as a complex adaptive system (CAS). CAScan generally be defined as a system that emerges over time
Inf Syst Front (2017) 19:197–212 209

into a coherent form, and adapts and organizes itself withoutany singular entity deliberately managing or controlling it(Holland 1996). Innovation through BOLD is a complex pro-cess in which many organizations might interact with eachother. Therefore, social interaction among actors and the useof technology are both key aspects. Users may change overtime and innovations will be shaped and reshaped based oninput from different actors. The use of BOLD is a typicalsituation in which various stakeholders have different objec-tives; some might prefer transparency whereas others maywant to keep data private as a strategic asset. Different scenar-ios or use contexts might focus on one type of actor or sector, arange of innovation trajectories including deductive and in-ductive, and/or different needs and objectives. Therefore, fur-ther research is required to delineate how different ac-tors can successfully interact to achieve innovation throughBOLD as a CAS.
Whereas literature has mainly focussed on the role thattechnology can play in facilitating humans in processes ofinnovation, there is a rise in innovative practices and productsthat are shaped by technology. As computational power, net-works and algorithms are growing in terms of speed andstrength BOLD can be ordered, reordered and analysed bynon-human intelligent systems. Industry-wide there has beena rise of predictive algorithms that can automatically detectnew business opportunities and can help assess if businessconcepts or start-ups will succeed or fail. As humans increas-ingly have to deal with non-human actors in the form of intel-ligent BOLD systems more research is needed to understandthis relationship in general, but more specifically it is neces-sary to understand the role of artificial intelligent systems inthe process of innovation through BOLD.
From a data-management perspective, successful BOLDinnovation raises several challenges including: finding anddealing with large data sets; integrating datasets that werenot originally intended to be integrated; restructuring datasetsto fit a common vocabulary; and building usable data man-agement interfaces for users of various levels of expertise.Future research is required to uncover the effective datamodels and existing formalisms to handle the integration ofdata and transformations. Moreover, these systems should beable to deal with both structured and unstructured data. Moreresearch is needed to develop new tools for big data analytics,as existing statistical tools may not facilitate the analysis oflarge volumes of unstructured data. The concept of ‘deeplearning’ is relevant here where intelligent algorithms capableof recognizing items of interest in large quantities of unstruc-tured and binary data, and deducing relationships withoutneeding specific models or programming instructions, needto be developed. More attention is also required to developeffective user interfaces that enable non-experts who do nothave deep data-management experience to find, integrate,transform, and visualise data in meaningful ways.
Related to data-management, another area that requires fur-ther work in the use of BOLD is ethics, where tools as well aspolicies and guidelines are needed that are capable of ensuringthe privacy and security of data. In this respect, more researchis needed into anonymization of organisations and individualsduring use and re-use while at the same time ensuring thattransparency and accountability is maintained. For this pur-pose, regulatory frameworks are evolving and need to be de-veloped further to help define how to collect, manage andinterpret data for scientific and practical purposes.
More research is needed to identify and define the businesscase and conditions for small and medium size enterprises tocome up with innovative real time systems that are capable ofextracting, indexing and linking data across multiple datasources, such as internal systems, data warehouses, sensors,and social media streams, as well as user generated locationbased data from mobile devices. A key area that is yet unclearin the BOLD debate is the value proposition that it offers thirdparty organisations and entrepreneurs who the public sector relyon for developing applications that can exploit their open data.Moreover, several questions, including, who will be the ultimateend users of public sector open data, who will pay for the use ofthe analytical tools and solutions that can make sense of theopen data, and how useful is the public sector open data forend users, still remain to be answered empirically. Indeed,answers to these questions will form the basis for defining asustainable business model in which conditions for exploitingBOLD can be set out in a public sector context for all stake-holders, including the business community and citizens.
Innovation generally requires, on the one hand, diversity ofcontexts, actors and evidence, and, on the other, interactionbetween these through various forms of experimentation. Thiscan take place deductively in a designed and top-down man-ner directed by a particular need or objective, or more induc-tively, open-ended, bottom-up and emergent (as in CAS).Although the former is more common as innovation with orfor a purpose, the latter can alsomake important contributions.Developing more proven practices of BOLD needs more re-search into the array of specific roles it can play in these twocontexts to drive or support innovation, for example by devel-oping real life scenarios which recognise that the context,purpose and perceived benefits of use are highly important.In turn, this will likely rest on the recognition that non-BOLDevidence and inputs are both unavoidable and necessary -BOLD is unlikely to achieve high impact or meaningful inno-vations on its own.
Open Access This article is distributed under the terms of the CreativeCommons At t r ibut ion 4 .0 In te rna t ional License (h t tp : / /creativecommons.org/licenses/by/4.0/), which permits unrestricted use,distribution, and reproduction in any medium, provided you give appro-priate credit to the original author(s) and the source, provide a link to theCreative Commons license, and indicate if changes were made.
210 Inf Syst Front (2017) 19:197–212
References
Agarwal, A., Shankar, R., & Tiwari, M. K. (2007). Modeling agility ofsupply chain. Industrial Marketing Management, 36(4), 443–457.
Attri, R., Dev, N., & Sharma, V. (2013). Interpretive structural modelling(ISM) approach: An overview. Research Journal of ManagementScience., 2(2), 3–8.
Behkamal, B., Kahani, M., Bagheri, E., & Jeremic, Z. (2014). A metrics-driven approach for quality assessment of linked open data. Journalof Theoretical and Applied Electronic Commerce Research., 9(2),64–79.
Chen, H., Chiang, R. & Storey, V. (2012). Business intelligenceand analytics: from big data to big impact. MIS Quarterly 36(4),1165–1188.
Dwivedi, Y. K., Wastell, D., Laumer, S., Henriksen, H. Z., Myers, M. D.,Bunker, D., Elbanna, A., Ravishankar, M. N., & Srivastava, S. C.(2015a). ‘research on information systems failures and successes:status update and future directions’. Information SystemsFrontiers, 17(1), 143–157.
Dwivedi, Y., Weerakkody, V., Janssen, M., Millard, J., Hidders, J.,Snijders, D., Rana, N. & Slade, E. (2015b). Driving innovationusing big open linked data (BOLD) panel. Proceedings of the 14thIFIP WG 6.11 Conference on e-Business, e-Services, and e-Society.13–15 October, Delft, The Netherlands.
Ferro, E., Loukis, E., Charalabidis, Y., & Osella, M. (2013). Policy mak-ing 2.0: From theory to practice. Government InformationQuarterly, 30(4), 359–368.
Gandomi, A., & Haider, M. (2015). Beyond the hype: Big data concepts,methods, and analytics. International Journal of InformationManagement, 35(2), 137–144.
Hauser, J., Tellis, G., & Griffin, A. (2006). Research on innovation: Areview and agenda for Marketing Science. Marketing Science,25(6), 687–717.
Holland, J. H. (1996). Hidden order. How adaptation creates complexity.Reading, MA: Addison Wesley.
Hossain, M. A., Dwivedi, Y. K., & Rana, N. P. (2016). State of the art inopen data research: insights from existing literature and a researchagenda. Journal of Organizational Computing and ElectronicCommerce, 26(1–2), 14–40.
Hota, C., Upadhyaya, S., & Al-Karaki, J. N. (2015). Advances in secureknowledge management in the big data era. Information SystemsFrontiers, 17(5), 983–986.
Hughes, D. L., Dwivedi, Y. K., Simintiras, A. C., & Rana, N. P. (2015).Success and failure of IS/IT projects: A state of the art analysis andfuture directions. Springer Briefs in Information Systems, SpringerInternational Publishing, available at: http://link.springer.com/book/10.1007%2F978-3-319-23000-9.
Janssen, M. & Kuk, G. (2016). Big and open linked data (BOLD) inresearch, policy and practice. Journal of OrganizationalComputing and Electronic Commerce. 26(1–2), 3–13.
Janssen, M., Matheus, R. & Zuiderwijk, A. (2015). Big and open linkeddata (BOLD) to create smart cities and citizens: Insights from smartenergy and mobility cases. Proceedings of the 14th IFIP WG 8.5International Conference on EGOV. 30 August-2 September,Thessaloniki, Greece.
Janssen, M., Charalabidis, Y., & Zuiderwijk, A. (2012). Benefits, adop-tion barriers and myths of open data and open government.Information Systems Management, 29(4), 258–268.
Jetzek, T., Avital, M., & Bjorn-Andersen, N. (2014). Data-driven inno-vation through open government data. Journal of Theoretical andApplied Electronic Commerce Research., 9(2), 100–120.
Jharkharia, S., & Shankar, R. (2005). IT-enablement of supply chains:understanding the barriers. Journal of Enterprise InformationManagement, 18(1), 11–27.
Juell-Skielse, G., Hjalmarsson, A., Juell-Skielse, E., Johannesson, P., &Rudmark, D. (2014). Contests as innovation intermediaries in opendata markets. Information Polity, 19(3, 4), 247–262
Kankanhalli, A., Hahn, J., Tan, S., & Gao, G. (2016). Big data andanalytics in healthcare: introduction to the special section.Information Systems Frontiers 18(2), 233–235.
Lassinantti, J., Bergvall-Kåreborn, B., & Ståhlbröst, A. (2014). Shapinglocal open data initiatives: Politics and implications. Journal ofTheoretical and Applied Electronic Commerce Research., 9(2),17–33.
Mandal, A., & Deshmukh, S. G. (1994). Vendor selection using interpre-tive structural modelling (ISM). International Journal of Operations& Production Management, 14(6), 52–59.
McKinsey & Company (2011). Big Data: The Next Frontier forInnovation, Competition and Productivity. Accessed from file:///C:/users/Emma%20Slade/Downloads/MGI_big_ data_full_report.pdf.Accessed on 8 November 2015.
Nugroho, R. P., Zuiderwijk, A., Janssen, M., & de Jong, M. (2015). Acomparison of national open data policies: lessons learned.Transforming Government: People, Process and Policy,9(3), 286–308.
Open Government Partnership (2014). Annual Report Accessedfrom http://www.opengovpartnership.org/sites/default/files/attachments/2014%20OGP%20Annual%20Report.pdf. Accessedon 8 November 2015.
Park, S.-H., Huh, S.-Y., Oh, W., & Han, S. (2012). A social network-based inference model for validating customer profile data. MISQuarterly, 36(4), 1217–1237.
Sage, A. P. (1977). Interpretive structural modelling: Methodology forLarge Scale Systems. New York. New York: McGraw-Hill.
Sayogo, D., Zhang, J., Pardo, T., Tayi, G., & Hrdinova, J. (2014). Goingbeyond open data: Challenges and motivations for smart disclosurein ethical consumption. Journal of Theoretical and AppliedElectronic Commerce Research., 9(2), 1–16.
Shadbolt, N., O’Hara, K., Berners-Lee, T., Gibbins, N., Glaser, H., Hall,W. & Schraefel, M. (2012). Linked open government data: lessonsfrom Data.gov.uk. IEEE Intelligent Systems 27(3), 16–24.
Singh, R. K., Garg, S. K., & Deshmukh, S. G. (2007). Interpretive struc-tural modelling of factors for improving competitiveness of SMEs.International Journal of Productivity and Quality Management.,2(4), 423–440.
Susha, I., Grönlund, Å., & Janssen, M. (2015). Organizational measuresto stimulate user engagement with open data. TransformingGovernment: People, Process and Policy, 9(2), 181–206.
Talib, F., Rahman, Z., & Qureshi, M. N. (2011). An interpretive structuralmodelling approach for modelling the practices of total quality man-agement in service sector. International Journal of Modelling inOperations Management, 1(3), 223–250.
Van der Panne, G., Van Beers, C. & Kleinknecht, A. (2003). Success andfailure of innovation: a literature review. International Journal ofInnovation Management 7(3), 1–30.
Warfield, J. N. (1974). Toward interpretation of complex structuralmodels. IEEE Transactions on Systems, Man, and Cybernetics,4(5), 405–417.
Zuiderwijk, A., Janssen, M. & Dwivedi, Y. (2015). Acceptance and usepredictors of open data technologies: drawing upon the unified the-ory of acceptance and use of technology. Government InformationQuarterly Doi:10.1016/j.giq.2015.09.005.
Zuiderwijk, A. & Janssen, M. (2014). The negative effects of opengovernment data – Investiating the dark side of open data.Proceedings of the 15th Annual International Conference onDigital Government Research. 18–21 June, AguascalientesCity, Mexico.
Zuiderwijk, A., Helbig, N., Gil-García, R. & Janssen, M. (2014). Specialissue on innovation through open data –A review of the state-of-the-art and an emerging research agenda: Guest editors’ introduction.
Inf Syst Front (2017) 19:197–212 211

Journal of Theoretical and Applied Electronic Commerce Research.9(2), I-XIII
Yogesh K. Dwivedi is a Professor of Digital and Social Media andDirector of Research in the School of Management at SwanseaUniversity, Wales, UK. His research interests are in the area ofInformation Systems (IS) including the adoption and diffusion of emerg-ing ICTs and digital and social media marketing. He has published morethan 200 articles in a range of leading academic journals and conferences.He has co-edited more than 15 books on technology adoption, e-government and IS theory and had them published by international pub-lishers such as Springer, Routledge, and Emerald. He acted as co-editor offifteen special issues; organised tracks, mini-tracks and panels in leadingconferences; and served as programme co-chair of IFIP WG 8.6Conference. He is Associate Editor of European Journal of Marketingand Government Information Quarterly, Assistant Editor of JEIM andSenior Editor of Journal of Electronic Commerce Research.
Marijn Janssen is a full Professor in ICT &Governance and chair of theInformation and Communication Technology section of the Technology,Policy and Management Faculty of Delft University of Technology. Hisresearch interests are in the field of orchestration, (shared) services, openand big data and infrastructures. He is Co-Editor-in-Chief of GovernmentInformation Quarterly, conference chair of IFIP EGOV2016 and ischairing mini-tracks at the DG.o, ICEGOV, HICCS and AMCIS confer-ences. He was ranked as one of the leading e-government researchers in asurvey in 2009 and 2014 and has published over 350 refereed publica-tions. More information: www.tbm.tudelft.nl/marijnj.
Dr Emma L. Slade is Deputy Director of Postgraduate Research in theSchool of Management, Swansea University, UK. She has a PhD andMSc with Distinction in Business Management. Emma is working on avariety of research topics across marketing and information systems, in-cluding citizen engagement with political parties on social media, adop-tion of mobile payment systems, effect of cyber-slacking on studentengagement, and diffusion of green IT/IS. Emma has publishedarticles in a number of highly regarded journals includingComputers and Human Behaviour, Psychology & Marketing,Journal of Strategic Marketing, and Journal of Computer Informationsystems.
Nripendra P Rana is an Associate Professor in the School ofManagement at Swansea University, UK. With an academic and profes-sional background in Mathematics and Computer Science andwith PhD in Information Systems, his current research interestsfocus primarily upon adoption of emerging and cutting edge tech-nology in general and e-government, m-government, e-commerceand m-commerce systems in particular. His work has been publishedin leading academic journals including European Journal of Marketing,Information Systems Frontiers, Government Information Quarterly and
Computers in Human Behavior. He has also presented his research ininternational conferences such as ECIS, PACIS, AMC, IFIP EGOV,IFIP WG 8.6 and UKAIS.
Vishanth Weerakkody is a Professor of Digital Governance at theBusiness School in Brunel University London. Prior to his academiccareer, Vishanth worked in a number of multinational organisations inthe area of software engineering and business systems design. His re-search expertise lies in the area of electronic service delivery, technologyadoption, diffusion, evaluation and policy modelling in the public sectorcontext. He has published over 150 peer reviewed articles and guest-edited special issues of leading journals and books on these themes. Heis currently involved in several R&D projects funded by the EuropeanCommission and other internationally bodies encompassing topics suchas citizens’ participation in public sector policy making to social innova-tion and life-long-learning. He is the Editor in chief of the InternationalJournal of Electronic Government Research.
JeremyMillard Senior Research Fellow at Brunel University (London),works with governments, development agencies, and private and civilsectors in all parts of the world. In the last twenty years he has focusedon how new technical and organisational innovations transform govern-ment and the public sector, including the role of big data. Recent assign-ments for the European Commission include studies on administrativeburden reduction and business models for ICT and ageing. Jeremy alsoworks for the UN on eGovernment and meeting the 2030 sustainabledevelopment agenda through innovative service delivery, good gover-nance and big data.
Jan. Hidders is associate professor in data management in the WebInformation Systems Engineering group of the Computer ScienceDepartment at Vrije Universiteit Brussel. His research interests includedata integration, data indexing, data linking and large scale data process-ing, particularly in the domain of graph processing. He has published inconferences such as ICDE, CCGRID, ICDT, CIKM, IUI, FoIKS, ICWEand ISWC, and in journals such as Information Systems, FundamentaInformaticae, Theory of Computing Systems and Journal of Computerand System Sciences. He has organised several workshops on big dataprocessing such as SWEET and BeyondMR, and the EDBT SummerSchool on Graph Data Management.
Dr. Dhoya Snijders works for STT, the Dutch Study Center forTechnology Trends, and is currently carrying out a technology foresightstudy on big data. He holds an MA in Philosophy from the University ofAmsterdam, an MSc in Public InformationManagement from the ErasmusUniversity Rotterdam and a PhD in Organizational Sciences from the VUUniversity. He worked as a consultant for some years in the field of e-Government and carried out national and international projects on ICTgovernance, Open Data, and Big Data. During this time he published onthe implementation of ICT in a context of multilevel governance.
212 Inf Syst Front (2017) 19:197–212