Driving E-Commerce Logistics Forward 17-Mar-TF_Driving... · NUS and contributors own the...
44
TLI – ASIA PACIFIC WHITE PAPERS SERIES Driving E-Commerce Logistics Forward Volume 17-Mar-TF
Transcript of Driving E-Commerce Logistics Forward 17-Mar-TF_Driving... · NUS and contributors own the...

TLI – ASIA PACIFIC WHITE PAPERS SERIES
Driving E-Commerce Logistics
Forward
Volume 17-Mar-TF

Disclaimer, Limitation of Liability and Terms of Use
NUS and contributors own the information contained in this report, we are licensed by the contributors to reproduce the
information or we are authorised to reproduce it.
Please note that you are not authorised to distribute, copy, reproduce or display this report, any other pages within this report
or any section thereof, in any form or manner, for commercial gain or otherwise, and you may only use the information for
your own internal purposes. You are forbidden from collecting information from this report and incorporating it into your own
database, products or documents. If you undertake any of these prohibited activities we put you on notice that you are
breaching our and our licensors' intellectual property rights in the report and we reserve the right to take action against you to
uphold our rights, which may involve pursuing injunctive proceedings.
The information contained in this report has been compiled from sources believed to be reliable but no warranty, expressed
or implied, is given that the information is complete or accurate nor that it is fit for a particular purpose. All such warranties
are expressly disclaimed and excluded.
To the full extent permissible by law, NUS shall have no liability for any damage or loss (including, without limitation, financial
loss, loss of profits, loss of business or any indirect or consequential loss), however it arises, resulting from the use of or
inability to use this report or any material appearing on it or from any action or decision taken or not taken as a result of using
the report or any such material.

Presented at:
Temasek Foundation International – National University of Singapore
Urban Transportation Management Programme in Indonesia
Driving E-Commerce Logistics Forward
Leaders’ Workshop
15 March 2017 | Jakarta

This report is an abridged version of
E-Commerce Trends and Challenges: A Logistics and Supply Chain Perspective
(Volume 16-Nov-TI)

EXECUTIVE SUMMARY
A new wave of e-commerce is upon us and lessons have
been learnt, particularly in logistical support. A myriad of
new business models in customer engagement and in
addressing gaps in the traditional demand chain abound.
However, in our view it's not just about novel business
models that may wow us now, the real crux of the matter
is about fulfilment matched to the needs of each unique
environment it has to serve.
In many of the evident models the focus is on introducing
new intermediaries and removing precious time from the
ecosystem. Such may, however, rebound and increase true
business costs for other partners or within the whole
supply chain. It must be about concurrently removing time
and costs, or put another way, about increasing
responsiveness and efficiency not only in the demand
chain but also at each leg of fulfilment.
The most persistent models are those that trade-off
effectively between time and cost and at the same time,
work within determined service level windows - what we
address as delivery postponement. Engaging the customer
at every stage of the supply chain and not just the (final)
consumer at the end of the chain lends itself to greater
sustainability. Similarly, end-to-end fulfilment
synchronization designed to respond to a drum beat lends
itself to lean(er) logistics and hence, the optimum use of
the factors of logistics - land, labour and capital utilization.
Without such upstream integration the validity and
lifespan of any business model may be severely tested.
Control and the mix of appropriate factors vary by country
and sector as rents for the latter may differ quite
significantly. Externalities, matter too as any impact on the
public and environment may promote or hinder adoption
of a new model. Sub factors such as infrastructure, access,
skills, market and technology readiness compound the
landscape. The complexity these contribute may create
leaderlessness (anarchy) through to self-governing
(autonomous) up to highly regulated supply chains or
utilization of asset categories within these factors. Worse
still cross border logistics may counter the value added as
one traverses the supply chain to market. This means a
uniform global (macro) supply chain strategy not tailored
to regional (meso) or local (micro) customs may erode
comparative and competitive advantage when one leaves
the home market. Cases abound of short-lived innovation
as the market itself evolves.
The higher the population density, the greater the
potential for market penetration, or so it may seem. Some
cities provide vertical as well as horizontal spatial delivery
challenges. Industry fragmentation and simply perceived
translation of offline to online models may result in poorly
coordinated resources without a proper governing or
mediating agent or system. This, in turn, creates
competitive challenges as new entrant firms rush in to fill
the gaps creating a downward spiral in productivity rather
than the intended spur to growth in the sector at large.
Singapore, as smart nation, is perhaps one of the most
ready to address such challenges and does provide the key
opportunities to test bed more effective and sustainable
business models based on the premise that companies can
and should collaborate for effective productive growth.
Resource pooling and a sound regulatory environment and
a requisite skills base means such risks can be mitigated
and at the same time aim to retain productive
differentiation in this new economy.

This white paper sets out to document the challenges,
opportunities and solutions with contributions from
leading players. We take a primarily logistics perspective,
as this in our view, addresses the foundational aspects that,
if we get right, allow us to ride the sharing economy. In
many aspects this paper is another step in the journey and
we consider it a work-in-progress and we hope that it's
provokes further thought.
We first set up the e-commerce landscape and the logistical
challenges of maintaining the economics of consolidated
freight delivery postponed to the most opportune time.
This leverages the concept of large every day long leg
containerization down to the use of smaller modular
recirculating in-city boxes deployed in scenarios we paint
out.
Customers’ expectations in the e-commerce scenarios are
positively correlated with increasing levels of delivery
effectiveness but can be hindered by inadequate
infrastructure, warehouse readiness, less than efficient last
mile delivery and lack of cross border harmonization. We
suggest that integrated and postponed delivery
consolidation may be a panacea for e-commerce,
remedying delivery failure rates and low asset utilization.
In ELM, we embed and integrate the aforementioned
factors and we propose critical success factors and
concepts such as dynamic delivery of consolidated freight
leading to optimum asset utilization governed by
performance-based contracts crafted on cut-off times.
Time and cost trade-off is key to optimization of multi-
party delivery consolidation. We postulate that such
consolidation must be based on freeing oneself from the
burden of servicing owned fixed costs towards adoption of

a variable cost ecosystem by adopting new models that
marginally load parallel or independent resources of non-
related parties – in a grid-like fashion down even to crowd
logistics. Here, we refer to the “4th
Party Milk Run” and
“Collection and Delivery Points” as exemplars that allow
much greater economies of scale and scope.
In summary, we have attempted to layout, from a logistics
and supply chain perspective, the current landscape of e-
commerce trends and challenges and present some
thought provoking concepts, technologies and solutions
that we have researched that could benefit the community
of practice.

TABLE OF CONTENTS
CHAPTER 1. E-COMMERCE LOGISTICS...................................................... 1
CHAPTER 2. E-COMMERCE LOGISTICS: BUSINESS MODEL FRAMEWORK... 4
CHAPTER 3. E-COMMERCE LOGISTICS: CHALLENGES AND ROOT CAUSES.. 7
CHAPTER 4. LAST MILE E-COMMERCE DELIVERY...................................... 12
CHAPTER 5. E-COMMERCE LOGISTICS SOLUTIONS .................................. 15
CHAPTER 6: SUMMARY AND KEY TAKE-AWAYS……………………………..…. 32


CHAPTER 1.
E-COMMERCE LOGISTICS
An e-commerce journey map of the new wave is not as simple
as setting up a website and selling products online. Beyond
the technology investment of setting up an online platform for
business, the move into e-commerce entails significant
preparation and consideration such as product configuration,
suitable infrastructure, logistics automation and supply chain
preparedness. A well thought through business strategy is
essential.
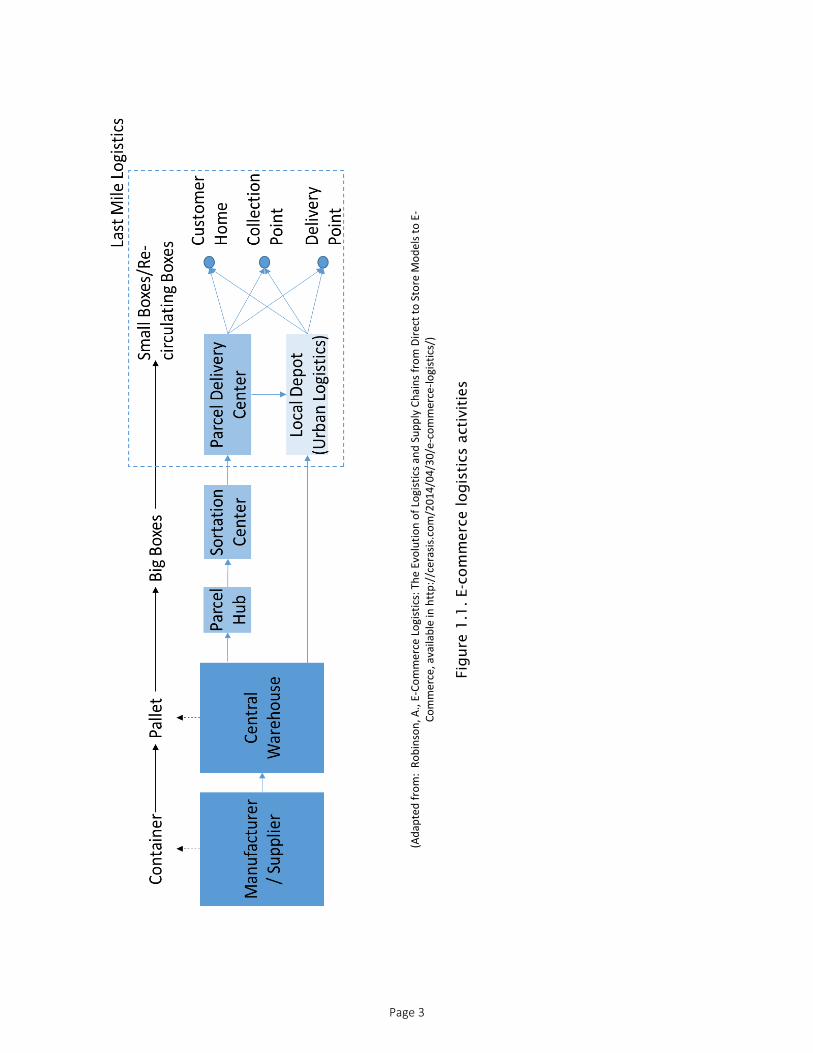
Logistics plays a very important role in e-commerce. It refers
not just to the last mile delivery of parcels to customers, but
also the overall e-fulfillment strategies, as illustrated in Figure
1.1. Figure 1.1 illustrates how goods would reach the
customer in an e-commerce scenario. The customer can either
be a business consumers or an individual (consumer).
Today, customers want their goods to be delivered rapidly and
at their convenience. They have an expectation with regards
to delivery and may consider the speed and convenience of
delivery as important as product price and quality. At the same
time, the volume of packages that need to be picked, packed
and shipped is growing, albeit being in smaller package sizes.
Therefore, when it comes to e-commerce logistics, companies
need to deliver large volumes of packages fast, sometimes
even within a specific or narrow delivery time window.
Furthermore, with a higher volume of e-commerce
transactions, e-businesses also need to manage a
corresponding volume of returned, exchanged and damaged
goods. Hence, the delivery and operational costs of e-
commerce logistics can be significant. This is further
exacerbated possible last-mile delivery failures.
Beyond the
technology
investment of setting
up an online
platform for
business, the move
into e-commerce
entails significant
preparation and
consideration such
as product
reconfiguration,
infrastructure
readiness,
automation logistics
and supply chain
preparedness.
Page 1

Not all e-commerce businesses can survive the impact of high
delivery cost and high operational cost for delivery to their
end customers. The companies often cannot fully absorb the
cost and thus pass these costs to their customers.
Unfortunately, this may result in potential ecommerce
customers baulking.
Page 2
(Ad
apte
d f
rom
: R
ob
inso
n, A
., E
-Co
mm
erc
e Lo
gist
ics:
Th
e Ev
olu
tio
n o
f Lo
gist
ics
and
Su
pp
ly C
hai
ns
fro
m D
irec
t to
Sto
re M
od
els
to
E-
Co
mm
erc
e, a
vaila
ble
in h
ttp
://c
eras
is.c
om
/20
14
/04
/30
/e-c
om
mer
ce-l
ogi
stic
s/)
Figure 1
.1
. E-com
merce logistics activities
Page 3

CHAPTER 2.
E-COMMERCE LOGISTICS:
BUSINESS MODEL FRAMEWORK
Based on their e-commerce logistics strategies, we identify
three broad business model categories, namely the online
retailer model, the aggregator business model and the
Business to Business (B2B) marketplace model as
illustrated in Figure 2.1. Many other models may exist as
the e-commerce world evolves and some may blur these
boundaries. However, for an ease of discussion, we
propose this framework.
The main difference between these business models is in
the handling of inventory and logistics. In the online
retailer model, most of the e-commerce businesses hold
their own inventories and control their own deliveries.
Inventory and delivery costs would contribute to the cost
that the companies or their customers must absorb.
For the aggregator business model, the companies would
serve as integrators without owning their own inventories
or controlling deliveries. They would however have general
guidelines on inventory and delivery for all the suppliers
that list their products on their platform. The inventory and
delivery cost would be borne by the individual suppliers or
their customers.
There are three
business model
categories:
(1)
Online retailer model
(2)
Aggregator business
model
(3)
Business to Business
(B2B) marketplace
There is also a
hybrid business
model that combine
the three business
models.
Page 4

Lastly, the B2B marketplace model would connect buyers
and suppliers normally through an online platform. Add-on
services for warehouse and logistics solutions can also be
offered to provide more value-added services to the
suppliers.
There are also companies that may choose to have a hybrid
business model. For example, an e-commerce platform
that combines both the online retail model, with the
aggregator model. Other than selling its own products, this
e-commerce platform also lists products from other
retailers on its website. This increases the transaction
volumes and enables cost effective deliveries.
Page 5

Figure 2
.1
. Possible E-C
om
merce Logistics Business M
odel Fram
ew
ork
Page 6

CHAPTER 3.
E-COMMERCE LOGISTICS:
CHALLENGES AND ROOT CAUSES
A gap still exists today between e-commerce logistics
performance and customers’ expectations. The higher
costs do not align with the improvement of reliable and
good logistics services.
In ASEAN, a relatively small share of online shoppers (less
than 30% on average) in the Vela Asia Online Shopper
Survey in August 2013 said that they received free delivery
in the previous year1
. This indicates that logistics costs are
too high for many e-commerce businesses, who end up
passing the costs on to their customers. Cost management
becomes one of the biggest challenges to efficient e-
commerce logistics. The root causes of this challenge are
illustrated in Figure 3.1.
3.1 Poor Transport Infrastructure
The assessment of transport infrastructure in ASEAN is
summarized in Figure 3.2. Efficient road networks are
required in order to ensure efficient last-mile delivery.
According to real estate firm Jones Lang La Salle, upgrading
roads and reducing bottlenecks in the region are the
highest priority to improve logistics in ASEAN.
1 AT Kearney, Lifting the Barriers to e-commerce in ASEAN, 2015, available in https://www.atkearney.com/documents/10192/5540871/Lifting+the+Barriers+to+E-Commerce+in+ASEAN.pdf
The higher
logistics costs do
not align with the
improvement of
reliable and good
logistics services.
Page 7

Figure 3.1. Root causes of e-commerce logistics challenges
Compared to other countries in ASEAN, Singapore has the
best transport infrastructure as transport infrastructure in
several countries in ASEAN is still underdeveloped. Hence,
poor transport infrastructure is not specifically a root cause
for e-commerce logistics challenges in Singapore. However,
being a city state, Singapore has a different problem –
urban congestion, which results in inefficient last mile
delivery as elaborated later in the article.
3.2 Lack of Warehouse Readiness
Outside Singapore and Thailand, warehouse capacity has
not kept pace with economic growth2
. The warehouse may
be below international standard or cannot be utilized
effectively. In addition, investment in automation is
sometimes insufficient and online companies struggle to
meet logistics players’ volume requirements.
In a small city state like Singapore, land scarcity poses a
great challenge when establishing dedicated warehouses
for e-commerce activities. Different kinds of needs never
cease to compete against each other for land use, such as
business, industry, housing, education, green land and
defense. Despite the land scarcity, warehouse utilization is
quite low. Many industries operate their own warehouses
2 Ibid. Page 16. Note 3
In a small city state
like Singapore, land
scarcity poses a
great challenge
when establishing
dedicated
warehouses for e-
commerce
activities.
Page 8

at less-than-full capacity and some warehouses remain
vacant every year, which accounts for on average 7.7% of
the total available warehouse space (as shown in Figure
3.3).
Source: Jones Lang LaSalle; A.T. Kearney Analysis
Figure 3.2. A qualitative assessment of transport infrastructure in ASEAN
Source: Singapore Department of Statistics, 2016
Figure 3.3. Warehouse space in
Singapore 2011-2015
*: for Goods and Other Vehicles Source: Land Transport Authority, Singapore
Figure 3.4. Vehicle Growth in
Singapore
Page 9
3.3 Inefficient Last Mile Delivery
ASEAN logistics companies are still familiarizing
themselves with cash-on-deliveries and other services in e-
commerce. They need further refinements in their
processes to suit e-commerce. For example, local post
office operators find that they are often not able to meet
retailers’ and consumers’ expectations.
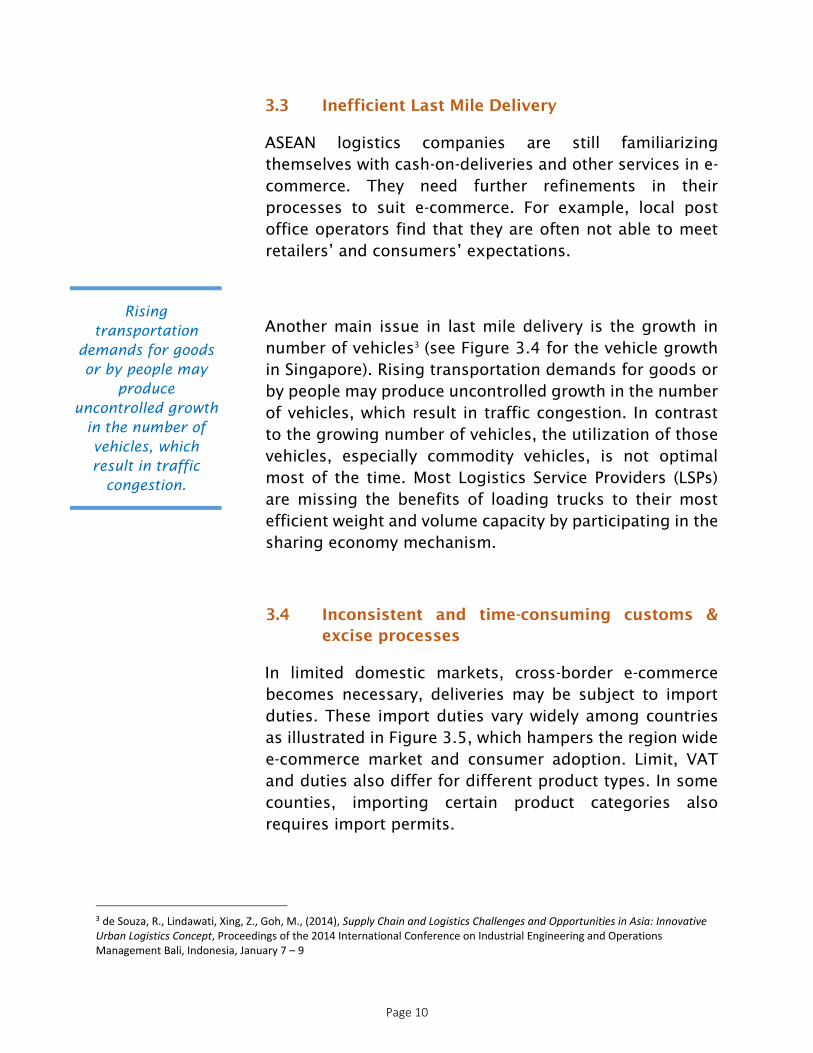
Another main issue in last mile delivery is the growth in
number of vehicles3
(see Figure 3.4 for the vehicle growth
in Singapore). Rising transportation demands for goods or
by people may produce uncontrolled growth in the number
of vehicles, which result in traffic congestion. In contrast
to the growing number of vehicles, the utilization of those
vehicles, especially commodity vehicles, is not optimal
most of the time. Most Logistics Service Providers (LSPs)
are missing the benefits of loading trucks to their most
efficient weight and volume capacity by participating in the
sharing economy mechanism.
3.4 Inconsistent and time-consuming customs &
excise processes
In limited domestic markets, cross-border e-commerce
becomes necessary, deliveries may be subject to import
duties. These import duties vary widely among countries
as illustrated in Figure 3.5, which hampers the region wide
e-commerce market and consumer adoption. Limit, VAT
and duties also differ for different product types. In some
counties, importing certain product categories also
requires import permits.
3 de Souza, R., Lindawati, Xing, Z., Goh, M., (2014), Supply Chain and Logistics Challenges and Opportunities in Asia: Innovative Urban Logistics Concept, Proceedings of the 2014 International Conference on Industrial Engineering and Operations Management Bali, Indonesia, January 7 – 9
Rising
transportation
demands for goods
or by people may
produce
uncontrolled growth
in the number of
vehicles, which
result in traffic
congestion.
Page 10

Figure 3.5. Total Customs value of a $100 dress
Source: Duty Calculator; A.T. Kearney analysis
Page 11

CHAPTER 4.
LAST MILE E-COMMERCE DELIVERY
One of the key challenges in e-commerce logistics we
observe is that the current practice for last-mile e-
commerce logistics is mostly inefficient. The main factors
contributing to the inefficiency are summarized in Figure
4.1.
4.1 Unconsolidated Deliveries
From observations and discussions with e-commerce
businesses, it is derived that there is limited delivery
consolidation between retailers. For different online
retailers, customers need to go to the respective sites to
place separate orders, and deliveries are scheduled
separately. Customers are not able to consolidate online
purchases across different retailers, so that there can be a
single delivery for orders from different retailers. Because
of this, customers often need to spend a lot of time waiting
to receive separate deliveries.
There is also limited delivery consolidation for different
customers ordering from the same e-commerce company.
For example, an e-grocery store in Singapore may need to
do several deliveries to the same residential building for
different customers. This creates un-necessary trips that
increase the logistics costs.
Unconsolidated
and
uncoordinated
deliveries would
waste a lot of
logistics
resources
including vehicle,
manpower (i.e.
the driver), and
space.
Page 12
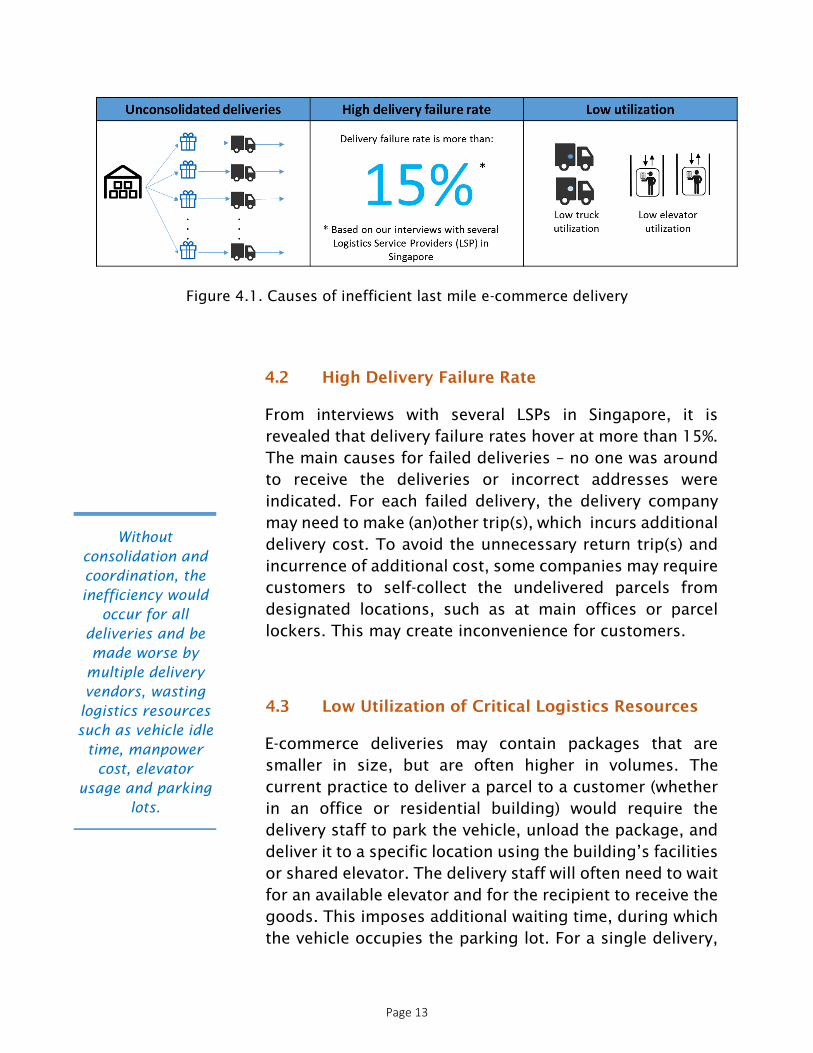
Figure 4.1. Causes of inefficient last mile e-commerce delivery
4.2 High Delivery Failure Rate
From interviews with several LSPs in Singapore, it is
revealed that delivery failure rates hover at more than 15%.
The main causes for failed deliveries – no one was around
to receive the deliveries or incorrect addresses were
indicated. For each failed delivery, the delivery company
may need to make (an)other trip(s), which incurs additional
delivery cost. To avoid the unnecessary return trip(s) and
incurrence of additional cost, some companies may require
customers to self-collect the undelivered parcels from
designated locations, such as at main offices or parcel
lockers. This may create inconvenience for customers.
4.3 Low Utilization of Critical Logistics Resources
E-commerce deliveries may contain packages that are
smaller in size, but are often higher in volumes. The
current practice to deliver a parcel to a customer (whether
in an office or residential building) would require the
delivery staff to park the vehicle, unload the package, and
deliver it to a specific location using the building’s facilities
or shared elevator. The delivery staff will often need to wait
for an available elevator and for the recipient to receive the
goods. This imposes additional waiting time, during which
the vehicle occupies the parking lot. For a single delivery,
Without
consolidation and
coordination, the
inefficiency would
occur for all
deliveries and be
made worse by
multiple delivery
vendors, wasting
logistics resources
such as vehicle idle
time, manpower
cost, elevator
usage and parking
lots.
Page 13
this inefficiency seems insignificant. However, without
consolidation and coordination, this inefficiency would
occur for all deliveries and be made worse by multiple
delivery vendors, wasting logistics resources such as
vehicle idle time, manpower cost, elevator usage and
parking lots. For cities like Singapore which are vertically
and horizontally dense, this creates unique challenges.
Page 14

Chapter 5
E-COMMERCE LOGISTICS SOLUTIONS:
E-Commerce Logistics Management (ELM)
With consideration of the abovementioned concerns for re-
thinking the last mile logistics for e-commerce, the concept
of E-Commerce Logistics Management (ELM) is proposed to
tackle last-mile logistics inefficiency. ELM aims to
encourage different stakeholders to collaborate for cost-
effective deliveries, not only for the customers but also for
the companies that serve the e-commerce last mile
deliveries.
The ELM concept is inspired by our Retail Precinct
Management (RPM) concept that consolidates deliveries,
optimizes the delivery routes and utilizes the loading
docks while provides a dynamic visualization and analytics
to help tracking and monitoring of deliveries and traffic
flow in a retail precinct, such as Jurong Lake District4
. RPM
consists of four features, where one of it, real-time precinct
delivery, can be adjusted for e-commerce delivery
environment in ELM.
The stakeholders included in ELM concept are:
1) e-commerce customers
2) e-commerce platform owners
4 de Souza, R., Lau, H.C., Goh, M., Ng, W.S., Tan, P.S., Lindawati, (2016), Retail Precinct Management: A Case of Commercial Decentralization in Singapore, Transportation Research Procedia, Vol 12, pp. 765-776
E-Commerce
Logistics
Management (ELM)
aims to encourage
different
stakeholders to
collaborate for
cost-effective
deliveries, not only
for the customers
but also for the
companies that
serve the e-
commerce last mile
deliveries.
Page 15

3) suppliers
4) logistics assets providers
5) delivery recipients
Depending on the e-commerce business model discussed
previously, the e-commerce platform owners and suppliers
can refer to the same company or different companies.
Logistics assets providers, which could be freelance
providers or LSPs, provide an additional pool of available
resources, such as manpower, vehicles, storage space.
ELM covers the process from the time the order is made by
the customer until the delivery is received by the customer.
The processes involved in ELM are illustrated in Figure 5.1.
The main features are described in more detail below.
5.1. ELM FEATURE: E-Commerce Delivery Consolidation
As e-commerce deliveries are usually higher in volumes but
smaller in package sizes, there are opportunities for
delivery consolidation within the same or different e-
commerce companies as illustrated in Figure 5.2. The
consolidation can be from the same e-commerce shops for
different customers within a cluster, or different e-
commerce shops within a cluster to the same customer or
even different e-commerce shops to different customers.
In this way, multiple deliveries can be done at the same
time to reduce the transportation cost and optimize the
truck load. This strategy reduces the logistics cost while
maintaining the delivery fulfilment. Figure 5.3 describes
two strategies to be used in consolidation: performance-
based contract and delivery postponement.
Using
consolidation,
multiple
deliveries can be
done at the
same time to
reduce the
transportation
cost and
optimize the
truck load.
Page 16

Figure 5.1. E-Commerce Logistics Management (ELM) Concept
Figure 5.2. Delivery Consolidation
Page 17

Figure 5.3. Strategies for consolidation
5.1.1 Performance-Based Contract (PBC)
In delivery consolidation, one delivery route can be shared
by different customers and companies. Instead of using
traditional cost calculation such as fixed logistics assets or
fixed outsource/lease price contracts, a Performance-
Based Contract (PBC) may be established, where the
companies only need to pay for the amount of logistics
resources used. PBCs can be based on the distance traveled,
time or even space required to perform the deliveries. PBCs
improve logistics service availability and reduce the cost of
logistics resources ownership. An on-demand contract with
PBC translates fixed cost to a variable cost.
5.1.2 Delivery Postponement
A cut-off time for accepting orders and to start delivery is
required for delivery consolidation. Some customers may
want to have their goods immediately, while others may be
willing to wait. To optimize the cost and truckload, the
latest possible time to send each delivery can be
determined using a delivery postponement strategy of
truck departures. This strategy would temporarily hold the
incoming delivery orders for a specific duration. Using such
Performance
Base Contracts
(PBCs) improve
logistics service
availability and
reduce the cost of
logistics
resources
ownership.
Page 18

a strategy enables more deliveries to be consolidated. The
strategy tries to balance between cost and efficiency while
still considering the customers’ preferred time windows.
The postponement strategy can be developed using
analytic models to determine the latest possible time to
send the delivery trucks, by investigating the risk
associated with late deliveries and its impact on operating
costs and delays in deliveries5
. An analytical result for the
impacts of postponement strategy on delivery performance
is shown in Figure 5.4.
Source: The Logistics Institute – Asia Pacific, Challenges and Opportunities in Clustered Urban Logistics: The Jurong Gateway Precinct, 2014
Figure 5.4. Example of delivery postponement impacts on delivery performance
5 The Logistics Institute – Asia Pacific, (2014), Challenges and Opportunities in Clustered Urban Logistics: The Jurong Gateway Precinct
Page 19

5.2. ELM FEATURE: Dynamic Delivery Scheduling and
Real-Time Tracking
To optimize last-mile e-commerce deliveries, dynamic
scheduling and routing is needed. Dynamic scheduling and
routing helps to optimize the fleet travel time while
fulfilling customers’ demands and requirements (such as
time windows), minimize traffic congestion and ultimately
reduce logistics cost. Real-time traffic information, such as
traffic congestion and accidents, is incorporated to allow
for dynamic re-routing or re-scheduling of the delivery if
needed.
When coupled with GIS (geographic information system)
visualization (as illustrated in Figure 5.5), different
stakeholders will also be able to track the order and
delivery in real time.
Other than GIS, big data analysis can also be implemented
for this feature to help stakeholders to understand the
delivery flow in complex environment where different
elements and status (such as road and traffic status) keep
changing overtime. This helps to identify hidden patterns,
trends and correlations that might go undetected in text-
based data or by using manual processes.
Dynamic
scheduling and
routing helps to
optimize the fleet
travel time while
fulfilling
customers’
demands and
requirements
(such as time
windows),
minimize traffic
congestion and
ultimately reduce
logistics cost.
Page 20

Source: The Logistics Institute – Asia Pacific, Challenges and Opportunities in Clustered Urban Logistics: The Jurong Gateway Precinct, 2014
Figure 5.5. Visualization of expected traffic
5.2.1 Time-Cost-Disruption GIS Visualization for
Dynamic Scheduling and Tracking
With advancement in today's communication and software
technology, it is possible to extend this dynamic delivery
scheduling and tracking feature beyond the city. A time-
cost-disruption GIS visualization of logistics data (routes,
locations, travel times, cost, real-time disruptions, etc.) can
be developed to support dynamic scheduling and tracking,
as illustrated in Figure 5.6. Key insights from the tool can
be shown in a dashboard as illustrated in Figure 5.7.
The tool is not only able to support delivery scheduling but
also able to support supply chain operation and
management by displaying and analyzing supply chain and
logistics data (routes, locations, travel times, cost, real-
time disruptions, etc.). It is developed to help decision
makers to find not only the best time and cost effective
Page 21

solution but also to identify potential risks in three
granularity levels, namely: micro (city level), meso (regional
level) and macro (global/international level).
1) Micro View
The micro view visualizes the last-mile delivery routes
within the city, between logistics facilities (such as
warehouses) and the end customers (such as retail shops
or customers’ home). Delivery routes are generated taking
into consideration pick-up locations, pick-up time windows,
delivery locations and delivery time windows. The
possibility for a milk-run for different end customer
locations will also be considered.
Figure 5.6. 3-View of Dynamic Scheduling and Tracking
Page 22

Source: TLIAP Executive White Paper Series, Supply Chain Risk Identification in an Uncertain Future – Concepts, Methods & Tools, January 2017
Figure 5.7. Logistics Time-Cost-Risk Tool Dashboard
In the micro view, the tool may allow the users to indicate
different nodes (such as logistics facilities or retail area or
customers) of interest in the city level. The deliveries are
then conducted to or from these nodes.
Using the aforementioned algorithms and further analytics,
the best routes that may fulfil the areas of interest are then
computed and visualized on the map (as illustrated in
Figure 5.8.). The details, including the risk score, are also
shown. By default, the tool displays the best optimized
routes based on the computed score index.
Page 23

Source: TLIAP Executive White Paper Series, Supply Chain Risk Identification in an Uncertain Future – Concepts, Methods & Tools, January 2017
Figure 5.8. Top Route Display on Map
2) Meso View
Zooming out from the micro view, the meso view connects
supply chain and logistics nodes in several small areas
covered by micro view. The meso view focuses on the long
haul transportation from one area to another area by
utilizing highway or domestic corridors between these
areas. The routes can be served by one or more LSPs.
The flows in meso view are similar to the micro view. The
tool will allow the users to select nodes and deliveries
between those nodes. For example, the meso view can
visualize possible routes from a warehouse in Singapore to
a hub in Malacca using different LSPs. It can further
compare the time and cost required for the routes. It would
also display possible disruption along the routes and
suggest the best mitigation strategies.
Micro view
visualizes the last-
mile delivery routes
within the city.
Meso view
connects supply
chain and logistics
nodes in several
small areas
covered by micro
view.
Macro view focuses
on cross-border
transportation via
existing trade
lanes.
Page 24

3) Macro View
The last aggregated view in the time-cost-disruption
visualization is the macro view, which focuses on cross-
border transportation via existing trade lanes. The trade
lanes may be managed by different companies that act as
the freight forwarders. This macro view would visualize
and analyze the existing trade lanes between the source
and destination location (including the transit points
required) and propose the best route in terms of cost, time
and disruption. As disruptions are unplanned and
unanticipated events, it can severely disrupt the normal
flow of goods and materials. Modelling it in the time-cost-
disruption GIS visualization would help the preparation
and mitigation of the disruption.
5.3. ELM FEATURE: Multi-Party Delivery Coordination
To optimize logistics cost for delivery, e-commerce
businesses can explore different options as illustrated in
Figure 5.7. Traditionally, single or multiple LSPs are
engaged to do the deliveries, which may incur a fixed cost
to the e-commerce business. E-commerce businesses may
wish to translate the fixed cost to marginal cost through
other options such as an “Uber-like” model or a “4th
Party
Milk Run”.
5.3.1 “Uber-like” Model
The “Uber-like” model is a crowd-sourcing delivery
mechanism which involves at least three stakeholders: an
e-commerce platform owner or the supplier, the customer
or the recipient and the on-demand logistics assets
provider. The on-demand logistics assets provider supplies
delivery resources to the supplier when requested. The
delivery request should indicate essential information such
as the start and end points, weight and dimensions of the
E-commerce
business may wish
to translate the
fixed cost to
marginal cost
through options
such as an “Uber-
like” model or a “4th
Party Milk Run”.
Page 25

parcel, customers’ delivery time windows, etc., so that
available and suitable on-demand logistics assets providers
can take up the delivery job. With this model, deliveries can
be made based on customers’ delivery time windows, and
the parcel can be tracked. This mechanism is used not only
as an alternative transportation solution but also as a
temporary storage solution.
Figure 5.7. Delivery Coordination Matrix
Two essential components to support this mechanism are
crowd-sourcing platform and crowd-sourcing contract. To
facilitate crowd-sourcing, a crowd-sourcing platform which
can visualize demand, manage coordination and
collaboration, provide a dynamic delivery schedule, and
establish an interaction space for all stakeholders6
is
essential. This platform acts like the Uber mobile app to
6 The Logistics Institute – Asia Pacific, (2013), COLLABORATIVE URBAN LOGISTICS: Synchronized Last-Mile Logistics for Sustainable, Efficient Urban Delivery
Two essential
components to
support this
mechanism are
crowd-sourcing
platform and crowd-
sourcing contract.
Page 26

match the demand for logistics service with the supply of
available logistics assets, and enables the tracking of
parcels.
Crowd-sourcing contracts are essential to document what
has been agreed upon7
. These contracts between
stakeholders in crowd-sourcing mechanism are known to
vary in nature and content from customer to customer and
from product to product. However, the more similar these
contracts are for a given stakeholder group, the lower the
entry barriers become for the groups’ participation in the
crowd-sourcing mechanism.
5.3.2 4th
Party Milk Run
The 4th
Party Milk Run concept leverages the excess
capacities from a LSP that has existing routes and networks
along the pick-up and delivery locations of the e-commerce
deliveries. Some LSPs may have designated routes that they
need to serve periodically regardless of the delivery volume,
and often these deliveries are not at full capacity. E-
commerce businesses can tap on the spare capacities to
translate their fixed delivery cost structure to a marginal or
variable cost structure. However, a potential concern with
the 4th
Party Milk Run concept is that the LSP may not have
a direct route from the suppliers’ pick-up location to the
delivery location. It may need to go through several
stops/hops/transit locations before it can finally deliver
the parcel to the end customer.
To minimize the time (and also cost) for the deliveries,
there is a need to match the existing routes and networks
7 The Logistics Institute – Asia Pacific, (2013), COLLABORATIVE URBAN LOGISTICS: Foundation Pillars for effective coordination of
urban freight movements
The 4th
Party Milk
Run concept
leverages the excess
capacities from a
LSP that has existing
routes and networks
along the pick-up
and delivery
locations of the e-
commerce deliveries.
Page 27

with the delivery demands. This can be modelled as a
shortest path routing problem. The shortest path routing
problem is a problem of finding a path between two nodes
in a graph. The graph represents the existing routes and
networks and the nodes represent stops/hops/transit
locations, pick-up and delivery locations. The weight can
represent the time or cost or both. The objective is to find
an optimum path for delivery within specified time so as to
satisfy the customer delivery time windows. Further
research is needed to find the best algorithm to solve the
shortest path routing problem in terms of 4th
Party Milk Run.
Figure 5.8. Types of Collection-and-Delivery Points (CDPs)
Page 28

5.4. ELM FEATURE: Multiple Collection and Delivery
Points
A possible solution to reduce additional cost due to failed
delivery is to set up multiple collection-and-delivery points
(CDPs). Packages will be dropped off at the CDPs, and
customers will be informed to collect their packages. This
can also help save time and transportation resource, as
additional trips for successful delivery will be eliminated.
CDPs should be located near residential or commercial
areas so that customers can collect their parcels at their
convenience, which thus also reduces the need for
customers to wait for parcels to be delivered.
Based on the ownership and whether the CDP is attended,
there are four types of CDPs as summarized in Figure 5.8.
The CDP location is a key element in improving efficiency
of e-commerce logistics while maintaining customers’
satisfaction. The CDP location needs to balance between
the customers’ travelling time/distance to the CDP location
as well as the cost to establish and maintain the CDP. To
decide the location of a CDP (unattended or attended),
several factors need to be considered such as the
customers’ location and customers’ demand density.
Ideally, the CDP location should be based on the flow of
goods. It should also be near main amenities such as train
stations, bus interchanges or (in) shopping malls. It should
be a location that offers the lowest possible convenience
costs with the easiest access to the greatest cluster of
customers.
CDPs should be
located near
residential or
commercial areas
so that customers
can collect their
parcels at their
convenience,
which thus also
reduces the need
for customers to
wait for parcels
to be delivered.
Page 29
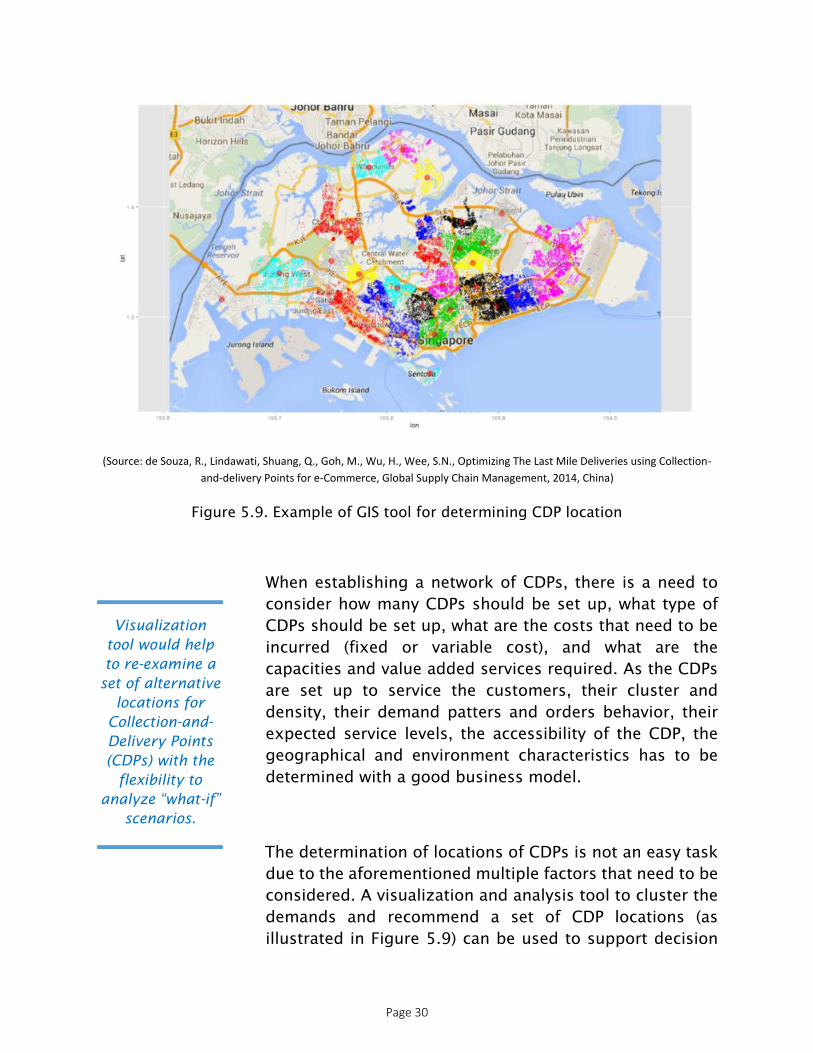
(Source: de Souza, R., Lindawati, Shuang, Q., Goh, M., Wu, H., Wee, S.N., Optimizing The Last Mile Deliveries using Collection-
and-delivery Points for e-Commerce, Global Supply Chain Management, 2014, China)
Figure 5.9. Example of GIS tool for determining CDP location
When establishing a network of CDPs, there is a need to
consider how many CDPs should be set up, what type of
CDPs should be set up, what are the costs that need to be
incurred (fixed or variable cost), and what are the
capacities and value added services required. As the CDPs
are set up to service the customers, their cluster and
density, their demand patters and orders behavior, their
expected service levels, the accessibility of the CDP, the
geographical and environment characteristics has to be
determined with a good business model.
The determination of locations of CDPs is not an easy task
due to the aforementioned multiple factors that need to be
considered. A visualization and analysis tool to cluster the
demands and recommend a set of CDP locations (as
illustrated in Figure 5.9) can be used to support decision
Visualization
tool would help
to re-examine a
set of alternative
locations for
Collection-and-
Delivery Points
(CDPs) with the
flexibility to
analyze “what-if”
scenarios.
Page 30
makers in identifying suitable locations for these facilities8
.
It would help to re-examine a set of alternative locations
with the flexibility to analyze “what-if” scenarios.
8 de Souza, R., Lindawati, Shuang, Q., Goh, M., Wu, H., Wee, S.N.,(2014), Optimizing The Last Mile Deliveries using Collection-and-delivery Points for e-Commerce, Global Supply Chain Management, China; Lindawati, de Souza, R., (2016), Determining Urban Freight Facility Locations using Post-Evaluation Deliberation, IEEE Smart City Conference, Australia
Page 31

Chapter 6.
SUMMARY & KEY TAKE-AWAYS
Setting out on the e-commerce journey needs effective
logistics. In documenting this journey we came across a
number of challenges and more importantly champions
that went some way to address and turn these into
opportunities.
E-commerce leads us to fundamentally rethink old-age
logistics. We have presented key ideas that we believe may
shape the future of e-commerce logistics. For your
convenience we summarize the key take-away points below.
Page 32

TLI-Asia Pacific White Papers Series includes:
.
Please visit www.tliap.nus.edu.sg for more reports.
Technical Report: Urban Logistics In Singapore: Jurong Gateway Precinct
Challenges and Opportunities in Cluster Urban Logistics: The Jurong Gateway Precinct
(Volume 14-Nov-CUL)
The Estate-Wide Goods Mover System (eGMS) – A Discussion Brief
(Volume 14-Mar-IR)
Collaborative Urban Logistics: Synchronized Last-Mile Logistics for Sustainable,
Efficient Urban Delivery (Volume 13-Nov-CUL)
Land Use Intensification in Singapore – An Innovative Warehousing Concept as a Game
Changer in Logistics (Volume 13-Nov-IR)
E-Commerce Trends and Challenges: A Logistics and Supply Chain
Perspective (Volume 16 – Nov-TI)

The Logistics Institute – Asia Pacific National University of Singapore
21 Heng Mui Keng Terrace, Level 4, Singapore 119613 Tel: (65) 6516 4842 · Fax: (65) 6775 3391
Email: [email protected] · URL: www.tliap.nus.edu.sg
The Logistics Institute – Asia Pacific
(TLI – Asia Pacific)
The Logistics Institute – Asia Pacific was established in 1998
as a collaboration between National University of
Singapore (NUS) and Georgia Institute of Technology (GT)
for research and educational programs in global logistics.
TLI- Asia Pacific’s vision is to be the Asia Pacific’s premier
institute nurturing logistics excellence through research
and education. Since its formation, it has served as the
training ground for aspiring logisticians, equipping them
with analytical tools to meet supply chain challenges. The
institute has been voted Asia’s Best Education Course
Provider at the annual Asian Freight & Supply Chain Awards
from 2003-2013 and 2016. The Institute was also awarded
the Best Training Provider at the Supply Chain Awards from
2009-2011 and 2014.
For more information, please visit www.tliap.nus.edu.sg