Driving Business Strategy through BSC in Large · PDF filedriving business strategy through...
20
VIKALPA • VOLUME 39 • NO 1 • JANUARY - MARCH 2014 1 I n a competitive world, the companies that rediscover their vision and mission and innovate continuously achieve sustainability. Long-term sustenance has to be built and fuelled constantly by innovation and well-designed strategic intent. Many companies like General Electric, General Motors, Ford Motor, Bharat Heavy Electricals Ltd., and Tata Motors have devised ways to stay ahead of the competition and build a case for their continued relevance to customers and other stakeholders. All of them have one thing in common – they have used the Balanced Score Card (BSC) methodology as well as continuous improvement to constantly learn from their past efforts and move ahead to greater heights of performance. Tata Steel is a company which is now over 105 years old and continues to be a force to reckon with in the world steel industry. This continued profitable presence in a highly technology- and manpower-driven, capital-intensive industry is not a mere chance event; it has been an outcome of continued innovation in the way the company’s leaders have rediscovered and restated the purpose for its existence – which derives from the Tata Group philosophy of “leadership with trust”. During the years 1990-2010, the company went through a large scale transformation when the leaders reinvented the way in which the daily management as well as stra- tegic management activities were carried out. The successful turnaround of the com- pany from a manpower-intensive, low-technology player to the world’s lowest cost steel plant and more was made possible due to the several initiatives taken up in these years. This paper describes the crucial role played by the BSC methodology implementation which led to the acquisition of Corus, an unparalleled action which has catapulted Tata Steel and the Tata Group into the league of companies that straddle the world business scenario and influence customer comforts. ORIGIN OF THE BSC The search for an integrated management method for large companies has been on since Drucker (1993) proposed the MBO – Management by Objectives. One of the authors was a witness and a participant in a live effort in Mukand Iron and Steel Company, India to introduce MBO for managing the company in 1975. MBO was followed by the methodology of managing by annual themes practised by Japanese Driving Business Strategy through BSC in Large Organizations B Muthuraman and R Jayaraman KEY WORDS Balanced Score Card Performance Management Total Quality Management Business Excellence Vision, Mission, and Values Metrics Tata Business Excellence Model PERSPECTIVES presents emerging issues and ideas that call for action or rethinking by managers, administrators, and policy makers in organizations
Transcript of Driving Business Strategy through BSC in Large · PDF filedriving business strategy through...

VIKALPA • VOLUME 39 • NO 1 • JANUARY - MARCH 2014 1
In a competitive world, the companies that rediscover their vision and mission and
innovate continuously achieve sustainability. Long-term sustenance has to be
built and fuelled constantly by innovation and well-designed strategic intent.
Many companies like General Electric, General Motors, Ford Motor, Bharat Heavy
Electricals Ltd., and Tata Motors have devised ways to stay ahead of the competition
and build a case for their continued relevance to customers and other stakeholders. All
of them have one thing in common – they have used the Balanced Score Card (BSC)
methodology as well as continuous improvement to constantly learn from their past
efforts and move ahead to greater heights of performance.
Tata Steel is a company which is now over 105 years old and continues to be a force to
reckon with in the world steel industry. This continued profitable presence in a highly
technology- and manpower-driven, capital-intensive industry is not a mere chance
event; it has been an outcome of continued innovation in the way the company’s
leaders have rediscovered and restated the purpose for its existence – which derives
from the Tata Group philosophy of “leadership with trust”.
During the years 1990-2010, the company went through a large scale transformation
when the leaders reinvented the way in which the daily management as well as stra-
tegic management activities were carried out. The successful turnaround of the com-
pany from a manpower-intensive, low-technology player to the world’s lowest cost
steel plant and more was made possible due to the several initiatives taken up in these
years.
This paper describes the crucial role played by the BSC methodology implementation
which led to the acquisition of Corus, an unparalleled action which has catapulted
Tata Steel and the Tata Group into the league of companies that straddle the world
business scenario and influence customer comforts.
ORIGIN OF THE BSC
The search for an integrated management method for large companies has been on
since Drucker (1993) proposed the MBO – Management by Objectives. One of the
authors was a witness and a participant in a live effort in Mukand Iron and Steel
Company, India to introduce MBO for managing the company in 1975. MBO was
followed by the methodology of managing by annual themes practised by Japanese
Driving Business Strategy throughBSC in Large Organizations
B Muthuraman and R Jayaraman
KEY WORDS
Balanced Score Card
Performance Management
Total Quality Management
Business Excellence
Vision, Mission, and ValuesMetrics
Tata Business ExcellenceModel
P E R S P E C T I V E S
presents emerging issues andideas that call for action or
rethinking by managers,administrators, and policymakers in organizations

2
companies to bring about a unifying factor to drive TQM
events (sometimes referred to as ‘policy or strategy man-
agement’), followed by Hoshin Kanri (e.g. Lee & Dale, 1998)
and the X-matrix.
The first BSC was prepared by Analog Devices Inc. (ADI),
in the US in 1987 by Arthur Schneiderman (see, e.g. Stata,
1989; Schneiderman, 1999). Schneiderman was the VP of
TQM in ADI when he hit upon the idea of BSC in order to
bring about connectivity between the non-financial and
financial measures. ADI developed BSC to drive perform-
ance improvements while applying TQM methodologies.
The ADI scorecards did not use the four perspectives de-
veloped later by Kaplan and Norton (1992) but neverthe-
less demonstrated the need for an integrated system – or
a systems approach, as described by Ray Stata, the then
Chairman of ADI – to tie in several efforts within a com-
pany to move on different fronts leading finally to supe-
rior bottom line results. Ray Stata had envisioned and
propagated the idea of a learning organization, in part
motivated and influenced by the theories developed by
Arie DeGeus in Royal Dutch/Shell Oil (DeGeus, 1997).
MULTIPLE USES OF BSC
Although the idea of a BSC was not entirely new in the
1980s – GE had done similar work in the 1950s – the
evolution of TQM as a serious threat to American busi-
ness expedited progress in the formalization of BSC.
Kaplan and Norton were the pioneers in the preparation
and use of BSC in many US companies and elsewhere
(Kaplan & Norton 1992; 1993; 2001a; 2001b; 2001c; 2004a;
2004b; 2006; Kaplan & Lamotte, 2001; Kaplan, Norton, &
Rugelsjoen, 2010). They demonstrated that BSC can be
used as a change agent, an instrument of strategy design
and deployment, as a system for communicating strategy
across the organization, a methodology for integrating
TQM efforts, a mechanism for unifying organizational
work by setting up targets and goals and so on. They
postulated that the four perspectives – innovation and
learning, internal processes, customer, and financial –
were interrelated through a cause-effect relationship. Al-
though some researchers have questioned this assump-
tion (e.g. Norrekilt, 1999; Kaskey, 2013), others have shown
that the BSC system works successfully in many situa-
tions. For example, Giannopoulos et al. (2013) conducted
a study of BSC practices in small companies in the UK
and Cyprus. They reported that small companies do not
typically use BSC but they do make use of performance
measures and indicators similar to those included in BSC
models. Prabhu and Hegde (2012) described the issues
that one faced when trying to introduce a BSC system in a
small company. They concluded that conflict manage-
ment and change management were the most important
aspects of trying to introduce the BSC systems in a small
company not used to systematic performance manage-
ment. The leader plays a crucial role in the success or
otherwise of the introduction.
Parmenter (2002), Pandey (2005), Sushil (2008), Gumbus
(2005), Jerez et al. ( 2006), Mukherjee and Pandit (2009)
described the methods to be used to build BSCs in differ-
ent types of organizations. They also mentioned and ana-
lysed the many actions to be taken to design and run a
BSC system in organizations. Pandey wrote about the im-
portance of identifying the ‘Critical Success Factors’
which cascaded across the organization in terms of ini-
tiatives and related metrics. There is consensus that spe-
cific initiatives must be identified for action which will
enable deployment of strategy in day-to-day management.
The key to success in BSC deployment is the way metrics
are connected to tactical actions, how tactics are aligned
to drive the organization towards the strategic goals, and
how synergy can be realized through concerted actions.
More difficult is the idea of linking performance pay to
the BSC parameters (Steele et. al., 2012). While it is possi-
ble to link the overall quantum of performance bonuses
payable to top management personnel to company per-
formance (many Tata companies follow this policy), the
decisions on how to reward personnel down the line is
still a moot issue. Too much of emphasis on the Key Re-
sult Areas (KRAs) of individuals without a formal link-
age to teamwork metrics can result in a ‘tunnel vision’ or
‘blinkered vision’ of individuals who prefer to concen-
trate on their own performance without any reference to
the team results. This often leads to conflicts within the
organization, and even between individuals in the same
department. Hence a balanced approach is called for. More
importantly, there is loss of “teamwork” which can be
detrimental to the organization in the long run. Tata Steel
is a good example where teamwork mechanisms like the
Joint Departmental Councils (JDCs), a world-class indus-
trial relations building and maintaining activity, have
been fine-tuned to a nicety, and where individual KRAs
are embedded in a teamwork culture.
BSC has been used for deploying strategies (Ridwan et.
al., 2013; Werner et. al., 2012; Kaplan & Norton, 2001a;
DRIVING BUSINESS STRATEGY THROUGH BSC IN LARGE ORGANIZATIONS

VIKALPA • VOLUME 39 • NO 1 • JANUARY - MARCH 2014 3
2001b; 2001c; 2006). Kaplan and Norton have written
extensively about how to transform organizations, con-
verting the BSC from a performance measurement tool to
a strategy implementation system. This is possible in all
cases where the BSC system is embedded as a part of an
overall continuous improvement system supported by an
innovation culture which looks beyond continuous im-
provement. Apart from the general purpose of managing
the strategy of an organization, BSC has some specific
uses too; for example, alliances can be managed using
BSC (Kaplan & Norton, 2010) as well as product diversi-
fication efforts (Jarrar & Smith, 2011). In the case of alli-
ances where the interests of both the co-owners are
involved, Kaplan and Norton contend that very often each
party tries to maximize its own gains from the alliance.
However, in a BSC approach, the two involved parties
define and agree upon a common strategy for common
benefits – both long- and short-term. In such a case, the
actions are captured in a BSC system consisting of metrics,
initiatives, and time-bound action plans which help drive
the agreed upon strategy. Jarrar and Smith (2011) pro-
posed that innovation and product diversification could
go hand in hand with performance when using a BSC
methodology. Many companies which are averse to tak-
ing risks in innovating may like to use BSC to tie-in the
risks to the benefits that are inherent in innovations but
are not apparent. Use of BSC has been accepted even in
the field of education (Karpagam & Suganthi, 2012; Weng,
2011; Gumbus, 2005). BSC with quality improvement sys-
tems such as Malcolm Baldrige, EFQM, TQM, etc. pro-
vides the best benefits to companies (Dror, 2008; Jarrar &
Smith, 2011; Kaplan & Lamotte, 2001; Schneiderman,
1999). The experiences in the Tata Group companies (e.g.
see Johnson, 2004) and specifically, in Tata Steel, illus-
trate this point.
BSC IN TATA STEEL
Jamshed J Irani, the Managing Director (MD) of the com-
pany who provided the much needed leadership for Tata
Steel to transform into a TBEM winner, began the practice
of adopting BSC in the year 1999-2000. In the year 2000-
2001, the system was formalized and a set of BSCs were
prepared across the organization. Strengthening of the
BSC system was done as a part of continuing improve-
ments in the company to win the coveted JRD Tata Qual-
ity Value Award – the highest award for Business
Excellence (BE) in the Tata Group. This award-winning
model was designed on the Malcolm Baldrige model and
was used as an internal system within the Tata Group,
administered by the Tata Quality Management Services
(TQMS ), to promote and spread the culture of BE across
group companies.
Till the year 1999, Tata Steel’s strategic goal-setting pro-
cess was governed by the annual, five-year, and long-
term plans processes, along with a budgetary system. The
various plans prepared regularly by the company were:
Annual Business Plan, Annual Operations Plan, Annual
Marketing Plan, and the Annual Budget. These were ag-
gregated from all the plans prepared in all the profit cen-
tres within the company.
Over the years Tata Steel’s Industrial Engineering and
Statistics Group had developed a mathematical model of
the entire integrated steel plant and company operations
including the coal mines, iron ore mines, all the liquid
producing shops, and the finishing facilities. Using a theo-
retical framework and plugging in data collected from
daily operations, the company had put in place a mecha-
nism which could calculate the various production and
services requirements for any particular level of produc-
tion and product mix. These were available with the de-
partments as well, for their individual operations. This
facility with numbers and the knowledge about the intri-
cacies of the overall operations gave Tata Steel a strength
which very few companies possessed. Thus, preparation
of the plans in great detail provided a sound basis for the
preparation of BSC. In conjunction with the Joint Depart-
mental Council system – a world class system of joint
decision-making, action planning, communication, and
feedback mechanism involving both management and
workmen — the company achieved considerable progress
on all fronts to become the leader of BE in the Tata Group
by 1999 (see Figures 1 and 2). By the year 2002 , a newly
designed Quality Management Structure (QMS) was also
firmly in place (Figures 3, 4, and 5).
Hence, by the time Tata Steel decided to implement BSC
across the organization, the foundation had already been
laid out. For successful implementation of BSC, it is criti-
cal to ensure that the company culture is in a receptive
state. Otherwise, the possibility of BSC failing in its pur-
pose and delivery would be quite high. The logic is that,
in the ultimate analysis, BSC is not a measurement sys-
tem; it is a strategy design, implementation, and commu-
nication system. Hence, the enablers must be in place.

4
The TQM/BE movements address many of these require-
ments. Table 1 shows that the machinery was already in
place in Tata Steel.
Amongst the most successful applications of BSC are com-
panies which have used this system in conjunction with
TQM/BE. Full-fledged implementation of the BSC sys-
tem required training of multiple hands. In-company
training was arranged in locations outside of Jamshedpur
in India and abroad. One of the authors was sent to meet
with Dr David Norton in Lincoln, Massachusetts to dis-
cuss and arrange for a senior management session be-
tween him and the MD (the principal author of this paper
had just then been appointed as the next MD of the com-
pany). With these preparations and the newly designed
QMS (Figure 4), which was one of the first continuous
improvement actions carried out to address the ‘areas for
improvement’ based on the previous year’s TBEM assess-
ment, Tata Steel embarked upon the BSC journey.
Phase I: 1999-2001
The steps that defined the BSC system design were as
follows:
DRIVING BUSINESS STRATEGY THROUGH BSC IN LARGE ORGANIZATIONS
Figure 2: Savings due to Continuous Improvement Actions (in ` crore)
Figure 1: Continuous Improvement Activities in Tata Steel
Source: Company data
1986 1989 1992 1995 1997 1999 2000
ValueEngg.
ISO
Quality ImprovementProjects
JRD QV
BenchMarking
KnowledgeManagement
PerformanceEthics
Poin
ts
1200
1000
800
600
400
200
01995-96 1996-97 1997-98 1998-99 1999-00 2000-01 2001-02
JRD QV Scores Savings
Source: Muthuraman (2003)
52
201
101
443
137
510
247
582
465
616 643
901
666
1003
VIKALPA • VOLUME 39 • NO 1 • JANUARY - MARCH 2014 5
• The strategy of the company was declared based on
its vision, mission, and values. For this purpose, the
inputs were provided by the Strategy Group attached
to the MD, which were then discussed at different lev-
els before finalization. One of the innovations was to
prepare the Strategy Horizons diagram (Figure 6).
• If needed, the vision, mission, and values were revis-
ited and changes made (the company drew up a new
vision in 1999 and then in 2003).
• All internal stakeholders prepared the BE Improve-
ment Plan (annual) or AQUIP based on the TBEM feed-
back and by incorporating improvement actions from
Figure 3: Organization Structure of Tata Steel
Source: Company documents
S - Steel Division , CS – Corporate Services , F – Finance, RM & IM – Raw Materials (coal mines, iron ore mines, dolomite, limestone quarries) and Incoming Materials,FP – Flat Products, LP – Long Products, SC – Slab Caster, SS – Shared Services, TMH- Tata Main Hospital , FA & MD – Ferro Alloys and Minerals Division, ITS –Information Technology Services
Figure 4: Tata Steel – Basis for QMS
Source: Company documents
MD
DMD (S) DMD (CS) VP (F) VP (HRM) Direct Reports
RM & IM Town Finance HR MergersFP TMH Accounts IR AcquisitionsLP TSRDS Treasury Training & StrategySC FA & MD Taxation Development New VenturesSC ITS BPOSS Sports & Welfare BE
Engg & Projects CorporateProfit Centres Communications
CorporateAffairs
Business Excellence Apex Council
Business Excellence Corporate Council
Business Excellence Council
Business Excellence Divisional/Departmental Council

6
Source: Company documents
Figure 5: Tata Steel QMS (1999)
Figure 6: Strategy Horizons Diagram
Source: Muthuraman (2003)
DRIVING BUSINESS STRATEGY THROUGH BSC IN LARGE ORGANIZATIONS
BUSI
NES
S EXC
ELLE
NCE
CO
UN
CILS
(18)
BUSINESS EXCELLENCE COUNCILS (18)
Corporate CouncilSteel (10)
Corporate CouncilCorporate Services (4)
Corporate CouncilFinance (2)
Corporate CouncilHRM (2)
Corporate CouncilManagement Services
RM & IM Town CFC Corporate HR & OL&D
Flat Products Medical Services TKM HR-IR Steel
Long Products ITS
Shared Services FAM
Supply Chain
ITD
R&D & SS
Safety & Env
Tubes
Engg. Services &Products
DIVISIONAL/DEPARTMENTAL BUSINESS EXCELLENCE COUNCILS (108)
Prof
itabi
lity/
Grow
th �
Time �
* Under incubation
0 3 5 7
• Steel
PILLARS
• Retail• Opportunistic
acquisition insteel
MINI PILLARS
• Titanium• Ferro alloys
• Remote business service• Logistics• Advanced material• E commerce*• Thermal coal*• Iron ore*• Gas pipeline & distribution

VIKALPA • VOLUME 39 • NO 1 • JANUARY - MARCH 2014 7
other feedbacks like CII-EXIM assessment, IIM assess-
ment, Best Steel Plant assessment, and JN Tata assess-
ments (Figure 7).2
• The action plans were then incorporated in the BSC
for the department and division. While AQUIP docu-
ments were prepared for each department, documents
for BSC were prepared at the Departmental and Divi-
sional (BE Councils), Business Unit level (BE Coun-
cils), Corporate group level (BE Excellence Corporate
Groups), and finally, at the Corporate (or Managing
Director) level. This four-level BSC system (Figure 5)
was envisaged for implementation in a year or two,
but it began only in 2000-2001.
• The BE Group of Tata Steel facilitated the process of
preparation of BSC. In the year 2000-2001, the four-
perspective format proposed by Kaplan and Norton
(1992) was used for all the BSCs.
• The revised and improved upon BSC system was im-
plemented by the middle of the year 2001 and assessed
by the TBEM assessors.
• The overall TBEM score jumped from 616 to 643 – an
increase of 27 points or close to 5 percent, a rare feat
for a company already at a high level of score. Quite
obviously, the increase was not only because of the
implementation of BSC but also because the company
could marshal its efforts in an integrated manner at
an already high level of excellence and inched closer
to the next scoring band which would make the com-
pany an ‘industry leader’ in the TBEM parlance.
The innovations that helped the company excel were:
• Design and implementation of a new QMS
• Design of a new methodology for cascading the BSC
(Figure 8)
• Design of a new review system for BSC
• Strengthening of the AQUIP documentation prepara-
tion
Table 2 shows a sample BSC of the MD for the year 1999-
2000.
2 CII EXIM is an external assessment by assessors sent by the CII for assessing against the EFQM model; IIM assessment is done by the IndianInstitute of Metals that had devised their own model for assessment of excellence; Best Steel Plant assessment was done by the centralgovernment of India for all integrated steel plants in the country; and the JN Tata is an internal assessment process administered by the BEGroup of Tata Steel for all divisions in the company using the TBEM framework.
Figure 7: AQUIP Formulation
Source: Company documents
Feedback fromJRD QV, CII. JNT TQA
Annual Business Plan(ABP/AOP)
Company Policies,Strategic Goals
Council/Sub-CouncilObjectives, KPMs
EmployeesAttitude Survey
Customer Requirements,MOUs, Feedback
Define Goals(Scorecard/KPMs)
IdentifyImprovement
Activities
StretchTargets
Gaps ???
PresentLevel
Leadership Information& Analysis
Process &Systems
(QMS/EMS)
CustomerFocus
HumanResource
Focus
Review Progress

8
PHASE II: 2001-2002
Series of Actions for Design and Deployment ofthe BSC System
Buoyed by the success of the BSC implementation in 2000-
2001, the company’s leaders took the next steps to make
the communication of the BSC better. MD Online was one
such initiative which helped the MD communicate better
with the team leaders and officers at all levels. The most
important initiative introduced to strengthen the system
was ASPIRE which in fact was an overall company ef-
fort. However, the benefits to the BSC were that the targets
were aspirational, a new vision was in the offing and all
employees were being goaded to think aspirationally. The
system for cascading BSC metrics was formalized (Figure
8).
Phase II: 2001-2003
Jamshed J Irani passed on the baton to B Muthuraman,
who succeeded him as the MD of the company in 2001.
The next phase of development of the BSC system began
with the announcement by the new MD of a new move-
ment called “ASPIRE” the objective of which was to cre-
ate a new motivation and momentum in all employees to
excel and aspire for superior performance never before
achieved to make Tata Steel EVA-positive. It was also the
intention to revisit the Vision statement in the year 2003
and hence the ASPIRE movement was kicked off to in-
spire employees to think out-of-the-box and create a new
organization, to be built on the firm foundations already
laid. This unique strength of the company’s top manage-
ment leaders is a key to the successful design and imple-
mentation of the BSC system. The courage to see oneself
in the mirror and design correction and preventive ac-
tions (CAPA) to improve continuously calls for “humil-
ity” which is a unique trait in Tata Steel senior leaders.
(This same trait amongst CEOs of great companies was
detected by Jim Collins (2001), in his book, Good to Great –
Figure 8: Strategy Deployment in Tata Steel
DRIVING BUSINESS STRATEGY THROUGH BSC IN LARGE ORGANIZATIONS
Source: Company documents
CorporateVision Corporate Strategy Corporate Scorecard (MDs) Corporate Initiatives
CorporateBE Councils SBU Strategies SBU Scorecards SBU Initiatives
DivisionBE Councils Divisional Action Plans Divisional BSCs Divisional Initiatives
Departmental ScorecardsDevelop AQUIP, Prioritize Improvement Activities/
Projects linked to Goals/KPMs
Personal KRA linked toGoals/KPMs
REVIEW & IMPROVE

VIKALPA • VOLUME 39 • NO 1 • JANUARY - MARCH 2014 9
Chapter 2, level 5 leaders). Under the ASPIRE umbrella,
several changes were made in the BSC system. The cas-
cading of the BSC was improved upon by asking leaders
at various levels in the organization to take greater re-
sponsibility in devising Vision and Aspiration statements
for their SBUs, Divisions, and Departments. Functions
were also asked to envision their own future roles, as to
how they will support the company to reach refined
heights of technology and operations. The new BSC cas-
cading diagram was redrawn as shown in Figure 9.
Another major improvement was the inclusion of differ-
ent types of measures in the BSCs – lead/lag and meas-
ures for running/changing the business. The selection
process of metrics was also improved by adopting a new
methodology. These are illustrated in Figures 10 and 11.
All BSCs across the organization were modified to fall in
line with the above changes. The new MD’s BSC was
adopted (Table 3).
The basic thrust of the new strategy of the company was
to become EVA-positive. This was driven through many
initiatives which were captured in the BSCs. The list of
key initiatives included:
1. Declaration of a new vision – Vision 2007 – by the
new MD
2. Designing of product portfolio matrix to drive the prod-
uct-mix towards higher profitability and competitive-
ness
3. Introduction of customer value management by Khalid
Hafiz of Nortel
4. Introduction of theory of constraints by Eliyahu Goldratt*
5. Introduction of daily management and continuous im-
provement by Consultant Yoshikazu Tsuda and Pro-
fessor Yoshida
Figure 9: The New BSC System – Tata Steel Strategy Deployment Diagram
Source: Company documents
Vision Corporate Strategy Maps Corporate Scorecard (MDs) Corporate Initiatives
SBU/DivisionsAspirations
SBU (PC/CC)Divisional Strategy Maps SBU/Divisional Scorecard SBU/Divisional Initiatives
FunctionalAspirations Functional Strategy Maps Functional Scorecard Functional Initiatives
Departmental ScorecardsDevelop AQUIP, Prioritize Improvement Activities/
Projects linked to Goals/KPMs
Personal KRA linked toGoals/KPMs
REVIEW & IMPROVE
* As Israeli physicist who became a business management guru.

10
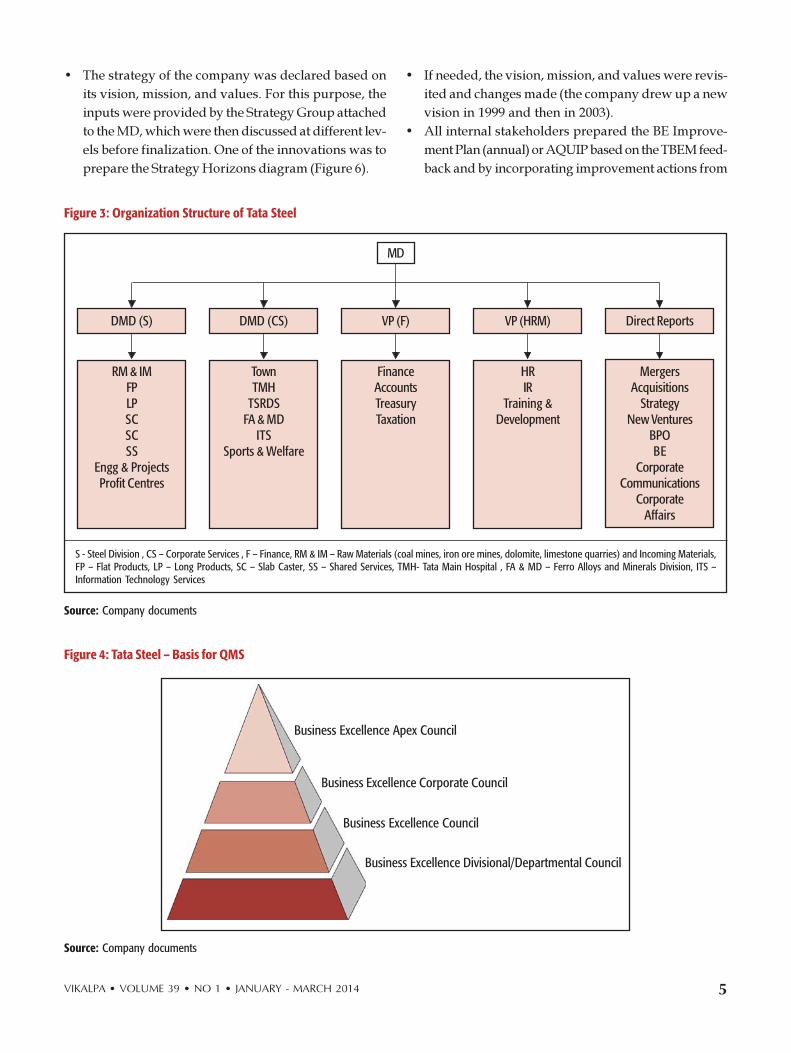
6. Definition of a new leadership system given by the
new MD (2003) (Figure 12).
There were also several other new initiatives taken up by
each SBU/Division/ Department based on the new meth-
odology of ‘aspirational thinking’ under the new ASPIRE
umbrella initiative.
During the year 2001-02, as a part of Evaluation & Im-
provement (E & I), strategic initiatives were introduced in
the scorecards with the objective of cascading them as the
strategic objectives of the next level of scorecards. The
purpose was to cascade the strategy of the company to
various levels for proper deployment. At the end of the
year, a study was undertaken to find out the effectiveness
of the BSC system in the company. This study was con-
ducted by the BE Group. The primary objective of the
analysis was to ascertain how the measures on the score-
card were balanced and how the strategy had been de-
ployed through systematic cascading of these balanced
Figure 10: New Classification of BSC Metrics
DRIVING BUSINESS STRATEGY THROUGH BSC IN LARGE ORGANIZATIONS
The balanced scrorecard should contain measures for both running and changing the business
• Performance Improvement Workshops• Implemented Ideas• Total Order Cycle Time
• e-commerce Sales• Retention of Employees• Operating Profit Growth
• Waste• Errors• Crycle Time
• Revenue• Return on Invested Capital• Cash Flow
LeadingLagging
Change theBusiness
Run theBusiness
Figure 11: QTEC Methodology to Obtain Balanced Metrics at All Levels
Source: Company documents3
Customers
Suppliers
Shared Data
Quality
Efficiency
Timeliness
Cycle Time
ExecutiveLeadership
Leadership
Teams
3 The company documents refer to the reports submitted by JohnVinyard, the Malcolm Balridge Assessor, to the top management ofTata Steel based on his observations on the progress achieved bythe company in the TBEM movement.
VIKALPA • VOLUME 39 • NO 1 • JANUARY - MARCH 2014 11
scorecard measures through the quality management
structure.
The key findings of the study were as follows (Table 4):
Alignment of Scorecards
Overall, about 85 percent of the measures were aligned to
the next higher level scorecard which showed that the
measures were fairly well aligned through different lev-
els.
Cascading of Strategic Initiatives
• Approximately 85 percent of the strategic initiatives
identified in the DMD (Steel)’s Balanced Score Card
were cascaded to various scorecards within the
council.
• Approximately 66 percent of the strategic initiatives
identified in the EIC (FP) Balanced Score Card were
cascaded to various scorecards within the sub-
council.
Figure 12: Improvement in the Tata Steel Leadership System (2000-2003) – Forming the Basis for Cascading the BSC
Rewards andRecognition
SetDirection
PerformanceExcellence
PerformanceReview
ContinuousImprovement
Stakeholders
Set Stretch Targets Motivate People
Guidance, Support
Enco
urag
eTe
amw
ork
Mon
itor
Deliver SuperiorPerformance/Create Value
for Stakeholder
Envision Future:Set & Communicate
Build Structure,System & Processes
Improve &Innovate
Perform toExcel
Stakeholders
Raise the Bar
Coach, Guide, Support and Empower
Enco
urag
e Te
amw
ork
Mon
itor
and
Revi
ew P
erfo
rman
ce
Motivate andEnergize People
Twin Facet:Visionary & Architect
Liste
n

12
• Approximately 67 percent of the strategic initiatives
identified in the EIC (LP)* Balanced Score Card were
cascaded to various scorecards within the sub-coun-
cil.
• The extent of cascading of strategic initiatives from
the next higher level scorecard, overall, was around
32 percent.
Lead Indicators: overall 27 percent
Lag Indicators: overall 73 percent
Benchmarks on Scorecard: 29 percent
Perspective Balance:
• Customer Perspective : 11 percent
• Financial Perspective : 7 percent
• Internal Perspective : 66 percent
• Learning & Growth Perspective : 16 percent
The study showed that cascading needed to be improved;
the BSCs were more ‘internal’ oriented in nature although
the learning and growth perspective was well addressed.
The financial perspective was underplayed as the prime
objective of the company was to become EVA+ in the short
term. The new MD’s BSC was a great improvement over
the earlier ones and the monitoring and CAPA system
rigour was also increased. As a result of all these actions,
the TBEM score at the end of 2002 went up from 643 to
666, an increase of 23 marks or about 4 percent. This was
also a very difficult achievement considering that one is
already in the higher echelons of the TBEM score. The
aim of the company to emerge as an “industry leader”, in
the parlance of TBEM, was achieved. The deployment of
the BSC system with renewed vigour and improvements
was a key effort in the company moving up in its degree
of excellence.
Phase III: 2003-2004
Building on the success of the BSC system through its
embedment into the ASPIRE umbrella, the company went
on to make further improvements in the same. One of the
significant changes made was the declaration of a strat-
egy map, strategy architecture, and a new BSC for the
MD. While the BSC cascading system remained the same,
the strategy map helped in clarifying some of the strategy
elements as well as communicating them. The BE coun-
cils down the line were also asked to develop strategy
maps. This helped the SBUs and divisions to think strate-
gically about their operations, thus enabling nurturing of
future leaders who can think strategically. At one point
of time, several CEOs in the Tata Group were from Tata
Steel. One of the reasons for this trend was that Tata Steel
was one company which had gone into the depth of the
continuous improvement movement using tools like TQM,
TBEM, and BSC which provided the deep and broad band-
width needed to create leaders.
The development of a strategy map was an exercise which
was done in the by-now classic Tata Steel way – study,
training, practice, design, and deployment. Several dis-
cussions were held by the senior leaders after which the
Tata Steel strategy map and the strategy architecture were
developed, which are reproduced in Figures 13 and 14.
The newly designed BSCs were rolled out across the or-
ganization. The company had by then developed one of
the most extensive BSC deployment exercise in terms of
scorecards – there were more than a 100 in the company
at various levels and over a few thousand initiatives in
the BSCs which were designed and deployed by the de-
partments/divisions/ SBUs through the AQUIP docu-
ments. At the end of 2002-2003, the company achieved a
TBEM score of 675 which was an improvement over that
of 2001-2002. It may be noted that the company contin-
ued to improve its overall position in spite of being at a
very high level of excellence which speaks well of the
BSC system as well as the other initiatives.
Some Thoughts on the Deployment of a BSCSystem and its Connection to TQM/BE Movements
As described above, the Tata Steel BSC system deploy-
ment was taken up as a part of the Business Excellence
commitment of the company. All Tata companies are ex-
pected to follow the TBEM methodology for managing
their companies. TBEM is based almost entirely on the
Malcolm Baldrige framework with some tweaking from
time to time for better fitment with the Tata Group ethos
and culture. TBEM was introduced to the Tata Group by
Chairman Ratan N Tata in the year 1994 as an instru-
ment of unifying and taking the group to new heights of
performance excellence unheard of before. Many Tata
companies got committed to the framework and Tata Steel
was an early entrant and a pioneer in understanding and
deploying the TBEM. In doing so, the company identified
many initiatives to drive excellence, a partial list of which
is shown in Exhibit 1 (Appendix).
DRIVING BUSINESS STRATEGY THROUGH BSC IN LARGE ORGANIZATIONS
* EIC – Executive In Charge; FP – Flat Products; LP – Long Products

VIKALPA • VOLUME 39 • NO 1 • JANUARY - MARCH 2014 13
Figure 13: Tata Steel Strategy Architecture, 2003
Source: Company documents
LEARNING AND GROWTH:We will focus on knowledge management, leadership and skills development, employee strategic alignment, and the quality of life in the
communities we serve.
Tata Steel Corporate Strategy Architecture
FINANCIAL PERSPECTIVE:Our financial stakeholders expect us to return a positive EVA on all of our investments
Execution through TBEM
KEY CUSTOMERS: We will create value-added relationships thatfocus on trust, service, and delivery
MASS CUSTOMERS: We will strive to serve our other customersthrough dealer relationships
Inte
rnal
Per
spec
tive INNOVATION:
We will focus our R&D oncustomers’ needs. We willcontinuously innovate inproducts, services, and
businesses to support andbroaden our customer base.
CUSTOMER MANAGEMENT:We will identify and partner
with our key customers. Ourfocus will be to develop and
promote our brandedofferings to drive profitability.
OPERATIONAL EFFICIENCY:We will focus on supplierpartnerships, outsourcing,financial forecasting, and
capacity utilization throughbetter production planning.
GOOD CORPORATE CITIZEN:Ensure safety and environ-
ment sustainability as well asdevelop our communities and
live by the Tata code ofconduct.
Figure 14: Tata Steel Strategy Map 2003
Source: Company documents
Tata Steel Corporate Strategy Map
Revenue fromnew businesses
Grow thecore business Become lowest
total cost producerImprove AssetManagement
Ensure sustainablecommunities
FinancialPerspective
CustomerPerspective
• Customer delight index (actions)• Customer Satisfaction• Delivery Compliance
• Non-steel Revenue • Product mix • Industry benchmark • Cash flow • Town and medical deficit
Improve EVA
• ROIC - WACCRevenue Growth Stategy Productivity Strategy Community
“Delight the Customer” “Win-Win Dealer Relations”
Basic
• Price• Quality
Differentiators
Trustedrelationship Service Delivery Higher margin
productsMarketing
support
• Brandedproduct sales
• Retail customersatisfaction
• Dealersatisfaction
“Innovation” “Increase Customer Value” “Operational Excellence” “Good Citizen”
InternalPerspective
Encourageinnovation
Enter newbusinesses
Customerdriven R&D
Improveservice
ID and partnerwith key custmers
Supplierpartnerships
Strategicoutsourcing
Capacityutilization
Implement thecode of conduct
Improve capital efficiencythrough divestment and
mergers
Ensure safety andenvironmental sustainability• New product
revenue vs. Total
• # new offerings
• Product quality index
• Service deliveryconditions rating
• Customner complaintresponse time
• Customer profitability
• ROCE• Men on rolls
• Supplier Sat. Index• Cost of supplies
• Uptime• On-time
• Safety incidents• OHSAS certification
• COC incidents
Learning &Growth Perspective
A Motivated and Prepared Workforce
Innovative Climate with a Freedom to Fail
• Engaged Employees• Personal alignment to strategy• Performance orientation
• Leadership skills• Change and continuous
improvement
Improve the quality of lifeof employees and thecommunities we serve
ManageKnowledge
Competencies Citizenship
• KM Index• Knowledge usage
• KRAs aligned to strategy• ESI
• Competency Map• AQUIP (annual quality improvement plans) • Corporate Citizenship Index

14
Literature describes BSC efforts as a part of the overall
Business Excellence movements (Malcolm Baldrige or
EFQM or other equivalent) (see Kaplan & Norton, 2001;
Kaplan & Lamotte, 2001; Dror, 2008; Irani, 2003; Stata,
1989; Schneiderman, 1999; Muthuraman, 2003).
We are also of the view that BSCs work best when they
are run concurrently with PDCA/SDCA efforts. However,
care must be taken to ensure that the company’s efforts in
continuous improvement do not make the organization
totally inwardly focused. This has been one of the criti-
cisms that have been levied against organizations which
use TQM as a tool for continuous improvement. The in-
ward focus leads to short-term improvement; however, in
view of the changing external conditions, especially the
strategic environment leading to innovative products and
services, TQM companies often trail their competitors.
This leads to long-term loss of sustainability. In Tata Steel,
a company committed deeply to TQM/BE, the external
focus was retained through a focus on strategy formula-
tion which was done independent of the TQM/BE move-
ment. Tools like the Strategy Architecture, Strategy Map,
Scenario Planning (as introduced by Arie DeGues and
disseminated by Arthur D Little and other consultants),
Strategic Horizon Planning, use of ABP/AOP/AMP, and
the mathematical model of the total steel company opera-
tions enable the company to keep the external focus in
place, to balance the TQM/BE driven ‘internal focus’.
Additionally, the Tata Group initiatives like innovations,
learning from failures, and capital funds for incubating
new businesses from new ideas emphasize the need to
keep an external focus so that the TQM/BE efforts are
directed in ensuring improvements in the right direction.
The adage “a company should do not only things right
but also the right things” is applicable very much to com-
panies practising TQM/BE. In Tata Steel, the BSC system
was driven as a specific initiative, but it used and embed-
ded all the tools and techniques of the TQM/BE methods,
and was itself embedded in the TBEM so that the design
and implementation of appropriate strategy and strate-
gic initiatives was a balance between the short- and the
long-term needs of the company. This ensures building
sustainability into the organization. This is the case in
many other organizations in the Tata Group like Tata
Motors, Tata Chemicals, TCS, and Tata Communications
as well as in other global companies.
CONCLUSIONS AND FURTHER WORK
Designing and implementing BSC systems is now an es-
tablished practice in all world-class companies. The tools
and techniques used to prepare BSCs cascade the strate-
gic intent and initiatives across the organization, moni-
tor progress and undertake corrective and preventive
actions (CAPA), may vary from company to company.
However, successful companies use a blend of TQM/BE
and the BSC system to obtain long-term sustainability as
well as excellence, as many examples show. Tata Steel is
one such example where a BSC system was introduced
as a stand-alone measure, but the systemic foundation
laid by TQM/BE was used to not only design but also
drill down, review progress, do periodic corrections, and
use excellence in practice as a basis to achieve stretch
targets, superior results, build a leadership pipeline, and
obtain sustainability. There are also other companies in
the Tata Group and outside which have followed similar
practices. However, the question whether a company can
use only TQM/BE without recourse to a BSC system needs
to be conclusively answered. If one were to look at the
Japanese experience, the answer is surely ‘no’; one must
have a strategy designing and implementing mechanism
outside the TQM/BE systems. More work is needed to
support this conclusion.
Norrekilt (2000) questioned the causal connection be-
tween the four perspectives – customer, financial, inter-
nal, and learning and growth - and suggested instead a
logical connection between them. Although his arguments
appear to be more in the nature of theoretical rhetoric, it
may still be worthwhile to respond to his claim after a
careful study. In doing so, one may come out with some
additional links in the cause-effect chain. This is already,
to an extent, answered by Kaplan and Norton (2001c)
who have suggested that the number of perspectives may
be more than four, and additional perspectives may be
included in the BSC preparation. However, there appears
to be scope for further work in this area.
DRIVING BUSINESS STRATEGY THROUGH BSC IN LARGE ORGANIZATIONS

VIKALPA • VOLUME 39 • NO 1 • JANUARY - MARCH 2014 15
APPENDIX
Exhibit 1: Partial List of Initiatives taken up in Tata Steel to Make the Company an Industry Leader
Creating an Industry Leader – Strategy Development and Deployment Initiatives
• Tata Steel has evolved a strategy development and deployment process which can be benchmarked with the best in the
world.
• A new strategy team was created. The ABP process has been re-engineered, with greater degree of transparency, coordi-
nated planning, newly defined structure for aggregation of plans and fixing of a timeframe for the processes. A tentative
strategy roadmap has been drawn.
Creating an Industry Leader – Customer Focus
• Regular measurement of CSI – once a year by ORG-MARG, twice a year by internal agencies, once in two years by MODE,
to listen and learn from customers. This year a new methodology for gathering CSI and customer delight data on a continu-
ous basis is being launched. Moreover, the in-house surveys are being replaced by external surveys, to bring greater clarity
in the process.
• Top box analysis has been started.
• PPM – Product Portfolio Matrix – used to identify high value products for revenue/earnings growth and move up the value
chain- growth with profitability. The use of PPM has also evolved over the years.
Creating an Industry Leader – Information Management
• Tata Steel has developed a mainframe based, PC supported distributed data processing system. Two IBM mainframes
provide a central hub with spokes in the various operations centres in Jamshedpur and out locations to gather, process,
analyse and disseminate data on-line, real time and on-demand.
• The IT strategy is aligned with the company strategy. Gartner has been recently appointed to develop a strategy for the next
five years.
• Intranet, website, Lotus Notes supported e-mail, SAP enabled accounting and supply chain transactions, reverse auctions
through metaljunction.com are designed and supported by the IT division.
Creating an Industry Leader – The HR Perspective
• Tata Steel is, first and foremost, a people organization. It has right-sized its employee force by over 30,000 persons in the last
eight years, a record for such activity in India. It has achieved this under-friendly and pleasant circumstances. Its VRS has
been talked about as the best in the industry.
• A whole new set of initiatives are being implemented in the IR area to bring the training and development standards of
supervisors and workmen on a new footing. Already e CIP system has been thrown open to workmen. A new system of
competition for Quality Circles (QC) has been implemented. This system will provide a wider base and greater motivation to
improve the participation of workmen in QCs.
Creating an Industry Leader – The Process Management Perspective
• Tata Steel has introduced new technologies under four phases of modernization – between 1980 and 1996 – and now has
a new steel plant, comparable to the best in the world. It has recently set up a new five stand, tandem cold mill in a world class
time and cost, producing high quality strips for stringent applications.
• In the last three years the company has introduced many new products into the market, in a controlled and systematic way.
New processes were put into place to introduce CR products to new customers, especially OEMs, in a trouble free manner.
Creation of an applications engineering group to launch products smoothly has made the process of gaining new customers
successful and effective. The company has gained market share in this crucial segment, one of the highest value added
business in the steel industry product like galvanized/galvanized CR sheets for exposed auto parts in the near future.
Source: Reproduced from Muthuraman (2003).

16
Table 1: Favourable Conditions for Introduction of BSC System in Tata Steel
Agency / Enabler Favourable Conditions Remarks
Quality Co-ordinators Foot soldiers of quality promotion and facilitation (108 innumber, available in each department of the company),fully trained and experienced in TQM/BE activities
AQUIP ( Annual Quality A world-class system for identifying process metrics, action Each department in the company wouldImprovement Plan ) plans, BSC metrics, through various continuous prepare an AQUIP every year which would
improvement activities become the base document containingprocess metrics,initiatives, BSCs and BSCmetrics. Also see Figure 8 for BSC cascading.
BE Councils aligned with the BSC preparation, implementation, monitoring and CAPA The company had more than 100 BSCs in placeorganization structure - QMS in the year 2000.
A strong annual planning ABP, AOP, and AMP were in place along with an annual These plans, although titled ‘Annual’ were actually long-process budget. These were broken down to monthly and daily plans. term plans, typically containing data for five years.
Tata Business Excellence The culture of continuous improvement was initiated in theModel (TBEM) company in 1988 and was pursued rigorously thereafter,
enabling the company to reach a score of 5821 by 1999.
Mathematical Models of all The interrelationships between the facilities were well These models helped in studying the varying require-the facilities in the company detailed and known. The requirements of raw materials, ments of upstream and downstream facilities across
services, and gases were well known. the organization at various levels of corporate activity.
1 This score is from the TBEM assessments and is the same as the Malcolm Bridge score, which ranges from 1 to 1,000. A company crossinga score of 6,000 was given the JRD Quality Value Award in the Tata Group and the MB award in the US.
Table 2: BSC of MD (Corporate Scorecard) 1999-2000
Strategic Goal Measure UOM Actual Target Benchmark Result
(98-99) (99-00) (00-01) (01-02) (02-03)
Create a culture • JRDQV score Point 582 >650 >675 >700 >750 800+, IBM 7.5-1of continuous • Employee satisfaction index Index 3.14/5 - 3.3/5 3.5/5 3.75/5 3.6/5, HP 7.3-28learning and
• Manpower quality (blend of % of 57 60 67 72 77 Unique and 7.3-5changeprofessionals as % of total Professionals/ specificofficers) Total officers
Achieve world- • Sales from segments where % sales 34 40 38 52 55 7.2-28class status in Tata Steel is ranked No. 1 or 2services and • Customer satisfaction index Index 70 75 75 80 >80 89 Timken 7.1-4products
Reach the • Cost of the hot rolled coil US $/T 186 170 160 167 161 <160, Poco 7.5-30position of the • Rightsizing MOR 59235 <55000 <50000 To be firmed 7.3-1most cost- up each yearcompetitive
• Working capital efficiency Working 22.72 22 21 20 19 12 7.2-5steel producercapital/ Hoogovens
Annualized (93-94)Turnover %
• Procurement cost Cost of 2611 2449 2380 2270 2140 7.4-1bprocurement
(`)/ton ofsaleable steel
Establish • Corporate citizenship index Index 8.53 9.16 10* 10 10 Unique 7.5-38industry (10 point)
leadership • Economic value addition ROIC-VACC -7.7 -5.5** -4.9 -2.9 -0.9 7, Posco 7.2-16
• EBDIT to turnover EBDIT/Turnover % 17.76 20.06 22.50 25 27.5 27.4, Posco 7.2-3
Source: Company documents
DRIVING BUSINESS STRATEGY THROUGH BSC IN LARGE ORGANIZATIONS

VIKALPA • VOLUME 39 • NO 1 • JANUARY - MARCH 2014 17
Tabl
e 3:
New
MD’
s Bal
ance
d Sc
ore
Card
(200
2-20
03)
Stra
tegi
c Goa
lsSt
rate
gic O
bjec
tives
Type
of
Stra
tegi
c Mea
sure
sUn
it of
Actu
alTa
rget
sBe
nchm
ark/
Stra
tegi
c Ini
tiativ
esRe
sult
Mea
sure
Mea
sure
s01
-02
02-0
303
-04
04-0
5Co
mpa
rativ
esCr
eate
wea
lthIm
prov
e EVA
La, R
EVA
- Ste
el b
usin
ess
ROIC
-WAC
C-8
.12Co
nf.
Conf
.Co
nf.
7, P
osco
•Re
duce
WAC
C7.2
-13
EVA
- New
bus
ines
sRO
IC-W
ACC
•Re
tire
cost
ly d
ebts
Impr
ove r
etur
ns to
Le, R
Mar
ket c
apita
lizat
ion
` C
rore
s32
0640
0045
0060
00•
Impr
ove r
eser
ves
shar
ehol
ders
•Fi
nd su
perio
r inv
estm
ent
New
oppo
rtuni
ties
Low
cost
fund
sLe
, RRe
tain
cred
it ra
ting
at A
A+Ra
ting
New
AA+
AA+
AA+
Best
in C
lass
New
Grow
top
line
Le, C
Inve
stm
ent i
n ne
w`
Cro
res
NA
100
500
600
Inve
stm
ent t
o•
Set u
p ov
erse
as F
e-Cr
New
busin
esse
sbe
glob
ally
facil
ity (7
.4-3
9)co
mpe
titive
,•
Ente
r a n
on-s
teel
bus
ines
sN
ewe.
g. C
RMP
•O
btai
n m
inin
g le
ase
for T
iLa
, CPr
ofit
from
new
bus
ines
ses
` C
rore
sN
ewCo
nf.
Conf
.Co
nf.
- do
-•
One
acq
uisit
ion
to b
e co
mpl
eted
Achi
eve
Impr
ove c
usto
mer
La, R
CSI -
ste
elId
ex72
>80
>80
>85
89, T
ubes
SBU
•Im
plem
ent T
OP
Box
7.1-1
, 2w
orld
clas
ssa
tisfa
ctio
nAv
g. To
p Bo
x Sco
re%
22%
3035
4536
%, B
aldr
ige
•Im
plem
ent C
VM7.1
-13-
15st
atus
inw
inne
rsse
rvice
s &Im
prov
e sup
plie
rLa
, RSu
pplie
r Sat
isfac
tion
Inde
x (4
3.2
3.5
3.6
3.7
•Se
t up
help
des
k fo
r7.4
-35
prod
ucts
satis
fact
ion
Inde
xpo
int s
cale
)su
pplie
rs a
nd S
APIm
prov
e sha
reho
lder
La, R
Shar
ehol
der S
atisf
actio
nIn
dex (
5N
ew3.
53.
63.
7Un
ique
•He
ad O
ffice
to in
trodu
ceN
ewsa
tisfa
ctio
nIn
dex
poin
t sca
le)
the
mea
sure
Enha
nce c
usto
mer
La, R
Long
term
par
tner
ship
Num
bers
New
1020
30Un
ique
•Cr
eate
custo
mer
cham
pion
sN
ewre
latio
nshi
pw
ith cu
stom
er -
stee
l
Reac
h th
eEm
ploy
ee co
stLe
, REm
ploy
ee co
st`
/T o
f31
5531
00To
be
firm
ed2,
750
(NSC
)•
Opt
imize
wag
e bi
llN
ewpo
sitio
n of
crud
e ste
elup
eve
ry y
ear
•Im
prov
e HR
skill
mos
t cos
tCo
st re
duct
ion
Le, C
Cost
redu
ctio
n th
roug
h`
cror
es74
080
085
090
0Ta
ta S
teel
is•
AQUI
P an
d ne
w in
itiat
ives
7.3-3
0;co
mpe
titive
new
initi
ative
sbe
nchm
ark
7.4-4
2, 4
3st
eel p
lant
Redu
ce fa
mily
size
Le, R
Righ
tsizin
gM
OR46
234
4500
0To
be
firm
ed25
,100
(NSC
)•
Set t
arge
ts th
roug
h th
e7.3
-25
up e
very
yea
rne
w A
BP p
roce
ss•
Out
sour
ce n
on-c
ore a
ctivi
ties
Crea
te a
Enha
nce
cultu
re o
fLa
, CTB
EM sc
ore
Poin
ts64
3>7
00>7
50>7
8080
0+, I
BM•
Impl
emen
t OFI
’s gi
ven
by JR
D7.4
-58
cultu
re o
fEx
celle
nce
QV
and
Bald
rige
asse
ssor
sco
ntin
uous
Know
ledg
eLa
, CKM
Inde
xIn
dex
102
100
100
100
Uniq
ue•
Shar
e knw
ledg
e thr
ough
out
7.4-4
5, 4
6le
arni
ng an
dm
anag
emen
tth
e org
aniza
tion
chan
ge•
Set u
p KM
com
mun
ities
Beco
me
a ha
ppy
La, C
ESI
Inde
x (5
poin
t3.
643.
753.
83.
83.
6 (HP
)•
Do To
p Bo
x ana
lysis
and
7.3-7
orga
niza
tion
scal
e)id
entif
y st
rate
gy fo
r im
prov
ing
ESI
Esta
blish
Impr
ove
qual
ity o
fLa
, RCo
rpor
ate C
itize
nshi
pIn
dex (
109.
0110
1010
Tata
Ste
el is
•Se
rve
socie
ty7.4
-57
indu
stry
life i
n Ja
msh
edpu
rIn
dex
poin
t sca
le)
a ben
chm
ark
•Im
prov
e w
ater
, ele
ctric
ity &
lead
ersh
ipot
her s
ervic
esin
pub
ic•
Inst
all o
ne fl
y-ov
erre
spon
sibilit
yIm
prov
e qu
ality
of
La, C
Com
posit
e CC
I at
Inde
x (10
New
810
10Ta
ta S
teel
is•
Intro
duce
the
mea
sure
at
New
and
corp
orat
elif
e in
outlo
catio
nsNa
omun
di, J
oda,
poin
t sca
le)
a ben
chm
ark
outlo
catio
ns o
n th
e sa
me
basis
citize
nshi
pW
B an
d Jh
aria
as Ja
msh
edpu
r
Not
e: L
e: L
ead
Indi
cato
r; La
: Lag
Indi
cato
r; R:
Run
the
bus
ines
s; C:
Cha
nge
the
busin
ess
Sour
ce:
Com
pany
doc
umen
ts

18
Balanced Scorecard Report (2004, 2005, 2006, 2007). Settingmeasures and targets that drive performance. HarvardBusiness Publishing, Palladium Executing Strategy, Prod-uct number 2698. Accessed through https://cb.hbsp.harvard.edu/cbmp/product/2698-PDF-ENG
Collins, J. (2001). Good to great. London: Random House Busi-ness Books, pp.17-40.
DeGeus, A. (1997). The living company. London: NicholasBrealey.
Dror, S. (2008). The balanced scorecard versus quality awardmodels as strategic frameworks. Total Quality Manage-ment, 19(6), 583-593.
Drucker, P. (1993). The practice of management. USA: HarperCollins.
Giannopoulos, G., Holt, A., Khansalar, E., & Cleanthous, S.(2013). The use of balanced scorecard in small compa-nies. International Journal of Business and Management, 8(14),1-22.
Gumbus, A. (2005). Introducing the balanced scorecard: Cre-ating metrics to measure performance. Journal of Man-agement Education, 29(4), 617-630.
Irani, J.J. (2003). Business excellence for corporate sustaina-bility. Tata Search, 1-6.
Jarrar, N. S., & Smith, M. (2011). Product diversification: Theneed for innovation and the role of a balanced scorecard.Journal of Applied Management Accounting Research, 9(2),43-60.
Jerez, F., Asis, M., Kaplan, R. S., & Miller, K. (2006). Infosys’srelationship scorecard: Measuring transformational part-
nership. Case Study, HBS Publishing, Reprint Number 9-109-006, December, 1-34.
Johnson, L. K. (2004). Alignment at Tata Motors commercialvehicles business unit. Balanced Scorecard Report, HarvardBusiness Publishing, Article Reprint Number B0409E, 3-4.
Kaplan, R., & Norton, D. (1992). The balanced scorecard: Mea-sures that drive performance. Harvard Business Review,January-February, 71-79.
Kaplan, R., & Norton, D. (1993). Putting the balanced scorecardto work. Harvard Business Review, September-October,133-147.
Kaplan, R., & Norton, D. (2001a). The strategy focused organisa-tion. HBS Press.
Kaplan , R., & Norton , D. (2001b). Transforming the balancedscorecard from performance measurement to strategicmanagement: Part I. Accounting Horizons, 15(1), 87-104.
Kaplan, R., & Norton, D. (2001c). Transforming the balancedscorecard from performance measurement to strategicmanagement: Part II. Accounting Horizons, 15(2), 147-160.
Kaplan, R., & Lamotte , G. (2001). The BSC and quality pro-grams. HBS Publishing, Reprint Number B0103D.
Kaplan, R., & Norton, D. (2004a). Strategy maps. HBS Press.
Kaplan, R., & Norton, D. (2004b). How strategy maps framean organization’s objectives. Financial Executive, March-April, 40-45.
Kaplan, R., & Norton, D. (2006). How to implement a newstrategy without disrupting your organization. HarvardBusiness Review, March, 100-109.
Table 4: Summarized, Partial Results of the Study on Effectiveness of BSC System in Tata Steel for 2001-2002
Area No. of Benchmarks Customer Financial Internal Learning & Lead Lag Alignment Cascading(BSC) Measures Perspective Perspective Perspective Growth Indicator Indicator with next of Strategic
Perspective (No.) (No.) Higher Level InitiativesScorecard
DMD 15 08 02 03 06 03 02 12 71%(Steel) (53%) (14%) (21%) (43%) (21%) (14%) (86%)
EIC (FP) 19 05 02 03 10 04 02 17 95% 32%(26%) (11%) (16%) (53%) (21%) (11%) (89%)
Chief LD#2 29 06 03 – 23 03 13 16 66% 45%& SC (21%) (10%) (79%) (10%) (45%) (55%)
Chief HSM 34 05 03 – 27 04 15 19 38% 50%(15%) (9%) (79%) (12%) (44%) (56%)
Chief CRM 27 03 01 20 03 10 17 78% 45%(11%) (4%) (74%) (11%) (37%) (63%)
Chief Mkt. 17 02 02 03 10 02 02 15 82% 30%Sales (FP) (12%) (12%) (18%) (59%) (12%) (12%) (88%)
EIC LP 18 10 02 05 07 04 04 14 83% 34%(56%) (11%) (28%) (39%) (22%) (22%) (78%)
Source: Company documents
REFERENCES
DRIVING BUSINESS STRATEGY THROUGH BSC IN LARGE ORGANIZATIONS

VIKALPA • VOLUME 39 • NO 1 • JANUARY - MARCH 2014 19
Kaplan, R., Norton, D., & Rugelsjoen, B. (2010). Managingalliances with the balanced scorecard, Harvard BusinessReview, January-February, 114-120.
Karpagam, U. P. L., & Suganthi, L. (2012). A strategy map ofbalanced scorecard in academic institutions for perfor-mance improvement. The IUP Journal of Business Strat-egy, IX(3), 7-16.
Kaskey, V. L., & Affes, H. (2013). The balanced scorecard: Acomparative study of accounting education and experi-ence on common measure bias. Advances in Management,6(7), 22-25.
Lee, R. G., & Dale, B. G. (1998). Policy deployment: An exami-nation of the theory. International Journal of Quality andReliability Management, 15(5), 520-540.
Mukherjee, T. K., & Pandit, S. (2009). Role of BSC in perfor-mance management. Globsyn Management Journal, 3(1),January-June, 50-55.
Muthuraman, B. (2003). The quest for excellence: Tata Steel inthe new millennium. Tata Search, 7-16.
Norreklit, Hanne. (2000). The balance on the balancedscorecard: A critical analysis of some of its assumptions.Management Accounting Research, 11(1), 65-88.
Pandey, I. M. (2005). Balanced scorecard: Myth and reality.Vikalpa, 30(1), 51-66.
Parmenter, D. (2002). The balanced scorecard: Up and run-ning in 16 weeks. New Zealand Management, 49(4), 56-58.
B Muthuraman was the Managing Director of Tata Steel dur-ing 2001-2009 and is currently the Company’s Vice Chair-man. He has a B.Tech in Metallurgical Engineering from IITMadras, an MBA from XLRI Jamshedpur, and an AdvancedManagement Programme from CEDEP/INSEAD, France. Join-ing Tata Steel in 1966 as a Graduate Trainee, he worked in theareas of Iron-making and Engineering Development for tenyears and then moved to the Marketing & Sales Division. Hewas appointed Executive Director (Special Projects) in Au-gust 2000 and served as the main change agent for the majordiversification projects of Tata Steel. He was conferred theHonorary Fellowship of All India Management Association(2007), a distinguished Alumnus Award from IIT Madras(1997), the Tata Gold Medal from the Indian Institute of Met-als (2002), CEO of the Year Award from IIMM (2002), Na-tional HRD Network Pathfinders Award (2004) in the CEOCategory, Business Standard Award, CEO of the year 2005and CEO with HR Orientation Award in 2005, at the WorldHRD Congress at Mumbai. Further, he was conferred ‘Man-agement Man of the Year 2006-2007 Award’ by Bombay Man-agement Association in 2007.
e-mail: [email protected]
R Jayaraman studied in UBC, Canada, Indian Institute ofManagement Ahmedabad and Indian Institute of Technol-ogy, Bombay. He joined Tata Steel in 1983 and rose to be itsChief of Business Excellence in 2001 after traversing throughmany positions of importance. He was the EA to the ViceChairman and the then MD of Tata Steel and worked closelywith senior leaders. He worked as the chief of planning, moni-toring and cost control of the cold rolling mill project of TataSteel, headed by Mr. Muthuraman, which set several worldrecords in project management. He also served as VP of Qual-ity in Tata Communications and Sr VP (Technology) and ChiefSafety Officer of Tata Teleservices. Currently, he is serving asProfessor, Operations Management in the SP Jain Institute ofManagement, Mumbai, which he joined in 2011 after retire-ment from the Tata Group. He has published more than 40papers and two books (one as a joint author with BMuthuraman).
e-mail: [email protected]
Prabhu , D., & Hegde , S. (2012). Design and implementationof performance management systems, KPI’s and respon-sibility centres: A case study. South Asian Journal of Man-agement, 19(2), 122-133.
Ridwan, R., Harun , H., Yi, A., & Imam, M. F. (2013). Theimpact of the balanced scorecard on corporate perfor-mance: The case of an Australian public sector enter-prise. International Business Research, 6(10), 103-110.
Schneiderman, A. M. (1999). Why balanced scorecards fail.Journal of Strategic Performance Measurement, January, 6-11.
Stata, R. (1989). Organisational learning: The key to manage-ment innovation. MIT Sloan Review, 30(3), 62-74.
Steele, N. N., Branson, L., & Sung, C.-H. (2012). Counterbal-ancing the scorecard: Differential use of balancedscorecard and stereotype information on performanceevaluation and bonus allocation. International Journal ofBusiness, Marketing and Decision Sciences, 5(1), 110-120.
Sushil (2008). How balanced is the balanced score card? GlobalJournal of Flexible Systems Management, 9(2 & 3), iii-iv.
Weng, M.-H.(2011). The application of balanced scorecard toperformance evaluation for engineering education sys-tems. The International Journal of Organisational Innovation,4(2), Fall, 64-76.
Werner, Michael. L., & Xu, F. (2012). Executing strategy withbalanced scorecard. International Journal of Financial Re-search, 3(1), January, 88-99.

20 VIKALPA • VOLUME 39 • NO 1 • JANUARY - MARCH 2014