
DRIVERS OF DEMAND GROWTH FOR MOBILE · PDF fileDRIVERS OF DEMAND GROWTH FOR MOBILE...
39
August 2002 Revised Fall 2004 Drivers of Demand Growth for Mobile Telecommunications Services: Evidence from International Panel Data by Aniruddha Banerjee and Agustin J. Ros
Transcript of DRIVERS OF DEMAND GROWTH FOR MOBILE · PDF fileDRIVERS OF DEMAND GROWTH FOR MOBILE...

August 2002Revised Fall 2004
Drivers of Demand Growth for Mobile Telecommunications Services: Evidence from International Panel Data
by Aniruddha Banerjee and Agustin J. Ros

DRIVERS OF DEMAND GROWTH FOR MOBILE TELECOMMUNICATIONS SERVICES:
EVIDENCE FROM INTERNATIONAL PANEL DATA
Aniruddha Banerjee1 and Agustin J. Ros.2
Abstract This paper reports the results from an econometric analysis of global mobile telephony demand growth as a function of various market and regulatory variables and unobservable country and region-specific factors. Using panel data from 1996-2000, we investigate the drivers of mobile services demand growth in a selected panel of developed and developing countries. We explore, in particular, the effects on that demand growth of the quality of the existing fixed network, the presence of a separate (and, possibly, independent) regulator, and the offering of innovative pricing arrangements, such as Calling Party Pays and prepaid services. We find that although those effects are, for the most part, as expected, there is mixed evidence on the role of the regulator and of the price structure innovations.
1. Introduction Since becoming commercially available in the early 1980s, and especially in the last
decade, mobile telecommunications services have experienced spectacular demand growth
worldwide. Between 1990 and 2002, the International Telecommunications Union (ITU)
estimates that the number of mobile subscribers worldwide grew from 11 million to 1.15
billion—a compounded annual growth rate of almost 47 percent. In 2002, the number of
mobile subscribers worldwide surpassed the number of fixed main lines for the first time.
The importance of mobile services—from both an economic and a sociological
perspective—cannot be understated. Consumers have benefited enormously from mobile
1 Corresponding author, Vice President, NERA Economic Consulting, Inc. One Main Street, 5th Floor, Cambridge, MA 02142, [email protected].
2 Senior Consultant, NERA Economic Consulting, Inc. One Main Street, 5th Floor, Cambridge, MA 02142, [email protected].
2
communications, and the industry has generated considerable wealth for shareholders in a
relatively brief period of time. Many consumers now view mobile services as essential to their
daily lives, particularly as a growing number of innovative services that go well beyond voice
communications become available. Moreover, rapid growth of mobile telephony has non-
trivial positive spillover effects on much of the economy. For example, mobile telephony
expands communications possibilities between consumers and businesses and lowers
transactions costs and other costs of doing business. In addition, technological change
embodied in the newer, third-generation (3G) mobile services—which can transmit broadband
data and internet services—promises to alter profoundly the way in which we live and work.
From a sociological perspective, mobile communications play an indispensable role in helping
to connect different populations, especially those located in isolated areas, and in increasing
citizens’ access to health and emergency services.
In some developing countries, the availability of mobile services has already
revolutionized communications. Many such countries have badly lagged more developed
countries in the availability and quality of fixed network-based wireline telecommunications.
Moreover, it has not been uncommon for prices of fixed network-based services to be based on
deeply entrenched subsidies that, in turn, have discouraged private investment in fixed
networks, even where such investment has been permitted. As a result, long waiting lists for
fixed network services—at times exceeding ten years—have developed in those countries.3
Now, the availability of mobile services has offered those countries the option to leapfrog
existing fixed networks and services with mobile telephony, and millions of consumers now
have the opportunity to purchase communications services where they previously did not.
In this paper, we use panel data from 1996-2000 to investigate the drivers of mobile
services demand growth in a selected panel of 61 developed and developing countries. The
paper reports the results from an econometric analysis of mobile telephony growth as a function
of various market and regulatory variables and unobservable country and region-specific
3 Ros and Banerjee (2000) report evidence from Latin America that fixed network supply constraints (brought on
partly by subsidized and unremunerative rates for certain fixed services) were historically responsible for significant unmet demand and long waiting lists. In recent years, a combination of privatization and tariff rebalancing have gone a long way toward relieving supply bottlenecks and meeting pent-up demand.
3
factors. The familiar S-shaped diffusion of new technology suggests that the growth rate is low
initially, but then accelerates before reaching a natural saturation level. Factors that influence
the timing and extent of penetration include income, service price structures and levels,
technological change, and consumer tastes and preferences. In addition, supply-side factors,
such as the availability and quality of fixed main lines, are expected to have a bearing on the
growth of mobile telephony. Apart from these market demand and supply factors, this study
also takes account of the regulatory environments in the countries of the panel, in particular
whether regulatory agencies separate (or, at least, independent) from government-run
telecommunications entities existed during the study period.
2. Review of Literature Our paper begins with a bifurcated review of the economic literature on international
mobile telephony. We first describe the results of empirical studies that use data from various
country panels in order to reach conclusions about the determinants of mobile telephony
growth. The second part of the review summarizes the results of empirical studies based on the
analysis of country-specific data.
2.1. Cross-country analyses There are several comprehensive empirical studies of the drivers of demand growth for
mobile services. Madden and Coble-Neal (2003) used a global telecommunications panel
comprising 56 countries and annual data for the period 1995-2000 to estimate a dynamic
demand model. Their study examined the substitution effect between fixed and mobile
telephony while controlling for the consumption externality associated with telephone
networks. The authors modeled optimizing economic agent behavior directly in order to derive
mobile demand equations for estimation, and found that, for enhancing network mobile
subscription, mobile network size has the greatest long-run impact, followed by the reduction
of mobile service prices. Moreover, Madden and Coble-Neal also discovered a substantial
substitution effect, specifically that price increases for fixed main lines induce growth of
mobile subscriptions. Among the significant factors that affect mobile growth, they concluded
that income was the least important.

4
Using sample data for several African countries, Hamilton (2003) investigated whether
mobile services are substitutes or complements for fixed services. Given the conventional
wisdom that mobile and fixed telephony are complementary in developed countries, she
established that they appear to be substitutes in developing countries where fixed network
access is low or non-existent. Studying a possible reverse causality between mobile and fixed
telephony in environments with low levels of economic development, Hamilton suggested that
mobile telephony acts as a competitive force that encourages providers of fixed services to
improve access to their networks. She concluded that mobile and fixed services are sometimes
substitutes, and at other times complements, even where access to fixed networks is relatively
low.
Another recent study is by Gruber and Verboven (2001a), who estimated a diffusion
model for mobile services and analyzed, inter alia, the effects of government policies on the
global evolution of mobile telephony. This study produced useful evidence on the main drivers
of growth in mobile services. Specifically, Gruber and Verboven analyzed how entry and
standards regulations affect the diffusion of mobile services, after controlling for various other
country-specific factors. Their study was based on data for 140 countries (representing about
94 percent of the world’s population) in which mobile services were offered during the period
1981-1997 (except for Japan for which data from 1979 were available).
Gruber and Verboven’s main finding from estimating a logistic diffusion model was
that diffusion rates of different countries are generally slow to converge. They attributed this
slowness partly to the delay in some countries in issuing first licenses and partly to persisting
initial cross-country differences. They also found that introducing competition has a strong
immediate impact on diffusion but a weak subsequent impact, and that setting a single
technological standard accelerates the diffusion of analog technologies considerably. In
addition, countries with higher per capita GDP and larger fixed networks tend to have higher
adoption rates for mobile services, although those rates tend to diminish over time. Gruber and
Verboven noted that the latter finding was evidence of a form of complementarity between
fixed and mobile network services (to which we refer as “technological complementarity” in

5
this paper).4 Interestingly, they also found that, relative to countries with short or non-existent
waiting lists for fixed line connections, countries with longer waiting lists had lower mobile
adoption rates initially but experienced strong and significantly higher annual growth
subsequently. From this, Gruber and Verboven concluded that mobile services are well-suited
to provide telecommunications access in inefficient fixed line markets.
Two similar studies by Gruber and Verboven (2001b) and Gruber (2001) also focused
on the diffusion of mobile services in countries in the European Union and Central and Eastern
Europe, respectively. Using logistic models of diffusion similar to those in Gruber and
Verboven (2001a), Gruber and Verboven (2001b) found that the transition from analog to
digital technology during the early 1990s, and a corresponding increase in spectrum capacity,
had a major impact on the diffusion of mobile services. Moreover, the authors found that the
advent of competition also had a significant effect on diffusion, but that this effect was smaller
than the technology effect. The Gruber (2001) study found that the speed of diffusion
increased with the number of firms and—similar to the findings in Gruber and Verboven
(2001a)—also increased with the size of the fixed network and the waiting list for fixed line
services.
Ahn and Lee (1999) studied the determinants of demand for mobile services using
cross-sectional data for 64 countries in 1998. Acknowledging the importance of distinguishing
between access and usage, Ahn and Lee estimated the demand for access by exploiting the
often-observed fact that the subscribership rate in any country depends on factors specific to
that country. Ahn and Lee believed that these country-specific factors include the existing
tariff systems, national wealth, the levels of technological development and industrialization,
and fixed network facilities. They found that the probability of subscribing to mobile services
was positively correlated with per capita GDP and the number of fixed lines per person (akin to
4 Technological complementarity (which is the phenomenon Gruber and Verboven observed) refers to the parallel
growth of mobile and fixed telephony for technological or other reasons, as opposed to economic complementarity—in the sense in which that term is typically used—refers to parallel movements in demand in response to mutual relative price changes.
6
the teledensity measure).5 They also concluded that mobile service prices were not strongly
associated with the probability of subscribing to mobile services.
In a related vein, Jha and Majumdar (1999) examined the effects of the diffusion of
cellular technology on the competitiveness of telecommunications as a whole in OECD
countries. Jha and Majumdar’s measure of competitiveness of the telecommunications system
in a country was based on productive efficiency, based on their belief that a productive
telecommunications sector that uses resources efficiently is also competitive. The authors
estimated a stochastic production frontier from cross-sectional data employing a single-step
estimation procedure that estimated the frontier and the determinants of efficiency
simultaneously. The main finding of this study was that the extent of subscribership to mobile
services (along with investment per main line, the number of inhabitants, GDP, higher tariffs,
and the extent of market liberalization and private participation) were major determinants of
telecommunications sector productive efficiency in OECD countries.
Three other non-econometric studies of mobile services are noteworthy in this context.
First, Gruber (1999) analyzed the key variables affecting mobile telephony in the European
Union and attributed the rapid growth of such telephony in Europe to a favorable technological
and regulatory environment. Specifically, Gruber attributed such growth to technological
innovation and a new regulatory framework based on liberalization and technical
standardization. In contrast, Gruber also found that national regulatory idiosyncrasies became
less important as European Union regulation replaced national regulation.
Second, a study by Rossotto, Kerf, and Rohlfs (2000) examined the importance of
competition in mobile telephony. Based on summary statistics of data from countries
deploying GSM technology for mobile services, rather than a formal econometric analysis, the
study found competition to be an important determinant of growth in (and benefits from)
mobile telephony. In particular, it found that competition in the market for mobile telephony
increased the size of that market and drove incumbent fixed network operators to improve their
provision of fixed services.
5 Following convention, we use the term “teledensity” to mean the number of fixed main lines in operation per 100
inhabitants and “cellular density” to mean the number of mobile subscriptions per 100 inhabitants.

7
Finally, Banerjee and Ros (2003) performed a cluster analysis of a panel of 61
developed and developing countries. Forming clusters on the basis of the levels and compound
annual growth rates of teledensity and cellular density, they identified four clusters of countries
with distinctive telephony and socio-economic characteristics. Based on these findings, the
study concluded that while mobile and fixed telephony have generally developed apace in the
more affluent countries, relatively less affluent/developed countries have favored the
leapfrogging of fixed by mobile telephony—a phenomenon that this study labeled
“technological substitution.”6 This inference was supported one of the main conclusions of the
study by Gruber and Verboven (2001a).
2.2. Country-specific studies Several country-specific studies have examined the determinants demand growth for
mobile services. Sung and Lee (2002) examined the impact of rapid growth in mobile
telephones on the demand for traditional fixed network access in South Korea. The analysis
used South Korean regional panel data for the period 1991-98. The results showed that a 1
percent increase in the number of mobile telephones results in a reduction of between 0.1 and
0.18 percent in new fixed connections and an increase of between 0.14 and 0.22 percent in
fixed disconnections.
These results were generally consistent with those of Sung, Kim, and Lee (2001) who
also examined the substitutability between mobile and fixed services in South Korea. The
authors estimated separate equations for fixed-line connections and disconnections in South
Korea and found that fixed and mobile service operators compete on the basis of price.
Rodini, Ward and Woroch (2002) empirically estimated the substitutability of fixed and
mobile services using a large U.S. household survey conducted for the period 2000-2001. This
study estimated cross-price elasticities that confirmed that second fixed lines and mobile
services are economic substitutes.
6 Technological substitution—as distinct from economic substitution—occurs not in response to relative price
changes but when local conditions favor the development of one form of telephony over another. See footnote 4 for the parallel concept of technological complementarity.
8
Cadima and Barros (2000) estimated the diffusion of Portuguese fixed and mobile
networks, and concluded that mobile telephony growth slowed the growth of fixed telephony,
but there was little impact of the latter on the former.
Finally, Okada and Keiko (1999) reviewed Japan’s regulatory scheme for mobile
services and examined the interdependence between mobile and fixed networks. Having first
estimated price elasticities and network effects between the two networks, they found the own-
price elasticities to be relatively high and the substitution and network effects to be quite
substantial.
Findings from the empirical literature on the main drivers of growth in mobile
telephony are summarized below in Table 1. National income, liberalization (competition), and
the size of the fixed network are consistently identified as important such drivers. Gains in
national income expands demand for all goods and services, including mobile services. The
finding that competition is associated with growth in mobile telephony suggests that economies
of scale in the industry are not so large as to inhibit competition. While the optimal number of
mobile operators in any given country is likely to depend on limits to the size of the overall
market for mobile telephone services, competition is clearly a catalyst for the demand for
mobile services. The finding that the size of the fixed network has a positive impact on mobile
services growth suggests technological complementarity between mobile and fixed services.
Nevertheless, there is also evidence that, in some countries, mobile services are a substitute for
fixed services, particularly given that the quality of the fixed network appears to be inversely
related to demand growth for mobile services. The existing literature does not, however, link
demand growth in mobile telephony to other factors, such as privatization, regulation, Calling
Party Pays (CPP) or Receiving Party Pays (RPP), and innovative pricing arrangements such as
multi-part tariffs and prepaid services. We examine the significance of some of these
additional factors in the present study.

9
Table 1. Main Drivers of Mobile Services Demand Growth in Previous Research
CROSS-COUNTRY STUDIES
Study Main Drivers Mobile/Fixed Line Substitution
Madden and Coble-Neal (2003)
Mobile network size, prices, GDP Yes
Hamilton (2003) N/A Mixed
Gruber and Verboven (2001a)
GDP, size of fixed network, quality of main lines, competition, setting single standard
Mixed
Gruber and Verboven (2001b)
Technology (transition from analog to digital), competition
N/A
Gruber (2001) Competition, size of fixed network, quality of main lines
N/A
Jha and Majumdar (1999) Mobile size, investment/line, population, GDP, prices, competition and private participation
N/A
Ahn and Lee (1999) GDP, teledensity N/A
Rossotto, Kerf, and Rohlfs (2000)
Competition N/A
Banerjee and Ros (2003) Socio-economic development status, regional differences
N/A
COUNTRY-SPECIFIC STUDIES
Study Main Drivers Mobile/Fixed Line Substitution
Rodini, Ward, and Woroch (2002), USA
N/A Yes for second fixed lines and mobile
Sung and Lee (2002), South Korea
N/A Yes
Sung, Kim, and Lee (2001), South Korea
N/A Yes
Cadima and Barros (2000), Portugal
N/A Yes
Okada and Keiko (1999), Japan
N/A Yes

10
3. Development of Global Mobile Telephony
3.1. Market Entry Conditions At the time commercial mobile services were first becoming available (in the late 1970s
and early 1980s), state-owned (PTT) monopoly providers of fixed-line telecommunications
services operated in most countries. It is unsurprising, therefore, that the PTTs were the first to
be assigned the right to commercially exploit the new mobile technology. At first, commercial
mobile services were regarded as simply additions to the line-up of services offered by PTTs,
and revenues from those services were considered ancillary to fixed-line revenues. By long-
standing tradition, revenues generated from non-basic services had been used to support public
policy goals, and the introduction of mobile services simply expanded the list of services
offered by PTTs and, hence, of the policy options available. As a result, in the early years of
commercial mobile telephony, monopoly provision of mobile services through the PTT became
the dominant form of market structure.7
During the 1990s, telephony in many countries underwent an important transformation
with pervasive shifts from monopoly to competitive provision of telecommunications services,
affecting incumbent operators that were both state-owned and privately owned. Such
liberalization first exposed value-added services like customer premise equipment, paging, and
mobile services to the workings of the competitive market. There were three possible reasons
for this. First, unlike conventional fixed network services, these services were not subject to
natural monopoly conditions.8 Second, several interest groups (consumers, large business
users, etc.) exerted pressure on governments to open these services up to competition in order
to secure lower prices and better quality and customer service than available from incumbent
operators. Finally, many developing countries began opening their economies up to
7 There was a notable exception to this rule in the U.S. At AT&T’s divestiture, the emerging mobile business was
transferred from AT&T to the Regional Bell Operating Companies (RBOCs). Soon after, mobile duopoly in every RBOC-served market became public policy and the norm.
8 Natural monopoly conditions exist when one firm can supply the entire volume of market demand for a service more economically than two or more firms that share that volume. In other words, the minimum efficient scale of operations exhausts the market demand. Typically, this happens when average costs decline with volume, i.e., there are economies of scale. Scale economies are most likely to arise when the initial or startup fixed costs are very large relative to variable or incremental costs, a phenomenon often found to have characterized traditional fixed telecommunications networks.
11
meaningful foreign investment, which had the effect of accelerating the transition to
competition.
Mobile competition accelerated through the 1990s as a rapid transition occurred from
analog to digital technology. This transition resulted in lower average costs, wider range of
services, and greater revenue—all conditions that were conducive to increases in the optimal
number of mobile operators in a market. As Gruber and Verboven (2001a) found, of the 118
countries that adopted an analog cellular mobile system, 88 countries retained a monopoly
structure and only 30 countries opted for oligopoly. This pattern was reversed, however, for
digital technology. Of the 87 countries that adopted digital systems, only 39 retained a
monopoly structure while 48 opted for oligopoly.
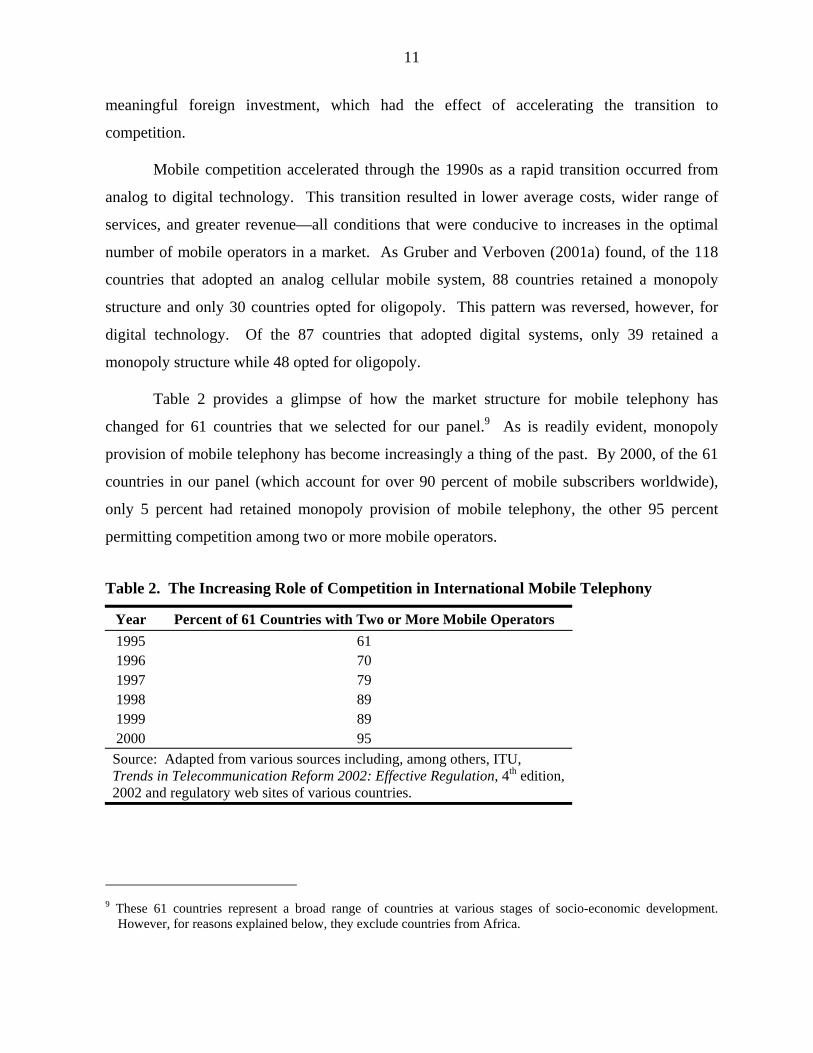
Table 2 provides a glimpse of how the market structure for mobile telephony has
changed for 61 countries that we selected for our panel.9 As is readily evident, monopoly
provision of mobile telephony has become increasingly a thing of the past. By 2000, of the 61
countries in our panel (which account for over 90 percent of mobile subscribers worldwide),
only 5 percent had retained monopoly provision of mobile telephony, the other 95 percent
permitting competition among two or more mobile operators.
Table 2. The Increasing Role of Competition in International Mobile Telephony
Year Percent of 61 Countries with Two or More Mobile Operators 1995 61 1996 70 1997 79 1998 89 1999 89 2000 95 Source: Adapted from various sources including, among others, ITU, Trends in Telecommunication Reform 2002: Effective Regulation, 4th edition, 2002 and regulatory web sites of various countries.
9 These 61 countries represent a broad range of countries at various stages of socio-economic development.
However, for reasons explained below, they exclude countries from Africa.

12
As other researchers have found, this increasing trend toward mobile competition is
hard to overlook in any study of mobile telephony growth. Accordingly, our own econometric
analysis takes due account of the possible impact of such competition—mainly in the form of
innovative pricing arrangements—on mobile subscribership and growth rates. Economic
theory posits that, in the absence of market imperfections (e.g., natural monopoly, externalities,
and asymmetric information), competition among suppliers helps to maximize economic
benefits. One benefit is that competition leads to higher output and lower prices than a
monopoly. As a result, to the extent that mobile telephony markets are not characterized by
natural monopoly conditions, we would expect mobile competition to have a positive effect on
mobile telephony subscribership and growth rates.10
3.2. Regulatory Conditions Ever since the early years of commercial mobile telephony, there has been a tradition of
mobile operators worldwide—whether privately or government owned—being allowed to price
their services unconstrained by regulation. With such services viewed initially as luxuries and
non-essential value-added telecommunications services, and revenues from value-added
telecommunications services being used to accomplish broad public policy goals, governments
were content to permit mobile operators to extract as much surplus as permitted by market
conditions. Even today, there is little formal regulation of the retail prices for mobile services.
Although mobile services are no longer viewed as luxuries or non-essential items, most
countries have come to rely on mobile competition for disciplining their retail prices.
The sole exception to the general forbearance from regulation of mobile service prices
has arisen in some countries for the wholesale termination prices that mobile operators charge
for terminating calls from other networks, whether fixed or mobile. These prices recover costs
associated with the use of mobile switches, base stations, transmission between switches and
base stations, etc. in the process of terminating incoming calls. Regulating prices, whether 10 Over the period of observation, all but six of the countries in our panel had permitted competition among its
mobile operators. Because of the almost ubiquitously permitted mobile competition, it is more sensible to represent it through the competitive actions of mobile operators themselves (such as providing CPP, prepaid, or other innovative pricing arrangements) than through a simple binary variable or even just the number of mobile operators on record. Hence, in our study, CPP and prepaid service-related variables serve as a proxy for mobile competition.

13
retail or wholesale, makes economic sense only when there is some source of market failure
and the direct and indirect costs of regulation are less than the gains from regulation.11 Most
countries appear to have concluded that mobile operators would have some degree of market
power over their termination services regardless of the state of competition in the retail market,
and have refrained from regulating prices for those services. A few countries have, however,
bucked that trend and begun to regulate the termination prices that mobile operators charge
interconnecting networks. Even then, any form of control over mobile operators (mostly
through spectrum allocation, numbering, and licensing) is much more indirect and sparing on
mobile service prices than is the case for fixed network-based services. Regulation is far more
common for incumbent fixed networks (e.g., through price cap plans for retail services,
interconnection tariffs, universal service requirements, resale and unbundling requirements,
etc.).
Another important development during the 1990s was the trend toward the creation of
specialized regulatory structures and institutions (e.g., specific to telecommunications or public
utilities) that were increasingly separate from and, in some instances, independent of various
branches of government. While countries like the United States, Canada, and the United
Kingdom have had a long tradition of such regulatory institutions, most countries in our panel
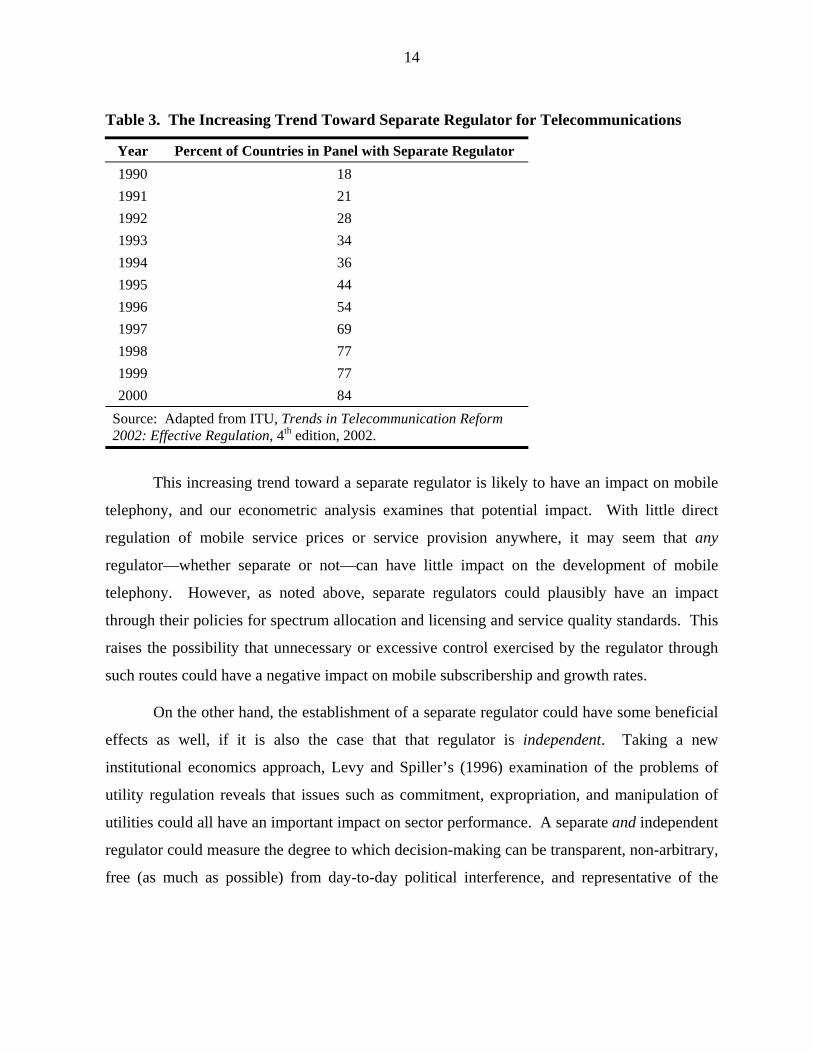
have only recently begun to develop separate regulatory structures. Table 3 below shows the
trend toward separate regulators in our country panel.
11 Regulation involves both direct costs (from the need to erect and administer the regulatory apparatus) and
indirect costs (arising from allocative efficiency losses when regulation distorts price-costs relationships).
14
Table 3. The Increasing Trend Toward Separate Regulator for Telecommunications
Year Percent of Countries in Panel with Separate Regulator 1990 18 1991 21 1992 28 1993 34 1994 36 1995 44 1996 54 1997 69 1998 77 1999 77 2000 84
Source: Adapted from ITU, Trends in Telecommunication Reform 2002: Effective Regulation, 4th edition, 2002.
This increasing trend toward a separate regulator is likely to have an impact on mobile
telephony, and our econometric analysis examines that potential impact. With little direct
regulation of mobile service prices or service provision anywhere, it may seem that any
regulator—whether separate or not—can have little impact on the development of mobile
telephony. However, as noted above, separate regulators could plausibly have an impact
through their policies for spectrum allocation and licensing and service quality standards. This
raises the possibility that unnecessary or excessive control exercised by the regulator through
such routes could have a negative impact on mobile subscribership and growth rates.
On the other hand, the establishment of a separate regulator could have some beneficial
effects as well, if it is also the case that that regulator is independent. Taking a new
institutional economics approach, Levy and Spiller’s (1996) examination of the problems of
utility regulation reveals that issues such as commitment, expropriation, and manipulation of
utilities could all have an important impact on sector performance. A separate and independent
regulator could measure the degree to which decision-making can be transparent, non-arbitrary,
free (as much as possible) from day-to-day political interference, and representative of the

15
regulator’s ability to maintain a credible commitment. All of this could have a positive impact
on the development of the telecommunications sector.12
It is not clear a priori whether a separate regulator per se would have a positive or
negative impact on mobile telephony. While a separate and independent regulator could
improve the environment in which carriers operate, the effectiveness or independence of a
regulator that is simply separate is harder to call.
3.3. New Pricing Structures There is now little doubt that prices associated with mobile services (beginning with the
price paid for the handset, and including connection charges, monthly subscription charges,
per-use charges, roaming and long distance charges, etc.) have fallen considerably in most
major markets. At the same time, the pricing structure itself of mobile services has undergone
significant change. Thus, in some countries (notably, the United States), per-use pricing plans
have disappeared for all but the lowest usage levels. Instead, mobile operators are offering
variants of “fixed minutes of use” (FMOU) pricing plans which allow customers to purchase a
fixed bucket of peak and off-peak minutes and pay no additional usage-related charges as long
as the number of purchased minutes is not exhausted. Customers may select from a number of
such plans, which vary by the number of minutes pre-purchased and, hence, by the monthly
price paid.
One important variant of the FMOU arrangement is the popular “prepaid service.” For
a fixed charge, customers buy a fixed number of minutes that must be used up within a
specified period of time (usually a month). Prepaid service, however, is available without
committing the customer to a long-term monthly contract, and is, thus, ideal for customers who
are unable to qualify for, or unwilling to accept the obligations of, contract services. FMOU
plans also typically minimize or eliminate roaming charges that customers pay for the privilege
of using their mobile phones in areas served by mobile networks other than those to which they
subscribe. As a result, FMOU plans with regional or national footprints have emerged, most
12 Gutierrez and Berg (2000) and Wallsten (2001) stress the importance of a truly independent regulator, not
simply a separate regulator, as described above. While these authors developed different measures of an independent regulator, the regulator must, at a minimum, be separate and not under the control of any branch of government.

16
notably in the United States. We believe that the introduction of prepaid services has had a
positive impact on the demand for mobile services, a hypothesis we test in our analysis below.
3.4. Pricing Regimes Established by Public Policy Another important development in the pricing of mobile services concerns the choice
made by public policymakers in different countries between CPP and RPP as the operative
pricing regime.13 Under CPP, mobile subscribers pay only to make calls to other subscribers of
mobile or fixed networks. In many countries, CPP has superseded the older RPP system, which
obliged mobile subscribers to pay for all uses of mobile phones, whether to make or receive
calls. Conventional wisdom has argued that RPP may have depressed the use of mobile
services because customers, unwilling to pay for unsolicited or undesirable calls made to their
phones, simply shut off their phones or limited the distribution of their assigned numbers to
potential callers. By shifting cost recovery to cost-causing callers (whether from fixed or
mobile networks) under all circumstances, CPP is likely to make mobile calling more attractive
and, hence, to stimulate the demand for mobile services. This could happen independently of
whether the price of mobile calls declines as well, i.e., the demand trigger for mobile services
may be not only lower prices for mobile calls but also the pricing regime itself.
Three qualifications to this unmitigated positive appeal of CPP should, however, be
noted. First, the implementation of CPP for mobile services may be problematic or impossible
in some jurisdictions or countries. For example, despite mature markets for mobile services,
the United States and Canada remain predominantly RPP-centric for those services, even
though much of Western Europe and South America have implemented CPP over the past
decade.14 Second, CPP does not solve the problem of termination monopoly associated with
13 Comprehensive counts of countries that have adopted either CPP or RPP are almost non-existent. Based on
research we conducted (including surveys of (1) articles and documents written about CPP and (2) regulatory websites at various countries), we estimate that 30 of the 61 countries in our panel had adopted CPP by 1996, and that count rose to 39 by 2000. Countries that adopted CPP by 2000 were predominantly in the OECD and Latin American regions, significant exceptions being India and South Korea (from the Asia-Pacific region) that also adopted CPP and Canada and the United States (from the OECD region) that stayed with RPP.
14 In the United States (and possibly some other countries), policymakers have chosen to persist with RPP for practical technological, rather than strictly economic, reasons. In the United States, the numbering system in effect for telecommunications does not allow distinguishing between a telephone number assigned to a fixed main line and one assigned to a mobile phone. Callers cannot tell whether their calls are being terminated on a fixed network or on a mobile network. Therefore, asking callers to pay CPP prices (which may vary with the

17
mobile networks. Calls made from the fixed network to the mobile network are likely to cost
more than calls in the reverse direction because of higher termination charges that mobile
operators can assess on calls from fixed networks. Hence, CPP may not reduce all prices
associated with mobile calling and, as a result, fail to stimulate the use of mobile services to the
degree expected.15 Third, the principal perceived defect of RPP—that mobile subscribers
would remain obliged to pay even for undesirable incoming calls—has, for all practical
purposes, been cured by the development of FMOU pricing plans. These plans provide blocks
of pre-purchased minutes that are generous enough to enable mobile subscribers to easily
absorb the cost of undesirable incoming calls, provided that they terminate such calls soon after
receiving them. In sum, these three factors may limit CPP as a desirable alternative to RPP,
although CPP remains the proper cost-causative mode of pricing despite the presence of call
externalities.16 On the other hand, CPP may remain likely to encourage greater calling of
mobile numbers (and greater use of mobile services, generally) despite the problem of
termination monopoly on mobile networks.
3.5. State of Mobile and Fixed Telephony To set the stage for the study reported in this paper, it is useful to summarize the state of
mobile and fixed telephony in the 61 countries in our panel. This can be accomplished by
focusing on four specific measures of telephony and the relationships among them. The four
measures are the levels of teledensity and cellular density and the compound annual growth
rates (CAGRs) of teledensity and cellular density. Table 4 shows the relationships among these
measures in terms of their rank-order correlations.17
type of network on which their calls are terminated) would be impractical and unfair. Also, as in the United States, separate layers of federal and state regulation that govern fixed-to-mobile interconnection arrangements may also make it extremely difficult to set uniform prices. After an extensive exploration of the feasibility of CPP in the United States, the Federal Communications Commission declined in April, 2001, to adopt specific rules for implementing and governing CPP. It left it up to individual mobile operators to offer CPP on their own.
15 See, e.g., OECD (2000, pp. 45-46). 16 See Kim and Lim (2001) for arguments in defense of RPP and a discussion of how call externalities may
internalized by RPP. 17 Rank-order correlation represents the correlation between the ranks occupied by the 61 countries on any pair of
measurements, e.g., cellular density and teledensity, cellular density and cellular density growth rate, teledensity and cellular density growth rate, etc. Unlike the ordinary Pearson correlation, it reflects the correlation between

18
Table 4. Rank-Order Correlation Statistics Among Levels and CAGRs of Cellular Density and Teledensity for Panel Countries18
Measures of Mobile and Fixed Telephony
Cellular Density,
2001
Teledensity, 2001
Cellular Density CAGR,
1990-2001
Teledensity CAGR,
1990-2001
Cellular Density, 2001 0.8719 (0.0000)
-0.5326 (0.0000)
-0.7270 (0.0000)
Teledensity, 2001 0.6874 (0.0000)
-0.6380 (0.0000)
-0.7815 (0.0000)
Cellular Density CAGR, 1990-2001
-0.3541 (0.0001)
-0.4437 (0.0000)
0.6529 (0.0000)
Teledensity CAGR, 1990-2001
-0.5093 (0.0000)
-0.5530 (0.0000)
0.4557 (0.0000)
Spearman correlation statistics and their corresponding probability values are shown above the gray cells on the diagonal. Kendall’s tau-b statistics and their corresponding probability values are shown below the gray cells on the diagonal. Source: Based on data from ITU, World Telecommunication Indicators Database, 6th Edition, June 2002.
We first note that the rank-order correlation is highly positive between cellular density
and teledensity and also between the respective CAGRs of cellular density and teledensity.
That is, countries that rank higher (lower) on teledensity tend also to rank higher (lower) on
cellular density. Moreover, countries that have the highest (lowest) CAGRs of cellular density
also tend to have the highest (lowest) CAGRs of teledensity. While there are exceptions to the
rule, this finding is as expected. However, the positive correlation is stronger for the levels of
cellular density and teledensity than for their respective CAGRs.
The more interesting finding from Table 4 is that of the statistically significantly
negative correlation between the ranks of countries on one levels measurement and one CAGR
measurement. For instance, ranks for cellular density are negatively correlated with ranks for
the ranks of the measurements, not between the measurements themselves. Two measures of rank-order correlation are reported in Table 4, the Spearman correlation and the Kendall’s tau-b statistic. Both appear to be very highly statistically significant for all pairs of measurements considered. The values of these statistics are different because of how they are constructed but, not surprisingly, they both lead to the same statistical inference. For more on the rank-order correlation statistics reported here, see Sheshkin (2000, pp. 863-894).
18 Other tests of bivariate association (Pearson’s chi-square, Cramer’s V-statistic, and the gamma statistic) all yield identical inferences. Results are available upon request.

19
the CAGR of cellular density, implying that countries that have lower (higher) cellular densities
tend also to have higher (lower) CAGRs of cellular density. Because cellular density and
teledensity are highly positively correlated, this also implies that countries that have lower
(higher) teledensities tend to have higher (lower) CAGRs of cellular density.
4. Scope of Present Study The history of mobile telephony in the 61 selected countries since 1990 indicates not
merely a dramatic pace of diffusion of a new communication technology, but also distinct
regional variations in the manner in which such diffusion has occurred. In some countries (and
regions), mobile telephony has developed in a complementary manner with fixed network-
based telephony, albeit much more rapidly. In others, mobile telephony has tended to leapfrog
fixed network-based telephony as the communication technology of choice. These broad
patterns raise obvious questions about both demand and supply conditions that may have been
responsible for the observed spread of mobile telephony worldwide.
As noted earlier, other studies have pointed consistently to a small set of factors
responsible for the rise of mobile telephony. Among these are the size of the existing fixed
network in a country, a measure of affordability such as per capita income (or, per capita GDP),
the state of competition in both fixed and mobile services, the quality of fixed main lines
(including waiting lists for main lines), and mobile technology standards. These factors
practically suggest themselves but, with the exception of per capita GDP, they arise arguably
from the supply side. A relatively small set of studies have also examined the effects of prices
(of mobile services and fixed service alternatives), pricing structures, or other representations
of consumer preference. Viewed together, the results of these inquiries are somewhat
inconclusive: While Madden and Coble-Neal (2003) found evidence of price-based
substitution between mobile and fixed services, Ahn and Lee (1999) could not detect any effect
of mobile service prices on the probability of subscribing to mobile services.19 Therefore, the
19 In some preliminary research leading up to this paper, we were unable to find any statistically discernible role of
the usage prices for mobile and fixed services in shaping the demand for those prices. We offer two conjectures regarding this failure. First, despite significant reductions in mobile service usage prices in recent years, they still remain discernibly above usage prices in many (if not all) countries for corresponding fixed services. This is not surprising given the traditional policy in some countries of setting fixed network access prices below economically-efficient levels. That is, the increasing popularity of mobile services may be driven more by

20
need to determine rigorously whether mobile and fixed services are economic substitutes or
complements, or whether they are substitutes in certain market structures (and countries) but
complements in others, remains largely unaddressed. However, with increasing evidence of
technological substitutability or complementarity between mobile and fixed telephony,
questions worthy of serious research remain about the effects of alternative pricing structures,
if not price levels.
Aside from supply-side factors, this study begins an exploration of the effects of the
CPP pricing regime and pricing arrangements such as prepaid services in the growth of mobile
telephony worldwide. For the present study, we started out with time series observations for
the period 1996-2000 on 61 selected countries from the four regional blocs described earlier.20
These years corresponded roughly to the global “take-off” period for mobile telephony. They
also witnessed important market and regulatory developments in several countries, including
the introduction of CPP and prepaid services, privatization and liberalization, and the rise of
multiple mobile operators within local or national markets. Details of the 61-country panel,
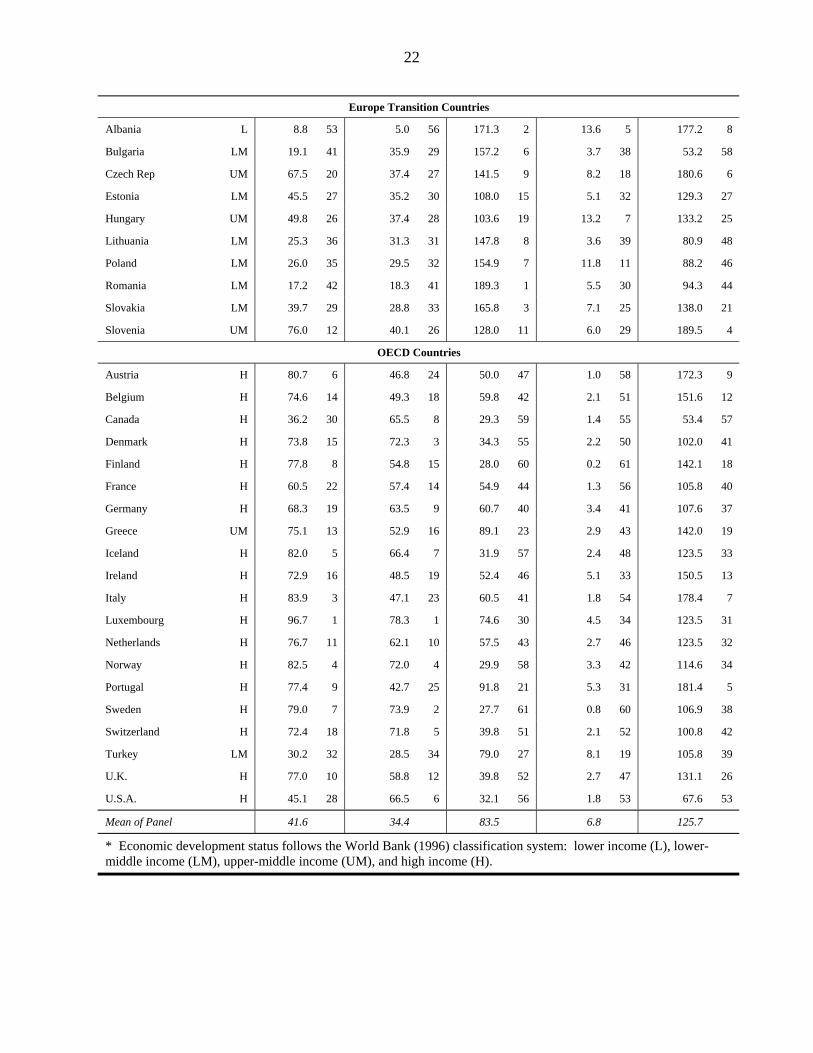
along with some summary statistics, are presented in Table 5.
various non-price factors (including convenience, mobility, and lifestyle issues) than by relative price differences alone. Second, the emergence of new flat-rated or “bucket” style pricing structures (which provide generous allowances of included “anytime and anywhere” minutes of use) have made per-minute usage prices less of a driver of demand for mobile services.
20 Although the ITU has published its 2002 update on telecommunications and economic indicators, data for 2001 are not yet available for a number of countries or series.

21
Table 5. Composition and Selected Telephony Statistics (in 2001) of 61-Country Panel Country Economic
Develop-ment
Status*
Cellular Density
R a n k
Teledensity R a n k
Cellular Density CAGR
R a n k
Teledensity CAGR
R a n k
Mobile Subscribers
per 100 Main Lines
R a n k
Asia-Pacific Countries
Australia H 57.6 25 52.0 17 43.6 49 1.2 57 111.0 36
China L 11.0 50 13.8 45 123.5 12 33.2 1 80.9 49
Hong Kong H 85.9 2 58.1 13 38.3 54 2.3 49 147.1 15
India L 0.6 61 3.4 60 105.9 18 17.2 3 18.8 61
Indonesia LM 3.1 59 3.7 59 68.6 36 18.2 2 66.7 54
Japan H 58.8 24 59.7 11 49.6 48 2.8 44 98.5 43
New Zealand H 59.9 23 47.1 22 39.1 53 0.8 59 124.8 30
Philippines LM 15.0 46 4.0 58 76.9 28 13.5 6 377.4 2
Singapore H 72.4 17 47.2 21 40.6 50 2.8 45 153.5 11
South Korea UM 62.1 21 47.6 20 70.1 34 4.0 37 127.8 28
Thailand LM 12.3 49 9.4 50 53.6 45 13.1 8 126.4 29
Latin American Countries
Argentina UM 19.3 40 21.6 39 80.0 26 8.0 20 86.0 47
Belize LM 16.1 44 14.4 44 74.1 31 4.2 36 111.4 35
Bolivia LM 9.0 52 6.0 54 103.5 20 7.4 23 144.5 16
Brazil UM 16.7 43 21.7 38 159.7 5 11.6 12 76.8 50
Chile UM 34.2 31 23.9 36 70.0 35 12.4 10 142.4 17
Colombia LM 7.6 54 17.1 42 66.0 38 8.6 17 44.7 59
Costa Rica LM 7.6 55 23.0 37 61.7 39 7.8 21 32.9 60
Dominican Rep LM 14.7 47 10.8 48 71.0 32 7.8 22 135.2 23
Ecuador LM 6.7 56 10.4 49 70.4 33 7.3 24 64.3 55
El Salvador LM 12.5 48 9.3 51 112.6 13 13.1 9 133.8 24
Guatemala LM 45.5 27 35.2 30 106.8 16 10.7 13 150.0 14
Honduras L 3.6 58 4.7 57 160.7 4 9.6 15 76.7 51
Jamaica LM 26.9 33 19.7 40 75.0 29 14.5 4 136.6 22
Mexico UM 21.7 37 13.7 46 68.4 37 7.1 26 158.0 10
Nicaragua L 3.0 60 3.3 61 110.1 14 9.2 16 90.2 45
Panama LM 20.7 38 14.8 43 140.0 10 4.4 35 139.5 20
Paraguay LM 20.4 39 5.1 55 106.4 17 6.1 28 398.2 1
Peru LM 5.9 57 7.8 52 83.1 25 10.4 14 76.4 52
Uruguay UM 15.5 45 28.3 35 89.1 22 7.0 27 54.7 56
Venezuela LM 26.4 34 11.2 47 85.2 24 3.6 40 235.3 3
22
Europe Transition Countries
Albania L 8.8 53 5.0 56 171.3 2 13.6 5 177.2 8
Bulgaria LM 19.1 41 35.9 29 157.2 6 3.7 38 53.2 58
Czech Rep UM 67.5 20 37.4 27 141.5 9 8.2 18 180.6 6
Estonia LM 45.5 27 35.2 30 108.0 15 5.1 32 129.3 27
Hungary UM 49.8 26 37.4 28 103.6 19 13.2 7 133.2 25
Lithuania LM 25.3 36 31.3 31 147.8 8 3.6 39 80.9 48
Poland LM 26.0 35 29.5 32 154.9 7 11.8 11 88.2 46
Romania LM 17.2 42 18.3 41 189.3 1 5.5 30 94.3 44
Slovakia LM 39.7 29 28.8 33 165.8 3 7.1 25 138.0 21
Slovenia UM 76.0 12 40.1 26 128.0 11 6.0 29 189.5 4
OECD Countries
Austria H 80.7 6 46.8 24 50.0 47 1.0 58 172.3 9
Belgium H 74.6 14 49.3 18 59.8 42 2.1 51 151.6 12
Canada H 36.2 30 65.5 8 29.3 59 1.4 55 53.4 57
Denmark H 73.8 15 72.3 3 34.3 55 2.2 50 102.0 41
Finland H 77.8 8 54.8 15 28.0 60 0.2 61 142.1 18
France H 60.5 22 57.4 14 54.9 44 1.3 56 105.8 40
Germany H 68.3 19 63.5 9 60.7 40 3.4 41 107.6 37
Greece UM 75.1 13 52.9 16 89.1 23 2.9 43 142.0 19
Iceland H 82.0 5 66.4 7 31.9 57 2.4 48 123.5 33
Ireland H 72.9 16 48.5 19 52.4 46 5.1 33 150.5 13
Italy H 83.9 3 47.1 23 60.5 41 1.8 54 178.4 7
Luxembourg H 96.7 1 78.3 1 74.6 30 4.5 34 123.5 31
Netherlands H 76.7 11 62.1 10 57.5 43 2.7 46 123.5 32
Norway H 82.5 4 72.0 4 29.9 58 3.3 42 114.6 34
Portugal H 77.4 9 42.7 25 91.8 21 5.3 31 181.4 5
Sweden H 79.0 7 73.9 2 27.7 61 0.8 60 106.9 38
Switzerland H 72.4 18 71.8 5 39.8 51 2.1 52 100.8 42
Turkey LM 30.2 32 28.5 34 79.0 27 8.1 19 105.8 39
U.K. H 77.0 10 58.8 12 39.8 52 2.7 47 131.1 26
U.S.A. H 45.1 28 66.5 6 32.1 56 1.8 53 67.6 53
Mean of Panel 41.6 34.4 83.5 6.8 125.7
* Economic development status follows the World Bank (1996) classification system: lower income (L), lower-middle income (LM), upper-middle income (UM), and high income (H).

23
Several qualifications to such a study should be noted at this point. First, although the
growth of mobile telephony has clearly become a global phenomenon, there remain strong
regional variations not only in market and regulatory environments but also in the growth
performance itself. This suggests that a thorough study of mobile telephony growth would
require digging deeper than merely conducting a quantitative analysis of an international panel
of data. Specific regional and sub-regional analyses would permit a better understanding of the
questions of substitution or complementarity with fixed network-based telephony and the
leapfrogging of technology where fixed networks remain underdeveloped. In fact, the studies
noted above that reached conclusions about whether mobile and fixed telephony are substitutes
or complements have almost all been based on country-specific data. While some accounting
for region-specific differences is attempted here, more granular analysis will need to be done.
Second, the greatest limitation on a study of this scope is with regard to the availability
of complete and reliable data. Although the ITU’s database on telecommunications and
economic indicators appears to be the best and most comprehensive repository of the requisite
data, there are still many legitimate questions about the quality and utility of those data. The
ITU’s database is an accumulation of responses from appropriate agencies within individual
countries to its annual request for specific data. This makes that database only as good as the
responses themselves, and there may be reasons to believe that not all countries supply data of
equal quality or validity. Also, missing data and gaps in time series, particularly in the early
years of mobile telephony, are fairly common across a wide range of countries. There are also
critical gaps in economic data such as on GDP and mobile telephony prices; e.g., we have been
unable to procure consistent price data for China, arguably a mobile telephony superpower. As
a result, the econometric analysis of international panel data is deprived of any input from
China’s remarkable growth performance in mobile telephony. Similar gaps in data have made
it necessary to exclude a large number of countries—in fact, the entire continent of Africa—
from the present analysis.
Third, perhaps the most critical limitation of the analysis as it currently stands is the
insufficient information available about the pricing regime (namely, CPP) and pricing structure
innovation (namely, prepaid services) that are hypothesized to have had significant impact on
the demand for mobile services. Although we model CPP as a binary variable (1 if in place, 0

24
if not), we do not presently have complete information on this variable for the period 1996-
2000 for all countries in our panel. Even more difficult is trying to represent prepaid services.
Unlike CPP, prepaid services cannot adequately be represented by a binary variable. This is
primarily because prepaid services come in many different flavors and their primary effect on
mobile telephony is through the effective prices which result from them, rather than from their
presence or absence per se.21
Finally, given the large number of countries involved in the panel, there is not enough
information to construct purchasing power parity (PPP) price series for each individual country.
Only such PPP price series can reflect the true burden of mobile service prices for the local
population (relative to local income and cost-of-living standards). As such, the best we have
been able to do is to convert all nominal country-specific prices into real such prices (by
deflating them using country-specific price indices) and convert them again into US dollar-
equivalent prices using the currency exchange rate against the US dollar that prevailed in 1995
for each country in the panel.22
Despite these limitations, we believe that some useful insights into the growth of mobile
telephony globally can be obtained from a study of this sort. Our aim is to continue refining
the analysis, as the quality and availability of the requisite data both improve.
5. Data Annual data from the 61 selected countries were collected for the 1996-2000 period on
the following variables:
Cellular density (CELLDEN)
Annual percent change in cellular density (CELLDENGR)
Real gross domestic product per capita, in 1995 $US (GDPPC)
Waiting list as percent of main lines in operation plus waiting list (WAITPCT)
21 OECD (2000, pp. 56-62). 22 It may be comforting to find that, say, the peak hour price of mobile calling (where per-use pricing remains in
effect) in country A is approximately the same (in US dollar-equivalent terms) as that in country B, half way across the globe. However, the burden that such a price represents on consumers in the two countries may be quite different if income levels and general costs of living vary substantially between them. This, in turn, could produce very different demand responses.

25
Separate regulator: 1 if country has a telecom regulator that is separate from any branch of government (even if not completely independent), 0 otherwise (SEPREG)
Calling Party Pays: 1 if country has CPP, 0 otherwise (CPP)
Interaction regional binary: 1 if country has CPP and is in Asia-Pacific region, 0 otherwise (CPPAP)
Interaction regional binary: 1 if country has CPP and is in Latin American region, 0 otherwise (CPPLA)
Interaction regional binary: 1 if country has CPP and is in OECD region, 0 otherwise (CPPOECD)23
Prepaid service: 1 if country has prepaid service, 0 otherwise (PREPAID)
Interaction regional binary: 1 if country has prepaid service and is in Asia-Pacific region, 0 otherwise (PPDAP)
Interaction regional binary: 1 if country has prepaid service and is in Latin American region, 0 otherwise (PPDLA)
Interaction regional binary: 1 if country has prepaid service and is in OECD region, 0 otherwise (PPDOECD)24
Because of our interest in the growth rate of cellular density in the countries in our
panel, CELLDENGR was selected for study as the dependent variable.25 Corresponding to this
dependent variable, CELLDEN was selected as a proxy for the existing state of mobile
telephony.26 The rest of the variables were chosen as our other explanatory variables following
our prior discussion of the likely determinants of mobile telephony growth. Thus, WAITPCT
was used as a measure of the quality of the fixed network. GDPPC was a measure of average
personal income and affordability. SEPREG was a binary variable representing the regulatory
structure, and CPP and PREPAID were binary variables selected to represent market (or, more
23 An interaction regional binary was not necessary for the remaining region, the European transition countries,
chosen to be the default region. Only three binaries are needed for the four regions, i.e., the case of the European transition countries corresponds to CPP. Also, binaries for three of the four regions were considered but dropped for reasons explained later.
24 Only three binaries are needed for the four regions, i.e., the case of the European transition countries—the default region—corresponds to PREPAID.
25 In addition, we also explored mobile connections as a percent of all (i.e., mobile plus main line) connections as an alternate dependent variable. We do not report results for that variable here because our basic conclusions were not altered.
26 More precisely, one-year lagged values of this variable were used to avoid the problem of joint endogeneity with CELLDENGR. Thus, the lagged values served as instruments for the contemporaneous values of CELLDEN.

26
specifically, pricing) structure.27 Finally, CPPAP, CPPLA, and CPPOECD were interaction
binaries for the presence of CPP in the Asia-Pacific, Latin American, and OECD regions,
respectively, while PPDAP, PPDLA, and PPDOECD were similar interaction binaries for the
presence of prepaid services in the three regions. As noted earlier, GDPPC was stated in
constant 1995 U.S. dollars.
6. Econometric Model and Results
6.1. Model Specification and Estimation We estimated a panel data econometric model by a variety of estimation techniques
using annual data for the 61 countries during 1996-2000.28 Specifically, we hypothesized a
random effects model which allows for country-specific effects qualifying the overall constant
term, where those effects are randomly distributed according to a known distribution (usually
the Gaussian) and have a zero mean and constant variance.29 In general, this model is of the
form:
(1) itiitity εµβα +++= x
where is the dependent variable indexed over i (country) and t (year), is the vector of
explanatory variables (including the binary variables),
ity itx
β is the vector of coefficients, iµ are the
random effects with a specified distribution (typically Gaussian) with zero mean and a constant
variance, and itε is a zero-mean, constant variance disturbance assumed to be uncorrelated with
the random effects.30
27 At this stage of model development, it was not possible to represent adequately the impact of prepaid services.
Data on such services (initiation date, type of prepaid service, etc.) are incomplete and unreliable for our country panel at present. Introducing complete measures of prepaid services into our econometric model must await improvements in the quality of data.
28 All estimation and subsequent specification testing was done using the STATA© , Version 7 software. 29 When a Gaussian distribution is assumed, it is entirely characterized by two parameters, namely, the mean and
the variance. 30 This assumption of uncorrelatedness can be tested by use of the standard Hausman (1978) specification test or
the Baltagi and Li (1990) version of the Breusch-Pagan test for random effects.
27
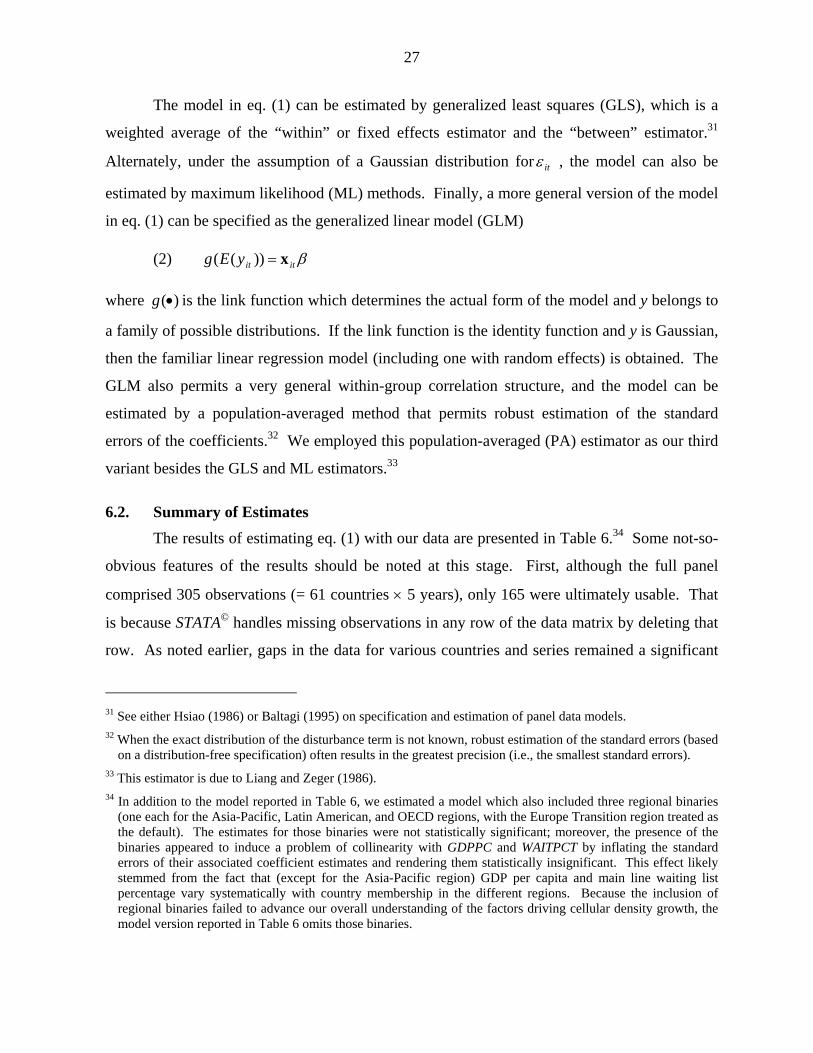
The model in eq. (1) can be estimated by generalized least squares (GLS), which is a
weighted average of the “within” or fixed effects estimator and the “between” estimator.31
Alternately, under the assumption of a Gaussian distribution for itε , the model can also be
estimated by maximum likelihood (ML) methods. Finally, a more general version of the model
in eq. (1) can be specified as the generalized linear model (GLM)
(2) βitityEg x=))((
where is the link function which determines the actual form of the model and y belongs to
a family of possible distributions. If the link function is the identity function and y is Gaussian,
then the familiar linear regression model (including one with random effects) is obtained. The
GLM also permits a very general within-group correlation structure, and the model can be
estimated by a population-averaged method that permits robust estimation of the standard
errors of the coefficients.
)(•g
32 We employed this population-averaged (PA) estimator as our third
variant besides the GLS and ML estimators.33
6.2. Summary of Estimates The results of estimating eq. (1) with our data are presented in Table 6.34 Some not-so-
obvious features of the results should be noted at this stage. First, although the full panel
comprised 305 observations (= 61 countries × 5 years), only 165 were ultimately usable. That
is because STATA© handles missing observations in any row of the data matrix by deleting that
row. As noted earlier, gaps in the data for various countries and series remained a significant
31 See either Hsiao (1986) or Baltagi (1995) on specification and estimation of panel data models. 32 When the exact distribution of the disturbance term is not known, robust estimation of the standard errors (based
on a distribution-free specification) often results in the greatest precision (i.e., the smallest standard errors). 33 This estimator is due to Liang and Zeger (1986). 34 In addition to the model reported in Table 6, we estimated a model which also included three regional binaries
(one each for the Asia-Pacific, Latin American, and OECD regions, with the Europe Transition region treated as the default). The estimates for those binaries were not statistically significant; moreover, the presence of the binaries appeared to induce a problem of collinearity with GDPPC and WAITPCT by inflating the standard errors of their associated coefficient estimates and rendering them statistically insignificant. This effect likely stemmed from the fact that (except for the Asia-Pacific region) GDP per capita and main line waiting list percentage vary systematically with country membership in the different regions. Because the inclusion of regional binaries failed to advance our overall understanding of the factors driving cellular density growth, the model version reported in Table 6 omits those binaries.

28
obstacle throughout the analysis. The result of such row deletion is, of course, to create an
unbalanced panel; fortunately, the software and the estimation techniques used are equipped to
handle unbalanced panels.35 As the quality and availability of data both improve, the stability
of the results obtained here can be assessed by using more observations.
Second, the three estimation techniques for random effects panel data models deliver
generally similar and stable coefficient estimates. As expected, however, the ML and PA
techniques yield lower standard errors of the coefficient estimates and boost z-statistics (and
associated probability values). The results obtained from either of these two techniques may be
used to draw conclusions about the state of international mobile telephony.
35 See Hsiao (1986) or Wooldridge (2002) for details on estimation from unbalanced panels.

29
Table 6. Results of Estimation of Panel Data Model
Dependent Variable: CELLDENGR Estimation Technique
Explanatory Variable PA ML GLS CELLDEN (lagged) -0.0063***
(-3.84) -0.0063*** (-3.84)
-0.0061*** (-3.54)
GDPPC -0.0000** (-2.06)
-0.0000** (-2.06)
-0.0000* (-1.84)
WAITPCT 0.7784** (2.46)
0.7788** (2.46)
0.8198** (2.40)
SEPREG -0.1307*** (-2.60)
-0.1307*** (-2.60)
-0.1290** (-2.38)
CPP -0.1794 (-1.56)
-0.1794 (-1.56)
-0.1797 (-1.48)
CPPLA 0.1532 (1.26)
0.1533 (1.26)
0.1589 (1.23)
CPPAP 0.0606 (0.43)
0.0607 (0.43)
0.0695 (0.47)
CPPOECD 0.3322*** (2.61)
0.3321*** (2.61)
0.3233** (2.38)
PREPAID 0.3213*** (2.76)
0.3211*** (2.76)
0.3060** (2.52)
PPDLA -0.4028*** (-3.04)
-0.4027*** (-3.03)
-0.3920*** (-2.83)
PPDAP -0.1894 (-1.35)
-0.1895 (-1.35)
-0.1913 (-1.30)
PPDOECD -0.2622** (-2.02)
-0.2619** (-2.01)
-0.2426* (-1.79)
CONSTANT 0.6947*** (8.11)
0.6947*** (8.10)
0.6914*** (7.51)
No. of Observations 165 165 165
Wald /Likelihood Ratio (d.f.) 2χ 100.80*** (12)
78.58*** (12)
82.89*** (12)
Note: z-statistics reported in parentheses. Starred coefficient estimates are statistically significant at the 1% level (***), 5% level (**), and 10% level (*), respectively.
Finally, despite the data limitations, the asymptotic test statistics for judging model fit
(namely, the Wald and likelihood ratio statistics) are all highly statistically significant (at the 1
percent level) signifying a generally good fit of the specified model to the data, regardless of
30
the estimation technique used. Also, the estimates prove robust to alternative assumptions
about error structure, including AR(1) and general stationarity.
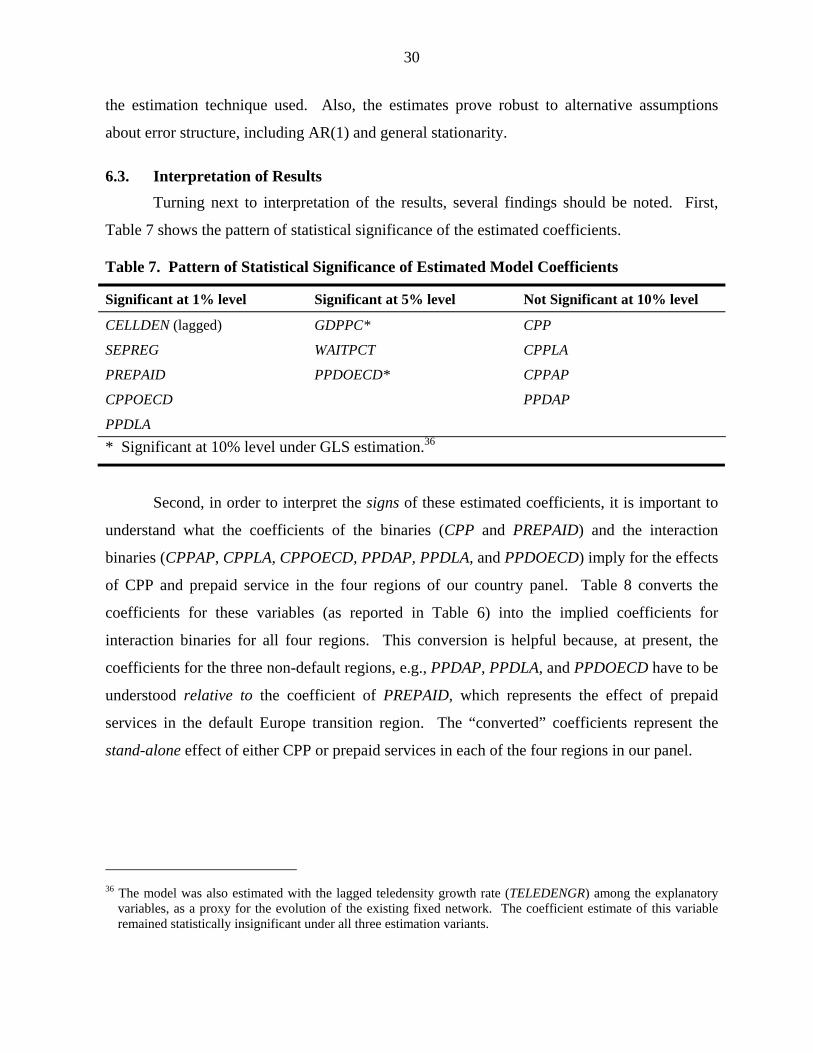
6.3. Interpretation of Results Turning next to interpretation of the results, several findings should be noted. First,
Table 7 shows the pattern of statistical significance of the estimated coefficients.
Table 7. Pattern of Statistical Significance of Estimated Model Coefficients
Significant at 1% level Significant at 5% level Not Significant at 10% level
CELLDEN (lagged) GDPPC* CPP
SEPREG WAITPCT CPPLA
PREPAID PPDOECD* CPPAP
CPPOECD PPDAP
PPDLA * Significant at 10% level under GLS estimation.36
Second, in order to interpret the signs of these estimated coefficients, it is important to
understand what the coefficients of the binaries (CPP and PREPAID) and the interaction
binaries (CPPAP, CPPLA, CPPOECD, PPDAP, PPDLA, and PPDOECD) imply for the effects
of CPP and prepaid service in the four regions of our country panel. Table 8 converts the
coefficients for these variables (as reported in Table 6) into the implied coefficients for
interaction binaries for all four regions. This conversion is helpful because, at present, the
coefficients for the three non-default regions, e.g., PPDAP, PPDLA, and PPDOECD have to be
understood relative to the coefficient of PREPAID, which represents the effect of prepaid
services in the default Europe transition region. The “converted” coefficients represent the
stand-alone effect of either CPP or prepaid services in each of the four regions in our panel.
36 The model was also estimated with the lagged teledensity growth rate (TELEDENGR) among the explanatory
variables, as a proxy for the evolution of the existing fixed network. The coefficient estimate of this variable remained statistically insignificant under all three estimation variants.

31
Table 8. Original and Converted Coefficients for CPP and Prepaid Service Binaries
Original Coefficients Converted Coefficients
CPP -0.1794 CPPET -0.1794
CPPAP 0.0606 CPPAP -0.1188
CPPLA 0.1532 CPPLA -0.0261
CPPOECD 0.3322 CPPOECD 0.1528
PREPAID 0.3213 PPDET 0.3213
PPDAP -0.1894 PPDAP 0.1318
PPDLA -0.4028 PPDLA -0.0815
PPDOECD -0.2622 PPDOECD 0.0591
In Table 8, the “original” coefficients are taken from Table 6, which contains estimates
from a model in which CPP and PREPAID represent CPP and prepaid services, respectively, in
the default Europe transition countries. The “converted” coefficients are obtained as the sum of
the original coefficient for CPP (or PREPAID) and the original coefficient of each of the
interaction binaries.37 Note that the converted coefficients for the CPP interaction binaries are
negative in three out of four regions, signifying a possible inability of CPP to stimulate cellular
density growth in those regions. Only the OECD countries appear to have experienced such
stimulation as a result of CPP. Similarly, note that the converted coefficients for the PREPAID
interaction binaries are positive in three out of four regions, signifying a possible boost from
prepaid services to cellular density growth in those regions. Only the Latin American region
seems not to have benefited as expected from prepaid services. Significantly, only the OECD
region appears to have benefited from both CPP and prepaid services.
On its face, a negative effect of CPP would run counter to the school of thought that
credits CPP with expanding demand for mobile telephony. On the other hand, there are several
reasons (some of which were noted earlier) for CPP to produce either an opposite effect or no
37 Thus, the converted coefficient of CPPAP (representing the stand-alone effect of CPP in the Asia-Pacific
region) is the sum of –0.1794 (the original coefficient of CPP) and 0.0606 (the original coefficient of CPPAP). Similarly, the converted coefficient of PPDOECD (representing the stand-alone effect of prepaid services in the OECD region) is the sum of 0.3213 (the original coefficient of PREPAID) and –0.2622 (the original coefficient of PPDOECD).
32
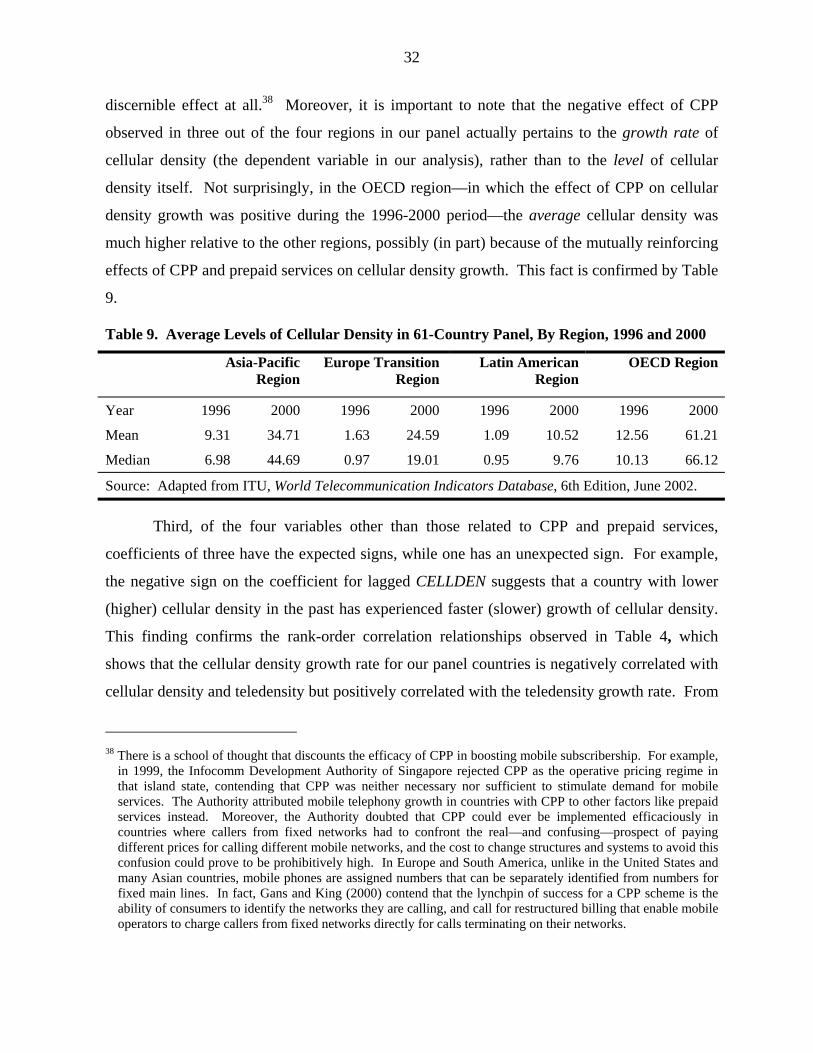
discernible effect at all.38 Moreover, it is important to note that the negative effect of CPP
observed in three out of the four regions in our panel actually pertains to the growth rate of
cellular density (the dependent variable in our analysis), rather than to the level of cellular
density itself. Not surprisingly, in the OECD region—in which the effect of CPP on cellular
density growth was positive during the 1996-2000 period—the average cellular density was
much higher relative to the other regions, possibly (in part) because of the mutually reinforcing
effects of CPP and prepaid services on cellular density growth. This fact is confirmed by Table
9.
Table 9. Average Levels of Cellular Density in 61-Country Panel, By Region, 1996 and 2000
Asia-Pacific Region
Europe Transition Region
Latin American Region
OECD Region
Year 1996 2000 1996 2000 1996 2000 1996 2000
Mean 9.31 34.71 1.63 24.59 1.09 10.52 12.56 61.21
Median 6.98 44.69 0.97 19.01 0.95 9.76 10.13 66.12
Source: Adapted from ITU, World Telecommunication Indicators Database, 6th Edition, June 2002.
Third, of the four variables other than those related to CPP and prepaid services,
coefficients of three have the expected signs, while one has an unexpected sign. For example,
the negative sign on the coefficient for lagged CELLDEN suggests that a country with lower
(higher) cellular density in the past has experienced faster (slower) growth of cellular density.
This finding confirms the rank-order correlation relationships observed in Table 4, which
shows that the cellular density growth rate for our panel countries is negatively correlated with
cellular density and teledensity but positively correlated with the teledensity growth rate. From
38 There is a school of thought that discounts the efficacy of CPP in boosting mobile subscribership. For example,
in 1999, the Infocomm Development Authority of Singapore rejected CPP as the operative pricing regime in that island state, contending that CPP was neither necessary nor sufficient to stimulate demand for mobile services. The Authority attributed mobile telephony growth in countries with CPP to other factors like prepaid services instead. Moreover, the Authority doubted that CPP could ever be implemented efficaciously in countries where callers from fixed networks had to confront the real—and confusing—prospect of paying different prices for calling different mobile networks, and the cost to change structures and systems to avoid this confusion could prove to be prohibitively high. In Europe and South America, unlike in the United States and many Asian countries, mobile phones are assigned numbers that can be separately identified from numbers for fixed main lines. In fact, Gans and King (2000) contend that the lynchpin of success for a CPP scheme is the ability of consumers to identify the networks they are calling, and call for restructured billing that enable mobile operators to charge callers from fixed networks directly for calls terminating on their networks.
33
this, we infer that cellular density growth rates tend to be highest in countries (1) where the use
of telephony in any form is generally low to begin with, and (2) in which the predominant
tactical direction for the growth of telephony has been to allow mobile networks to leapfrog
fixed networks that are more expensive and slower to deploy. In addition, there is a
“diminishing returns” or saturation effect in countries (such as those in the OECD) in which
both cellular density and teledensity have both achieved relatively high levels. The cellular
density growth rate tends to be low in those countries.
Similarly, the sign of the estimate for GDPPC is also negative, signifying that, over the
observed period, the fastest (slowest) growth in the cellular density has occurred in countries
with the lowest (highest) per capita GDP. This indicates that countries that are less affluent or
developed (as measured by the GDP per capita) have relied more on mobile than on fixed
networks to meet their telephony needs, resulting in relatively high cellular density growth rates
in those countries.39
Finally, as expected, longer waiting lists tend to boost the cellular density growth rate as
customers waiting for main line connections opt for mobile service instead. This is confirmed
by the positive sign on the coefficient for WAITPCT. This is additional evidence supporting
earlier research findings that countries with inferior fixed networks or cost-impeded in their
efforts to deploy ubiquitous fixed networks have decided to accelerate the deployment of
mobile networks instead.
In contrast to the signs of coefficients for lagged CELLDEN, GDPPC, AND WAITPCT,
the coefficient of SEPREG is statistically significant but has a negative sign. In light of our
earlier discussion, this was not entirely unexpected, although we did expect that countries with
independent or, at least, separate regulators would likely create market and regulatory
environments favoring faster mobile telephony growth. However, because our variable could
not distinguish between separate regulators that were independent and those that were not, the
finding may simply express information about the effectiveness (or lack thereof) of regulation
39 Although GDP per capita is not the only, or even the best, indicator of the economic development status of a
country, there is little consensus on how that status can be captured by a single measure or index. As in Table 5, we follow the World Bank in its long-standing practice of using the GDP per capita for classifying countries according to their economic development status.
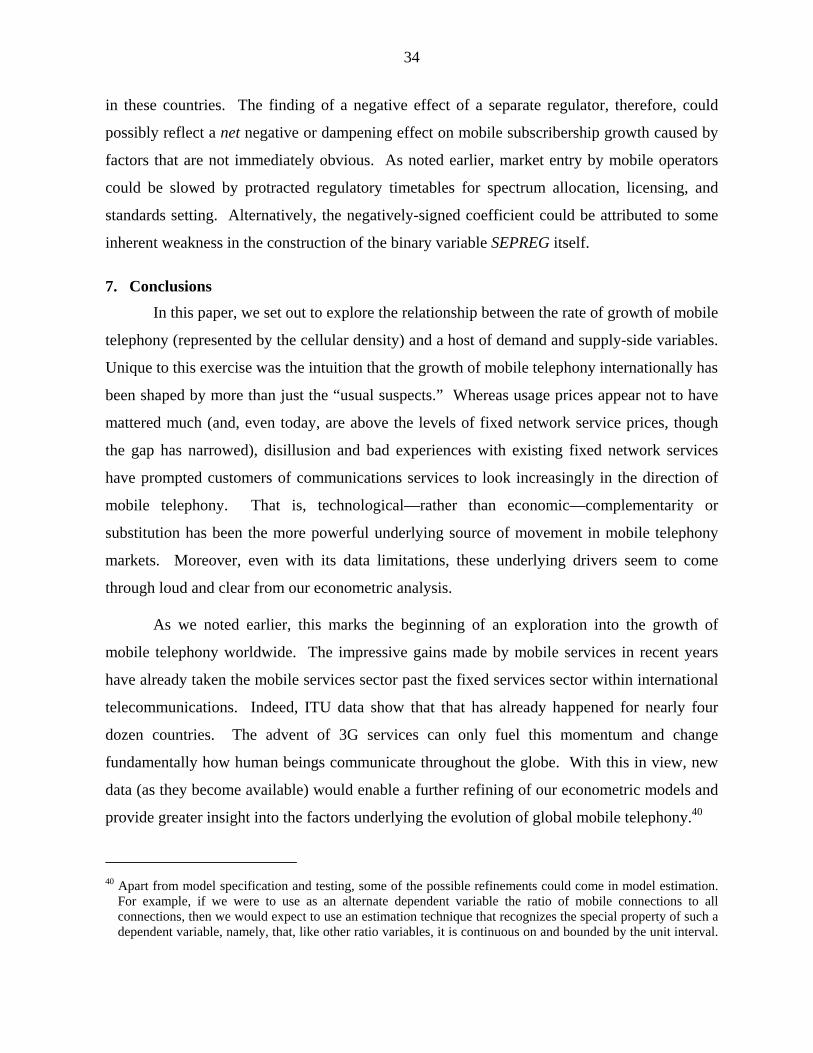
34
in these countries. The finding of a negative effect of a separate regulator, therefore, could
possibly reflect a net negative or dampening effect on mobile subscribership growth caused by
factors that are not immediately obvious. As noted earlier, market entry by mobile operators
could be slowed by protracted regulatory timetables for spectrum allocation, licensing, and
standards setting. Alternatively, the negatively-signed coefficient could be attributed to some
inherent weakness in the construction of the binary variable SEPREG itself.
7. Conclusions
In this paper, we set out to explore the relationship between the rate of growth of mobile
telephony (represented by the cellular density) and a host of demand and supply-side variables.
Unique to this exercise was the intuition that the growth of mobile telephony internationally has
been shaped by more than just the “usual suspects.” Whereas usage prices appear not to have
mattered much (and, even today, are above the levels of fixed network service prices, though
the gap has narrowed), disillusion and bad experiences with existing fixed network services
have prompted customers of communications services to look increasingly in the direction of
mobile telephony. That is, technological—rather than economic—complementarity or
substitution has been the more powerful underlying source of movement in mobile telephony
markets. Moreover, even with its data limitations, these underlying drivers seem to come
through loud and clear from our econometric analysis.
As we noted earlier, this marks the beginning of an exploration into the growth of
mobile telephony worldwide. The impressive gains made by mobile services in recent years
have already taken the mobile services sector past the fixed services sector within international
telecommunications. Indeed, ITU data show that that has already happened for nearly four
dozen countries. The advent of 3G services can only fuel this momentum and change
fundamentally how human beings communicate throughout the globe. With this in view, new
data (as they become available) would enable a further refining of our econometric models and
provide greater insight into the factors underlying the evolution of global mobile telephony.40
40 Apart from model specification and testing, some of the possible refinements could come in model estimation.
For example, if we were to use as an alternate dependent variable the ratio of mobile connections to all connections, then we would expect to use an estimation technique that recognizes the special property of such a dependent variable, namely, that, like other ratio variables, it is continuous on and bounded by the unit interval.
35
References Ahn, Hyungtaik and Myeong-Ho Lee, “An Econometric Analysis of the Demand for Access to Mobile Telephone Networks,” Information Economics and Policy, 11, 297-305, 1999.
Arellano, M. and S. Bond, “Some Tests of Specification for Panel Data: Monte Carlo Evidence and an Application to Employment Equations,” Review of Economic Studies, 58, 277-297, 1991.
Baltagi, Badi H., Econometric Analysis of Panel Data, New York: John Wiley & Sons, 1995.
Baltagi, Badi H. and Qi Li, “A Lagrange Multiplier Test for the Error Components Model with Incomplete Panels,” Econometric Reviews, 9, 103-107, 1990.
Banerjee, Aniruddha and Agustin J. Ros, “Patterns in Global Fixed and Mobile Telecommunications Development: A Cluster Analysis,” Telecommunications Policy (forthcoming).
Cadima, N. and P.P. Barros, “The Impact of Mobile Phone Diffusion on the Fixed-link Network,” Discussion Paper DP2598, Center for Economic Policy Research, London, 2000.
Gans, Joshua S. and Stephen P. King, “Mobile Network Competition, Customer Ignorance and Fixed-to-Mobile Call Prices,” Information Economics and Policy, 12, 301-327, 2000.
Gruber, Harald, “An Investment View of Mobile Telecommunications in the European Union,” Telecommunications Policy, 23, 521-538, 1999.
Gruber, Harald, “Competition and Innovation: The Diffusion of Mobile Telecommunications Services in Central and Eastern Europe,” Information Economics and Policy, 13, 19-34, 2001.
Gruber, Harald and Frank Verboven, “The Evolution of Markets Under Entry and Standards Regulation—The Case of Global Mobile Telecommunications,” Centre for Economic Policy Research Working Paper No. DP2440 (revised), 2001a.
Gruber, Harald and Frank Verboven, “The Diffusion of Mobile Telecommunications Services in the European Union,” European Economic Review, 45, 577-588, 2001b.
Gutierrez, Luis H. and Sanford Berg, “Telecommunications Liberalization and Regulatory Governance: Lessons from Latin America,” Telecommunications Policy, 24, 865-884, 2000.
Hamilton, Jacqueline, “Are Main Lines and Mobile Phones Substitutes or Complements? Evidence from Africa,” Telecommunications Policy, 27, 109-133, 2003.
Hausman, Jerry A., “Specification Tests in Econometrics,” Econometrica, 46, 1251-1271, 1978.
Hsiao, Cheng, Analysis of Panel Data, New York: Cambridge University Press, 1986.
In these circumstances, a modified panel data estimator employing quasi-maximum likelihood methods has been proposed by Papke and Wooldridge (1996). Moreover, if dynamics were to be introduced into the model through a lagged dependent variable, then the proper instrumental variable estimator for the panel data model would be the one proposed by Arellano and Bond (1991).

36
International Telecommunication Union, World Telecommunication Indicators Database, 6th Edition, June 2002.
Jha, Raghbendra and Sumit K. Majumdar, “A Matter of Connections: OECD Telecommunications Sector Productivity and the Role of Cellular Technology Diffusion,” Information Economics and Policy, 11, 243-269, 1999.
Kim, Jeong-Yoo and Yoonsung Lim, “An Economic Analysis of the Receiver Pays Principle,” Information Economics and Policy, 13, 231-260, 2001.
Levy, Brian and Pablo T. Spiller, Regulations, Institutions, and Commitment: Comparative Studies of Telecommunications, New York: Cambridge University Press, 1996.
Liang, K.-Y. and S.L. Zeger, “Longitudinal Data Analysis Using Generalized Linear Models,” Biometrika, 73, 13-22, 1986.
Madden, Gary and Grant Coble-Neal, “Economic Determinants of Global Mobile Telephony Growth,” Curtin University of Technology, presented at the International Telecommunications Society’s Asia-Australasian Regional Conference, Perth, Australia, June 22-24, 2003.
OECD, Cellular Mobile Pricing Structures and Trends, DSTI/ICCP/TISP(99)11/ FINAL, May 19, 2000.
Okada, Yosuke and Hatta Keiko, “The Interdependent Telecommunications Demand and Efficient Price Structure, Journal of the Japanese and International Economies, 13, 311-335, 1999.
Papke, Leslie E. and Jeffrey M. Wooldridge, “Econometric Methods for Fractional Response Variables with an Application to 401(K) Plan Participation Rates,” Journal of Applied Econometrics, 11, 619-632, 1996.
Rodini, Mark, Michael R. Ward, and Glenn A. Woroch, “Going Mobile: Substitutability Between Fixed and Mobile Access,” Working Paper, prepared for the Conference on “Competition in Wireless: Spectrum, Service and Technology Wars,” organized by the Public Utility Research Center at the University of Florida, Gainesville, February 2002.
Ros, Agustin J. and Aniruddha Banerjee, “Telecommunications Privatization and Tariff Rebalancing: Evidence from Latin America,” Telecommunications Policy, 24, 233-252, 2000.
Rossotto, Carlo Maria, Michel Kerf, and Jeffrey Rohlfs, “Competition in Mobile Telecommunications: Sector Growth, Benefits for the Incumbent Trade Policy,” Info, 2, 67-73, 2000.
Sheshkin, David J., Handbook of Parametric and Nonparametric Statistical Procedures, 2nd edition, New York: Chapman & Hall/CRC, 2000.
Sung, Nakil and Yong Hun Lee, “Substitution between Mobile and Fixed Telephones in Korea,” Review of Industrial Organization, 20, 367-374, 2002.
Sung, Nakil, C Kim and Y. Lee, “Is POTS Dispensable? Substitution Effects Between Mobile and Fixed Telephones in Korea,” paper presented at the 76th Annual Western Economic Association International Conference, July 2001.

37
Wallsten, Scott J. “An Econometric Analysis of Telecom Competition, Privatization, and Regulation in Africa and Latin America,” Journal of Industrial Economics, 49, 1-19, 2001.
Wooldridge, Jeffrey M., Econometric Analysis of Cross Section and Panel Data, Cambridge, MA: The MIT Press, 2002.
World Bank, Social Indicators of Development. Available from http://www-wds.worldbank.org/servlet/WDSContentServer/WDSP/IB/1996/04/01/000009265_3970128130330/Rendered/PDF/multi_page.pdf, 1996.

For further information, pleasevisit our global website at:
www.nera.com
© Copyright 2004National Economic Research Associates, Inc.
All rights reserved.