Driver Status and Implications for Crash Safetydriving/publications/GreenConvergence3dPG.pdfwarning...
17
Paper Number 2006-21-0028 Driver Status and Implications for Crash Safety Paul Green University of Michigan Transportation Research Institute Copyright © 2006 CTEA ABSTRACT Almost a million people are killed worldwide each year in motor vehicle crashes, over 42,000 of them in the U.S. Human/driver error (or induced error) is the most commonly identified contributing cause according to crash studies, especially studies conducted in the U.S. Accordingly, if crashes are to be reduced, a human- centered approach is needed. As part of its Intelligent Transportation Systems program, the U.S. Department of Transportation (U.S. DOT) is funding several major projects (e.g., VII, IVBSS) concerned with active safety, warnings, and communications. As part of these and other projects, several meta-issues have arisen that deserve further attention. These pertain to: (1) what additional information would drivers want to know, or could drivers use about the driving situation, (2) presentation of the driving situation and warnings to drivers, (3) and (4) determining the processing time and detection performance for the entire warning system including the driver, (5) modeling driver responses to warnings, (6) driver distraction detection and warning presentation, and (7) models of driver performance. WHY DO HUMAN FACTORS ASPECTS OF ACTIVE SAFETY DESERVE ATTENTION? Note: In this paper, consistent with other papers at this conference, driver status refers to driver characteristics and driver performance. This meaning is broader than is typical in the literature. FACT 1: AROUND 1 MILLION PEOPLE WORDWIDE ARE KILLED EACH YEAR IN MOTOR VEHICLE CRASHES. In the U.S., motor vehicle crashes are the leading cause of death for those between the ages of 3 and 33 (Subramanian, 2005). In 2004, the U.S. Department of Transportation estimates that 42,414 people died as a result of motor vehicle crashes (U.S. Department of Transportation, 2005). A good, reasonably recent estimate is that between 750,000 and 880,000 people died in motor vehicle crashes worldwide in 1999, and that most deaths occurred in less motorized countries. By 2010, the number of deaths resulting from motor vehicle crashes is expected to be between 900,000 and 1.1 million, and by 2020, between 1.1 million and 1.3 million (Jacobs, Aeron-Thomas, and Astrop, 2000). Given this information, it is very apparent that motor vehicle crashes are a major national and international problem. Hence, it is very appropriate that this conference has a session entitled “Reinventing Safety Systems,” which focuses on “enablers.” Webster’s New World Dictionary of the American Language defines enable as “1. to make able; provide with means, opportunity, power, or authority (to do something)” (World Publishing Company, 1960). Other papers in this session deal with sensing devices, crash avoidance systems, sensing algorithms, diagnostics, and secure communications among system elements, all of which enable the reduction of crashes. However, this paper explores the human element and the question: “What needs to be known about drivers to enable advances in driving safety?” FACT 2: HUMAN ERROR OR INDUCED ERROR IS THE LEADING CONTRIBUTING CAUSE OF CRASHES. Crash causes are often quite difficult to identify. When crash causes can be identified, such as in the classic Tri-Level Study (Treat, Tumbas, McDonald, Shinar, Hume, Mayer, Stansifer, and Castellan, 1979, 1977a, b), terms such as “human error” or “human element” are named as a contributing factor in up to 90% of all crashes. There have been several more recent studies of crash causes, such as the Hurt et al. report on motorcycles (Hurt, Ouellet, and Thom, 1981a, b; Hurt, 1980), the University of Michigan Transportation Research Institute’s (UMTRI’s) work on large truck crash causation (Blower and Campbell, 2002), and the 100-car report (Neale, Dingus, Klauer, and Goodman, 2005). These studies have come to similar conclusions about “human error” or the “human element’s” contribution to crash causes when driver, vehicle, and environment factors are separated. Current work as part of the EU TRACE Project (European Union Traffic Accident Causation in Europe, http://www.tno.nl/bouw_en_ondergrond/markten/verkeer
Transcript of Driver Status and Implications for Crash Safetydriving/publications/GreenConvergence3dPG.pdfwarning...

Paper Number 2006-21-0028
Driver Status and Implications for Crash Safety
Paul Green University of Michigan Transportation Research Institute
Copyright © 2006 CTEA
ABSTRACT
Almost a million people are killed worldwide each year in motor vehicle crashes, over 42,000 of them in the U.S. Human/driver error (or induced error) is the most commonly identified contributing cause according to crash studies, especially studies conducted in the U.S. Accordingly, if crashes are to be reduced, a human-centered approach is needed.
As part of its Intelligent Transportation Systems program, the U.S. Department of Transportation (U.S. DOT) is funding several major projects (e.g., VII, IVBSS) concerned with active safety, warnings, and communications. As part of these and other projects, several meta-issues have arisen that deserve further attention. These pertain to: (1) what additional information would drivers want to know, or could drivers use about the driving situation, (2) presentation of the driving situation and warnings to drivers, (3) and (4) determining the processing time and detection performance for the entire warning system including the driver, (5) modeling driver responses to warnings, (6) driver distraction detection and warning presentation, and (7) models of driver performance.
WHY DO HUMAN FACTORS ASPECTS OF ACTIVE SAFETY DESERVE ATTENTION?
Note: In this paper, consistent with other papers at this conference, driver status refers to driver characteristics and driver performance. This meaning is broader than is typical in the literature.
FACT 1: AROUND 1 MILLION PEOPLE WORDWIDE ARE KILLED EACH YEAR IN MOTOR VEHICLE CRASHES.
In the U.S., motor vehicle crashes are the leading cause of death for those between the ages of 3 and 33 (Subramanian, 2005). In 2004, the U.S. Department of Transportation estimates that 42,414 people died as a result of motor vehicle crashes (U.S. Department of Transportation, 2005). A good, reasonably recent estimate is that between 750,000 and 880,000 people died in motor vehicle crashes worldwide in 1999, and
that most deaths occurred in less motorized countries. By 2010, the number of deaths resulting from motor vehicle crashes is expected to be between 900,000 and 1.1 million, and by 2020, between 1.1 million and 1.3 million (Jacobs, Aeron-Thomas, and Astrop, 2000). Given this information, it is very apparent that motor vehicle crashes are a major national and international problem. Hence, it is very appropriate that this conference has a session entitled “Reinventing Safety Systems,” which focuses on “enablers.” Webster’s New World Dictionary of the American Language defines enable as “1. to make able; provide with means, opportunity, power, or authority (to do something)” (World Publishing Company, 1960). Other papers in this session deal with sensing devices, crash avoidance systems, sensing algorithms, diagnostics, and secure communications among system elements, all of which enable the reduction of crashes. However, this paper explores the human element and the question: “What needs to be known about drivers to enable advances in driving safety?”
FACT 2: HUMAN ERROR OR INDUCED ERROR IS THE LEADING CONTRIBUTING CAUSE OF CRASHES.
Crash causes are often quite difficult to identify. When crash causes can be identified, such as in the classic Tri-Level Study (Treat, Tumbas, McDonald, Shinar, Hume, Mayer, Stansifer, and Castellan, 1979, 1977a, b), terms such as “human error” or “human element” are named as a contributing factor in up to 90% of all crashes. There have been several more recent studies of crash causes, such as the Hurt et al. report on motorcycles (Hurt, Ouellet, and Thom, 1981a, b; Hurt, 1980), the University of Michigan Transportation Research Institute’s (UMTRI’s) work on large truck crash causation (Blower and Campbell, 2002), and the 100-car report (Neale, Dingus, Klauer, and Goodman, 2005). These studies have come to similar conclusions about “human error” or the “human element’s” contribution to crash causes when driver, vehicle, and environment factors are separated. Current work as part of the EU TRACE Project (European Union Traffic Accident Causation in Europe, http://www.tno.nl/bouw_en_ondergrond/markten/verkeer

_en_vervoer/ezines_transport_matters_1/transport_matters_on_the_/trace_tracing_the_cause_o/) is likely to yield additional insights and should be completed in early 2008. Books by Dewar and Olson (2002) and Evans (2004) also provide insight into the human contribution to crash causes.
Some view the conclusion that “human error” or the “human element” plays such a large role in crash causation very pessimistically. In their minds, the human element of the driver-road-vehicle system is highly variable and hopelessly unpredictable, and is therefore best ignored. Predicting human performance and behavior is difficult, but human factors experts have made considerable progress in this area after addressing these problems for well over 50 years.
The purpose of this paper is to identify the knowledge gaps in understanding and predicting driver performance and behavior. By understanding how, where, and when those human failures occur, we can identify opportunities for where and when technological intervention should occur and how it should be implemented.
In part, this knowledge gap is a symptom of the nature of engineering, a field of study whose primary emphasis is predicting the behavior of inanimate objects. The study of human behavior occurs in other disciplines and/or in campus buildings that engineers rarely visit (e.g., the psychology department). As an example of this disconnect, the University of Michigan has more graduates working in the auto industry than any university in the world, but only 1 of its 10 engineering programs (Industrial and Operations Engineering, IOE) requires exposure to the human aspects of design. IOE students are required to complete a 3-credit lecture course in ergonomics and a 1-credit ergonomics laboratory course.
The current role of human factors in the automotive industry is much smaller than it should be. For example, about a decade ago the author did an analysis of the people who attended the 2-week University of Michigan Human Factors Engineering Short Course, the flagship
course in the profession. The short course is now beginning its 48th year and remains a unique and respected program (http://cpd.engin.umich.edu , http://www.driverinterface.com/shortcourse/index.html). Using the number of employees or engineers per company as the denominator, and the number of attendees as the numerator, folks from the aircraft industry were 10 times more likely to attend the short course than those from the auto industry. These results are especially surprising considering the vast number of auto industry employers within driving distance of the Ann Arbor course location and that motor vehicles are consumer products. This year, with the economy down a bit (and class enrollment in the 30s), the only automotive industry attendees were from Tokai Rika (a switch manufacturer in Japan) and the Bobcat Division of Ingersoll Rand (a skid-steer loader manufacturer). There were no attendees from any major motor vehicle manufacturer or supplier. Ironically, the course is taught in the Chrysler Building, which was funded by the Chrysler Corporation specifically for continuing engineering education.
FACT 3: OPPORTUNITIES FOR REDUCING CRASHES AND FATALITIES USING PASSIVE SAFETY MEASURES ARE DECREASING IN THE U.S.
Figure 1 shows the death rate per 100 million miles traveled for the U.S from 1966 to 2004. Over time, the number of miles driven by the U.S. population as a whole increases. The rise is caused by the increasing number of vehicles on the road, the increasing number of drivers due to the increasing population of the U.S., and other factors. Increasing in the overall number of miles driven in the U.S. increases the exposure to crash-provocative situations. Surprisingly, even though exposure increased, the risk of fatality per mile driven decreased from 1966 to 2004. Risk of fatality per mile driven was even higher before 1966 and continued the upward trend in previous years. Although this figure is indicative of considerable constant improvement, notice that the rate of decline flattened significantly from 1992 to 2004.

Figure 1. U.S. Fatality Rate per 100 Million Vehicle Miles Traveled
Source: U.S. Department of Transportation, 2005, p. 32. Two main themes of the U.S. Department of Transportation motor vehicle safety programs over the last decade have been increasing seat belt use rates and reducing opportunities for intoxicated driving. (See also, Sivak, Luoma, Flannagan, Bingham, Eby, and Shope, 2006.) Although those efforts have likely contributed to the continued decline of fatality rates, focus on these issues is unlikely to lead to the dramatic reductions in death rates that occurred in 1966-1974 (and earlier). Efforts to reduce fatality rates over the last decade (and earlier efforts) have emphasized passive safety techniques such as developing vehicle bodies that protect occupants and crush in a manner to reduce peak accelerations, as well as air bags and seat belts that constrain occupant movement.
Further advances in passive safety will indeed save lives and reduce injuries, but many believe that pursuing active safety as well as passive safety could lead to the year-to-year fatality rate decreases seen decades ago. Active safety involves detecting crash-provocative situations and then using that information to either prevent the crash entirely or reduce its severity. Some active safety systems include traction control and electronic stability control systems, backup warning
systems, lane departure warning systems, blind spot detection systems, directional headlights, night vision systems, and so forth (http://en.wikipedia.org/wiki/Car_safety#Active_safety).
WHAT IS THE U.S. DEPARTMENT OF TRANSPORTATION DOING PERTAINING TO ACTIVE SAFETY?
Although this Convergence meeting draws participants from all over the world, its emphasis is on developed countries and the role of technology in driving. It therefore makes sense to consider how technology may be applied in the future, and its application to the related human considerations.
In the U.S., the overall work on driving safety is largely directed by the activities of the U.S. Department of Transportation, where active-safety related work falls in the domain of the Intelligent Transportation Systems program. Currently this program has 9 separate initiatives, 6 of which have strong safety themes. These 6 initiatives and a description of each are shown in Table 1. Particularly important are CICAS, IVBSS (with its focus on warning conflicts, excessive false alarms,

warning modality, and other issues) and VII (http://www.its.dot.gov/vii/vii_overview.htm).
Table 1. Initiatives of the Intelligent Transportation
Systems Program with Major Safety Themes
Project Description Clarus Provide integrated weather
information to reduce the effects of adverse weather
Cooperative Intersection Collision Avoidance Systems (CICAS)
Warn drivers when other drivers do not comply with traffic signals (and may also warn drivers of presence of pedestrians and cyclists)
Emergency Transportation Operations
Improve vehicle response to major disasters such as storms (especially hurricanes) and hazardous materials incidents
Integrated Vehicle-Based Safety Systems (IVBSS)
Examine how multiple warning systems (forward collision warning, curve speed warning, lane change/merge, lane departure) can function in both passenger vehicles and trucks. Issues such as simultaneous alerts and so forth are central to this initiative.
Next Generation 911 (NG 9-1-1)
Better locate 911 callers. This is motivated by the increased use of mobile phones, whose exact location has traditionally been difficult to determine. In many instances, a 911 caller may not be able to give their exact location (because they are unfamiliar with the area, incapacitated, lost, etc.), which makes rapid rescue difficult.
Vehicle Infrastructure Integration (VII)
Reduce congestion and crashes (especially run-off-the-road and intersection crashes, which constitute over 50% of all fatal crashes) by providing vehicle-to-vehicle and vehicle-to-roadside communication (dedicated short range communications, DSRC).
WHAT DO WE NEED TO KNOW ABOUT DRIVERS TO IMPLEMENT THE TECHNOLOGY BEING DEVELOPED?
Many of the systems being developed will present a warning of some sort to drivers. These efforts introduce a new wrinkle since drivers will need to deal with many, possibly concurrent, warnings. There is some research on the topics of contemporary warning system design and how drivers deal with multiple warnings (Tan and Lerner, 1995, 1996; Lerner, Dekker, Steinberg, and Huey, 1996; General Motors Corp. and Delphi-Delco
Electronic Systems, 2002; Chiang, Brooks, and Llaneras, 2004; Kiefer, Cassar, Flannagan, Jerome, and Palmer, 2005; Kiefer, LeBlanc, and Flannagan, 2005; Ho, Cummings, Wang, Tijerina, and Kochhar, 2006; Lee, McGehee, Brown, and Marshall, 2006). Even though the preceding list suggests a great deal of knowledge on the topic, the current knowledge falls far short of what is needed to design easy to use and effective warning systems that promote safe driving.
In the author’s view, the questions that need to be addressed to increase the knowledge base in this area are:
1. What additional information would drivers want to know about the driving situation (and what would be useful)?
2. How should the driving situation and warnings be presented to drivers?
3. What is the processing time for the entire warning system including the driver?
4. What is the detection performance of the entire warning system including the driver?
5. Why and how should driver responses to warnings be modeled?
6. Why does driver distraction matter for warnings and how can distraction be detected?
7. How can driver performance be modeled in general?
1. WHAT ADDITIONAL INFORMATION WOULD DRIVERS WANT TO KNOW ABOUT THE DRIVING SITUATION (AND WHAT WOULD BE USEFUL)?
Although driving requires the use of many different senses, it is considered to be a primarily a visual task. Frankly, it is impossible to determine exactly how large of a role visual information plays in driving, even though there is a considerable amount of research to that effect. (See Sivak, 1996.) For that reason, a few of the sections that follow only concern visual information.
New technology presents new opportunities for providing drivers with additional visual information. (Elements of this idea are in the Uhler and Knoll (2006) paper presented in this session as well as the Decker, Lachmayer, and Locher (2006) paper.) Until now, all of the dynamic driving information drivers receive is provided through the windshield, in the mirrors, and, in a few cases, by a rear-vision monitor. However, there are far-reaching options concerning how camera images can

be used to present drivers with dynamic driving information (Rumar, 2003; Walls, Amann, Cullinane, Green, Gadgil, and Rubin, 2004; Walls, Green, Gadgil, Amann, and Cullinane, 2004; Flannagan and Mefford, 2005).
Driver knowledge of the driving environment is limited in several ways by what drivers can observe directly, how indirect information is presented, and how much of that information drivers can assimilate at any given time. There are at least 3 manipulations of visual information that could be considered to improve representation and understanding, either individually or in combination: (1) image enhancement, (2) transparency, and (3) change of eye point.
The first possible visual information manipulation, image enhancement, involves taking images within the driver’s field of view, which the driver is not necessarily able to see or able to see clearly, and enhancing the visibility of those images. This technology is frequently intended to enhance elements of a nighttime road scene that are not apparent to the driver due to the dark viewing conditions. The emphasis of current research is on comparing alternative infrared systems and display placement (Tsimhoni, Flannagan, and Schoettle, 2006). There has been some thought given to processing the image to highlight the presence of pedestrians. Enhancement through electronic processing is also possible and can involve fusing or transforming non-visual information, say from radar, into visual information.
The second possible visual information manipulation, transparency, involves making more of the road scene directly visible. The simplest approach is to increase vehicle glazing especially on the sides and to the rear of the vehicle. No matter what technical advances are made, some aspects related to the vehicle, namely its occupants, will not be transparent. Nonetheless, as a benchmark, it could be useful to examine how well people could drive a transparent car, where they could see everything directly if the information was completely accurate and presented with no time delay. In fact, it is possible to do this in a real vehicle provided that the vehicle had the appropriate cameras and image processing equipment, and the driver had a head-mounted display that was fused with both the real and virtual images. Obviously, a similar experiment could also be done, possibly more easily, in a driving simulator. To perform this experiment in a driving simulator one must remove most of the cab, leaving only the driver’s seat, the steering wheel, the foot controls, and the speedometer/tachometer cluster.
Changing the eye point, the final possible visual information manipulation, is a new idea. Many people prefer to drive larger vehicles like SUVs, in part, because their higher vantage point allows the driver a commanding view of the road. The driver can see
farther down the road and over other vehicles more easily than drivers of smaller vehicles. A forward-facing camera mounted on a pole affixed to the vehicle could also provide that view. The camera output could be presented to the driver on a monitor or superimposed on the windshield. More research is needed to determine whether such displays are useful, how they would be used, what eye point provides the best vantage point for the driver, whether optimal placement depends on the nature of the driving task, and finally whether this technology would be useful for parking.
Thus, researchers in this field are challenged to rethink how people drive and to find the optimal method of information presentation. For each user group and driving task, researchers must determine how well people could drive if there were no constraints on how that information might be presented in terms of location, driver eye point, magnification, and so forth. Knowing the difference between how safely people could drive if they were omniscient and how safely they drive now will help identify where improvements can be made, how large the improvements might be, and the performance requirements for systems to enhance safety. Such efforts will also identify where new technology might be beneficial. Quite frankly, there has been very little research of this type, and the current focus of human factors work has been limited to evaluating the efficacy of particular technology solutions, not on thinking more broadly about where technology development is needed. But there are many possibilities for future research since, given the current capabilities of driving simulators, almost any combination of the 3 types of manipulation (image enhancement, transparency, and driver’s eye point) is feasible.
2. HOW SHOULD THE DRIVING SITUATION AND WARNINGS BE PRESENTED TO DRIVERS?
The focus of current research on warnings and driving is primarily concerned with this question. A number of papers in this session concern driver-warning systems either directly or indirectly (Acton, 2006; Gallagher and Akatsuka, 2006; Forest, 2006). Obviously, it is very important to know how warnings should be presented to drivers; if done improperly the warnings could be ineffective or even dangerous. Designers need to know what information should be presented visually, what auditorily, what by other modalities, and when the presentation should be multimodal. Another main concern in this area relates to how multiple warning should be presented. For example, what should a vehicle do in a situation when the lane departure warning is activated and almost immediately afterward the forward collision alert is needed? There are many options for dealing with situations such as this, but which is best? Should the first warning cease when the need for the second arises, or should the first warning be played to completion (so the warning is understood)?

Should both warnings be active at the same time, should volume of the first be reduced, or is there another, better option? Should the second warning be presented immediately, not at all, or with a delay, and if there is a delay, how long should it be? How does that delay relate to the severity of the 2 warnings? Does presenting a second warning confuse the driver so they cannot respond to either warning in a timely manner? Finally, is the hypothetical appearance of multiple warnings merely hypothetical? When real crash scenarios are elaborated, are they so rare that multiple warnings need not be considered?
This specific topic is being thoroughly addressed as part of the IVBSS project at UMTRI. However, readers are cautioned that no single study or project is likely to address all of the issues associated with a topic and that replication is an essential aspect of establishing findings.
How information pertaining to the driving situation should be presented to drivers is a major theme of the Decker, Lachmayer, and Locher (2006) paper on intelligent vehicle lighting presented in this session. The paper clearly establishes the connection between human factors research and design options. Research by Flannagan and Sullivan (2002) provided important information for the Decker, Lachmayer, and Locher paper as they cleverly thought to look at motor vehicle crashes around the time periods when daylight saving time started and ended to separate the fatigue effects that occur at night with diminished visibility. The start and end of daylight saving time represent periods when the clock time and travel patterns shifted, but lighting levels remained reasonably stable.
To develop better headlighting systems, thereby giving the driver more information about the driving situation, more detailed and more comprehensive data is needed on where and when people look, both during daytime (baseline) and during nighttime driving (Green, 2002). There is data available on gaze distributions during daytime and nighttime driving, but only for a limited set of situations for very few models that can be used to predict scanning patterns in a wide range of situations.
3. WHAT IS THE PROCESSING TIME FOR THE ENTIRE WARNING SYSTEM INCLUDING THE DRIVER?
In addition to what information is presented to the driver, it is also important to consider how long that information takes to arrive. Several of the papers in this and other sessions deal with use of on- and off-board wired and wireless networks that can be used to communicate safety-related information. Those networks have a great potential benefit to drivers, but the networks may have been planned in the absence of a system-level view that includes a human element.
Response time is defined as the time from when a warning begins until some sort of driver response occurs. Response time often varies depending upon the type of situation, but is generally on the order of a second or so. Consider the baseline situation where a driver is assessing the road scene and perceives a problem before the actual warning is presented. If the driver is fully aware of the situation, the warning may prove to be unnecessary and annoying.
Using a 1-second response time as a baseline, what would a system-level time history of communications that included the driver look like in comparison? Consider an off-board wireless system where a lead vehicle communicates its speed and deceleration to surrounding vehicles. Data about the lead vehicle’s speed would be collected by a sensor, sent over a channel, processed, and then broadcast to other vehicles either continuously, periodically, or when a threshold is exceeded. The receiving (subject) vehicle would then receive, process, and send data to the in-vehicle systems that will act on it. Information such as this may be used to adjust the receiving vehicle’s speed according to the speed of the lead vehicle and to aid in emergency braking. However, this all takes time. Furthermore, should a warning system act on a single message that suggests a high lead-vehicle deceleration, or wait for 2 such messages in a row, or wait for the same message from 2 out of 3 broadcasts, or use some other rule?
The off-board system described above may be an alternative to an on-board radar system that searches for lead vehicles and relays data to systems that will act on it (and supplement the unaided driver, the baseline condition). The on-board radar is far from perfect, and in spite of considerable effort, provides too many false alarms/registers too many false targets. To remedy this problem, radar processing may involve some signal averaging, for example looking for the same target over multiple sweeps. In older radar systems built for adaptive cruise control systems, the sweep rate was 8 or 10 Hz. Using a 10 Hz system as an example, if 3 sweeps were needed to be confident a target was found, then 300 ms could elapse between the first target identification opportunity and when a message that a target was found leaves the radar unit. If the driver response time is 1 second (1000 ms), then a delay of 300 ms is introduced. A 30% increase in response time is unlikely to be acceptable. In addition, consider the situation where the radar misses the target on the second sweep, so that when a target is identified on the next sweep it may be treated as a first hit and require two more hits before warning systems are activated. Thus, as sensors and communications are added, the entire response sequence needs to be considered, including the driver’s response time. For a system to be effective and useful, those times need to be extremely short relative to the driver’s unaided response time.

4. WHAT IS THE DETECTION PERFORMANCE OF THE ENTIRE WARNING SYSTEM INCLUDING THE DRIVER?
True emergency situations are extremely rare when driving and may occur no more frequently than once every few thousand miles to once every few years, depending on the conflict. It is a challenge to reliably detect such situations and then alert drivers in such a manner that they quickly respond to something they almost never experience. A particular challenge seems to be reliable detection of urgent crash situations.
The signal detection literature (e.g., (McNicol, 1972; http://www.cns.nyu.edu/~david/sdt/sdt.html) classifies all situational outcomes into the 4 categories shown in Table 2: hit, miss, false alarm, and correct rejection.
Table 2. Signal Detection Classification Scheme
Situation or Signal (Problem is)
Present Absent Present Hit False
Alarm Driver Response (Problem is)
Absent Miss Correct Rejection
In this case, a hit refers to a situation when the hazard is present and correctly identified, the entire purpose of the warning system. A miss refers to a situation when the hazard is present, but is incorrectly identified or not identified at all. Misses represent a serious mode of failure in any warning system as they render the system useless if only for that moment. A false alarm is the other failure mode of the warning system, and refers to a situation where there is no hazard present, but the system incorrectly registers one and activates the warning system. Although not as immediately dangerous as a miss, false alarms can be problematic as frequent incorrect alarms cause the driver to mistrust the system and even ignore the warning, rendering it useless in a hit situation. The final category is correct rejection, this refers to a situation where there is no hazard present and the system correctly registers that there is no hazard.
Using this scheme, consider the behavior of a forward collision warning system. Many contemporary systems will automatically trigger an alert if there is a stopped lead vehicle in the same lane as the subject vehicle and the closing rate is high. However, it could be that vehicle is at an intersection, the traffic at the intersection is clear, the lead vehicle’s turn signal is on and its’ wheels are turned toward the intersecting road. To the driver of the subject vehicle, the lead vehicle is obviously about to turn and the alarm is a nuisance/false alarm (Sayer, 2006, personal communication). (See also Lerner,
Dekker, Steinberg, and Huey, 1996.) These situations need to be minimized, but lowering sensitivity too much would lead to an increased number of misses. If the system does not produce a warning for a true hazard, the driver is as much at risk for an accident as he or she is without the warning system. To avoid the problem of misses, most warning systems have higher than necessary sensitivity, which leads to more hits, but also leads to more false alarms rendering the warning system unreliable and likely to be ignored.
Quantifying detection performance, in particular determining accurate values for d-prime (detection performance) and beta (decision bias), is very difficult because hundreds of trials are sometimes required to produce reliable results. Since crash provocative situations are rare, the time required to accumulate enough occurrences of a particular crash-provocative scenario can be enormous. Furthermore, the number of potential scenarios is large (Najm, Smith, and Toma, 2005), which makes it nearly impossible to accurately estimate for d-prime and beta for all scenarios. To really understand what happens in these scenarios, 3 sets of measures are needed: (1) d-prime and beta for the unaided driver, to provide a baseline reference, (2) d-prime and beta for the system alone (not including the driver), and (3) d-prime and beta for the driver and the system working together (referred to as augmented d-prime and augmented beta).
5. WHY AND HOW SHOULD DRIVER RESPONSES TO WARNINGS BE MODELED?
Although there is some data concerning driver performance in response to warnings, not much is known about the process. For example, when a warning is presented, where does a driver look and for how long? Where does a driver look next? How does this vary with the crash scenario, warning modality, etc.? The first major experiment of the IVBSS project will consider these questions, placing great emphasis and interest on time synchronization of eye and head movements, hand and foot control movements, and warning onsets. Collecting such information for a variety of crash scenarios will require considerable effort.
Models of human response to warnings and more general models of driving are needed to assess the crash reduction benefits of these warning systems, establish warning system and subsystem performance specifications, and establish how warnings might best be presented to drivers. Such models fall into 2 categories: stochastic models and performance/behavioral models.
Stochastic response models may describe driver response in a manner that does not consider specific limitations of human characteristics such as memory or cognition, or specific visual, auditory, cognitive or psychomotor demands (e.g., Farber, 1994; Brown, Lee,

and McGehee, 2001). For example, for a model of a forward collision warning system, one would need to know statistics (mean, standard deviation), the distribution type for a number of variables (headways, driver response times, braking forces) as well as data on the response of the braking system and the coefficient of friction for various road surfaces. Such models have proven to be very useful. Due to their complexity, stochastic models are often implemented as Monte Carlo simulations because direct computation of the convolution integral of the underlying distributions is too difficult and time consuming to do, especially when there is branching logic.
The drawback of stochastic models is that to a large degree they can be atheoretic. Nonetheless, the flexibility of stochastic models may be an advantage when the application domain is constrained, for example to multimodal warnings.
Performance/behavioral models include specific representations of various human characteristics, specific human processing elements or memories, which can be shown as a block diagram of how information is processed. Specific examples are provided in the discussion for question 7.
6. WHY DOES DRIVER DISTRACTION MATTER FOR WARNINGS AND HOW CAN DISTRACTION BE DETECTED?
The acceptance of warnings systems, and their effectiveness, can be significantly elevated if the driver’s awareness of the potential hazard is known. What drivers might know about and be able to respond to depends on their workload and if they are distracted. A workload manager can be used to assess workload level and distraction (Michon, 1993, Hoedmaeker, deRidder, and Janssen, 2002; Green, 2004; Zhang, Smith, and Witt, 2006). As described in the literature, a workload manager would assess the current and future demand of
the driving task, the current and future demand of secondary tasks, and then manipulate information access accordingly. For example, if a driver was traveling in heavy traffic down a slippery road at high speed and visibility was poor, then the workload manager would automatically divert any incoming phone calls to a voice-mailbox. However, if the driver was traveling down a straight expressway with essentially no traffic at a normal speed and the weather was good, then the workload manager would not redirect incoming phone calls and they would be received as normal. A workload manager may also know where the driver’s attention is directed, such as toward a hazard and incorporate that information into its handling of a given situation.
There are several ways in which workload (and distraction) can be assessed. The first is to measure what the driver is doing through the use of input measures (e.g. steering wheel angle, throttle position, etc.) and use that information in conjunction with data on secondary control operation, to determine if the driver is overloaded. Throttle position was used to explore effects of distraction in Zylstra, Tsimhoni, Green, and Mayer (2003), where subjects drove on very straight roads while performing a secondary task, either dialing a phone, tuning a radio, or entering a street address. When driving and performing a secondary task, drivers did not perform them simultaneously, but switched back and forth between the 2 tasks very quickly. Normally, a throttle signal shows a continuing series of micro corrections within each second of driving. However, when a driver turns his or her attention from the primary driving task to the secondary distracting task, the micro corrections cease, indicating that the driver is not attending to the driving task as he or she normally would. When the driver returns attention to the primary driving task, the micro corrections to the throttle resume. The flat line periods (where no micro corrections occur) last for between 1 and several seconds. Figure 2 shows an idealized example of this behavior.
Figure 2. Throttle Flat Lines as an Indicator of Workload

This approach to measuring workload can work very well, but the algorithm needs to be tuned for each road type. It is unknown how well this would work in heavy traffic or on road curves.
Steering entropy, a similar approach to throttle position, has been found to work well in some conditions (Nakayama, Futami, Nakamura and Boer, 1999; Boer, Rakauskas, Ward, and Goodrich, 2005) but recent UMTRI work have shown less favorable results (Eoh, Green, and Hegedus, 2006). For either approach to be effective the workload manager needs to know the type of road being driven (expressway, collector, etc.) and hence a sophisticated navigation system is required. Given that workload managers are likely to first appear on upscale vehicles where navigation systems are already quite common, the need for a navigation system is unlikely to cause any problems.
Workload managers can also utilize data on how well a vehicle is being driven, such as the standard deviation of lane position or speed. Note that workload level can change without any change in these measures, that is, drivers may focus on maintaining speed and lane position as workload increases but object and event detection may decline, which may lead to crashes. Some of these discrepancies may be remedied with the addition of output measures such as headway and lane position. In contrast to the input measures, output measures require additional sensing. The radar in an adaptive cruise control system would be needed to determine headway. A lane monitoring system would be needed to determine lane width, and because the performance depends on the type of road driven, a navigation system would be needed to determine such.
Another approach is to use eye-tracking technology to measure where drivers look. For a warning system, this may be the most reliable since this approach involves direct assessment of attention to hazards. Unfortunately, this approach requires the most expensive equipment. Research systems to accurately determine the direction of driver eye gaze are on the order of $30,000 (www.seeingmachines.com, www.smarteye.se). These systems include 2 cameras, computers, and custom software. To provide gaze accuracy of a few degrees, high-resolution digital cameras are needed, because the direction of gaze is determined by the location of the pupil (the opening) and iris (dark part) of the eye relative to the sclera (the white of the eyes), which only occupy a few pixels of the entire video frame. Many systems cannot detect the pupil because it is too small.
An alternative approach is to determine where the head is pointed and assume the head is pointed where the person is looking, which is generally, but not always, the same. Using sophisticated image processing algorithms that track facial features, this can be done quite reliably,
even using a single camera. This approach can lead to direction-of-gaze systems that are much less expensive than research-based eye fixation systems. However, head-based systems still require a reasonably good camera, and usually, a digital signal processor. Companies selling research-based eye-fixation systems have a total production in the low hundreds, whereas motor vehicle product starts at 10,000, so there can be economies of scale that will reduce cost.
A potential drawback of eye fixation and head position recording systems is the concern about privacy. To provide accuracy, camera images over some time (or maybe just data from them) must be saved. Drivers will find recording gaze statistics to be less objectionable than storing facial images, though many drivers may not understand the distinction. There are likely to be discussions about recording head gaze similar to past discussions concerning the black box data used to optimize the performance of seat belts and air bags. Currently, most black box systems retain the most recent 4 of 5 seconds of driving data. Radar-based systems in heavy trucks for crash avoidance may retain up to 20 minutes of driving data.
Of the various approaches that could be implemented to assess workload, all have the potential to vastly improve warning system performance because they can identify when the warnings are most likely to be needed. The largest benefit of a workload manager may not for secondary task management, the originally intended application, but for tailoring warning presentation. At this point, considerable data is needed concerning the on-the-road effectiveness of various methods for determining driver distraction and workload, some of which may be gained from an upcoming SAVE-IT field test. That limited field test is just the beginning of what needs to be done.
7. HOW CAN DRIVER PERFORMANCE BE MODELED IN GENERAL?
For many problems, it is too limiting to constrain the approach of assessing driver responses to a stochastic model. There is a great deal known about how people perform tasks, and casting the warning response problem in the more general context of human performance modeling will yield superior results in the long run.
Much of what is traditionally thought of as engineering is driven by models, usually in the form of equations, based on scientific principles—Newton’s Laws, Kirchoff’s Loop Equations and Thevenin’s Equivalent Circuits, Navier-Stokes equations for compressible and incompressible fluids, etc. There have been several efforts to model driver performance and behavior. There are several very accurate models that predicting how people steer and adjust their speed (Jagacinski and

Flach, 2002), from the perspective on control level behavior, the moment-to-moment steering of a vehicle. Use of these models requires knowledge of feedback control theory and optimal control behavior, and their use is limited since this material not well understood by many human factors professionals.
Models that are tailored to consider how drivers use controls and displays such as the IVIS software (Hankey, Dingus, Wierwille, and Andrews, 2000a,b) represent a second class of models. The IVIS model is primarily descriptive. Unfortunately, there is no evidence the IVIS software is used.
There has been a great deal of recent interest concerning stochastic models of human performance, much of which is being conducted by the military and defense contractors using IMPRINT (Allender, Kelley, Salvi, Lockett, Headley, Promisel, Mitchell, Richer, and Feng, 1995; Booher, 2003), and applications to driving are limited. IMPRINT (http://www.arl.army.mil/ARL-Directorates/HRED/imb/imprint/Imprint7.htm) is a tool based on the MicroSaint engine that supports the construction of Monte Carlo models of human action using task networks. IMPRINT does not currently include any pre-built elements of human performance, but such an effort to develop such is underway.
For those unfamiliar with stochastic models, consider a situation where a person is interacting with an unintelligent speech interface. For the sake of simplicity of explanation, assume that the system was activated when the driver spoke the trigger word “car,” as shown in Figure 3. The time it takes for the system to respond depends on the probability of several outcomes, the tasks to be completed, and their distributions. Keep in mind that the task network for a complete and useful task such as entering a street address into a navigation system is much more complex. Task networks are extremely time consuming to build and require considerable experimental data to determine network parameters (probabilities, means, standard deviations, distribution types, etc.). However, once they are constructed, engineers can examine design tradeoffs readily and effectively. For example, the performance criterion for a speech interface might be the probability that 95% of the drivers can complete a particular interaction in some period of time, say 10 seconds. However, for a crash-warning scenario, the performance criterion might be the probability that drivers respond to a particular warning in a particular scenario within a threshold.
Figure 3. Recognition of the Word "Car" by a Speech Interface
There are a number of efforts underway to develop general-purpose models of human performance. (See Deutsch, Pew, Tenney, Diller, Godfrey, Spector, Benyo, Date, and Gluck, 2004 for an overview.) Three general-purpose models have explicitly addressed driving, models that draw their lineage from but are somewhat disconnected with research funded by the U.S. Department of Transportation in the 1970s (Anderson,
Curtner, and Wolf, 1975; Wolf and Barrett, 1978; Lieberman and Goldblatt, 1981).
The first general-purpose model, known as COSMODRIVE (Cognitive Simulation Model of the Driver, Tattegrain-Veste, Bellet, Pauzie, and Chapon, 1996; Bellet and Tategrain-Veste, 1999), is a specific model of driving developed in connection with INRETS.
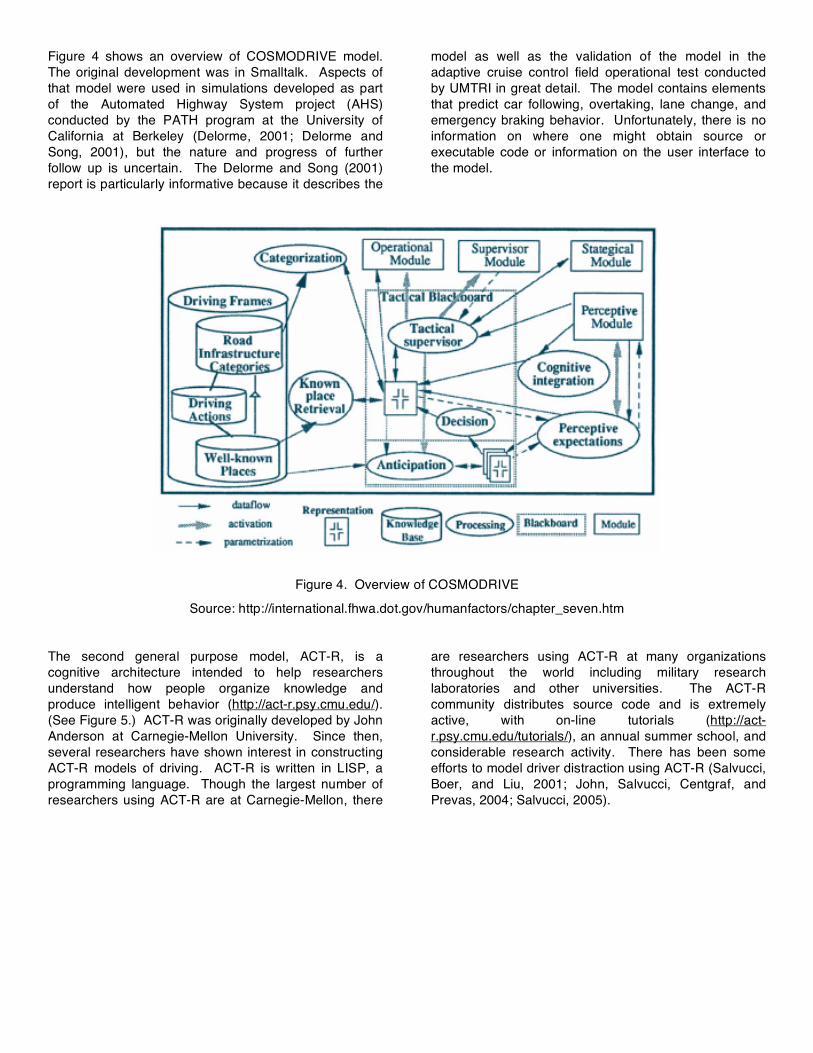
Figure 4 shows an overview of COSMODRIVE model. The original development was in Smalltalk. Aspects of that model were used in simulations developed as part of the Automated Highway System project (AHS) conducted by the PATH program at the University of California at Berkeley (Delorme, 2001; Delorme and Song, 2001), but the nature and progress of further follow up is uncertain. The Delorme and Song (2001) report is particularly informative because it describes the
model as well as the validation of the model in the adaptive cruise control field operational test conducted by UMTRI in great detail. The model contains elements that predict car following, overtaking, lane change, and emergency braking behavior. Unfortunately, there is no information on where one might obtain source or executable code or information on the user interface to the model.
Figure 4. Overview of COSMODRIVE
Source: http://international.fhwa.dot.gov/humanfactors/chapter_seven.htm
The second general purpose model, ACT-R, is a cognitive architecture intended to help researchers understand how people organize knowledge and produce intelligent behavior (http://act-r.psy.cmu.edu/). (See Figure 5.) ACT-R was originally developed by John Anderson at Carnegie-Mellon University. Since then, several researchers have shown interest in constructing ACT-R models of driving. ACT-R is written in LISP, a programming language. Though the largest number of researchers using ACT-R are at Carnegie-Mellon, there
are researchers using ACT-R at many organizations throughout the world including military research laboratories and other universities. The ACT-R community distributes source code and is extremely active, with on-line tutorials (http://act-r.psy.cmu.edu/tutorials/), an annual summer school, and considerable research activity. There has been some efforts to model driver distraction using ACT-R (Salvucci, Boer, and Liu, 2001; John, Salvucci, Centgraf, and Prevas, 2004; Salvucci, 2005).

Figure 5. An Overview of ACT-R
Source: Salvucci, 2001 The third general-purpose model used to consider driving is QN-MHP, the Queuing Network Model Human Processor, developed by Liu and his students at the University of Michigan (Feyen and Liu, 2001; Tsimhoni and Liu, 2003). QN-MHP is implemented using Pro-Model, a simulation tool popular with industrial engineers
for modeling production lines. As shown in the overview in Figure 6, QN-MHP models people as a series of servers and service queues. In one impressive demonstration, a QN-MHP was able to steer a vehicle in a real time driving simulation.
Figure 6. An Overview of QN-MHP

Each of these 3 models has strengths and weaknesses and potential value for evaluating future warning systems. However, a great deal of work needs to be done to add modules or structures to these models to support predictions over a wider range of driving conditions (for example, intersections), to collect calibration and validation data for those models, and to aid in solving practical problems. Given the breadth of the necessary studies, these goals cannot be accomplished in a single project, even if funded by the U.S. Department of Transportation or some other agency and tens of millions of dollars were involved. However, regardless of funding and effort, time is also needed for the ideas to evolve and for interactions to take place between model developers and users. As an example, the initial development of COSMODRIVE occurred over a decade. For progress to occur, a permissive and free flowing atmosphere is needed that encourages the exchange of ideas, that supports the vetting process of conference proceedings and journal articles, the scientific mechanisms that encourage the critical review of ideas. In transportation research, technical reports are typically given funding priority over journal articles, but if a model based science of driving is to evolve, then funding must be provided for writing journal articles that undergo the normal vetting process.
SO, WHAT NEEDS TO BE DONE?
Clearly, applying intelligent transportation systems (ITS)-related technology to active safety problems creates some very interesting opportunities. A great deal of thought has been given to identifying crash scenarios and finding technological methods for avoiding them or reducing their severity. However, that work has not been as human-centered as it could be, and misses the grand vision of implementing radical changes in how information about the driving situation and warnings could be presented to drivers. Furthermore, greater emphasis is needed on developing system level models, both of crash provocative situations and driving in general, with particular emphasis on processing time and detection performance.
A major theme of this paper expresses a need for driving models, models that will allow for computational comparisons of warning presentation content, formats, and timing as well as broader evaluation of the efficacy of presenting information to drivers for a wide variety of driving tasks. Quantitative workload assessment will be an important element of these models.
At this point, the literature consists primarily of experimental data from studies intended to assess technology, mostly in the form of statistical means from a limited number of situations. It is now timely to develop human performance models and populate them with data that goes well beyond that, such as standard deviations and distribution descriptions of each step of
the human decision process, as well as the rules that govern that process. For human factors engineering to be accepted by other fields of engineering, integrated, computationally human-system models should be used to make technology tradeoffs and determine specifications for system components.
At this point, there are no plans to fund substantial work on driver models. This does not bode well for the accomplishment of stated DOT goals to reduce crashes or for the future of the science of driving. Hopefully this information will lead those with funds to rethink their priorities and support supplements of the SAVE-IT and IVBSS projects, or initiate new programs. Stay tuned… The “Science of Driving” needs to be more than a catchy phrase at UMTRI.
REFERENCES
Acton, D.L. (2006). Next-Generation Technologies for Safety, Convergence 2006 Proceedings, Warrendale, PA: Society of Automotive Engineers. Anderson, P.A., Curtner, K.L., and Wolf, J.D. (1975). DRIVEM: Driver Vehicle Interaction Effectiveness Model (Technical Report DOT HS 801 525), Washington, D.C.: U.S. Department of Transportation, National Highway Traffic Safety Administration. Allender, L., Kelley, T., Salvi, L., Lockett, J., Headley, D., Promisel, D., Mitchell, D., Richer, C., and Feng, T. (1995). Verification, Validation, and Accreditation of a Soldier-System Modeling Tool, Proceedings of the Human Factors and Ergonomics Society 39th Annual Meeting-1995, San Diego, CA: Human Factors and Ergonomics Society, 1219-1223. Bellet, T., and Tattegrain-Veste, H., (1999). A Framework of Representing Driving Knowledge, International Journal of Cognitive Ergonomics, 3, 37-49. Blower, D. and Campbell, K.L. (2002). The Large Truck Crash Causation Study (Technical Report UMTRI-2002-31), Washington, D.C.: U.S. Department of Transportation, Federal Motor Carrier Safety Administration. Boer, E.R., Rakauskas, M.E., Ward, N.J., and Goodrich, M.A. (2005). Steering Entropy Revisited, Proceedings of the Third International Driving Symposium on Human Factors in Driver Assessment, Training and Vehicle Design, Iowa City, IA: University of Iowa. Booher, H.R., Ed. (2003). Handbook of Human Systems Integration, New York: Wiley. Brown, T.L., Lee, J.D., and McGehee, D.V. (2001). Human Performance Models and Rear-End Crash Avoidance Algorithms. Human Factors, 43, 462-482.

Chiang, D., Brooks, A., and Llaneras, E. (2004). Final Task Report: Investigation of Multiple Collision Alarm Interference Driving Simulator Study (Final Report DRI-TR-04-10), Washington, D.C.: National Highway Traffic Safety Administration. Decker, D., Lachmayer, R., and Locher, J. (2006). Intelligent Motor Vehicle Lighting, Convergence 2006 Proceedings, Warrendale, PA: Society of Automotive Engineers. Delorme, D. (2001). Modeling Driver Cognition, Proceedings of the Driver Assessment Conference, Iowa City, IA: University of Iowa (http://ppc.uiowa.edu/Driving-Assessment/2001/Summaries/Driving%20Assessment%20Papers/56_delorme_delphine.htm). Delorme, D. and Song, B., (2001). Human Driver Model for SmartAHS (Paper UCB-ITS-PRR-2001-12), Berkeley, CA: California Partners for Advanced Transit and Highways (PATH) (http://repositories.cdlib.org/its/path/reports/UCB-ITS-PRR-2001-12). Deutsch, S. Pew, R.W., Tenney, Y.J., Diller, D.E., Godfrey, K., Spector, S., Benyo, B., Date, S., Gluck, K.A. ( 2004). Agent-Based Modeling and Behavior Representation (AMBR), Cambridge, MA: BBN Labs. Dewar, R.E. and Olson, L. (eds). (2002). Human Factors in Traffic Safety, Tucson, AZ: Lawyers and Judges. Eoh, H., Green, P.A., and Hegedus, E. (2006, in process). Driving Performance Analysis of the ACAS FOT Data and Recommendations for a Driving Workload Manager, Ann Arbor, MI: University of Michigan Transportation Research Institute. Evans, L. (2004). Traffic Safety, Bloomfield Hills, MI: Science Serving Society. Farber, E. (1994). Using the REAMACS Model to Compare the Effectiveness of Alternative Rear End Collision Warning Algorithms, Proceedings of the 1995 Annual Meeting of ITS America, Washington, D.C., 400-407. Feyen, R.G., and Liu, Y., (2001). The Queuing Network-Model Human Processor (QN-MHP): an Engineering Approach for Modeling Cognitive Performance, Proceedings of the Human Factors and Ergonomics Society 45th Annual Meeting, Santa Monica, CA: Human Factors and Ergonomics Society.
Flannagan, M and Mefford, M.L. (2005). Distance Perception with a Camera-Based Rear Vision System in Actual Driving (Technical Report UMTRI-2005-38), Ann Arbor, MI: University of Michigan Transportation Research Institute. Forest, T.M. (2006). The FlexRay Communication Protocol and Some Implications for the Future, Convergence 2006 Proceedings, Warrendale, PA: Society of Automotive Engineers. Gallagher, B. Akatsuka, H., and Suzuki, H. (2006). Wireless Communications for Vehicle Safety: Radio Link Performance and Communications Methods, Convergence 2006 Proceedings, Warrendale, PA: Society of Automotive Engineers. General Motors Corp. and Delphi-Delco Electronic Systems. (2002). Automotive Collision Avoidance Field Operational Test Warning Cue Implementation Summary Report (Summary Report DOT HS 809 462). Washington, D.C.: U.S. Department of Transportation, National Highway Traffic Safety Administration. Green, P. (2002). Where Do Drivers Look while Driving (and for How Long)? (chapter 7, 77-110), In Dewar, R.E. and Olson, L. (eds). (2002). Human Factors in Traffic Safety, Tucson, AZ: Lawyers and Judges. Green, P. (2004). Driver Distraction, Telematics Design, and Workload Managers: Safety Issues and Solutions (SAE paper 2004-21-0022), Proceedings of the 2004 International Congress on Transportation Electronics (Convergence 2004, SAE publication P-387), Warrendale, PA: Society of Automotive Engineers, 165-180. Hankey, J.M., Dingus, T.A., Wierwille, W.W., and Andrews, C. (2000a). In-Vehicle Information Systems Behavioral Model and Design Support: Final Report (FHWA RD-00-135), McLean, VA: U. S. Department of Transportation, Federal Highway Administration (http://www.tfhrc.gov/humanfac/00-135.pdf). Hankey, J.M., Dingus, T.A., Wierwille, W.W., and Andrews, C. (2000b). In-Vehicle Information Systems Behavioral Model and Design Support: IVIS DEMAnD Prototype Software User’s Manual (FHWA RD-00-136), McLean, VA: U. S. Department of Transportation, Federal Highway Administration (http://www.tfhrc.gov/humanfac/00-136.pdf). Ho, A.W.L., Cummings, M.L., Wang, E., Tijerina, L., and Kochhar, D.S. (2006). Integrating Intelligent Driver Warning Systems: Effects of Multiple Alarms and Distraction on Driver Performance, Paper presented at the Transportation Research Board 2006 Annual Meeting, Washington, D.C.

Hoedmaeker, M., deRidder, S.N., and Janssen, W.H. (2002). Review of European Human Factors Research on Adaptive Interface Technologies of Automobiles (Technical Report TM-02-C031), Soesterberg, The Netherlands: TNO Human Factors (http://www.volpe.dot.gov/opsad/saveit/docs/hoedemaeker.pdf). Jacobs, G., Aeron-Thomas, A., and Astrop, A. (2000). Estimating Global Road Fatalities (Technical Report TRL 445), Crowthorne, Berkshire, U.K.: Transport Research Laboratory. Jagacinski, R.J. and Flach, J.M. (2002). Control Theory for Humans: Quantitative Approaches to Modeling Performance, Mahwah, NJ: Lawrence Earlbaum. John, B.E., Salvucci, D.D., Centgraf, P., and Prevas, K. (2004). Integrating Models and Tools in the Context of Driving and In-vehicle Devices. Proceedings of the Sixth International Conference on Cognitive Modeling. Kiefer, R.J., Cassar, M.T., Flannagan, C.A., Jerome, C.J., and Palmer, M.D. (2005). Surprise Braking Trials, Time-to-Collision Judgments, and “First Look” Maneuvers Under Realistic Rear-End Crash Scenarios (Final Report DOT HS 809 902), Washington, D.C.: U.S. Department of Transportation, National Highway Traffic Safety Administration. Kiefer, R.J., LeBlanc, D.J., and Flannagan, C.A. (2005). Developing an Inverse Time-To-Collision Crash Alert Timing Approach based on Drivers' Last-Second Braking and Steering Judgments, Accident Analysis & Prevention, 37(2), 295-303. Lee, J., McGehee, D.V., Brown, T.L., and Marshall, D. (2006). Effects of Adaptive Cruise Control and Alert Modality on Driver Performance, Paper presented at the Transportation Research Board 2006 Annual Meeting, Washington, D.C.: Transportation Research Board. Lerner, N.D., Dekker, D.K., Steinberg, G.V., and Huey, R.W. (1996). Inappropriate Alarm Rates and Driver Annoyance (Technical Report DOT HS 808 533), Washington, D.C.: U.S. Department of Transportation, National Highway Traffic Safety Administration, Office of Crash Avoidance Research. Lieberman, E.B. and Goldblatt, R. (1981). A Review of the Driver-Vehicle Effectiveness (DRIVEM) Model (Technical Report DOT HS 806 110), Washington, D.C.: U.S. Department of Transportation, National Highway Traffic Safety Administration. McNicol, D. (1972). A Primer of Signal Detection Theory, London, U.K.: George Allen and Unwin.
Michon, J.A. (1993). Generic Intelligent Driver Support, London, U.K.: Taylor and Francis. Najm, W.G., Smith, J.D., and Toma, S. (2005). Crash Imminent Test Scenarios for Integrated Vehicle Based Safety Systems. (Project Memorandum HS22-05-01). Cambridge, MA: U.S. Department of Transportation, Volpe National Transportation Systems Center. Nakayama, O,. Futami, T., Nakamura, T., and Boer, E.R. (1999). Development of a Steering Entropy Method for Evaluating Driver Workload (SAE Technical Paper Series: #1999-01-089), Presented at the International Congress and Exposition, Warrendale, PA: Society of Automotive Engineers. Neale, V.L., Dingus, T.A., Klauer, S.G., and Goodman, M. (2005). An Overview of the 100-Car Naturalistic Study and Findings, Proceedings of the Experimental Safety Vehicle Conference (http://www-nrd.nhtsa.dot.gov/pdf/nrd-12/100Car_ESV05summary.pdf). Rumar, K. (2003). Infrared Night Vision Systems and Driver Needs (SAE Technical Paper 2003-01-0293), Warrendale, PA: Society of Automotive Engineers. Salvucci, D.D., Boer, E.R., and Liu, A., (2001). Toward an Integrated Model of Driver Behavior in a Cognitive Architecture, Transportation Research Record, 1779, 9-16. Salvucci, D. D. (2005). Modeling tools for Predicting Driver Distraction, Proceedings of the Human Factors and Ergonomics Society 49th Annual Meeting, Santa Monica, CA: Human Factors and Ergonomics Society. Sivak, M. (1996). The Information That Drivers Use: Is It Indeed 90% Visual? Perception, 25, 1081-1089 Sivak, M., Luoma, J., Flannagan, M.J., Bingham, C.R., Eby, D.W., Shope, J.T. (2006). Traffic Safety in the U.S.: Re-Examining Major Opportunities (Technical Report UMTRI 2006-26), Ann Arbor, MI: University of Michigan Transportation Research Institute. Subramanian, R. (2005). Motor Vehicle Traffic Crashes As a Leading Cause of Death in the United States, 2002 (Traffic Safety Facts Research Note DOT HS 809 831), Washington, D.C.: U.S. Department of Transportation. Sullivan, J., and Flannagan, M.J. (2002). The Role of Ambient Light Level in Fatal Crashes: Inferences from Daylight Saving Time Transitions Accident Analysis and Prevention, 34, 487-498.

Tan, A. K., and Lerner, N. D. (1995). Multiple Attribute Evaluation of Auditory Warning Signals for In-Vehicle Crash Avoidance Warning Systems, (Technical Report DOT HS 809 716), Washington, D.C.: U.S. Department of Transportation, National Highway Traffic Safety Administration. Tan, A. K. and Lerner, N. D. (1996). Acoustic Localization of In-Vehicle Crash Avoidance Warnings as a Cue to Hazard Direction (Technical Report DOT HS 808 534), Washington, D.C.: U.S. Department of Transportation, National Highway Traffic Safety Administration, Office of Crash Avoidance Research. Tattegrain-Veste H., Bellet T., Pauzie A., Chapon A. (1996). Computational Driver Model in Transport Engineering: COSMODRIVE. Transportation Research Record, 1550, 1-7. Treat, J.R., Tumbas, N.S., McDonald, S.T., Shinar, D., Hume, R.D., Mayer, R.E., Stansifer, R.L., and Castellan, N.J. (1979). Tri-level Study of the Causes of Traffic Accidents: Final Report. Executive Summary, (Technical Report No. DOT-HS-034-3-535-79-TAC(S)/ DOT/HS 805 099), Washington, D.C.: U.S. Department of Transportation, National Highway Traffic Safety Administration. Treat, J.R., Tumbas, N.S., McDonald, S.T., Shinar, D., Hume, R.D., Mayer, R.E., Stansifer, R.,L. Castellan, N.J. (1977). Tri-level Study of the Causes of Traffic Accidents: Final Report. Volume I: Causal Factor Tabulations and Assessments, (Technical Report No. DOT-HS-034-3-535-77-TAC(1)/ DOT/HS 805 085), Washington, D.C.: U.S. Department of Transportation, National Highway Traffic Safety Administration, National Center for Statistics and Analysis. Treat, J.R., Tumbas, N.S., McDonald, S.T., Shinar, D., Hume, R.D., Mayer, R.E., Stansifer, R.L., and Castellan, N.J. (1977). Tri-level Study of the Causes of Traffic Accidents: Final Report. Volume II: Special Analyses, (Technical Report No. DOT-HS-034-3-535-77-TAC(2)/ DOT/HS 805 086), Washington, D.C.: U.S. Department of Transportation, National Highway Traffic Safety Administration, National Center for Statistics and Analysis. Tsimhoni, O., Flannagan, M.J., and Schoettle, B. (2006). Analysis of the Visibility of Near-Infrared Illuminators (Technical Report UMTRI 2006-10), Ann Arbor, MI: University of Michigan Transportation Research Institute. Tsimhoni, O., and Liu, Y., (2003). Modeling Steering Using the Queuing Network-Model Human Processor (QN-MHP), Proceedings of the annual conference of the Human Factors and Ergonomics Society, Santa Monica, CA: Human Factors and Ergonomics Society, 1875-1879.
Uhler, W., and Knoll, P.M. (2006). Surround Sensors – Enablers for Predictive Safety Systems, Convergence 2006 Proceedings, Warrendale, PA: Society of Automotive Engineers. U. S. Department of Transportation (1999). Problem Area Descriptions, Motor Vehicle Crashes – Data Analysis and IVI Program Emphasis, Washington, D.C.: U. S. Department of Transportation, ITS Joint Program Office. U.S. Department of Transportation (2005). Traffic Safety Facts 2004 (Technical Report DOT HS 809 919), Washington, D.C.: U.S. Department of Transportation, National Highway Traffic Safety Administration (http://www-nrd.nhtsa.dot.gov/departments/nrd-30/ncsa/). U.S. Department of Transportation (2004). Traffic Safety Facts 2004, Washington, D.C.: U.S. Department of Transportation, National Highway Traffic Safety Administration, National Center for Statistics and Analysis. World Publishing Company (1960). Webster’s New World Dictionary of the American Language (College edition), Cleveland, OH: World Publishing Company. Walls, S., Amann, J., Cullinane, B., Green, P., Gadgil, S., and Rubin, R. (2004). Alternative Images for Perpendicular Parking: A Usability Test of a Multi-Camera Assistance System (Technical Report UMTRI 2004-30), Ann Arbor, MI: University of Michigan Transportation Research Institute. Walls, S., Green, P., Gadgil, S., Amann, J., and Cullinane, B. (2004). Alternative Images for Parallel Parking: A Usability Test of a Multi-Camera Assistance System (Technical Report UMTRI 2004-31), Ann Arbor, MI: University of Michigan Transportation Research Institute. Wolf, J.D. and Barrett, M.F. (1978). Driver-Vehicle Effectiveness Model, Volume 1: Final Report (Technical Report DOT HS 804 337), Washington, D.C.: U.S. Department of Transportation, National Highway Traffic Safety Administration. Wolf, J.D. and Barrett, M.F. (1978). Driver-Vehicle Effectiveness Model, Volume 2: Appendices (Technical Report DOT HS 804 338), Washington, D.C.: U.S. Department of Transportation, National Highway Traffic Safety Administration. Zhang, H., Smith, M.R.H., Witt, G.J. (2006). Driver State Assessment and Driver Support Systems, Convergence 2006 Proceedings, Warrendale, PA: Society of Automotive Engineers.

Zylstra, B., Tsimhoni, O., Green, P., and Mayer, K. (2003). Driving Performance for Dialing, Radio Tuning, and Destination Entry while Driving Straight Roads (Technical Report UMTRI-2003-35), Ann Arbor, MI: The University of Michigan Transportation Research Institute.
CONTACT Paul Green University of Michigan Transportation Research Institute Human Factors Division 2901 Baxter Road Ann Arbor, Michigan 48109-2150 USA Ph:1 734 763 3795, Fax :1 734 764 1221, [email protected] www.umich.edu/~driving or www.driverinterface.com