DRIVER SELECTION FOR LARGE OFFSHORE PRODUCTION FACILITIES · driver selection for large offshore...
22
DRIVER SELECTION FOR LARGE OFFSHORE PRODUCTION FACILITIES AN IMPORTANT EARLY PROJECT DECISION Charles McDonald - BP Engineer Stan Beaver – Electrical Consultant 1
-
Upload
nguyendang -
Category
Documents
-
view
230 -
download
4
Transcript of DRIVER SELECTION FOR LARGE OFFSHORE PRODUCTION FACILITIES · driver selection for large offshore...
DRIVER SELECTION FOR LARGE OFFSHORE PRODUCTION FACILITIES
AN IMPORTANT EARLY PROJECT DECISION
Charles McDonald - BP Engineer
Stan Beaver – Electrical Consultant
1

INTRODUCTION / GROUND WORK
Common Early Approach on Platforms: Few Relatively Large Mechanical Drives Larger Mechanical Drives Driven by Gas Turbines/Engines Engine/Turbine Generators for Smaller Drives and Utilities
Contemporary Large Floating Developments: Significantly Larger Throughput Numerous Large Mechanical Drives
Decision for Types of Drives is Not Obvious: All Electric – Relatively Few Large Gas Turbines for Power
Generation with Motor Drives Mixed Drivers - Smaller Gas turbines For Power
Generation; mix or Motors & Engines as Mechanical Drives
2
METHODOLOGY OF DRIVER STUDY Formal Driver Study is an effective way to arrive at
optimum mix of turbine, engine and motor drivers on facility
Study Typically Required early in project (during FEED)
- Reservoir Data is Preliminary
- Comparative Analysis - Carried out on “Differential Basis”
As project economic factors change, so do the results of the driver study.
- EXAMPLE: Production Sharing Agreement with Host Country where Produced Gas has no Value to Operator.
3
SELECTION CRITERIA
Selection Criteria (Metrics) Defined, Ranked and Agreed Upon with ALL Stakeholders
Metrics Linked to Project Economic Factors
Examples of Metrics Life Cycle Costs
* Equipment CAPEX* Installed CAPEX (Equipment CAPEX PLUS Installation Costs)* OPEX & Maintenance Costs (Includes fuel costs)* Environments Impacts (CO2, NOx, etc., penalties)
Inherent Safety (Layout, etc.)
4

DRIVER STUDY FLOW CHART PART 1
Project, Discipline,Corporate Data
Kick-Off Study
• Layout Constraints• Operations Needs• Process Needs
Evaluation/Selection Metrics
Rank Metrics
Gather ProjectData & Factors
Scenarios for:• Pipeline Pumps• Water Injection Pumps• Compressors
Are AllScenarios
Valid
No
Yes
Gather EquipmentData
Continued on Flow Chart - Part 25

DRIVER STUDY FLOW CHART PART 2
OperationalExpenses
MaintenanceExpenses
AvailabilityAnalysis
DeferredProductionEvaluation
EmissionsInstalledCapital
Expense
CapitalExpenses
Life CycleCosts
Continued on Flow Chart Part 3
From Flow Chart Part 1
6
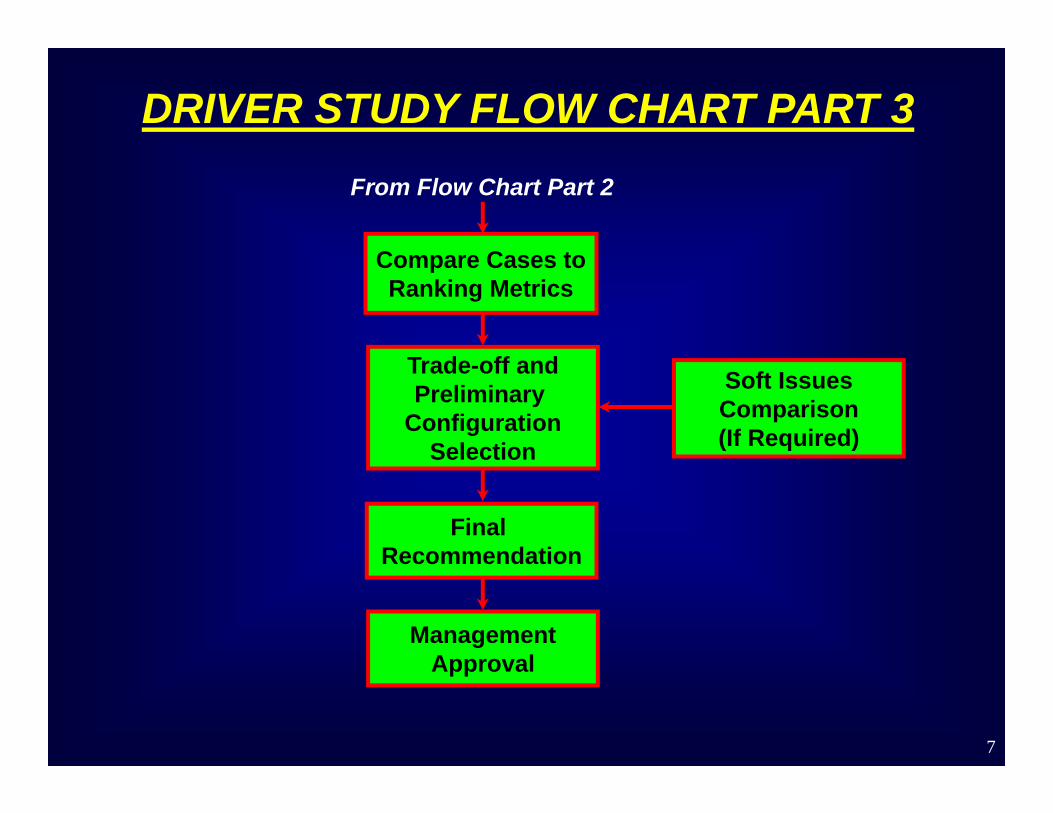
From Flow Chart Part 2
DRIVER STUDY FLOW CHART PART 3
ManagementApproval
Trade-off andPreliminary
ConfigurationSelection
Compare Cases toRanking Metrics
Final Recommendation
Soft IssuesComparison(If Required)
7

A SAMPLE CASE STUDY
8
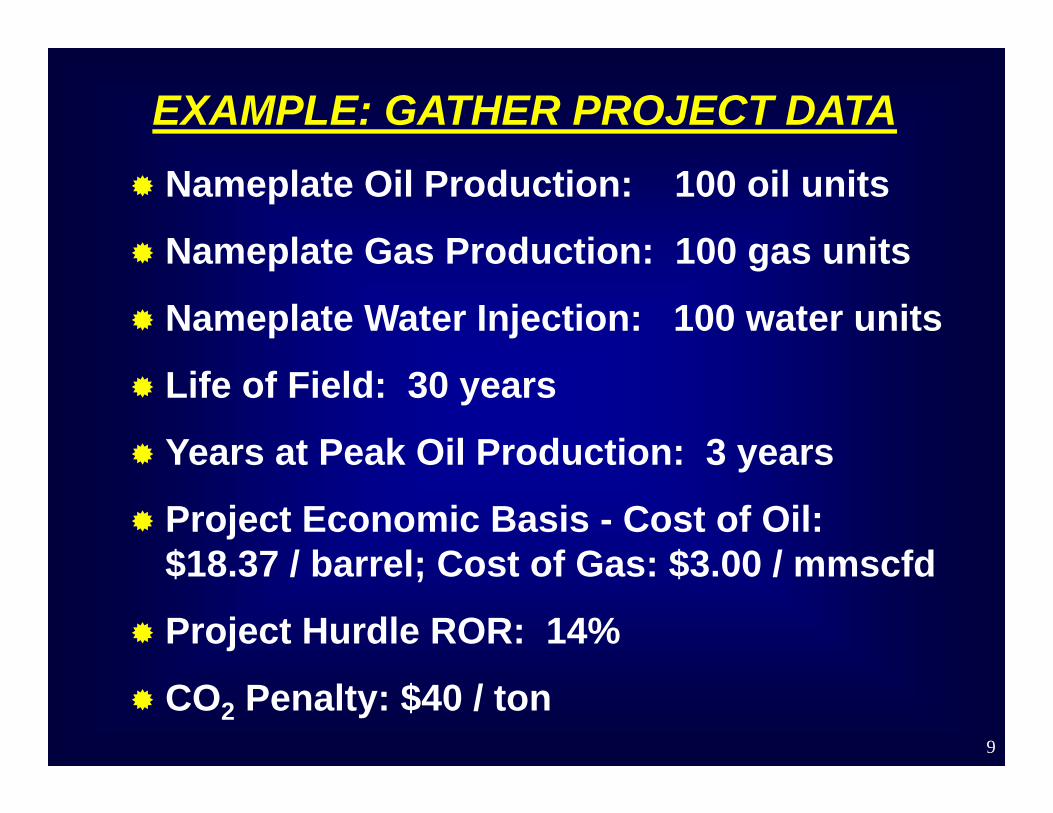
EXAMPLE: GATHER PROJECT DATA Nameplate Oil Production: 100 oil units
Nameplate Gas Production: 100 gas units
Nameplate Water Injection: 100 water units
Life of Field: 30 years
Years at Peak Oil Production: 3 years
Project Economic Basis - Cost of Oil: $18.37 / barrel; Cost of Gas: $3.00 / mmscfd
Project Hurdle ROR: 14%
CO2 Penalty: $40 / ton 9
EXAMPLE: GATHER PROJECT DATA (CONTINUED)
FROM PROJECT ESTIMATING GROUP
Project-specific Topsides Construction Factors to Help Determine Installed Capex
Project-specific Hull Buoyancy Factors to Help Determine Installed Capex (Significant Issue for Floaters)
Project-specific Equipment “Outfitting” Factors (wiring, instrumentation, piping, etc.)
10
EXAMPLE CASE MAJOR DRIVEN EQUIPMENT TO BE CONSIDERED FOR TURBINE DRIVE
Power Generators
Gas Compressors
Oil Pipeline Pumps
Water Injection Pumps
11
0
20
40
60
80
100
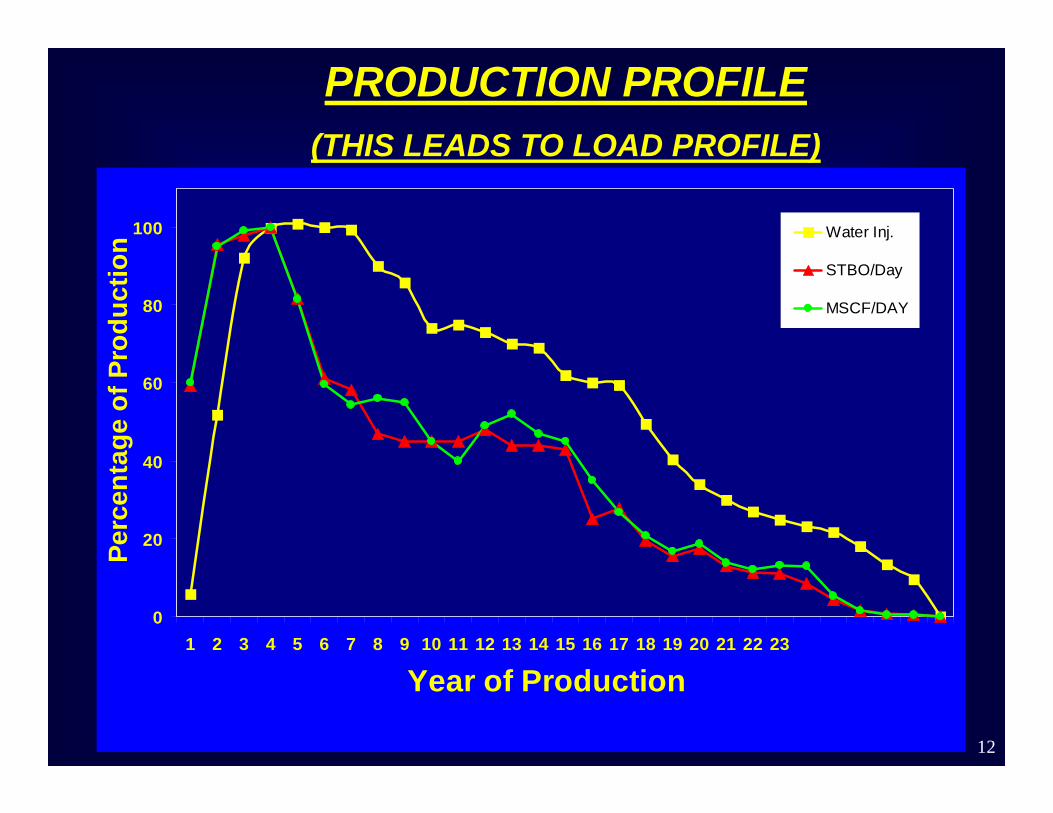
1 2 3 4 5 6 7 8 9 10 11 12 13 14 15 16 17 18 19 20 21 22 23
Year of Production
Perc
enta
ge o
f Pro
duct
ion Water Inj.
STBO/Day
MSCF/DAY
PRODUCTION PROFILE(THIS LEADS TO LOAD PROFILE)
12
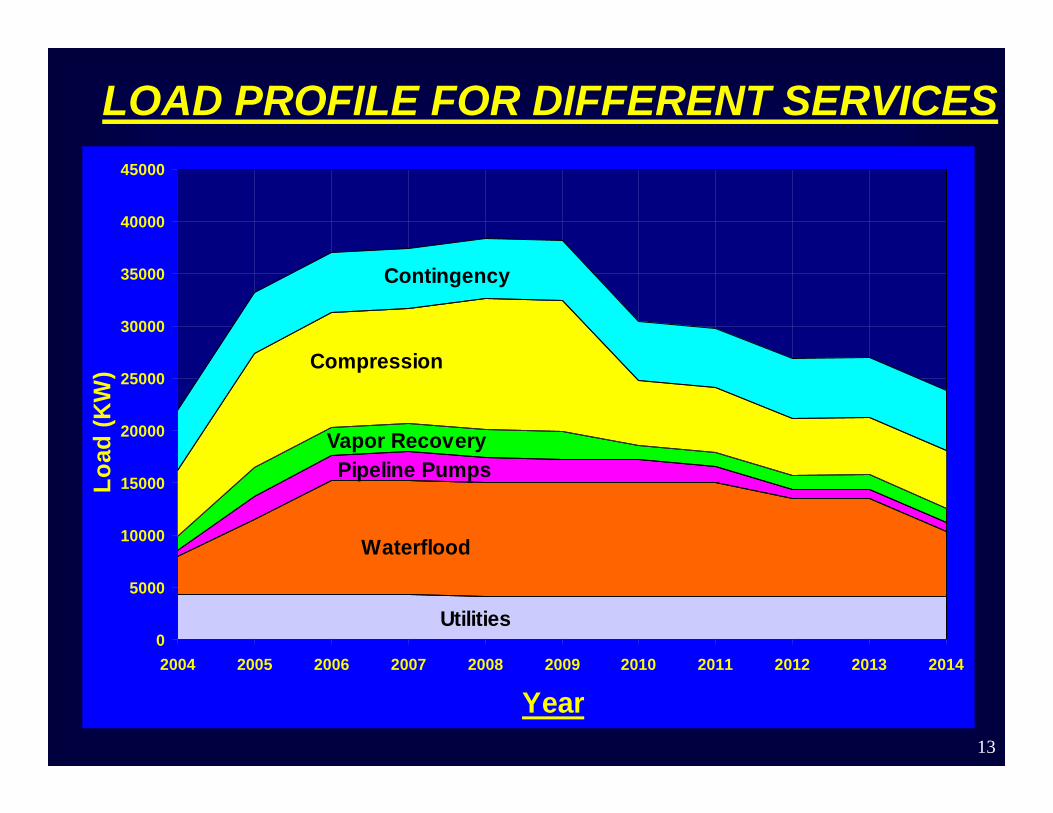
Year
Utilities
Waterflood
Pipeline PumpsVapor Recovery
Compression
Contingency
0
5000
10000
15000
20000
25000
30000
35000
40000
45000
2004 2005 2006 2007 2008 2009 2010 2011 2012 2013 2014
Load
(KW
)LOAD PROFILE FOR DIFFERENT SERVICES
13

CASE STUDY - SELECTION CRITERIA
LIFE-CYCLE COSTS (NPV) – includes Installed CAPEX, OPEX, Availability, Deferred Production and Maintenance Costs
INSTALLED CAPEX (NPV) – this is included in Life-Cycle Costs, but is broken out to Differentiate Cash Flows for each Scenario
ENVIRONMENTAL IMPACT (NPV) - included CO, CO2, NOX and SOX
(Environment Costs were not assessed in 2000-2002 studies, but will be assigned values in future)
14

Cases
$126
$128
$130
$132
$134
$136
$138
$140
$142
$144
1 2 3 4
Life
Cyc
le C
osts
- $M
M
$0
$10,000
$20,000
$30,000
$40,000
$50,000
$60,000
IInst
alle
d C
APE
X - $
M
Life Cycle Cost ($ MM)Installed Capex ($ M)
CASE STUDY - ECONOMIC RESULTSWITHOUT PRODUCTION DEFERMENT
PROBABLE WINNER
15
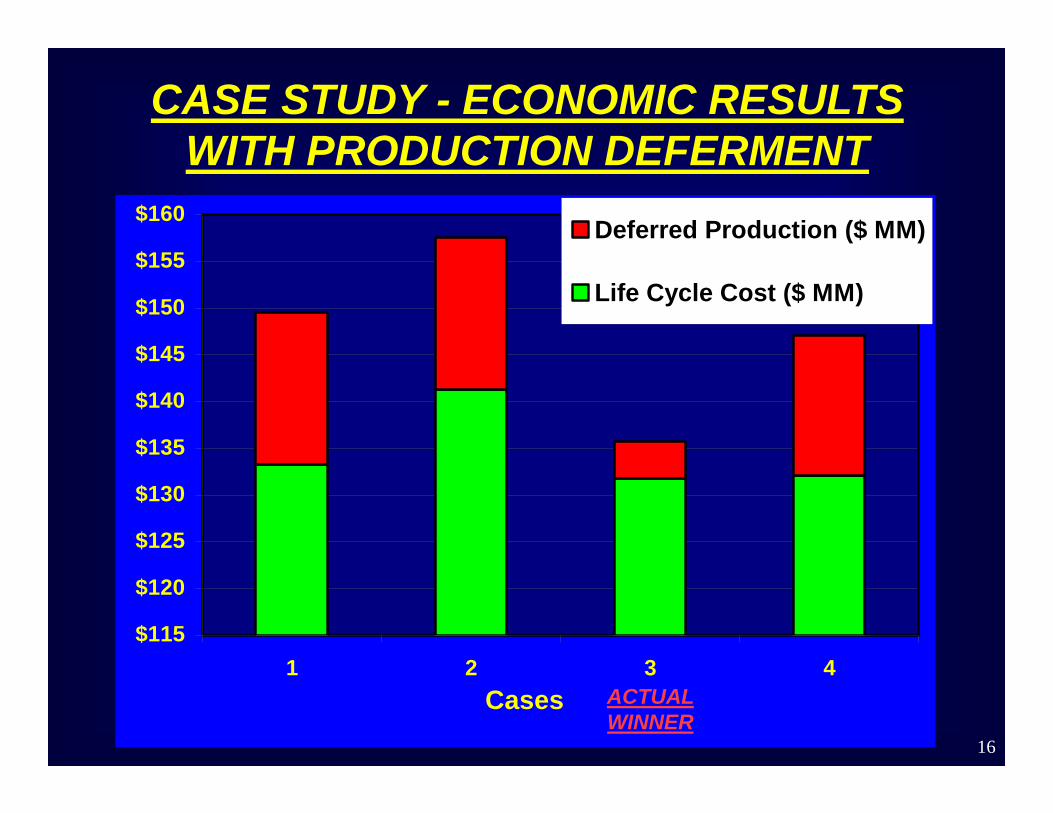
CASE STUDY - ECONOMIC RESULTSWITH PRODUCTION DEFERMENT
Cases
$115
$120
$125
$130
$135
$140
$145
$150
$155
$160
1 2 3 4
Deferred Production ($ MM)
Life Cycle Cost ($ MM)
ACTUAL WINNER
16

IMPACTS OF ALL ELECTRIC SOLUTION
17
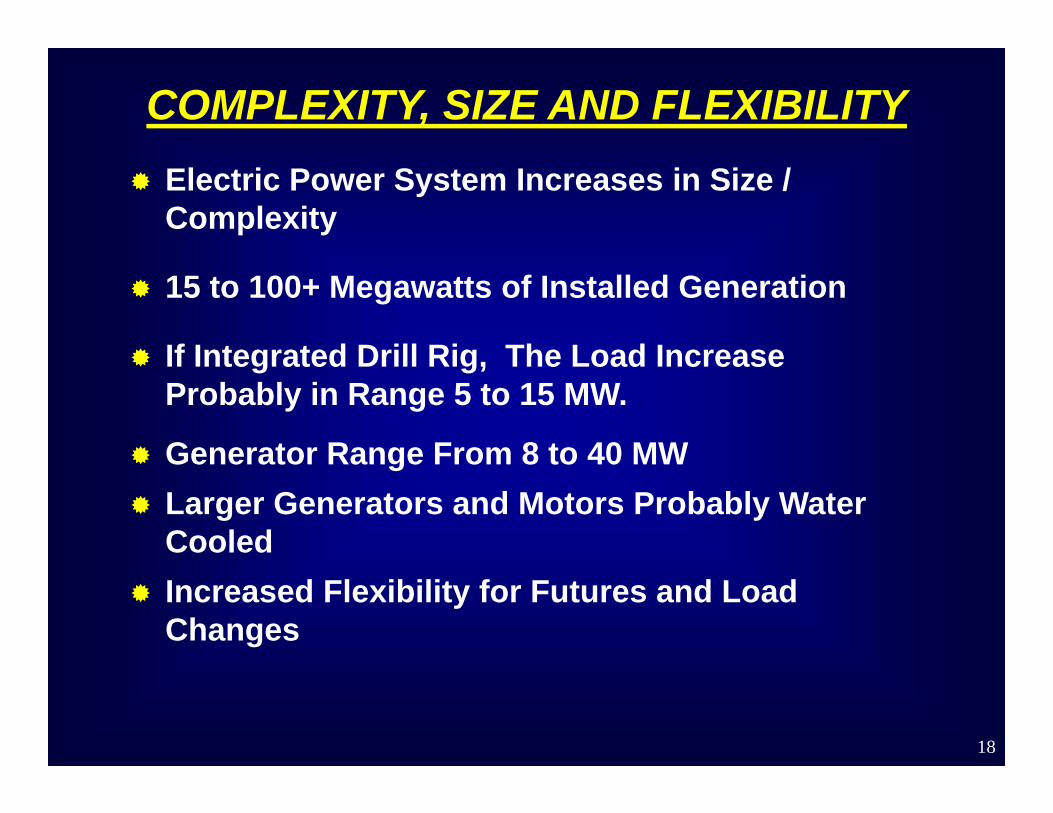
COMPLEXITY, SIZE AND FLEXIBILITY Electric Power System Increases in Size /
Complexity
15 to 100+ Megawatts of Installed Generation
If Integrated Drill Rig, The Load Increase Probably in Range 5 to 15 MW.
Generator Range From 8 to 40 MW Larger Generators and Motors Probably Water
Cooled Increased Flexibility for Futures and Load
Changes
18

ELECTRICAL ROOMS AND BUILDINGS
Drastic Increase in Number and Size over Traditional GOM Platforms More Switchgear and Motor Control Centers
Variable Frequency Drives
Auxiliary Equipment and Control Panels Associated with the Gas Turbine Generators
Consider Sub-stations to Reduce Cabling and Offshore Hook-up
Buildings Range One to Three Story and 1,500 to 12,000+ Square Feet
19
REFLECTIONS ON EARLIER DRIVER STUDIES
The Methodology Discussed Above has been Used on Numerous Large Projects Currently in Operation. The Studies were Necessarily Done Early in the Project (Concept Select Stage) and were Based on the Best Load and Reservoir Data Available at the time as well as the Best Understanding of Field Development and Operation The Methodology has been found to be “Robust” and is
Continuing to be Applied on Projects. The Primary Enhancements to the Methodology have been in: 1) the Evaluation of Production Flaring, and 2) in Assigning Actual Economic Value to CO2 Emissions.
It is Absolutely Essential that the Metrics be Thoroughly Considered and that ALL Stakeholders Agree with them and with their Ranking. It is Equally Important that These Metrics be Honored in the Evaluation of the Scenarios.
Formal Records Should be Kept of the Study. 20

CONCLUSIONS Analytical Method has Withstood the Test of Time
and Has been found to be Extremely Useful for the Selection of the Mix of Drivers for Large Mechanical Loads and Main Power Generators on Numerous Large Offshore Facilities.
ALL Stakeholders must agree on Metrics.
Must Formally Document Assumptions, Metrics, results and Recommendations.
- Results of Previous Studies have been used to Formally Justify Power Plant Designs
Follow Methodology all the way Through – do NOT Jump to Premature Conclusions!
21

Questions and
Comments
22