Driver Behavioral Analysis in Heterogeneous Traffic Conditions
32
Vibhanshu Singh Supervisor: Dr. Caleb Ronald M Driver Behavioral Analysis in Heterogeneous Traffic Conditions Tathva 2015 Department of Civil Engineering, NIT Calicut
-
Upload
vibhanshu-singh -
Category
Engineering
-
view
32 -
download
1
Transcript of Driver Behavioral Analysis in Heterogeneous Traffic Conditions

Vibhanshu Singh
Supervisor: Dr. Caleb Ronald M
Driver Behavioral Analysis in Heterogeneous Traffic Conditions
Tathva 2015
Department of Civil Engineering, NIT Calicut

Introduction
Traffic Data
Driver Behavioral Analysis
Conclusion
22
Overview of the presentation
CED 2
3
Introduction
Why traffic simulation?
Core models of a traffic simulator
Traffic simulation
Homogeneous and Heterogeneous traffic
Objectives

Dynamic representation of real world traffic systems by building a
computer model (Drew 1968)
Driver, vehicle, environment infrastructure
44
Traffic simulation
CED 4

Understand the complex dynamic interactions between
the driver, the vehicle, and the environment
Design of traffic systems
Operational quality of the existing facilities
Understand when and how traffic jams emerge?
Road safety
55
Why traffic simulation
CED 5

66
Core models of a traffic simulator
CED 6
Car-following
Lane-changing
77
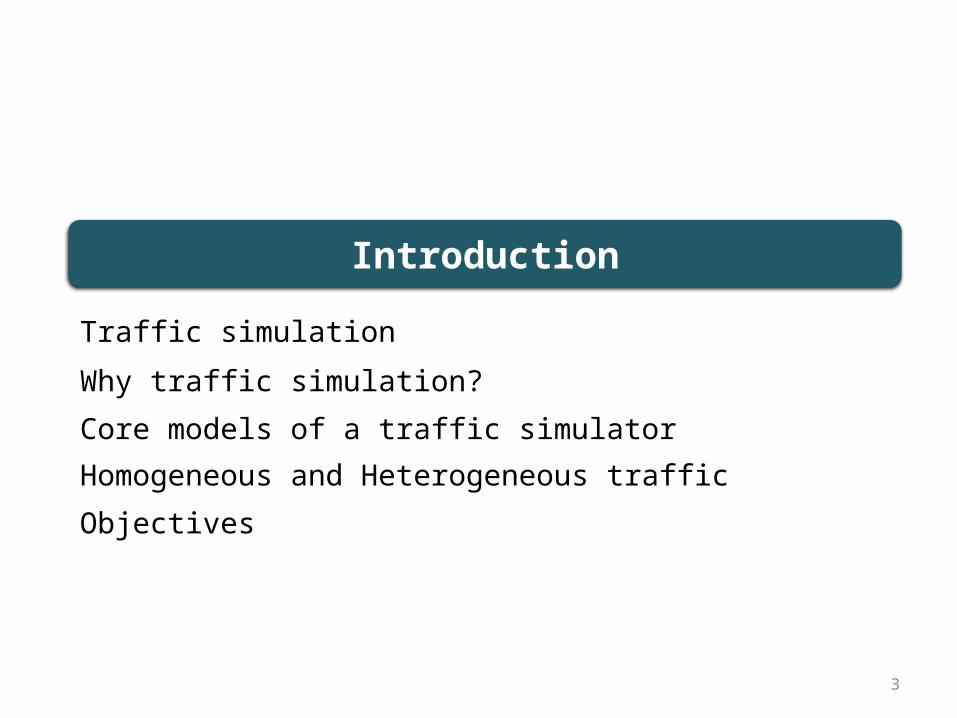
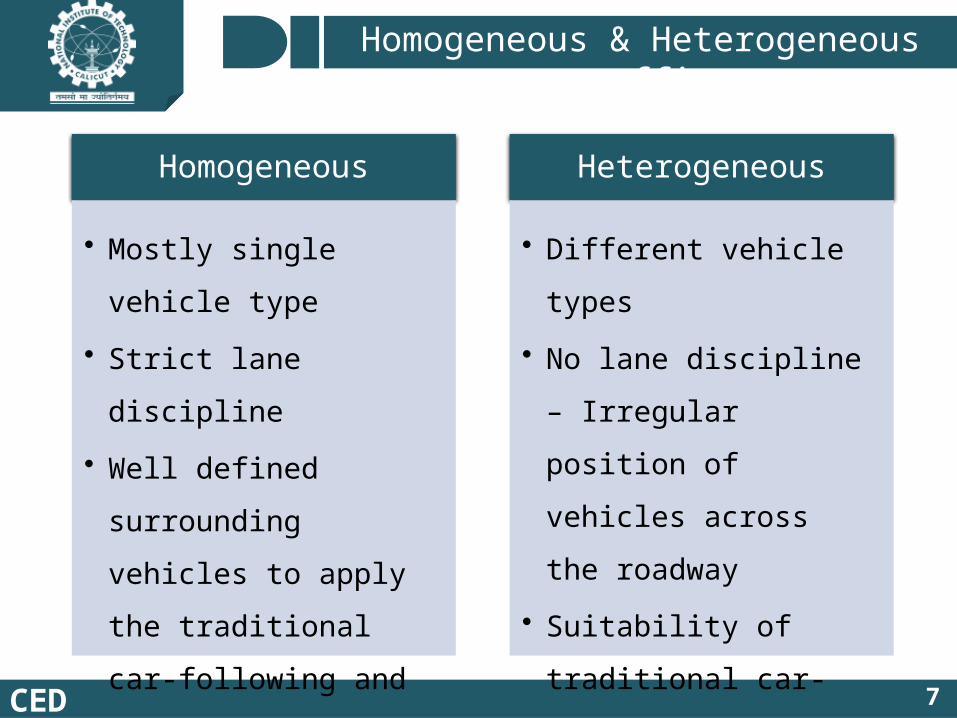
Homogeneous & Heterogeneous traffic
CED 7
Homogeneous
• Mostly single vehicle
type
• Strict lane discipline
• Well defined surrounding
vehicles to apply the
traditional car-following
and lane-changing
models
Heterogeneous
• Different vehicle types
• No lane discipline –
Irregular position of
vehicles across the
roadway
• Suitability of traditional
car-following and lane-
changing models???
88
Homogeneous & Heterogeneous traffic
CED 8
AMERICA INDIA
When Normal
When Drunk
When Normal
When Drunk

To obtain the trajectory data of vehicles
To understand the longitudinal movement behavior of
drivers
To analyse the lateral movement behavior of drivers
To analyse the non-lane disciplined movements of drivers
99
Objectives
CED 9

10
Traffic Data
Trajectory dataset
Data processing
Site details

Data collected from a 245m long uninterrupted stretch in Chennai,
India
30 minutes data from 2:45 PM - 3:15 PM
Flow of 6010 veh/hr
Data source - Kanagaraj et al. (2015)
http://toledo.net.technion.ac.il/mixed-traffic-trajectory-data/
1111
Site details
CED 11
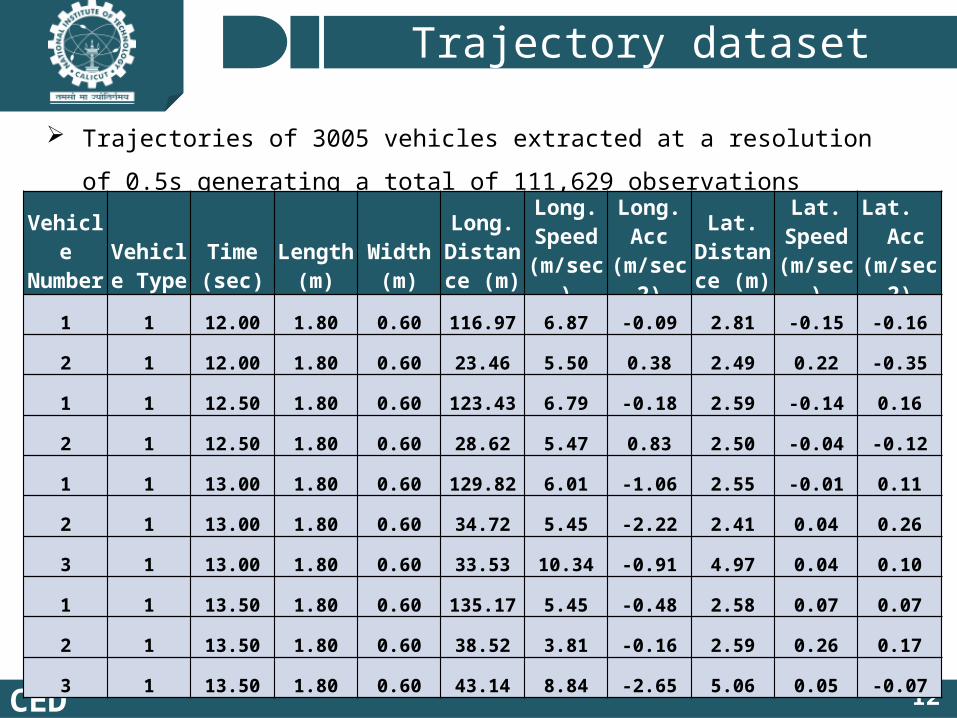
Trajectories of 3005 vehicles extracted at a resolution of 0.5s generating a
total of 111,629 observations
1212
Trajectory dataset
CED 12
Vehicle Number
Vehicle Type
Time (sec)
Length (m)
Width (m)
Long. Distance
(m)
Long. Speed
(m/sec)
Long. Acc
(m/sec2)
Lat. Distance
(m)
Lat. Speed
(m/sec)
Lat. Acc
(m/sec2)
1 1 12.00 1.80 0.60 116.97 6.87 -0.09 2.81 -0.15 -0.16
2 1 12.00 1.80 0.60 23.46 5.50 0.38 2.49 0.22 -0.35
1 1 12.50 1.80 0.60 123.43 6.79 -0.18 2.59 -0.14 0.16
2 1 12.50 1.80 0.60 28.62 5.47 0.83 2.50 -0.04 -0.12
1 1 13.00 1.80 0.60 129.82 6.01 -1.06 2.55 -0.01 0.11
2 1 13.00 1.80 0.60 34.72 5.45 -2.22 2.41 0.04 0.26
3 1 13.00 1.80 0.60 33.53 10.34 -0.91 4.97 0.04 0.10
1 1 13.50 1.80 0.60 135.17 5.45 -0.48 2.58 0.07 0.07
2 1 13.50 1.80 0.60 38.52 3.81 -0.16 2.59 0.26 0.17
3 1 13.50 1.80 0.60 43.14 8.84 -2.65 5.06 0.05 -0.07

Algorithm for processing the raw data file
startread the trajectory data filefor all entries
get the vehicle number and vehicle typeget the time
sort according to the vehicle number, vehicle type and time
end forfor all vehicle types
read the lateral shift threshold values for all vehicle types
get cumulative differences of lateral coordinatesif cumulative difference > threshold value and >0; count as right movement
if cumulative difference > threshold value and <0; count as left movement
get the corresponding lateral movement durationsend for
end
1313
Data processing
CED 13

14
Driver Behavioral Analysis
Longitudinal movement behavior
Lateral movement behavior
Vehicle composition
Lateral movement duration distribution models
Non-lane discipline behavior
1515
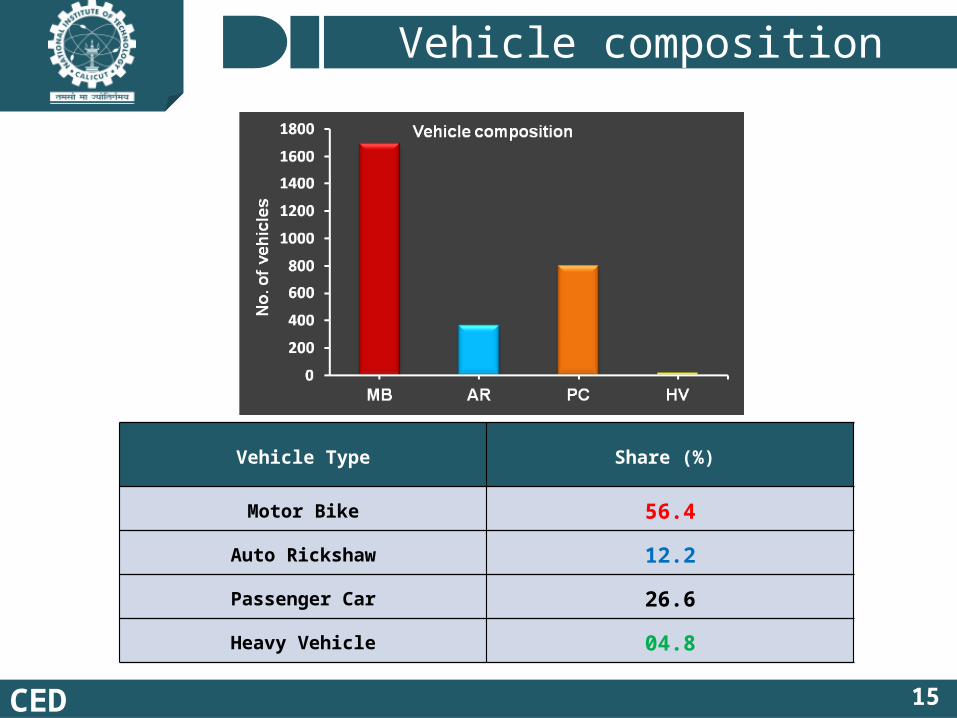
Vehicle composition
CED 15
Vehicle Type Share (%)
Motor Bike 56.4
Auto Rickshaw 12.2
Passenger Car 26.6
Heavy Vehicle 04.8

1616
Longitudinal speed
CED 16
ANOVA Test ResultsP-value: 0.00Null Hypothesis: Reject

1717
Longitudinal Accl. and Decl.
CED 17
ANOVA Test ResultsP-value: 1.62E-12Null Hypothesis: Reject
ANOVA Test ResultsP-value: 5.00E-59Null Hypothesis: Reject

1818
Lateral speed
CED 18
ANOVA Test ResultsP-value: 0.00Null Hypothesis: Reject

1919
Lateral Accl. and Decl.
CED 19
ANOVA Test ResultsP-value: 6.00E-161Null Hypothesis: Reject
ANOVA Test ResultsP-value: 1.50E-60Null Hypothesis: Reject

2020
Frequency of lateral movements
CED 20

2121
Lateral movement duration
CED 21
ANOVA Test ResultsP-value: 4.96E-79Null Hypothesis: Reject

2222
Lateral movement duration models
CED 22
Lognormal (0.55, 0.62)

2323
Lateral movement duration models
CED 23
Lognormal (0.98, 0.70)

2424
Lateral movement duration models
CED 24
Lognormal (0.94, 0.74)

2525
Lateral movement duration models
CED 25
Lognormal (1.25, 0.50)

2626
Non-lane discipline
CED 26

27
Conclusion
Conclusions
Contributions
Summary
Future work
Proposed an algorithm to process the raw trajectory data of
vehicle and to obtain various driver behavioral characteristics
Analysed the longitudinal movement behavior of drivers in
heterogeneous traffic conditions
Analysed the lateral movement behavior of drivers
Developed lateral movement duration distribution models
Analysed the non-lane discipline characteristics of
heterogeneous traffic streams
2828
Summary
CED 28

Significant differences exist in the driving behaviors of
various vehicle type drivers
Motorbike drivers are more aggressive in their behavior
Heavy vehicle drivers are conservative and mostly
homogenous in their behavior
Lane discipline is not observed by the drivers in
heterogeneous traffic conditions
2929
Conclusions
CED 29

Established the fact that ‘vehicle-type’ plays a major role
in simulating the drivers’ behaviors observed in
heterogeneous traffic streams
Established the fact that ‘lane discipline’ is not followed by
the drivers in heterogeneous traffic conditions
Established the need to account for vehicle-type
dependency and non-lane discipline while developing
heterogeneous traffic simulators
3030
Contributions
CED 30

Analysis of the drivers’ motivation and choice making behaviors
during lateral movements
Development of vehicle-type dependent longitudinal movement
driver behavioral models
Development of vehicle-type dependent lateral movement decision
and choice making driver behavioral models
Development of vehicle-type dependent lateral movement
execution models
Proposing a simulation which can handle non-lane based
movements of heterogeneous traffic drivers
3131
Future work
CED 31

32
Thank You !!!