Drinking Water Annual Report City of Kelowna...Drinking Water Annual Report City of Kelowna June...
22
Drinking Water Annual Report City of Kelowna June 2015 1435 Water Street Kelowna, BC V1Y 1J4 TEL 250 469-8610 FAX 250 862-3349 kelowna.ca
Transcript of Drinking Water Annual Report City of Kelowna...Drinking Water Annual Report City of Kelowna June...
Drinking Water Annual Report City of Kelowna
June 2015
1435 Water Street
Kelowna, BC V1Y 1J4
TEL 250 469-8610
FAX 250 862-3349
kelowna.ca
CITY OF KELOWNA Drinking Water Annual Report
2 | P a g e
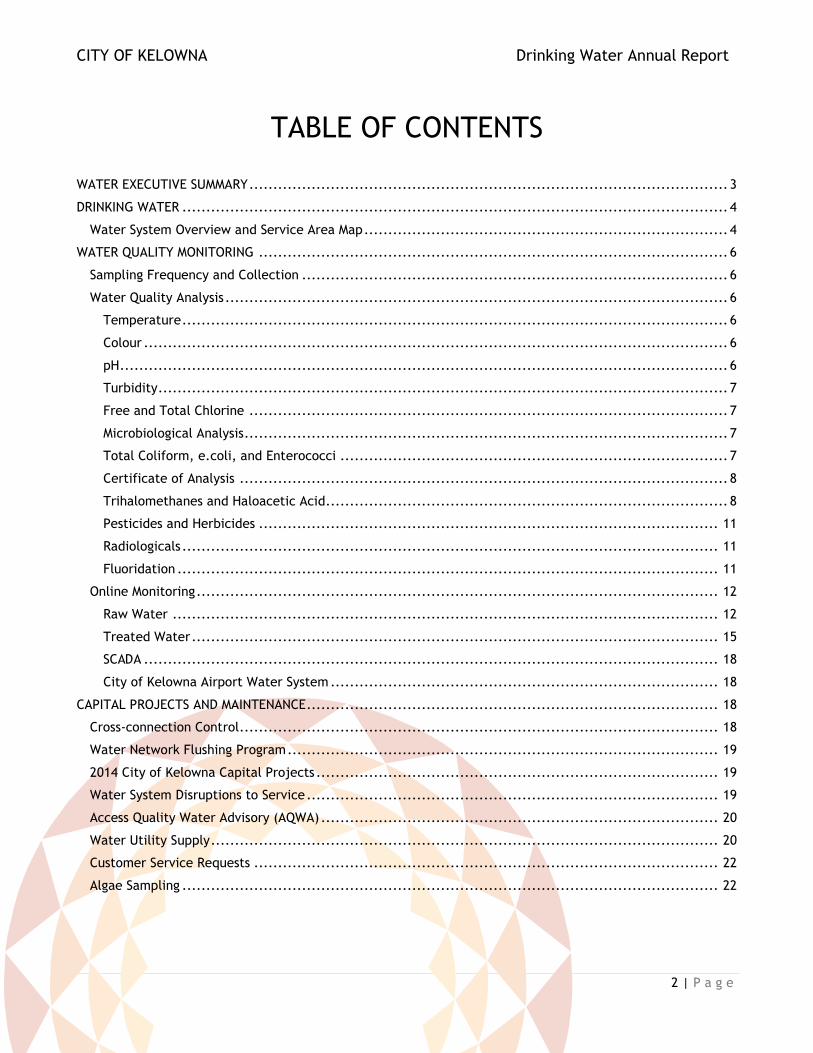
TABLE OF CONTENTS
WATER EXECUTIVE SUMMARY .................................................................................................... 3
DRINKING WATER .................................................................................................................. 4
Water System Overview and Service Area Map ............................................................................ 4
WATER QUALITY MONITORING .................................................................................................. 6
Sampling Frequency and Collection ......................................................................................... 6
Water Quality Analysis ......................................................................................................... 6
Temperature .................................................................................................................. 6
Colour .......................................................................................................................... 6
pH ............................................................................................................................... 6
Turbidity ....................................................................................................................... 7
Free and Total Chlorine .................................................................................................... 7
Microbiological Analysis ..................................................................................................... 7
Total Coliform, e.coli, and Enterococci ................................................................................. 7
Certificate of Analysis ...................................................................................................... 8
Trihalomethanes and Haloacetic Acid.................................................................................... 8
Pesticides and Herbicides ................................................................................................ 11
Radiologicals ................................................................................................................ 11
Fluoridation ................................................................................................................. 11
Online Monitoring ............................................................................................................. 12
Raw Water .................................................................................................................. 12
Treated Water .............................................................................................................. 15
SCADA ........................................................................................................................ 18
City of Kelowna Airport Water System ................................................................................. 18
CAPITAL PROJECTS AND MAINTENANCE ...................................................................................... 18
Cross-connection Control .................................................................................................... 18
Water Network Flushing Program .......................................................................................... 19
2014 City of Kelowna Capital Projects .................................................................................... 19
Water System Disruptions to Service ...................................................................................... 19
Access Quality Water Advisory (AQWA) ................................................................................... 20
Water Utility Supply .......................................................................................................... 20
Customer Service Requests ................................................................................................. 22
Algae Sampling ................................................................................................................ 22

CITY OF KELOWNA Drinking Water Annual Report
WATER EXECUTIVE SUMMARY
Protection of Kelowna’s water sources is of primary importance to sustain a healthy society and economy. The City of Kelowna has adopted a ‘source to tap’ management program that is considered to be one of the best in Canada. The plan collectively addresses water issues at several levels to ensure that the quality of drinking water provided meets provincial and federal drinking water guidelines.
Rigorous testing of both raw and treated water is performed by qualified technicians at numerous sites
including tributaries, Okanagan Lake, pump stations, booster stations, reservoirs, and various points
throughout the distribution system. Online monitoring equipment installed at four pump stations
record continuous data to show water quality trends and aid in early detection of any quality deviation
that may occur. Since 1996 all parameters of drinking water, physical, chemical and microbiological,
have continually met Canadian Drinking Water Guidelines. To further enhance water treatment, the
Water Utility installed Ultraviolet (UV) disinfection equipment at Poplar Point. Eldorado and Swick Road
pump stations in 2005. In 2014, UV disinfection was added to the Cedar Creek system located in the
Kettle Valley sub-division. The UV disinfection inhibits the ability of bacteria (including Cryptosporidium
and Giardia) to reproduce and does not utilize chemicals or generate by-products.
Maintenance practices have been improved (e.g. upgrades to the Water Network Flushing Program) and
Cross Connection Control is in place to enhance the safety of our drinking water during its delivery.
The City Water Utility plans to continue management in a manner that ensures a reliable and safe water
supply and encourages sustainable water use, while simultaneously conserving capital expense and
enhancing the quality of life for the citizens of Kelowna.

CITY OF KELOWNA Drinking Water Annual Report
DRINKING WATER
Water System Overview and Service Area Map
The City of Kelowna Water Utility is one of five water purveyors within the City boundary. The City’s water
utility utilizes Okanagan Lake as the primary water source. Within the water utility boundary there are two
systems found. The first system provides water to 60,000 customers from Poplar Point, Eldorado and Cedar
Creek Pump Stations and the second system is the Swick Road system which provides water to approximately
300 customers. The City of Kelowna remains committed to the continuous improvement of its services to
achieve its primary mandate, which is to provide water that meets federal and provincial drinking water
guidelines.
The Water Utility is EOCP classified as a level IV water distribution system. The conditions that determine a
level IV system are; population served, water storage capacity, flow and pumping ability. The infrastructure
that makes up the water utility includes four pump stations, 21 booster stations, 22 reservoirs, 21 Pressure
Reducing Stations and three Pressure Zones.
The City of Kelowna Water utility is maintained by EOCP certified operators. Within the utility, there are two
level IV operators, three level III operators, four level II operators, one SCADA/Systems operator, two
electrician and instrumentation, one millwright, and two Water Quality Technicians.
The City of Kelowna also operates and maintains the Kelowna International Airport Water System. This system
receives their water from the Glenmore Ellison Improvement District. The system uses microfiltration as a
form of treatment for the drinking water. Figure 1.0, on the following page, displays the City of Kelowna’s
population distribution map. This link will help you find out who supplies your drinking water, or visit
kelowna.ca/utilities.

CITY OF KELOWNA Drinking Water Annual Report

CITY OF KELOWNA Drinking Water Annual Report
WATER QUALITY MONITORING
Sampling Frequency and Collection Qualified technicians perform more than 1000 tests monthly on source water and water within the distribution system. To properly assess drinking water quality, samples are taken from the source (Okanagan Lake) to tap (terminating points) throughout the distribution system. Sample sites include pump stations, reservoirs, booster stations, valve chambers, and sample stations. The minimum number of sample sites required for the City is sixty, based on population served; however, typically over one hundred sites throughout the system are actually sampled on a monthly basis.
The City is required by the Interior Health Authority to contract a private lab (ALS Laboratories) monthly to perform duplicate testing of total and faecal coliform samples from 24 locations. Data results are entered into WaterTrax, an information database that simultaneously alerts public health authorities, water operation staff, and management if microbiological parameters exceed Guidelines for Canadian Drinking Water Quality (GCDWQ).
Water Quality Analysis The City of Kelowna Water Quality Technicians sample four pumping stations for raw and treated water two times per week, As well as, approximately 100+ additional sites throughout the distribution system. Samples are taken from start point to mid point and then end point locations. These water samples are then analyzed for temperature, colour, pH, turbidity, free and total chlorine.
Temperature Certain lake activities such as seasonal mixing can cause water quality to degrade. The City Water Utility continuously monitors raw water intake temperatures to gain information about Okanagan Lake’s seasonal and mixing trends. Temperature of treated water varies with seasonal temperature, as does the raw water. Treated water temperatures have continued to remain below the GCDWQ of 15°C, since 1991. See Appendix F for details on temperature, or the graphs on page 9.
Colour Colour in drinking water may be present due to organic substances or metals such as iron, manganese and copper. There are no established GCDWQ for colour, but there is an aesthetic objective set at < 15 true colour units (TCU). The City of Kelowna colour is monitored daily at every sample site and is well below the AO of 15 TCU. For additional information see Appendix F for additional information.
pH The Canadian Drinking Water Guideline stipulates a pH range between 6.5 and 8.5 for drinking water. The pH of both raw and treated water continues to remain within the accepted range. A certified lab routinely performs additional water chemistry analysis, which is part of Provincial and Federal Guidelines and Regulations.

CITY OF KELOWNA Drinking Water Annual Report
Turbidity Turbidity is an indirect measure of suspended material in water. The unit of measurement is NTU (nephelometric turbidity unit) and describes the amount of light that is scattered and absorbed, rather than transmitted, through a water sample. There is a direct relationship between the amount of scattered light and the turbidity of water. Suspended matter can include clay, silt, fine organic and inorganic matter, coloured soluble organic compounds, and microscopic organisms such as plankton. Monitoring turbidity in drinking water is critical because sediment and silt cover bacteria, preventing complete disinfection. The GCDWQ for water entering a distribution system is 1.0 NTU.
Free and Total Chlorine Chlorine is a disinfectant added to drinking water to reduce or eliminate microorganisms such as bacteria and viruses that can be present in water supplies. The City of Kelowna uses three forms of chlorine disinfection. The Poplar Point and Eldorado pump stations use chlorine gas for disinfection. Cedar Creek uses chlorine regeneration and Swick Road pump station use sodium hypochlorite for disinfection. There are no established GCDWQ for Chlorine. Typically, water utilities will have a range anywhere from 0.2 – 2.00 mg/L throughout the system.
Microbiological Analysis Microbiological analysis includes:
Total coliform
Escherichia coli (e.coli)
Enterococcus
Heterotrophic plate counts (HPC)
Total Coliform, e.coli, and EnterococciTotal coliforms, although not an indicator of faecal contamination, are useful as an indicator of overall water quality. Escherichia coli is the microbial indicator that is used most often for determining faecal contamination of water sources. (Health Canada, 2006a). The GCDWQ is set that when sampled for, total coliform and e.coli in treated water are set at zero organisms detectable per 100 mL. Enterococci can be used to indicate faecal contamination and indirectly indicate the presence of viruses (U.S. EPA, 2000; Ashbolt et al., 2001). There is no established guideline for Enterococcus, however, the treatment goal is a minimum four log reduction and/or inactivation of enteric viruses Treated water is sampled on a regular basis by Water Quality technicians and has continued to show no presence of total coliform, e.coli, or enterococcus.

CITY OF KELOWNA Drinking Water Annual Report
Certificate of Analysis The City of Kelowna is required by the Interior Health Authority (IHA) to have a yearly certificate of analysis completed on the water system. The samples are collected at the end of July and sent to an external laboratory (ALS Laboratories in Vancouver) and analyzed for anions and nutrients, total metals, physical parameters, and bacteriological test. All parameters measured have continued to consistently meet federal and provincial guidelines. Appendix B shows the 2014 Certificate of Analysis.
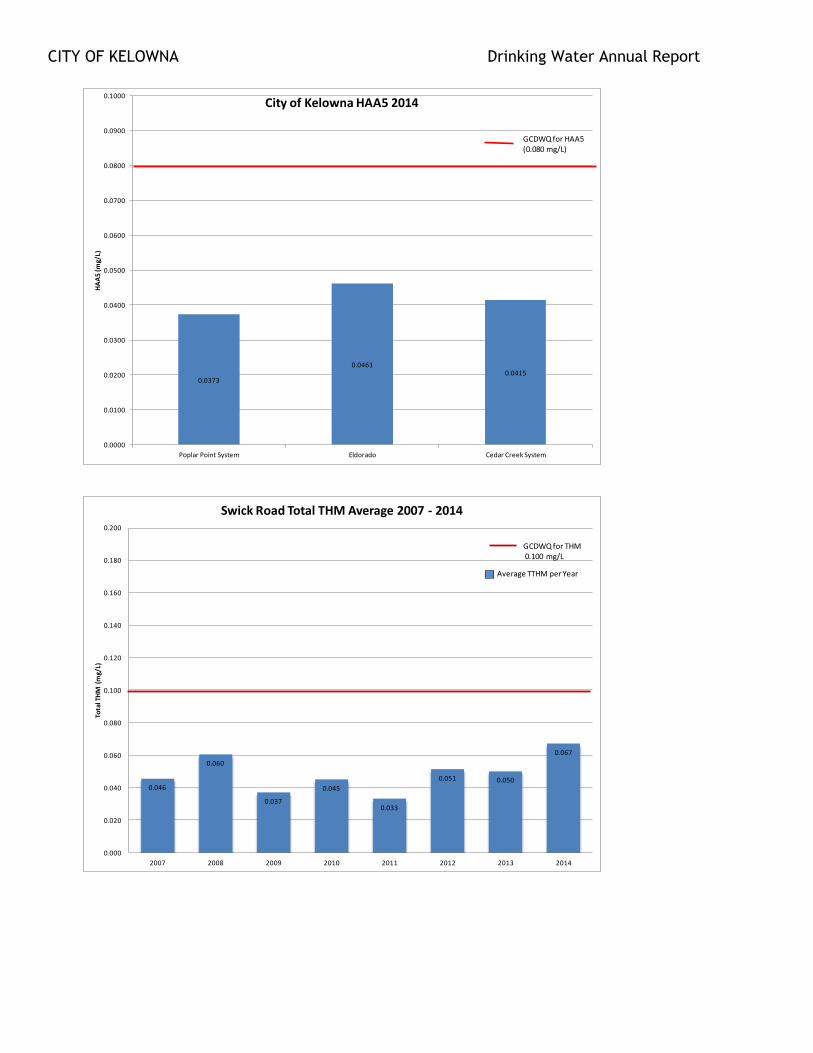
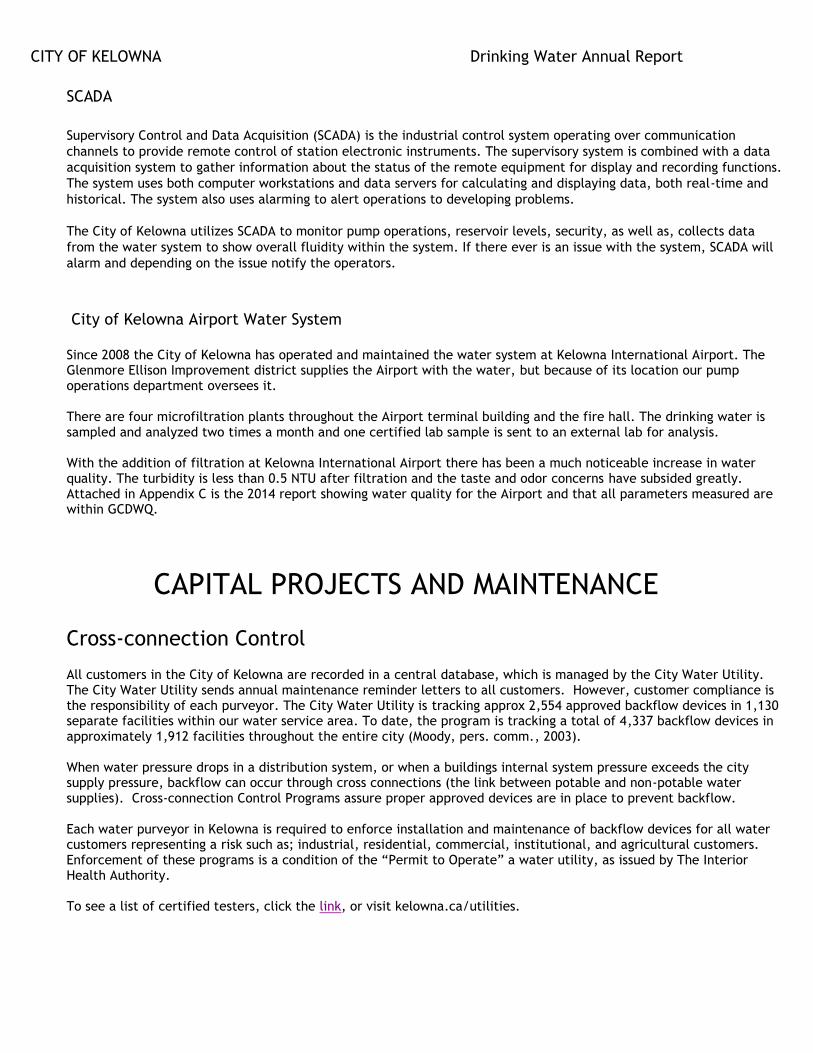
Trihalomethanes and Haloacetic Acid
Trihalomethanes (THM) are a suspected cancer causing substance that can form in chlorinated water where significant amounts of organic material are present. The Canadian Drinking Water Guidelines have set a strict maximum contaminant level to 100 ppb (µg/L). The City of Kelowna THM data falls well below federal guidelines for potable water supply of 100 ppb. The 2014 twelve-month average was 50 ppb. The haloacetic acids (HAAs) are byproducts of disinfection. Haloacetic acids may be created during water treatment when chlorine-based disinfectants react with organic matter dissolved in water. The formation of haloacetic acids in drinking water as a disinfection by-product is a concern for human health. The GCDWQ for HAA’s is 80 ppb (ug/L). HAA’s are sampled parallel with THM’s and have a 2014 running average of 40 ppb. (Health Canada) Since both THM and HAA levels have consistently remained well below guidelines, the Interior Health Authority has approved a reduction in the frequency of testing to four times per year to provide minimum and maximum THM and HAA concentrations.
0.045
0.038
0.0520.043
0.047 0.052 0.0550.051
0.051
0.04
0.0350.038
0.045
0.073
0.0438
0.0637
0.037 0.0350.032 0.031
0.053 0.053 0.05500.0520
0.000
0.020
0.040
0.060
0.080
0.100
0.120
0.140
0.160
0.180
0.200
2007 2008 2009 2010 2011 2012 2013 2014
Tota
l TH
M (
mg/
L)
City of Kelowna Total THM Average 2007 - 2014
Poplar Point System
Eldorado
Cedar Creek System
GCDWQ for THM(0.100 mg/L)
CITY OF KELOWNA Drinking Water Annual Report
0.0373
0.04610.0415
0.0000
0.0100
0.0200
0.0300
0.0400
0.0500
0.0600
0.0700
0.0800
0.0900
0.1000
Poplar Point System Eldorado Cedar Creek System
HA
A5
(mg/
L)City of Kelowna HAA5 2014
GCDWQ for HAA5(0.080 mg/L)
0.046
0.060
0.037
0.045
0.033
0.051 0.050
0.067
0.000
0.020
0.040
0.060
0.080
0.100
0.120
0.140
0.160
0.180
0.200
2007 2008 2009 2010 2011 2012 2013 2014
Tota
l TH
M (
mg/
L)
Swick Road Total THM Average 2007 - 2014
GCDWQ for THM0.100 mg/L
Average TTHM per Year

CITY OF KELOWNA Drinking Water Annual Report
0.0354
0.0612
0
0.01
0.02
0.03
0.04
0.05
0.06
0.07
0.08
0.09
0.1
Rimrock Timberline Crt SS
HA
A5
(mg/
L)
Swick Road HAA5 2014 GCDWQ for HAA5(0.080 mg/L)

CITY OF KELOWNA Drinking Water Annual Report
Pesticides and Herbicides
Pesticides and Herbicides are tested every four years at the four intakes along Okanagan Lake. Tests scan for fifty-five different pesticides and herbicides. No pesticides or herbicides have been detected in any samples collected from Okanagan Lake throughout the history of monitoring. Detailed data are available in the Appendix A of the report.
Radiologicals
Radionuclides are naturally present in the environment; they may also enter the environment as a result of human activities. Natural sources of radiation are responsible for the large majority of radiation exposure (greater than 98%), excluding medical exposure. Maximum acceptable concentrations in drinking water have been established for three natural (210Pb, 226Ra, and total uranium in chemical form) and four artificial (tritium, 90Sr, 131I, and 137Cs) radionuclides. These represent the natural and artificial radionuclides that are most commonly detected in Canadian water supplies.
The City of Kelowna has been testing for radionuclides since 2011. All samples are sent to the SRC (Saskatchewan Research Council) for the analysis. Appendix C shows the yearly results depicting that no radionuclides have been detected.
Fluoridation
The City’s main drinking water supply was fluoridated from 1954 to 1996. A public vote regarding fluoridation was incorporated into the 1996 municipal election and resulted in a “No” vote (City of Kelowna, 1996). Hence, fluoridation ceased in November of 1996 when the remaining supply of fluorosilicic acid was depleted (Toma, pers. comm., 1997). Fluoride concentrations were monitored regularly at Poplar Point until October of 1997 to determine background levels.

CITY OF KELOWNA Drinking Water Annual Report
0
2
4
6
8
10
12
14
16
18
Jan Feb Mar Apr May Jun Jul Aug Sep Oct Nov Dec
Co
lor
(TC
U)
and
Te
mp
era
ture
(0C
)
Pump Station Source Water Color and Temperature 2014
Poplar Point Color
Cedar Creek Color
Eldorado Color
Poplar Point Temperature
Cedar Creek Temperature
Eldorado Temperature
7.66
7.75 7.767.79
7.74 7.737.76
7.67 7.677.70
7.78
7.91
7.73 7.73
7.87 7.89
7.78
7.84
7.75
7.67
7.78
7.857.89
7.99
7.937.96
6.50
6.70
6.90
7.10
7.30
7.50
7.70
7.90
8.10
8.30
8.50
Jan Feb Mar Apr May Jun Jul Aug Sep Oct Nov Dec
pH
Pump Station Source Water pH 2014
Poplar Point Treated pH
Cedar CreekTreated pH
Eldorado Treated pH
Online Monitoring
Raw Water
Online monitoring equipment provides continuous pH, temperature, conductivity, and turbidity data on the raw water at Poplar Point, Eldorado, Cedar Creek, and Swick Road pump stations. This data allows prompt detection of any deviations in water quality. If any significant change occurs, either a moderate or high response is generated immediately to standby personnel. To maintain accurate data, manual samples are collected and analyzed by City staff twice per week.

CITY OF KELOWNA Drinking Water Annual Report
0.2970.262
0.3570.412
0.481 0.477
0.373 0.370 0.3720.317 0.308 0.314
0.367
0.277
0.385
0.716
0.597 0.6200.58
0.615 0.605
0.492
0.398
0.0000 0 0 0 0.000
0.743
0.637
1.02
0 0 0 00.000
0.200
0.400
0.600
0.800
1.000
1.200
Jan Feb Mar Apr May Jun Jul Aug Sep Oct Nov Dec
NTU
City of Kelowna Source Water Turbidity 2014
Poplar Point
Cedar Creek
Eldorado
6 6 6 6
7
11 11
10
9
8 8
6
7.58 7.567.77 7.65 7.71 7.85 7.85 7.83 7.92 7.95 7.76 7.65
5.5
5.0 5.0
6.0
8.0
10.5
12.5
14.5
16.5
15.0
10.5
7.0
0
2
4
6
8
10
12
14
16
18
Jan Feb Mar Apr May Jun Jul Aug Sep Oct Nov Dec
Swick Road Source Water Color. pH and Temperature 2014
Swick Raw Color
Swick Raw pH
Swick Raw Temp

CITY OF KELOWNA Drinking Water Annual Report
0.270
0.241
0.278
0.342
0.385
0.530
0.490
0.4440.431
0.384
0.311
0.225
0.000
0.100
0.200
0.300
0.400
0.500
0.600
0.700
0.800
0.900
1.000
Jan Feb Mar Apr May Jun Jul Aug Sep Oct Nov Dec
NTU
Swick Road Source Water Turbidity 2014
Swick Road

CITY OF KELOWNA Drinking Water Annual Report
7.487.55
7.60 7.637.59 7.60 7.59
7.52 7.517.47 7.46
7.53
7.968.03 8.06 8.06
7.887.84 7.82
7.73
7.89 7.867.80
7.65
7.81 7.837.79
7.55
5.50
5.75
6.00
6.25
6.50
6.75
7.00
7.25
7.50
7.75
8.00
8.25
8.50
8.75
9.00
Jan Feb Mar Apr May Jun Jul Aug Sep Oct Nov Dec
pH
City of Kelowna Pump Station pH 2014
Poplar Point Treated pH
Cedar CreekTreated pH
Eldorado Treated pH
CDWG for pH is 6.5-8.5
Treated Water
Online monitoring is also on the treated water at the four pumps stations. Chlorine analyzers, pH meters, and turbidity meters monitor treated water provide a database that is used to determine accurate treatment requirements. If there is a deviation in chlorine and/or turbidity the pumps will automatically shut down to prevent poorly treated water from entering the system.
Additionally, chlorine analyzers are also installed on strategic points in the distribution grid, providing disinfection data throughout the drinking water system. Manual sampling is performed daily to ensure the online equipment is operating correctly and disinfection has occurred.

CITY OF KELOWNA Drinking Water Annual Report
0
4
8
12
16
20
24
Jan Feb Mar Apr May Jun Jul Aug Sep Oct Nov Dec
Pump Station Treated Water Color and Temperature 2014
Poplar Point Color
Cedar Creek Color
Eldorado Color
Poplar Point Temperature
Cedar Creek Temperature
Eldorado Temperature
CDWG AO for Color and Temperature is < 15
0.3400.289
0.369
0.428
0.5270.480
0.4050.349
0.3970.339 0.316 0.329
0.4070.299
0.4420.397
0.463
0.558 0.560
0.601
0.573
0.470
0.338
0.210
0 0 0 0 0
0.7160.684
0.632
0.423
0 0 00.000
0.200
0.400
0.600
0.800
1.000
1.200
Jan Feb Mar Apr May Jun Jul Aug Sep Oct Nov Dec
NTU
Pump Station Treated Water Turbidity 2014
Poplar Point
Cedar Creek
Eldorado
<1.0NTU target for treated water turbidity

CITY OF KELOWNA Drinking Water Annual Report
5 5
6
5
6
9 9
8
6 6 6
5
7.71 7.77 7.87 7.85 7.80 7.88
7.887.84 7.93
7.96 7.80 7.73
7.0
7.5
7.0
8.5
10.0
12.0
14.0
15.0
17.0
15.0
10.5
8.0
0
2
4
6
8
10
12
14
16
18
Jan Feb Mar Apr May Jun Jul Aug Sep Oct Nov Dec
Swick Road Treated Water color, pH, and temperature 2014
Swick Treated Color
Swick Treated pH
Swick Treated Temp
0.363
0.294
0.3870.403
0.425
0.548
0.515
0.443
0.359 0.349 0.340
0.307
0.000
0.200
0.400
0.600
0.800
1.000
Jan Feb Mar Apr May Jun Jul Aug Sep Oct Nov Dec
NTU
Swick Road Treated Water NTU 2014
Swick Road
CITY OF KELOWNA Drinking Water Annual Report
SCADA
Supervisory Control and Data Acquisition (SCADA) is the industrial control system operating over communication
channels to provide remote control of station electronic instruments. The supervisory system is combined with a data
acquisition system to gather information about the status of the remote equipment for display and recording functions.
The system uses both computer workstations and data servers for calculating and displaying data, both real-time and
historical. The system also uses alarming to alert operations to developing problems.
The City of Kelowna utilizes SCADA to monitor pump operations, reservoir levels, security, as well as, collects data
from the water system to show overall fluidity within the system. If there ever is an issue with the system, SCADA will
alarm and depending on the issue notify the operators.
City of Kelowna Airport Water System
Since 2008 the City of Kelowna has operated and maintained the water system at Kelowna International Airport. The Glenmore Ellison Improvement district supplies the Airport with the water, but because of its location our pump operations department oversees it. There are four microfiltration plants throughout the Airport terminal building and the fire hall. The drinking water is sampled and analyzed two times a month and one certified lab sample is sent to an external lab for analysis. With the addition of filtration at Kelowna International Airport there has been a much noticeable increase in water quality. The turbidity is less than 0.5 NTU after filtration and the taste and odor concerns have subsided greatly. Attached in Appendix C is the 2014 report showing water quality for the Airport and that all parameters measured are within GCDWQ.
CAPITAL PROJECTS AND MAINTENANCE
Cross-connection Control All customers in the City of Kelowna are recorded in a central database, which is managed by the City Water Utility. The City Water Utility sends annual maintenance reminder letters to all customers. However, customer compliance is the responsibility of each purveyor. The City Water Utility is tracking approx 2,554 approved backflow devices in 1,130 separate facilities within our water service area. To date, the program is tracking a total of 4,337 backflow devices in approximately 1,912 facilities throughout the entire city (Moody, pers. comm., 2003). When water pressure drops in a distribution system, or when a buildings internal system pressure exceeds the city supply pressure, backflow can occur through cross connections (the link between potable and non-potable water supplies). Cross-connection Control Programs assure proper approved devices are in place to prevent backflow. Each water purveyor in Kelowna is required to enforce installation and maintenance of backflow devices for all water customers representing a risk such as; industrial, residential, commercial, institutional, and agricultural customers. Enforcement of these programs is a condition of the “Permit to Operate” a water utility, as issued by The Interior Health Authority. To see a list of certified testers, click the link, or visit kelowna.ca/utilities.

CITY OF KELOWNA Drinking Water Annual Report
Water Network Flushing Program The City Water Utility’s distribution system has undergone rigorous upgrades. Unidirectional flushing is performed to meet American Water Works Association (AWAA) standards. Water is flushed through mains at a pressure high enough to abrade sediment attached to pipe walls. The entire network is completely flushed annually.
2014 City of Kelowna Capital Projects In 2014, the City of Kelowna continued with the replacement of old cast iron main. The City’s Capital Crew replaced more than one km of water main. Attached is a complete overview of all City infrastructure water projects completed by the City of Kelowna Capital Crew for 2014.
Glenview Gardens (as part of the Clifton Road upgrade)
In the spring, the water main was upgraded. There was 210 meters of old cast iron six inch pipe removed and 200 mm of C-900 was installed. Along with this project, one new fire hydrant and a 100 mm service were installed.
Wardlaw Avenue, Richter to Ethel
In the summer, Wardlaw Avenue water main was replaced. The project was approximately420 meters in length. The existing main was six inch cast iron and it was replaced with 150 mm of C-900. There were 43 water services upgraded and one fire hydrant installed.
Kinnear Avenue, Richter to Ethel
During the late summer, Kinnear Avenue water main was replaced. The project was approximately187 meters in length. Seventeen residential services were upgraded, as well as, old six inch cast iron water main was replaced with 150 mm C-900. As well as one fire hydrant was replaced.
Coronation Avenue, St. Paul to Richter
During the late summer, Coronation Avenue water main was replaced. The project was approximately 250 meters in length. There were 33 residential services upgraded and old six inch cast iron water main was replaced with 200 and 250 mm C-900. As well as, two fire hydrants were replaced.
Leon/Pandosy Avenue improvements
During the late fall, Leon/Pandosy upgraded water main to 120 – 200 mm C-900, 2, 150 mm water services, 2, 50 mm water services. One new parks irrigation service and one new hydrant were also installed during this project.
Water System Disruptions to Service All water utilities experience disruptions in water service throughout the year. Examples of possible disruptions are water main breaks, service leaks, hydrant maintenance, flushing. In 2014, the City water utility repaired 74 service leaks. As well as, four water main breaks and 10 water main valve replacements. All leaks and breaks were repaired quickly and efficiently by utility staff, with minor interruptions to the water system.

CITY OF KELOWNA Drinking Water Annual Report
Access Quality Water Advisory (AQWA)
The Kelowna Joint Water Committee (KJWC) has established the Access Quality Water Advisory (AQWA) where 24-hour access to water quality conditions is available via home computer or telephone hotline. The public may also sign up to receive immediate notification of water emergencies via email.
Water Utility Supply
The City of Kelowna Water Utility extracts water from Okanagan Lake in several locations. The Poplar Point pump house represents 90 per cent of the entire distribution system’s intake. The Eldorado, Cedar Creek, and Swick Road pump houses account for the remaining 10 per cent. Total volumes of water pumped through the distribution system remained relatively constant. Table 3 below shows a 10 year monthly and annual average of the volume of water pumped throughout the distribution system.
Water Utility Supply (M3)
2004 2005 2006 2007 2008 2009 2010 2011 2012 2013 2014
Ja n 784,877 788,840 820,717 853,342 780,327 831,607 819,414 873,484 777,401 780,049 809,060
Fe b 744,010 758,488 753,070 760,383 721,904 745,212 735,325 775,497 737,932 709,786 725,136
Ma r 839,512 859,477 831,258 898,935 866,457 838,412 817,271 892,357 807,846 816,973 825,128
Ap r 1,184,280 1,134,032 1,033,877 1,169,633 967,040 971,554 1,083,152 1,033,627 918,424 1,000,819 962,998
May 1,517,019 1,782,187 1,669,161 1,928,094 1,467,348 1,733,311 1,377,682 1,485,651 1,501,083 1,605,741 1,493,206
Ju n 1,802,882 1,571,643 1,886,477 1,846,797 1,742,202 2,299,025 1,518,346 1,798,315 1,391,369 1,574,125 1,811,838
J u l 2,280,258 2,230,147 2,504,619 2,259,550 2,469,358 2,437,810 2,183,808 2,182,332 2,053,383 2,325,084 2,375,239
Aug 1,948,037 2,328,679 2,381,954 2,287,859 2,031,276 2,200,196 2,153,626 2,311,407 2,339,525 2,212,631 2,143,165
Se p 1,213,862 1,555,834 1,690,041 1,708,098 1,669,072 1,666,888 1,323,031 1,863,843 1,746,912 1,359,175 1,498,665
Oc t 1,019,580 1,066,907 1,186,419 1,023,463 1,093,701 1,050,616 962,055 959,831 1,124,174 956,256 969,388
Nov 811,056 806,497 844,812 789,367 834,105 845,008 793,866 763,145 797,548 828,132 810,111
De c 793,678 775,393 835,744 779,136 787,533 834,739 836,230 772,795 783,138 793,298 819,310
Total 14,939,051 15,658,124 16,438,149 16,304,657 15,430,323 16,454,378 14,603,806 15,712,284 14,978,735 14,962,069 15,243,244

CITY OF KELOWNA Drinking Water Annual Report
0
500,000
1,000,000
1,500,000
2,000,000
2,500,000
Co
nsu
mp
tio
n (
M3)
Jan-14 Feb-14 Mar-14 Apr-14 May-14 Jun-14 Jul-14 Aug-14 Sep-14 Oct-14 Nov-14 Dec-14
Poplar Point 752,566 686,854 744,950 888,908 1,286,1981,499,8561,774,4361,608,7301,257,558 893,870 763,956 796,718
Eldorado 39 119 26,826 744 22,621 75,404 285,949 243,275 53,810 1,713 0 0
Cedar Creek 54,503 36,458 50,974 70,574 177,690 229,386 304,860 281,066 181,095 69,655 43,519 20,389
Swick 1,952 1,705 2,362 2,762 6,683 7,134 9,994 10,090 6,202 4,130 2,310 2,195
Daily Total 809,060 725,136 825,128 962,998 1,493,2061,811,8382,375,2392,143,1651,498,665 969,388 810,111 819,310
City of Kelowna 2014 Monthly Consumption
Poplar Point
Eldorado
Cedar Creek
Swick
Daily Total
Below is a graph showing the 2014 consumption for the City of Kelowna Water Utility. There are large shifts in consumption seasonally. From spring to midsummer there is an increase in consumption by 30 per cent. The increase is due to many factors such as residential irrigation, agriculture, maximum storage in the reservoirs for fire protection, flushing program, and tourism. The graph below clearly shows the peak demand for 2014 is July and August. In September, consumption dropped by 40 per cent and continued its decline into the winter months.

CITY OF KELOWNA Drinking Water Annual Report
Customer Service Requests
In 2014, Water Quality technicians responded to 46 service requests. The majority of the Service Requests (SR), 21, were requesting information about the City of Kelowna Water Utility. Taste and odor concerns accounted for 10. Drainage and irrigation had nine and six SR’s were forwarded to the appropriate water utilities. All requests were attended to within 48 hours of receiving them. There were also numerous phone calls requesting information about various parameters tested (chlorine, color, turbidity). The number one question was, “what is the hardness of City of Kelowna drinking water?”
Algae Sampling
Since 2006 regular algae sampling of the City of Kelowna intakes has occurred. Heather Larratt, Larratt Aquatic Consulting Ltd has performed the analysis for the City of Kelowna. From 2010 – 2014 there was moderate to low densities of algae detected, which are common in Okanagan Lake. Low densities of cyanobacteria were typical with isolated spikes of deep or bottom-dwelling cyanobacteria types at the 16 – 20 m deep intakes. Turbidity also spiked in these events and suggests seiches. Although the deeper 25 m Poplar Point intake usually had less algae than the shallower intakes, there were times in the late fall early winter when algae densities were higher at Poplar Point than the shallower intakes. Intake depth is an important determinant of the types and density of algae that will be drawn into the City of Kelowna intakes. Algae sampling mounted by City of Kelowna from 2010 through 2014 showed consistent seasonal trends (Larratt Aquatic, 2014). Appendix E is the 2014 report on microflora at the Okanagan Lake Intakes.