Drilling with Real-Time Formation Properties · Drilling Time Flat Time / NPT §Casing Running...
12
Drilling with Real-Time Formation Properties - May 21, 2018
Transcript of Drilling with Real-Time Formation Properties · Drilling Time Flat Time / NPT §Casing Running...

Drilling with Real-Time Formation Properties
- May 21, 2018

Quantico Energy Solutions Inc Confidential 2
Are formation properties the same? No
WC B 4WC B 2
WC B 3
WC B 1NE
~1000’
~8800’
Logged secti
on
NE
Stress appears asymmetrical
WC C
WC C
Wolfcamp 3D Stress Plot: stress variance ~ 2,800psi over area

§ 70% cost reduction vs logging tools. Same accuracy as repeat logging run. No HSSE footprint
Quantico Energy Solutions Confidential 3
AI-Based LWD via Drilling Data
1. Quantico AI models are trained with ~ 3-8 offset wells in a new area.
2. Once trained, the software utilizes the standard suite of drilling data as input parameters.
3. Quantico logs are produced in real time faster than the LWD tools.
1 2 3
Logging Tools Quantico

Quantico Energy Solutions 4
Divergence of MSE & UCS curves indicate wasted additional energy than required to destruct the rock.
Efficient drilling. UCS and MSE curves match. Minor loss of energy.
§ Pre-drill• Estimation of ROP, UCS and MSE
§ While-drilling• RT-UCS and MSE with optimized
operating parameters
Advantages:
§ MSE, RT-UCS and formation tops provided for current well
§ Distinguish between efficient drilling versus drilling dysfunction once formation properties are taken into account
§ Drilling parameters (WOB, RPM, etc) can be better optimized for current well
Real-time Unconfined Compressive Strength (RT-UCS)

How UCS can alleviate Drilling Limiters
Quantico Energy Solutions Confidential 5
§ Slow ROP
• Identify hard streaks and optimize drilling parameters through them
§ Bit selection
• Identify right PDC bit cutter size for the application
• Identify impact/wear resistance property suitable for the application
• Identify depth of cut (DOC) required for the application
§ Drilling Dysfunction
• Tracking UCS & MSE to identify vibrations, stick-slip & other drilling dysfunctions
§ Parameter optimizat
Drilling Time
Flat Time / NPT
§ Casing Running
• Ensure casing is set in consolidated formation to prevent casing collapse
§ Tripping Time
• Identify & ensure careful tripping in very soft formations to prevent differential sticking
§ Circulation Time
• Help identify lost-circulation-zones

Projecting UCS from offsets does not reveal full information
Quantico Energy Solutions 6
Vertical Variability• Offset wells vary due to differences in
elevation, unconformities, overburden stress, etc
• Sonic logs or Unconfined Compressive Strength (UCS) from offset wells may lead to misinterpretations of the rock being drilled
Lateral Variability• Arduousity may include direction and
deviation of the well path intersecting the formation, varying concentrations, and the dip angle
• Hard streaks or nodules exist in some instances and can impede the performance, deflect well path and damage downhole tools
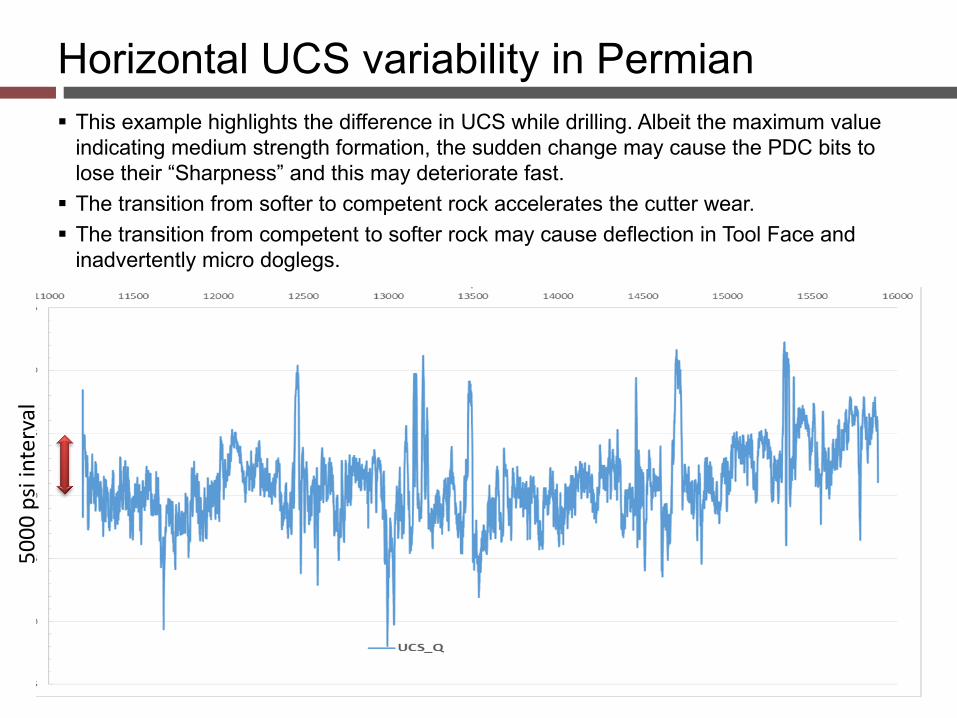
Horizontal UCS variability in Permian50
00 p
si in
terv
al
§ This example highlights the difference in UCS while drilling. Albeit the maximum value indicating medium strength formation, the sudden change may cause the PDC bits to lose their “Sharpness” and this may deteriorate fast.
§ The transition from softer to competent rock accelerates the cutter wear.§ The transition from competent to softer rock may cause deflection in Tool Face and
inadvertently micro doglegs.

Well C
Well B
Well A
8034’ MD 15792’ MD
8945’ MD 15360’ MD
8998’ MD 15860’ MD
0
5
10
15
20
25
8024 8274 8524 8774 9024 9274 9524 9774 10024 10274 10524 10774 11024 11274 11524 11774 12024 12274 12524 12774 13024 13274 13524 13774 14024 14274 14524 14774 15024 15274 15524 15774
UCS
SDev
KOP
0
5
10
15
20
25
8,988 9,238 9,488 9,738 9,988 10,238 10,488 10,738 10,988 11,238 11,488 11,738 11,988 12,238 12,488 12,738 12,988 13,238 13,488 13,738 13,988 14,238 14,488 14,738 14,988 15,238 15,488 15,738
UCS
SDev
KOP
0
5
10
15
20
25
8,936 9,186 9,436 9,686 9,936 10,186 10,436 10,686 10,936 11,186 11,436 11,686 11,936 12,186 12,436 12,686 12,936 13,186 13,436 13,686 13,936 14,186 14,436 14,686 14,936 15,186
UCS
SDev
KOP
UCS Volatility Indicator
Quantico Energy Solutions Inc Confidential 8
Lat
Lat
Lat

Well #1 – MSE, UCS vs ROP
A. Well #1 had the best performance in terms of ROP compared to wells #2 & #3B. WOB & differential pressure applied was higher than wells #2 & 3. Mud weight & flowrate similar (10ppg,
534gpm)C. The top section (12,520ft – 12,983ft i.e 463ft) highly interbedded with several hard streaks about 10kpsi
UCS and about 16ft thick each, was drilled with the same WOB (40-50klbs) & 900psi differential pressure as shown in the plot in the parameter plot
D. MSE & UCS values indicate ROP can be improved through some intervals 1. 13,600ft – 13,850ft: Low ROP but no difference in UCS or MSE above or below the interval2. 15,200 – 15,470ft & 16,070ft to TD: MSE highly erratic & low ROP indicate possible vibrations
ROP
MSE
UCS
Quantico Energy Solutions Inc Confidential 9
C D1 D2 D2
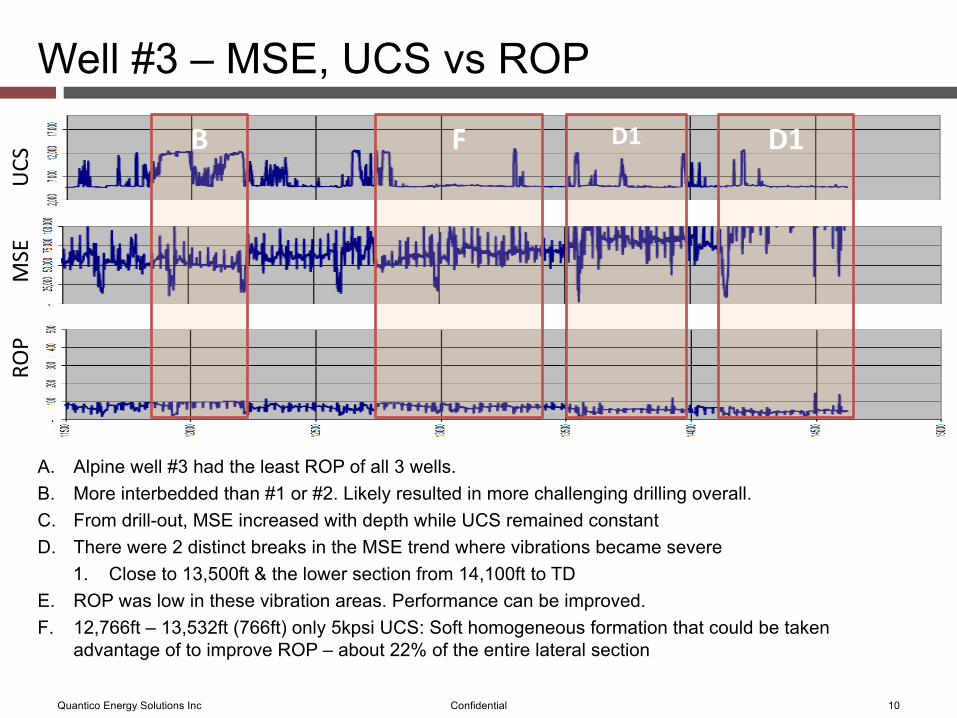
Well #3 – MSE, UCS vs ROP
A. Alpine well #3 had the least ROP of all 3 wells. B. More interbedded than #1 or #2. Likely resulted in more challenging drilling overall.C. From drill-out, MSE increased with depth while UCS remained constantD. There were 2 distinct breaks in the MSE trend where vibrations became severe
1. Close to 13,500ft & the lower section from 14,100ft to TDE. ROP was low in these vibration areas. Performance can be improved.F. 12,766ft – 13,532ft (766ft) only 5kpsi UCS: Soft homogeneous formation that could be taken
advantage of to improve ROP – about 22% of the entire lateral section
ROP
MSE
UCS
Quantico Energy Solutions Inc Confidential 10
F D1D1B

UCS vs MSE identified significant portions of lateral that were drilled inefficiently
Well Depth Problem Instantaneous ROP (ft/hr) UCS (kpsi) MSE
Alpine well #1
13,600 - 13,850ft 15,200ft - 15,470ft
16,070ft - TD 24% of lateral
Low Rop Vibrations Vibrations
112 108 119
4.9 4.8 4.9
54.0k 159.6k 59.6k
Alpine well #2
11,764ft - 11,864ft 13,000ft - 15,000ft
15,700ft - TD 46% of lateral
Vibrations Sub-optimal Parameters
Slow correction for new rock
99 173 174
11.6 11.2 7.3
17.4k 19.3k 20.0k
Alpine well #313,500ft - 13,978ft
14,100ft - TD 29% of lateral
Vibrations Vibrations
54 47
5.4 5.1
83.7 111.9k
Quantico Energy Solutions Inc Confidential 11
Wel
l 1W
ell 2
Wel
l 3

Potential Drilling Cost Savings with RT-UCS
Well Size Rig Rate Depth In Depth Out Interval Hours Inst. ROP COST PER FOOT
(in) $/day (feet) (feet) (feet) (ft/hr) $/ftAlpine well #3 8.75 $40,000 13500 13978 478 8.85 54.0 $111.00Alpine well #3 8.75 $40,000 14100 14625 525 11.17 47.0 $81.91Alpine well #3 8.75 $40,000 $96.45
Alpine well #3 (Quan) 8.75 $40,000 13500 13978 478 2.39 200.0 $88.46Alpine well #3 (Quan) 8.75 $40,000 14100 14625 525 2.63 200.0 $54.77
$71.62Assumed Rig Rate used for calculation: $40,000 per day i.e $1,667 per hour
Assumed PDC Bit Rental Price: $15,000 eachAssumed 1 PDC Bit drilled entire lateral section
Directional Motor Rate not included in calculationDrilling cost savings: $24.83 per foot
Quantico Energy Solutions Inc 12
Well Size Rig Rate Depth In Depth Out Interval Hours Inst. ROP COST PER FOOT
(in) $/day (feet) (feet) (feet) (ft/hr) $/ftAlpine well #3 8.75 $40,000 13500 13978 478 8.85 54.0 $111.00Alpine well #3 8.75 $40,000 14100 14625 525 11.17 47.0 $81.91Alpine well #3 8.75 $40,000 $96.45
Alpine well #3 (Quan) 8.75 $40,000 13500 13978 478 4.78 100.0 $96.80Alpine well #3 (Quan) 8.75 $40,000 14100 14625 525 5.25 100.0 $63.11
$79.95Assumed Rig Rate used for calculation: $40,000 per day i.e $1,667 per hour
Assumed PDC Bit Rental Price: $15,000 eachAssumed 1 PDC Bit drilled entire lateral section
Directional Motor Rate not included in calculationDrilling cost savings: $16.50 per foot
ROP in both problem intervals and through the entire lateral should approach 200+ ft/min ROP