Drilling using AvO to reduce uncertainties in D35 · PDF fileGeoL. Soc. MaLaytlia, BuLLetin...
7
GeoL. Soc. MaLaytlia, BuLLetin 42, December 1998; pp. 47-53 Drilling using AvO to reduce uncertainties in D35 infiII MEH JABEEN ZAINunOIN Sarawak Shell Berhad Locked Bag No.1 98009 Miri Sarawak Abstract: The 035 oil field in the Balingian province offshore Sarawak was discovered in 1983. It came on-stream in late 1994 and currently produces around 14,000 sth/d. An infill development drilling campaign has been planned for late 1997. A multi-disciplinary study for the 035 field, including quantitative interpretation of the seismic for porefill prediction, was undertaken to support the development drilling. A high resolution 30 seismic survey was acquired over the 035 field in 1995. As the seismic data was of reasonably good quality, an AvO study was initiated. True amplitude near and far offset migrated sub-stacks were created, and amplitudes extracted at objective levels. AvO attributes were calculated and the responses at the infill target locations were evaluated by comparing the results with those observed at well locations. The results of this study showed that the brine-bearing and oil-bearing reservoirs have different AvO responses. Thus, the results gave an indication of the porefill at the reservoir level, and this in turn assisted in optimising the revisit target locations. In conclusion, AvO is aJ). additional tool that can be used in screening drilling targets and for risk management in a multi-disciplinary team environment. The technique offers added information to reduce uncertainties as presented here in the 035 study. INTRODUCTION The D35 oil field is situated about 125 km north-west of Bintulu, Sarawak, in the offshore Balingian province (Fig. 1). This field was discovered in 1983 by well D35-1, followed by six appraisal wells in the next few years. it then came on-stream in October 1994. The field has an estimated STOIIP of 440 MMstb and the present production rate is 14 Mstb/d. A total of 18 production wells, of which 14 are horizontal, have been drilled from two platforms. Two 3D seismic surveys were acquired over the field, a conventional survey in 1984 and more recently, a high resolution (HiRes) survey in 1995. The primary objective of the HiRes data was to allow better structural and stratigraphic definition of reservoir units which could not be adequately imaged by the older 3D data. The Round II infill drilling campaign is being planned for end 1997. Some of the target wells will be drilled on untested blocks and it has been assumed that the fluid contacts observed at the developed part of the field are valid at these untested blocks. The AvO study was hence used to predict the fluid content at these blocks and therefore confirm that the targets are indeed in the oil-bearing Paper pre.Jented at GSA{ PetroLeum GeoLogy Conference '97 interval. The results of this AvO study forms the topic of discussion in this paper. GEOLOGIAL SETTING The main prospective reservoir unit in the D35 field is the Cycle II B2 (Clm2) sands of early Miocene age. The Cycle II clastic sequences were deposited in a river-dominated lower coastal plain environment with tidal influences. The Cycle II prospective sequence is generally characterised by low sand to shale ratio (below 0.3). However, for some reservoirs such as the Clm2, the sand to shale ratio is much higher, and values up to about 0.8 have been noted. These sand bodies are interpreted to be stacked fluvial channels in a coastal plain environment. The structural style of the D35 field can be described as an asymmetrical east-west trending fold which is dissected by a complex system of normal and reverse faults at the Cycle II interval. This interval is heavily dissected by north-south trending faults which were formed in the late Miocene time. Structural deformation is further complicated by the presence of antithetic and backsplit faults which cross-cut one another at the objective interval.
Transcript of Drilling using AvO to reduce uncertainties in D35 · PDF fileGeoL. Soc. MaLaytlia, BuLLetin...
GeoL. Soc. MaLaytlia, BuLLetin 42, December 1998; pp. 47-53
Drilling using AvO to reduce uncertainties in D35 infiII
MEH JABEEN ZAINunOIN
Sarawak Shell Berhad Locked Bag No.1
98009 Miri Sarawak
Abstract: The 035 oil field in the Balingian province offshore Sarawak was discovered in 1983. It came on-stream in late 1994 and currently produces around 14,000 sth/d. An infill development drilling campaign has been planned for late 1997. A multi-disciplinary study for the 035 field, including quantitative interpretation of the seismic for porefill prediction, was undertaken to support the development drilling.
A high resolution 30 seismic survey was acquired over the 035 field in 1995. As the seismic data was of reasonably good quality, an AvO study was initiated. True amplitude near and far offset migrated sub-stacks were created, and amplitudes extracted at objective levels. AvO attributes were calculated and the responses at the infill target locations were evaluated by comparing the results with those observed at well locations.
The results of this study showed that the brine-bearing and oil-bearing reservoirs have different AvO responses. Thus, the results gave an indication of the porefill at the reservoir level, and this in turn assisted in optimising the revisit target locations.
In conclusion, AvO is aJ). additional tool that can be used in screening drilling targets and for risk management in a multi-disciplinary team environment. The technique offers added information to reduce uncertainties as presented here in the 035 study.
INTRODUCTION
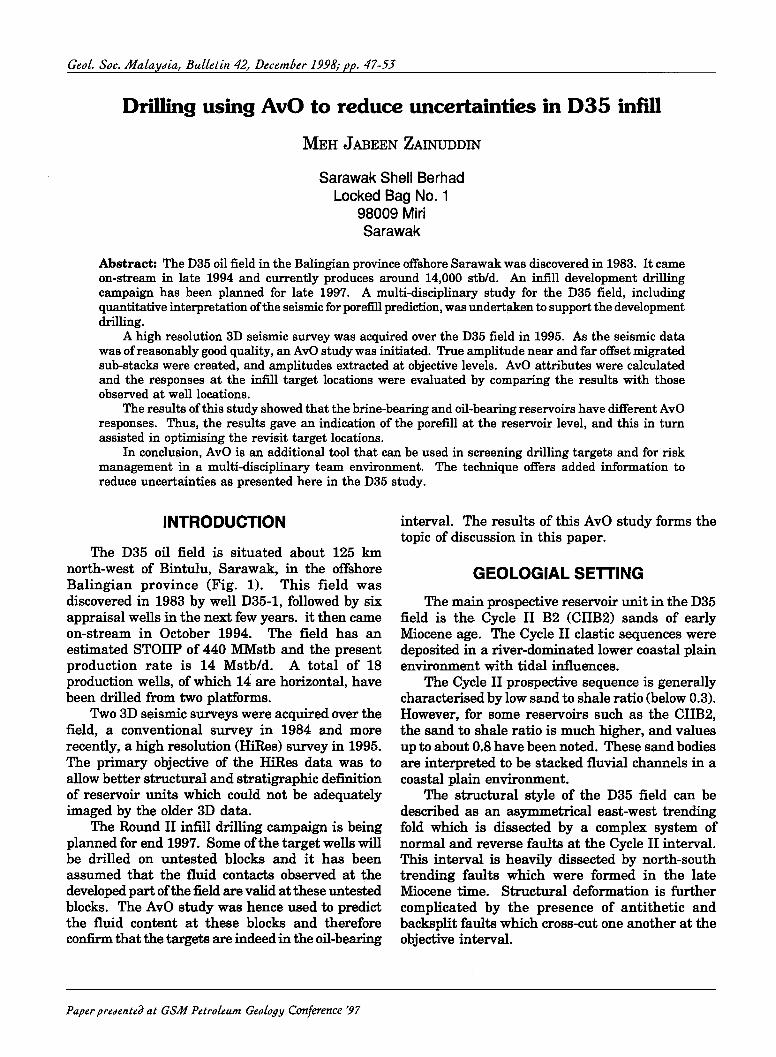
The D35 oil field is situated about 125 km north-west of Bintulu, Sarawak, in the offshore Balingian province (Fig. 1). This field was discovered in 1983 by well D35-1, followed by six appraisal wells in the next few years. it then came on-stream in October 1994. The field has an estimated STOIIP of 440 MMstb and the present production rate is 14 Mstb/d. A total of 18 production wells, of which 14 are horizontal, have been drilled from two platforms.
Two 3D seismic surveys were acquired over the field, a conventional survey in 1984 and more recently, a high resolution (HiRes) survey in 1995. The primary objective of the HiRes data was to allow better structural and stratigraphic definition of reservoir units which could not be adequately imaged by the older 3D data.
The Round II infill drilling campaign is being planned for end 1997. Some of the target wells will be drilled on untested blocks and it has been assumed that the fluid contacts observed at the developed part of the field are valid at these untested blocks. The AvO study was hence used to predict the fluid content at these blocks and therefore confirm that the targets are indeed in the oil-bearing
Paper pre.Jented at GSA{ PetroLeum GeoLogy Conference '97
interval. The results of this AvO study forms the topic of discussion in this paper.
GEOLOGIAL SETTING
The main prospective reservoir unit in the D35 field is the Cycle II B2 (Clm2) sands of early Miocene age. The Cycle II clastic sequences were deposited in a river-dominated lower coastal plain environment with tidal influences.
The Cycle II prospective sequence is generally characterised by low sand to shale ratio (below 0.3). However, for some reservoirs such as the Clm2, the sand to shale ratio is much higher, and values up to about 0.8 have been noted. These sand bodies are interpreted to be stacked fluvial channels in a coastal plain environment.
The structural style of the D35 field can be described as an asymmetrical east-west trending fold which is dissected by a complex system of normal and reverse faults at the Cycle II interval. This interval is heavily dissected by north-south trending faults which were formed in the late Miocene time. Structural deformation is further complicated by the presence of antithetic and backsplit faults which cross-cut one another at the objective interval.
48 MEH JABEEN ZAINUDDIN
HIGH RESOLUTION 3D SEISMIC DATA
The HiRes 3D seismic data acquisition comprising 612 subsurface lines totalling 13,824 km, and covering a full-fold area of 182 sq km were acquired in 1995. A cable length of 3,000 m was used in a dual source triple streamer configuration which gave a nominal fold of 60.
Various seismic cubes were created during processing as required by the different interpretation and studies. In addition to a full offset migrated stack for structural interpretation, near and far offset migrated sub-stacks were also created for the purpose of the AvO study. These reflectivity offset sub-stacks were zero-phased and processed in true amplitude mode to preserve all AvO effects.
The interval of interest in this study is the Cycle II B2 (CIIB2) reservoir, which occurs at about 5,000 feet in depth, and in twt, centres around 1,500 ms. The HiRes data gave frequencies up to 70 Hz at this level. This was a notable improvement over the 1984 conventional 3D seismic data which had a maximum frequency of about 50 Hz at Cycle II level.
Due to the presence of a gas chimney over the crest of the structure, there is considerable loss of seismic energy over this part which resulted in poor seismic events with poor signal to noise ratio .
RESERVOIR CIIB2
The Cycle II B2 reservoir is made up of thick
and laterally extensive stacked channel sands. Well data has indicated its thickness to be around 70-120 feet and porosity and porosity 16- 25%. The producing oil wells have hydrocarbon saturation above 60%. On seismic it has reasonably good reflection and the top reservoir has been interpreted. Understandably, interpretation at the gas chimney area is not reliable and could not be used with confidence for any amplitude and quantitative studies.
CIIB2 is an acoustically softer event when compared to its overlaying shale and is therefore represented by a soft loop on seismic. The reservoir shows increase in amplitudes which are conformable to the structure. This gives support that the seismic is affected by porefill, as amplitudes get softer with hydrocarbon.
In the Round II drilling campaign, this reservoir unit is the primary target of several infill wells. Thus more detailed amplitude analysis was required for porefill prediction to assist in optimising well target locations.
AvO ANALYSIS
Interpretation of the CIIB2 horizon was done on the full offset migrated stack, and when completed, the interpretation was transferred over to the offset stacks. Fine tuning and some adjustment of the horizon was required, especially in the far offset stack.
Amplitude attributes were extracted from both the near and far offset stacks. Amplitude maps
Figure 1. D35 location map.
Geo!. Soc. M aLay"ia, BuLLetin 42

DRILLING USING AvO TO REDUCE UNCERTAINTIES IN 035 INFILL 49
were created and these are shown in Figures 2a and 2b. The amplitudes are colour-coded such that the warm colours represent high amplitude values with decreasing amplitudes to the blue hues. The near offset sub-stack amplitude map (Fig. 2a) does not show amplitudes conforming to structure (approximate location of OWC indicated on map). The far offset amplitude map (Fig. 2b), on the other hand, is reasonably conformable to structure, with high amplitudes seen on-structure and lower amplitudes off-structure. Conforming is good at the western and south-western area of the field and fair at the south-eastern area (probably
attributed to stratigraphic traps). These amplitude maps are evidence that AvO effects are indeed present in the D35 field and thus could be used for porefill prediction.
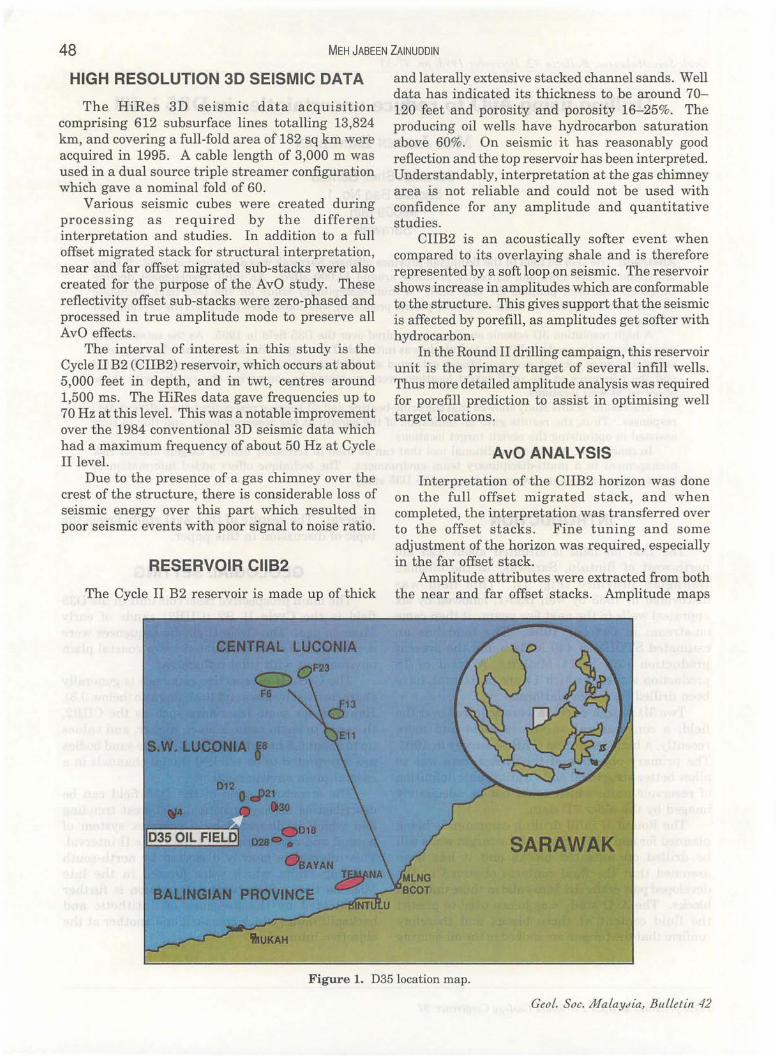
In order to determine what AvO expression could be observed in the D35 field, offset modelling was done on the vertical D35 wells. An example is shown for well D35-3 in Figure 3. Here the CIIB2 sand interval has a thickness of 76 feet, porosity of 20% and oil saturation of 67%. Gassmann fluid substitution was performed to enable AvO response to depict the cases for the reservoir being brine-, oil- and gas-bearing. It is noted that the amplitude
Figure 2a. Near offset amplitude map of CIIB2.
Figure 2b. Far offset amplitude map of CIIB2.
December 1998
50 MEH JABEEN ZAINUDDIN
I L'LL .... I D30·3 : Off __ ling
111'1( ' I rClu)u l
... It '" I Tjjj'I"I"IIl'l'ITI'FiT"11l1l1ll Tj"'j"li'ljl'jTI'I"jj'jllll'''IIP Tj"""I1WIII"'I'''l'I'''III''!l!I' I WIST ._ ~~M..,..m"T""·wr..-.-.~1 '.Ii.! .'iliIIUlJl lihlliii'iillII' " '111" 'II'fili! IdUII - /' ,lll iH'fllli;;lll ,jI'Ij' ,IIoH : I ....
.....
,. illjJlllllll_~II~lll_I~III!j_I~I! I,. 1
1.B I W E
I N
I. ..
S [ C 0 N
1.Q) 0 S
1:'lliIJllililllJlJllillJ 11l .. lllll_111 ~ ll!!~!~!!~~~!!!~~!~!!~~~~l~~~~ III I,.a
,6811
Figure 3. AvO modelling results on well D35-3.
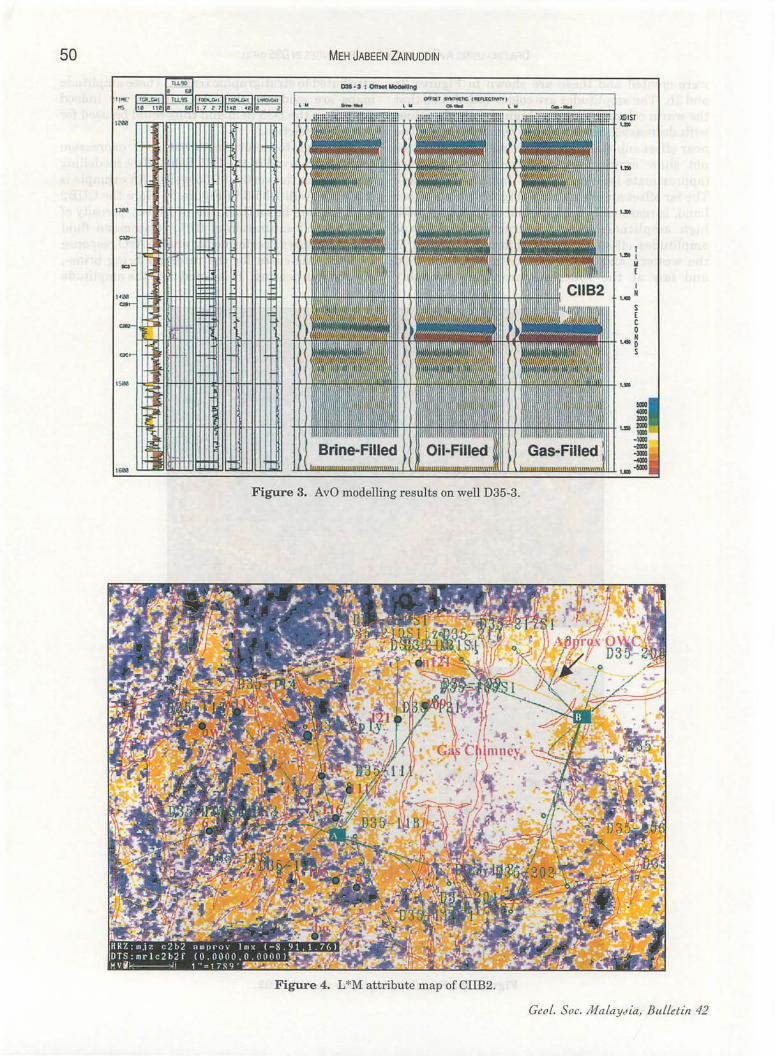
Figure 4. L*M attribute map of CIIB2.
GeoL. Soc. Ma LaYdia, BuLLetin 42

DRILLING USING AvO TO REDUCE UNCERTAINTIES IN 035 INFILL 51
of CIIB2 increases as the porefill changes from brine to oil to gas, i.e. largest AvO increase is seen in gas-bearing sands. Some well logs are also shown in the figure, namely the gamma, resistivity, sonic, density and impedance curves .
Amplitudes that conform to structure are often indicative of hydrocarbon. However, amplitudes alone are not sufficient to discriminate between lithology and porefill. AvO is generally a better tool for porefill prediction than stacked amplitudes and a common AvO diagnostic tool used for porefill discrimination is the L-M crossplot.
L-M VALUES
The response of amplitude as a function of the incidence angle can be described by the simplified equation (Bortfeld, 1961) which states that
R(S) = L + Msin2(S) where: R(S) is the reflection coefficient,
L is the normal incidence reflection, M is the gradient, S is the angle of incidence
From the amplitudes extracted on the near and far offset sub-stacks, Land M values were calculated. An attribute map of L*M is shown in Figure 4. The map is colour coded such that rising AvO's in purple. This map shows that the positive AvO are indeed seen on structure, supporting the offset modelling output.
As a calibration step in the AvO analysis, L-M crossplots were made at various well locations. A small swath of data (25 by 25 traces with the well at centre) was used instead of a single point to allow for statistical variation.
It has been observed that separation is seen in L-M space between brine- and hydrocarbon-bearing reservoirs, as illustrated in Figure 5. The three "clouds" represent values for reservoirs with different fluid content. The separation seen between the blue (brine-bearing), red (oil-bearing) and green (gas-bearing) clouds, will be observed for a hard shale/soft sand environment, as fluid content changes in the reservoir rocks. However, if the LM values move in the direction indicated by the background line, the AvO effect is generally attributed to lithology change. This is illustrated in the smaller diagram at the lower left-hand corner of the figure.
The L-M crossplots of reservoir CIIB2 derived for various wells are displayed in Figures 6a-6e. In Figure 6a, the crossplot for wells D35-6SD (brinebearing) and D35-4 (oil-bearing) show two separate clouds, separating in the direction indicative of hydrocarbon. A similar response is seen for well D35-3, which is also oil-bearing at CIIB2. Such response is seen for the oil-bearing wells which were located at the good seismic area, i.e. not affected by the gas chimney. The response of well D35-5, brine-bearing at CIIB2, is similar to well
Hydrocarbon response in L-M space
December 1998
M ithology Change
Separation due to Hydrocarbon
L
Bearing
Background Line
Note: SEG polarity convention, soft events positive loop
Figure 5. Separation in L-M space due to different porefill.

52 MEH JABEEN ZAINUDDIN
a. Brine-bearing (blue) and Oil-bearing (red) wells
i : -.
b. Brine-bearing (blue) and Oil-bearing (red) wells
L .. \I Croupiet
C. Both wells Brine-bearing
l~M CrostpkU I.· M Cron plo1
d. Brine-bearing well (blue) and Infill Target (green) e. Brine-bearing well (blue) and Infill Target (green)
Figures 6a-e. L-M crossplots for various wells and infill targets .
Geo L. Soc. Ma LaYJia, BuLLetin 42

DRILLING USING AvO TO REDUCE UNCERTAINTIES IN D35 IN FILL 53
D35-6SD, i.e. no distinct separation is seen. Once a trend in L-M space was established at
CIIB2 for the brine- and oil-bearing sands, the crossplots could be used to predict the porefill at the target locations for Round II drilling. Figures 6d-6e show the crossplot for two infill targets, D35-W113 and D35-NW. Similar responses in L-M space are noted for the two targets as observed in the oil-bearing wells, strongly supporting the prediction that the targets will be oil-bearing at CIIB2.
There is some overlap between the brine- and oil-bearing reservoirs as observed in the L-M crossplots. This could be as a result of noise, acquisition and processing (e.g. NMO effects) artifacts.
DISCUSSION
In planning for infill drilling of D35, various studies of different disciplines were undertaken in . order to better understand the field and therefore reduce uncertainties and risk. These studies, among others, included static and dynamic reservoir modelling and seismic inversion. The AvO study was conducted in order to predict fluid fill and thereby reduce uncertainties in hydrocarbon content.
The AvO results, particularly the separation
seen in L-M space, gives confidence that the infill target locations are highly probable to be oil-bearing. Thus the assumption that the field-wide OWC is also valid at the appraisal blocks is strengthened and it allowed dynamic reservoir modelling to define the oil initially-in-place and reserves to be developed. Therefore, this AvO study, together with support obtained from various other reservoir studies, helped in finalising the target locations.
In conclusion, AvO studies can be used as a additional tool in risk management while developing a field, as demonstrated in this D35 study.
ACKNOWLEDGEMENT
The author wishes to thank members of the D35 team for providing various input to the paper. Special thanks also goes to S. Larsson and M.R. Lasman for providing the interpretation data that was used in the AvO work. The author is grateful to the management of Sarawak Shell Bhd. and PETRONAS for the permission given to publish and present this paper.
REFERENCE
BORTFELD, R., 1961. Approximation to the reflection and transmission coefficients of plane longitudinal and transverse waves. Geophys. Prosp., 9, 485-503 .
•• fi1iIl ••
Manuscript received 1 November 1997
Decemher 1998