DRIEHAUS FRONTIER EMERGING MARKETS...
7
1 Country Spotlight: Pakistan Pakistan has been among our favorite investment destinations in recent years. As shown in Exhibit 1, the Karachi All Share Index has handily beaten the MSCI Frontier Markets Index over the past 10 years, and also bested its next-door neighbor India, the darling market of EM investors. ® @DriehausCapital DRIEHAUS FRONTIER EMERGING MARKETS FUND August 2015 Summary Ticker: DRFRX Key Features • Active, growth approach to an attractive inefficient investment universe • Benchmark-aware not benchmark- constrained investment approach– high active share • Bias toward domestically driven growth companies • Holistic investment process that incorpo- rates macro and bottom-up analysis • Focus on risk management • Portfolio management team with several years of investment experience in frontier markets Inception Date May 4, 2015 Fund Assets Under Management $20.6 million Firm Assets Under Management $10.0 billion Investment Universe Frontier markets all cap equity Investment Style Growth equity Portfolio Managers Chad Cleaver, CFA Portfolio Manager 13 years of investment experience Richard Thies Assistant Portfolio Manager 8 years of investment experience Exhibit 1: Pakistan’s Karachi All Share Index returns Source: Bloomberg Global investors may recoil at the thought of allocating capital to Pakistan, with concerns over terrorism and a troubled law and order situation. Following the 2007 assassination of former Prime Minister Benazir Bhutto, the market quickly corrected 10%. This was followed by a massive selloff during the global financial crisis of 2008, which saw a peak-to-trough decline of 74% in US dollar terms. At one point in time, angry investors stormed the exchange in protest (Exhibit 2)—and this was before the worst of the carnage in the equity market even took place! Exhibit 2: Angry investors storm Pakistani’s Karachi Stock Exchange Source: The Guardian, July 17, 2008 Karachi All Share Index National Stock Exchange of India MSCI Frontier Markets Index
Transcript of DRIEHAUS FRONTIER EMERGING MARKETS...

1
Country Spotlight: Pakistan
Pakistan has been among our favorite investment destinations in recent years. As shown in Exhibit 1, the Karachi All Share Index has handily beaten the MSCI Frontier Markets Index over the past 10 years, and also bested its next-door neighbor India, the darling market of EM investors.
®
@DriehausCapital
DRIEHAUS FRONTIER EMERGING MARKETS FUNDAugust 2015 Summary Ticker: DRFRX
Key Features
• Active, growth approach to an attractive inefficient investment universe
• Benchmark-aware not benchmark- constrained investment approach– high active share
• Bias toward domestically driven growth companies
• Holistic investment process that incorpo-rates macro and bottom-up analysis
• Focus on risk management
• Portfolio management team with several years of investment experience in frontier markets
Inception Date May 4, 2015
Fund Assets Under Management $20.6 million
Firm Assets Under Management $10.0 billion
Investment Universe Frontier markets all cap equity
Investment Style Growth equity
Portfolio Managers Chad Cleaver, CFA Portfolio Manager 13 years of investment experience
Richard Thies Assistant Portfolio Manager 8 years of investment experience
Exhibit 1: Pakistan’s Karachi All Share Index returns
Source: Bloomberg
Global investors may recoil at the thought of allocating capital to Pakistan, with concerns over terrorism and a troubled law and order situation. Following the 2007 assassination of former Prime Minister Benazir Bhutto, the market quickly corrected 10%. This was followed by a massive selloff during the global financial crisis of 2008, which saw a peak-to-trough decline of 74% in US dollar terms. At one point in time, angry investors stormed the exchange in protest (Exhibit 2)—and this was before the worst of the carnage in the equity market even took place!
Exhibit 2: Angry investors storm Pakistani’s Karachi Stock Exchange
Source: The Guardian, July 17, 2008
Karachi All Share Index
National Stock Exchange of India
MSCI Frontier Markets Index
2
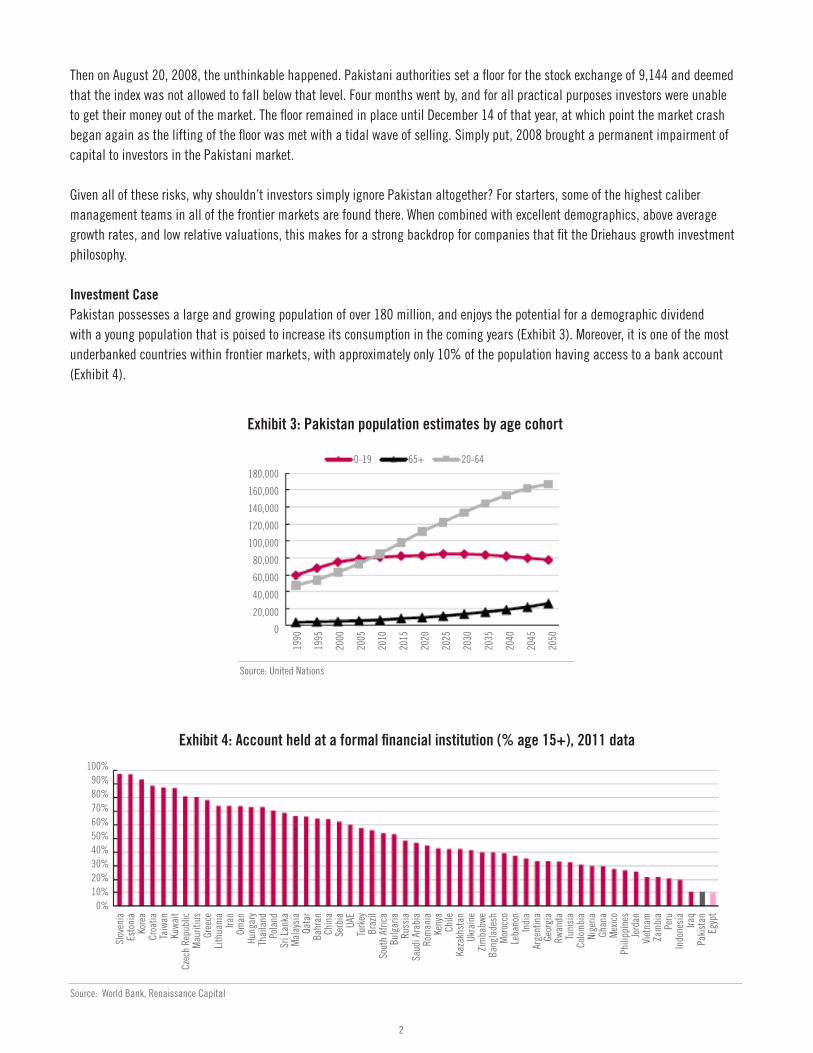
Exhibit 3: Pakistan population estimates by age cohort
Then on August 20, 2008, the unthinkable happened. Pakistani authorities set a floor for the stock exchange of 9,144 and deemed that the index was not allowed to fall below that level. Four months went by, and for all practical purposes investors were unable to get their money out of the market. The floor remained in place until December 14 of that year, at which point the market crash began again as the lifting of the floor was met with a tidal wave of selling. Simply put, 2008 brought a permanent impairment of capital to investors in the Pakistani market.
Given all of these risks, why shouldn’t investors simply ignore Pakistan altogether? For starters, some of the highest caliber management teams in all of the frontier markets are found there. When combined with excellent demographics, above average growth rates, and low relative valuations, this makes for a strong backdrop for companies that fit the Driehaus growth investment philosophy.
Investment CasePakistan possesses a large and growing population of over 180 million, and enjoys the potential for a demographic dividend with a young population that is poised to increase its consumption in the coming years (Exhibit 3). Moreover, it is one of the most underbanked countries within frontier markets, with approximately only 10% of the population having access to a bank account (Exhibit 4).
Source: World Bank, Renaissance Capital
Source: United Nations
180,000
160,000
140,000
120,000
100,000
80,000
60,000
40,000
20,000
0
1990
1995
2000
2005
2010
2015
2020
2025
2030
2035
2040
2045
2050
0-19 65+ 20-64
Exhibit 4: Account held at a formal financial institution (% age 15+), 2011 data
Slov
enia
Es
toni
a Ko
rea
Croa
tia
Taiw
an
Kuwa
it Cz
ech
Repu
blic
M
aurit
ius
Gree
ce
Lith
uani
a Ira
n Om
an
Hung
ary
Thai
land
Po
land
Sr
i Lan
ka
Mal
aysi
a Qa
tar
Bahr
an
Chin
a Se
rbia
UA
E Tu
rkey
Br
azil
Sout
h Af
rica
Bulg
aria
Ru
ssia
Sa
udi A
rabi
a Ro
man
ia
Keny
a Ch
ile
Kaza
khst
an
Ukra
ine
Zim
babw
e Ba
ngla
desh
M
oroc
co
Leba
non
Indi
a Ar
gent
ina
Geor
gia
Rwan
da
Tuni
sia
Colo
mbi
a Ni
geria
Gh
ana
Mex
ico
Phili
ppin
es
Jord
an
Viet
nam
Za
mbi
a Pe
ru
Indo
nesi
a Ira
q Pa
kist
an
Egyp
t
100% 90% 80% 70% 60% 50%40% 30% 20% 10% 0%

3
Pakistan’s banking sector is highly liquid with loan-to-deposit ratios in the 40s, leaving the banks well positioned to increase their loan books as credit demand picks up. With a reform-minded, pro-business government at the helm, we believe there will be opportunities for the banks to increase lending into an economy that has fallen short of its potential growth rate in the past.
Due to Pakistan’s size and strategic importance, the country is a potential recipient of further inbound investment flows from throughout the world. This is evidenced by the recently announced $46 billion China-Pakistan Economic Corridor (CPEC), with the aim of facilitating better access to key trade routes and furthering China’s strategic interests in the region. Similarly, the US, Saudi Arabia, and multilateral institutions have also provided funding to Pakistan, which has helped the country weather periods of macroeconomic stress in recent years.
On the matter of reform, we see potential for Pakistan to improve upon the legacy issue of “circular debt”. This has constrained investment and output in the power sector (Exhibit 5). Circular debt is a complicated issue, and it amounts to a buildup of receivables across the supply chain, from the government, to customers, power distributors, power generators, and ultimately to fuel suppliers. Unfortunately there is no quick fix to this problem, which has been prevalent for years. However, increasing power tariffs, along with privatization and greater investment in transmission and distribution can bring about incremental improvement.
Exhibit 5: Example of circular debt in the Pakistani power sector
Source: Exotix Partners
Government orders PSO
and gas distributors to
supply fuel regardless of
payment
Inadequate, delayed
subsidy from government
PSO stops supply
Govt does not pay IPPs on
time
Deficient payments
Poor revenue
collection
Oil marketer (PSO) and gas distributors supply fuel oil and
gas
Power generation by IPPs and govt-owned generation companies
(GENCOs)
NTDC (govt entity) purchases power and
supplies to distribution companies
Distribution companies
responsible for supply to consumers
Power consumersDomestic, Industrial,
Government

4
As shown in Exhibit 6 and 7, despite having among the highest return on equity in frontier markets, Pakistani stocks trade in the bottom quartile on a P/E basis, even cheaper than the likes of Nigeria (which has been shaken by corruption, geopolitical worries, and a massive drop in the oil price), and Morocco (which offers little in the way of growth). Further illustrating the sound institutional quality of the corporate management teams in Pakistan, the KSE Index maintains a 4.4% dividend yield, showing alignment of interests with minority shareholders.
Exhibit 6: Frontier markets 12-month price/earnings ratios
Exhibit 7: Return on equity within frontier markets
Source: Bloomberg, Renaissance Capital estimates
Note: MSCI Bahrain saw negative RoE in May 2014Source: Bloomberg, Renaissance Capital estimates
RisksGreat strides have been made on the political front in recent years, including the country’s first successful transfer of power following the full completion of a term by a democratically elected government. Nonetheless, political risks remain an ongoing concern for investors in Pakistan. On the surface, the relationship between the government and the army appears to be moving in the right direction, though it has been on fragile footing in the recent past. Additionally, protests about the legitimacy of the current government have at times turned bloody, with opposition party leader and former cricket star Imran Khan leading massive demonstrations in key cities over the past 12 months.
Tensions such as these reinforce the notion that frontier market investors must exercise an active sell discipline, particularly during periods of significant valuation re-rating. Geopolitics are inherently difficult to predict and changes at the margin can induce a
Tuni
sia
Bang
lade
sh
Mor
occo
Saud
i Ara
bia
Litu
ania
Viet
nam
Keny
a
Sri L
anka
Esto
nia
Kuwa
it
Rom
ania
Slov
enia
Croa
tia
FM
Oman
Nige
ria
Leba
non
Arge
ntin
a
Paki
stan
Mau
ritiu
s
Kaza
khst
an
Jord
an
Bahr
ain
Ukra
ine
22 20 18 16 14 12 10 8 6 4 2 0
Current 12 month Fwd P/E (x) 12 month Fwd P/E (x) (1 year prior)
RoE (%) 12 months prior35
30
25
20
15
10
5
0
-5
Keny
a Ba
ngla
desh
Paki
stan
Arge
ntin
aNi
geria
Ukra
ine
Lith
uani
aSe
rbia
Tuni
sia
Mor
occo
Fron
tier
Oman
Viet
nam
Sri L
anka DM
Saud
i Ara
bia
Slov
enia EM
Kuwa
itRo
man
iaBa
hrai
nLe
bano
nJo
rdan
Croa
tiaEs
toni
aBu
lgar
iaKa
zakh
stan

5
Exhibit 8: Pakistan interest rates and inflation
Source: Bloomberg
Positioning and Outlook
As of August month-end, the fund maintained a 14.0% weighting in Pakistan, as compared to the MSCI Frontier Markets Index weighting of 9.9%. We continue to believe that Pakistan is well positioned in the current macro environment, in which commodity prices have been under pressure due to slowing demand from China and an appreciating US dollar. We are also encouraged by the earnings growth prospects domestically due to an improving backdrop for investment, along with the structural growth potential for the consumer and banking industries. Our current positioning is reflective of these themes.
While valuations remain quite reasonable in Pakistan in aggregate, we have trimmed positions tied to domestic demand where we believe increasingly high expectations are embedded in the current share prices. Conversely, we have added to banks whose earnings stream was temporarily hurt by the decline in government bond yields, yet remain compelling investment cases on a medium-term horizon.
sharp rise in the risk premium attached to a country like Pakistan. This is an important consideration as we size positions and actively manage country weightings.
Pakistan maintains a high degree of sensitivity to commodity price movements, being heavily reliant on imports of oil and other commodities. This can serve as a tailwind during periods such as the oil price decline of 2014, which saw a marked slowdown in Pakistan’s rate of inflation, as well as a concurrent decline in the State Bank of Pakistan discount rate (Exhibit 8). However, returning to a period of $100-plus oil would create a more challenging environment for the economy.
Chad CleaverPortfolio Manager
Until next month,
Rich ThiesAssistant Portfolio Manager
State Bank of Pakistan Discount Rate: 7.00
Pakistan CPI YoY : 1.80
Real Discount Rate: 5.1974
6
Sources: Driehaus Capital Management LLC, Factset Research Systems, Inc., eVestment AllianceData as of 8/31/15.
The performance data shown represents past performance and does not guarantee future results. Current performance may be lower or higher than the performance data quoted. Principal value and investment returns will fluctuate so that investors’ shares, when redeemed, may be worth more or less than their original cost. Performance data represents the rate that an investor would have earned (or lost), during the given month, on an investment in the Fund (assuming reinvestment of all dividends and distributions). Average annual total return reflects annualized change. Since Fund performance is subject to change after the month-end, please call (800) 560-6111 or visit www.driehaus.com for more current performance information.
1Inception date: 5/4/2015. 2Benchmark: The Morgan Stanley Capital International Frontier Markets Index provides broad representation of the equity opportunity set while taking investability requirements into consideration within each market. MSCI classifies 33 countries as frontier markets, 24 of which are included in the MSCI Frontier Markets Index. 3Holdings subject to change. 4Represents the Annual Fund Operating Expenses as disclosed in the current prospectus dated April 15, 2015. It is important to understand that a decline in the Fund’s average net assets due to unprecedented market volatility or other factors could cause the Fund’s expense ratio for the current fiscal year to be higher than the expense information presented. “Other Expenses” are estimated for the current fiscal year because the Fund did not commence operations until May 4, 2015. Driehaus Capital Management LLC, the Fund’s investment adviser, has entered into a contractual agreement to cap the Fund’s ordinary annual operating expenses (excluding interest, taxes, brokerage commissions and other investment-related costs and extraordinary expenses) at 2.00% of average daily net assets until the earlier of the termination of the investment advisory agreement, by the Board of Trustees or the Fund’s shareholders, or April 30, 2018. Pursuant to the agreement, and so long as the investment advisory agreement is in place, for a period of three years subsequent to the Fund’s commencement of operations on May 4, 2015, the investment adviser is entitled to reimbursement for previously waived fees and reimbursed expenses to the extent that the Fund’s expense ratio remains below the operating expense cap that was in place at the time of the waiver.
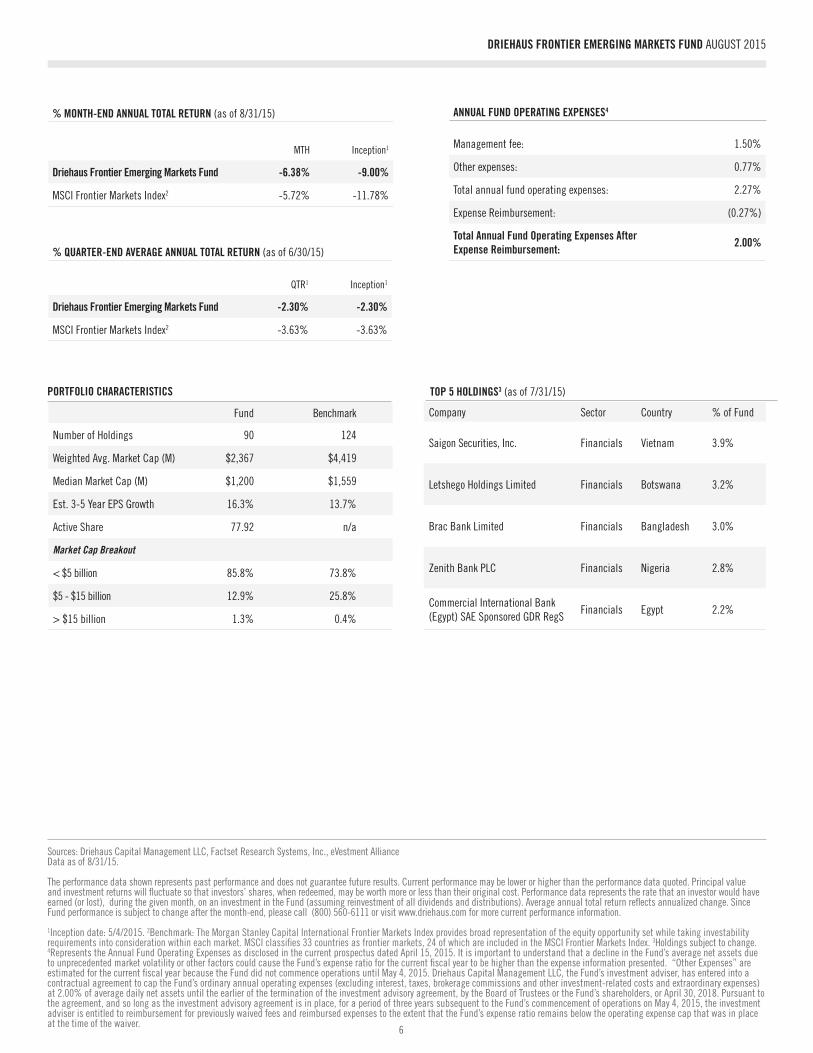
PORTFOLIO CHARACTERISTICS
Fund Benchmark
Number of Holdings 90 124
Weighted Avg. Market Cap (M) $2,367 $4,419
Median Market Cap (M) $1,200 $1,559
Est. 3-5 Year EPS Growth 16.3% 13.7%
Active Share 77.92 n/a
Market Cap Breakout
< $5 billion 85.8% 73.8%
$5 - $15 billion 12.9% 25.8%
> $15 billion 1.3% 0.4%
TOP 5 HOLDINGS3 (as of 7/31/15)
Company Sector Country % of Fund
Saigon Securities, Inc. Financials Vietnam 3.9%
Letshego Holdings Limited Financials Botswana 3.2%
Brac Bank Limited Financials Bangladesh 3.0%
Zenith Bank PLC Financials Nigeria 2.8%
Commercial International Bank (Egypt) SAE Sponsored GDR RegS
Financials Egypt 2.2%
DRIEHAUS FRONTIER EMERGING MARKETS FUND AUGUST 2015
ANNUAL FUND OPERATING EXPENSES4
Management fee: 1.50%
Other expenses: 0.77%
Total annual fund operating expenses: 2.27%
Expense Reimbursement: (0.27%)
Total Annual Fund Operating Expenses After Expense Reimbursement: 2.00%
% QUARTER-END AVERAGE ANNUAL TOTAL RETURN (as of 6/30/15)
QTR1 Inception1
Driehaus Frontier Emerging Markets Fund -2.30% -2.30%
MSCI Frontier Markets Index2 -3.63% -3.63%
% MONTH-END ANNUAL TOTAL RETURN (as of 8/31/15)
MTH Inception1
Driehaus Frontier Emerging Markets Fund -6.38% -9.00%
MSCI Frontier Markets Index2 -5.72% -11.78%

7
DRIEHAUS FRONTIER EMERGING MARKETS FUND AUGUST 2015
SECTOR WEIGHTS
Fund Benchmark Active Weights
Consumer Discretionary 3.5% 0.4%
Consumer Staples 12.8% 8.0%
Energy 3.7% 10.9%
Financials 44.6% 51.8%
Health Care 3.7% 3.1%
Industrials 6.7% 3.3%
Materials 7.8% 7.6%
Telecomm. Services 4.8% 13.6%
Utilities 2.0% 1.3%
Cash 9.4% 0.0%
Unassigned 1.0% 0.0%
COUNTRY WEIGHTS
3.1%
4.8%
-7.2%
0.7%
3.5%
-8.8%
0.2%
0.6%
1.0%
9.4%
-10 -8 -6 -4 -2 0 2 4 6 8 10
-7.2%
Sources: Driehaus Capital Management LLC, Factset Research Systems, Inc., eVestment Alliance Driehaus Securities LLC, DistributorData as of 8/31/15. Benchmark: MSCI Frontier Markets Index
The Fund invests in foreign securities, including small and mid cap stocks, which may be subject to greater volatility than other investments. During certain periods, the Fund has benefited from unusually strong market conditions. At times, a significant portion of a Fund’s return may be attributable to investments in initial public offerings (IPOs) or concentrations in certain strong performing sectors, such as technology. Returns from IPOs or sector concentrations may not be repeated or consistently achieved in the future. In addition, participating in IPOs and other invest-ments during favorable market conditions may enhance the performance of a Fund with a smaller asset base, and the Fund may not experience similar performance results as its assets grow. Investments in overseas markets can pose more risks than U.S. investments, and the Fund’s share prices are expected to be more volatile than that of a U.S.-only fund. In addition, the Fund’s returns will fluctuate with changes in stock market conditions, currency values, interest rates, foreign government regulations, and economic and political conditions in countries in which the Fund invests. These risks are generally greater when investing in emerging markets. These and other risk considerations are discussed in the Fund’s prospectus. Please consider the invest-ment objectives, risks, fees and expenses of the Fund carefully prior to investing. The prospectus and summary prospectus contain this and other important information about the Fund. To obtain a copy of the prospectus and/or summary prospectus, please call us at (800) 560-6111 or visit www.driehaus.com. Please read the prospectus carefully before investing.
TERMS: Active share represents the share of portfolio holdings that differ from the benchmark index holdings. Average drawdown is the arithmetic average of declines in value during a given period of time. Downside risk is a measure of the average deviations of a negative return series. A large downside risk implies that there have been large swings or volatility in the manager’s return series. Beta is a measure of a portfolio’s volatility. A beta of 1.00 implies perfect historical correlation of movement with the market. A higher beta manager will rise and fall more rapidly than the market, whereas a lower beta manager will rise and fall slower. Standard deviation is a measure of the average deviations of a return series from its mean; often used as a measure of portfolio volatility. A large standard deviation implies that there have been large swings or volatility in the manager’s return series. Tracking error measures of the amount of active risk that is being taken by a manager. Tracking error accounts for the deviation away from the benchmark and does not indicate in which direction it occurred, either positive or negative. Source: eVestment Alliance. Alpha is the measure of performance on a risk-adjusted basis. Alpha takes the volatility (price risk) of a mutual fund and compares its risk-adjusted performance to a benchmark index. The excess return of the fund relative to the return of the benchmark index is a fund’s alpha. Sharpe ratio is calculated by finding the portfolio’s excess return and then dividing by the portfolio’s standard deviation. Information Ratio (IR) measures a portfolio manager’s ability to generate excess returns relative to a benchmark, but also attempts to identify the consistency of the investor. This ratio will identify if a manager has beaten the benchmark by a lot in a few months or a little every month. The higher the IR the more consistent a manager is and consistency is an ideal trait. R-Squared is a statistical measure that represents the percentage of a fund or security’s movements that can be explained by movements in a benchmark index. For fixed-income securities, the benchmark is the T-bill. For equities, the benchmark is the S&P 500.
Fund Benchmark Active weights
Argentina 6.6% 10.9%
Bangladesh 12.7% 2.7%
Botswana 4.7% 0.0%
Cambodia 0.3% 0.0%
Canada 0.7% 0.0%
Colombia 0.2% 0.0%
Egypt 3.5% 0.0%
Jersey 1.1% 0.0%
Kazakhstan 0.6% 2.3%
Kenya 4.6% 5.0%
Kuwait 4.9% 21.2%
Luxembourg 0.5% 0.0%
Nigeria 3.3% 13.1%
Pakistan 14.0% 9.6%
Romania 3.1% 1.3%
Saudi Arabia 1.8% 0.0%
Singapore 0.6% 0.0%
Slovenia 0.4% 2.3%
Sri Lanka 9.0% 2.1%
Thailand 2.8% 0.0%
Togo 0.8% 0.7%
United Arab Emirates 4.5% 0.0%
United Kingdom 2.1% 0.0%
Vietnam 8.1% 3.9%
Cash 9.4% 0.0%
-30% -18% -6% 6% 18% 30%
-4.3%
10.0%
4.7%
0.3%
0.2%
3.5%
1.1%
-1.7%
-0.4%
-16.3%
-9.8%
0.5%
4.4%
1.8%
1.8%
0.6%
-1.8%
6.9%
4.5%
2.1%
4.2%
9.4%
0.7%
2.8%
0.0%
*Above-average cash position due to large end-of-month contributions.