Dried Blood Spot Analysis From The Clinic To The Laboratory · Dried Blood Spot Analysis –From...
33
©2011 Waters Corporation 1 Dried Blood Spot Analysis – From The Clinic To The Laboratory Joanne Mather, Pharmaceutical Life Sciences Waters Corporation
Transcript of Dried Blood Spot Analysis From The Clinic To The Laboratory · Dried Blood Spot Analysis –From...
©2011 Waters Corporation 1
Dried Blood Spot Analysis – From The Clinic To The Laboratory
Joanne Mather,
Pharmaceutical Life Sciences
Waters Corporation

©2011 Waters Corporation 2
From The Clinic To The Lab
Blood Spot Sampling First Used In Neonatal Screening

©2011 Waters Corporation 3
Dried Blood Spots – Timeline of Implementation
>10 yrs ago
DBS were exclusively used for neonatal, infectious disease screening, therapeutic drug monitoring
5 Years Ago
2 manuscripts – DBS to discovery-stage PK and metabolite ID
(Merck Frost)
Present Day
Potential application to routine drug development was realized within GlaxoSmithKline in 2006
Quickly saw the broadly applicable advantages offered by DBS
Other pharmaceutical companies (sanofi-aventiset. al.) becoming heavily involved with DBS (as well as CROs and vendors)
Dried Blood Spots have been around for over 40 years

©2011 Waters Corporation 4
DBS Uptake
On Board
To date GSK has developed >150 validated DBS methods for nearly 75 compounds >200 studies supported using DBS >10 compounds have reached phase 1 pre-clin GLP studies

©2011 Waters Corporation 5
Issues and Advantages of Dried Blood Spot Analysis
[Card based sample collection]
— Reduced animal usage/ cost/ 3 R‘s
— Lower shipping costs
— Reduced compound needed for tox studies
— Improved data- PK data from toxicology animals
[Small sample volumes 10-20µL]
— Assay sensitivity
[Background card interference]
— More complicated methods development
[Resolution from metabolites and matrix needed]
— High LC separation efficiency

©2011 Waters Corporation 6
Analytical Issues
Non – liquid format
Current work flow will not work with this format
Current approach requires punching, either manual or
automated
Card background may cause issues
Matrix effects from blood components
— Resolution from metabolites and matrix needed for quality
©2011 Waters Corporation 7
Analytical Issues
Non – liquid format
Current work flow will not work with this format
Current approach require punching, either manual or
automated
Card background may cause issues
Matrix effects from blood components

©2011 Waters Corporation 8
Blood Spotting
Aliquot 15μL blood per spot
—3 spots per sample plus
‗spare‘
—Using a pipette or
capillary
o Do NOT allow tip to
touch card surface!
Dry for 2 hours at room
temperature
Ship & store in sealable
bags containing desiccant
©2011 Waters Corporation 9
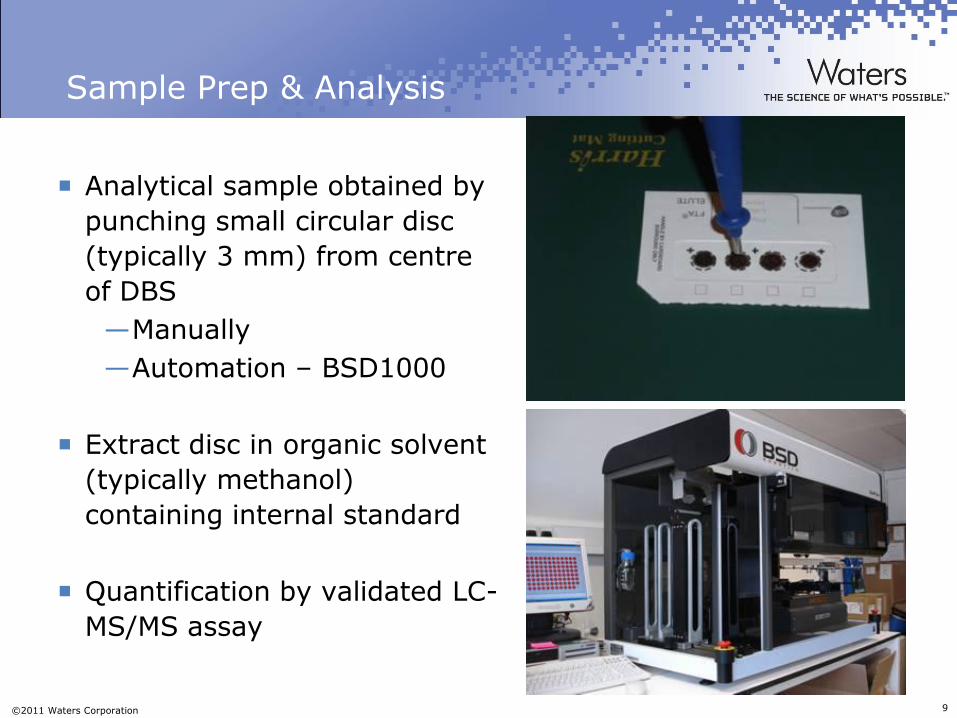
Sample Prep & Analysis
Analytical sample obtained by
punching small circular disc
(typically 3 mm) from centre
of DBS
—Manually
—Automation – BSD1000
Extract disc in organic solvent
(typically methanol)
containing internal standard
Quantification by validated LC-
MS/MS assay
©2011 Waters Corporation 10
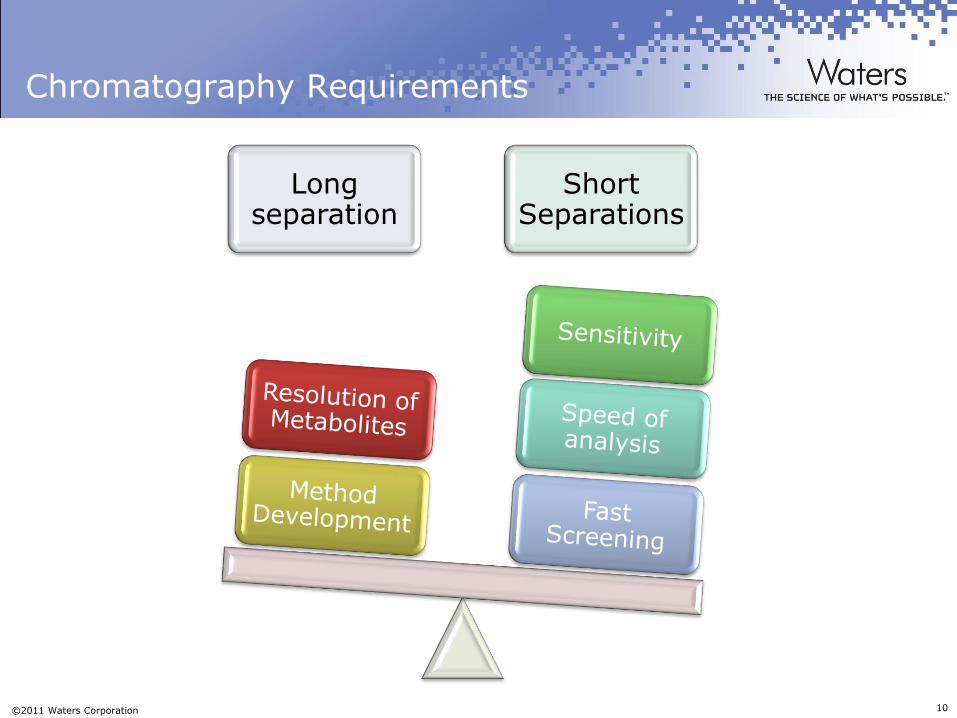
Chromatography Requirements
Long separation
Short Separations

©2011 Waters Corporation 11
Analysis with LC/MS/MS
Quantification by validated LC-MS/MS assay
Use of UPLC:
• Increased sensitivity
• Increased resolution
• Increased speed of analysis
Time0.00 0.50 1.00 1.50 2.00
%
0
0.00 0.50 1.00 1.50 2.00
%
0
0.00 0.50 1.00 1.50 2.00
%
0
0.00 0.50 1.00 1.50 2.00
%
0
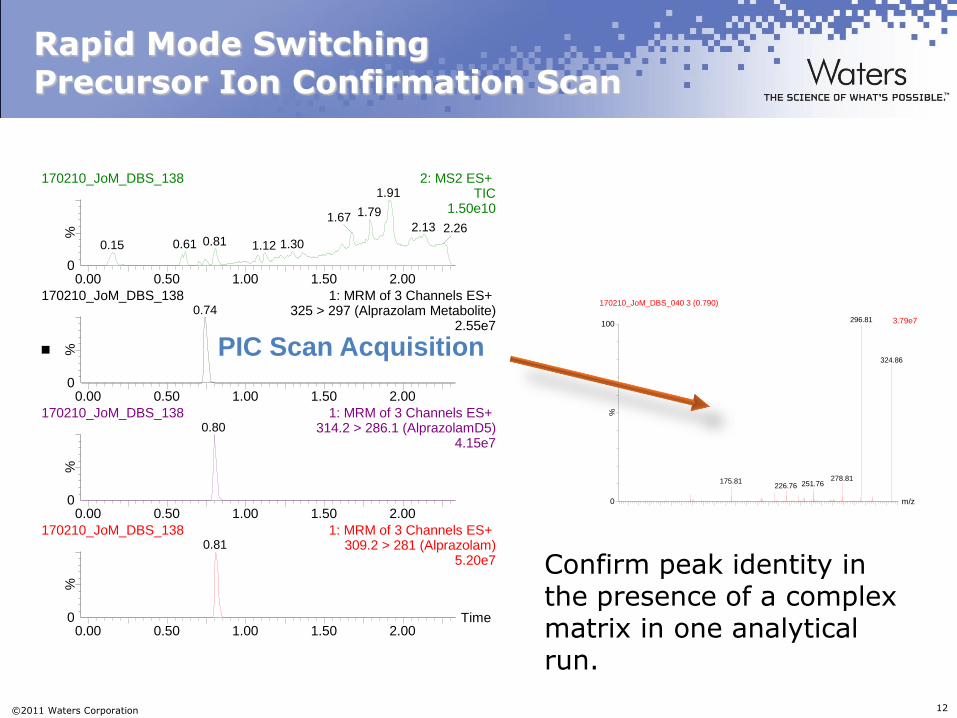
170210_JoM_DBS_138 2: MS2 ES+ TIC
1.50e10
1.91
1.791.67
0.810.610.15 1.301.12
2.13 2.26
170210_JoM_DBS_138 1: MRM of 3 Channels ES+ 325 > 297 (Alprazolam Metabolite)
2.55e7
0.74
170210_JoM_DBS_138 1: MRM of 3 Channels ES+ 314.2 > 286.1 (AlprazolamD5)
4.15e7
0.80
170210_JoM_DBS_138 1: MRM of 3 Channels ES+ 309.2 > 281 (Alprazolam)
5.20e7
0.81
©2011 Waters Corporation 12
Time0.00 0.50 1.00 1.50 2.00
%
0
0.00 0.50 1.00 1.50 2.00
%
0
0.00 0.50 1.00 1.50 2.00
%
0
0.00 0.50 1.00 1.50 2.00
%
0
170210_JoM_DBS_138 2: MS2 ES+ TIC
1.50e10
1.91
1.791.67
0.810.610.15 1.301.12
2.13 2.26
170210_JoM_DBS_138 1: MRM of 3 Channels ES+ 325 > 297 (Alprazolam Metabolite)
2.55e7
0.74
170210_JoM_DBS_138 1: MRM of 3 Channels ES+ 314.2 > 286.1 (AlprazolamD5)
4.15e7
0.80
170210_JoM_DBS_138 1: MRM of 3 Channels ES+ 309.2 > 281 (Alprazolam)
5.20e7
0.81
m/z80 100 120 140 160 180 200 220 240 260 280 300 320
%
0
100
170210_JoM_DBS_040 3 (0.790)
3.79e7296.81
278.81175.81 251.76226.76
324.86
PIC Scan Acquisition
Rapid Mode Switching Precursor Ion Confirmation Scan
Confirm peak identity in the presence of a complex matrix in one analytical run.

©2011 Waters Corporation 13
Analytical Issues
Non – liquid format
Current work flow will not work with this format
Current approach require punching, either manual or
automated
Card background may cause issues
Matrix effects from blood components

©2011 Waters Corporation 14
Dried blood spot microvolume sampling for DMPK
Three types are available (Whatman, GE),
which have different chemistries.
— FTA DMPK-A (treated)
— FTA DMPK-B (treated)
— FTA DMPK-C (untreated)
FTA DMPK A & B cards contain proprietary
chemical mixtures that lyse cells, inactivate
pathogens and denature degradative
enzymes and other proteins.
FTA DMPK-C cards contain only cellulose.
http://www.whatman.com/dmpk.aspx

©2011 Waters Corporation 15
Rapid MS to MRM Switching

©2011 Waters Corporation 16
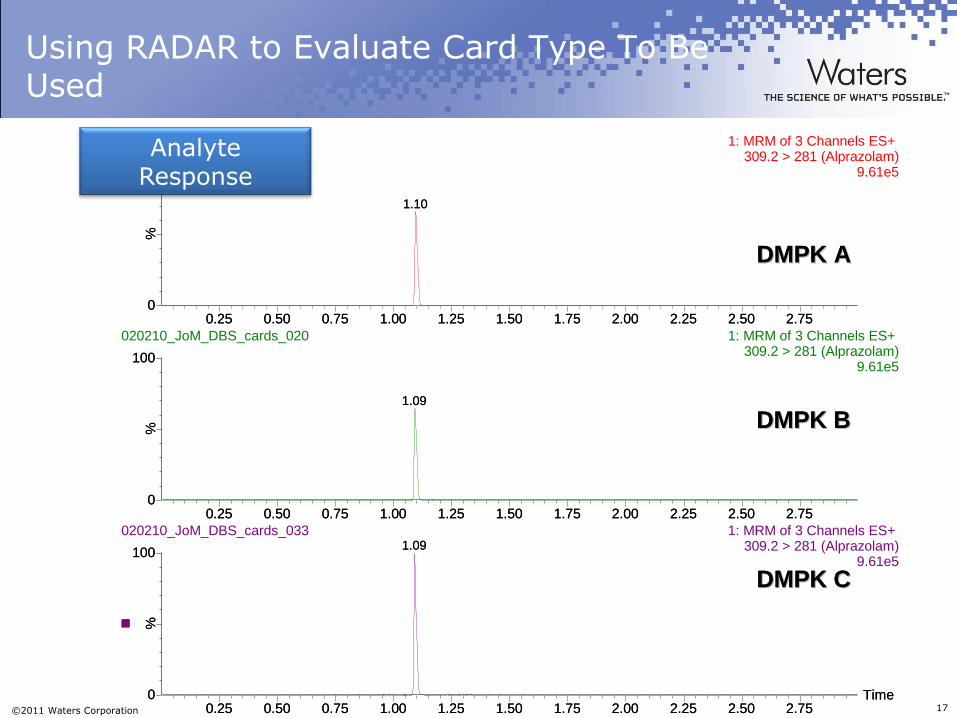
Using RADAR to Evaluate Card Type To Be Used
DMPK ADMPK A
DMPK BDMPK B
DMPK CDMPK C
Time0.25 0.50 0.75 1.00 1.25 1.50 1.75 2.00 2.25 2.50 2.75
%
0
100
0.25 0.50 0.75 1.00 1.25 1.50 1.75 2.00 2.25 2.50 2.75
%
0
100
0.25 0.50 0.75 1.00 1.25 1.50 1.75 2.00 2.25 2.50 2.75
%
0
100
010210_JoM_DBS_cards_013 2: MS2 ES+ TIC
5.98e91.18
1.030.22
0.32
0.94
1.55
1.421.29
2.411.911.76 2.08 2.24
010210_JoM_DBS_cards_017 2: MS2 ES+ TIC
5.98e9
1.54
0.98
0.22 0.63
1.28
1.40
1.63
2.341.78
1.88 2.052.24
2.41
010210_JoM_DBS_cards_025 2: MS2 ES+ TIC
5.98e91.54
0.23 1.45
1.281.030.90
0.58
2.34
1.73
1.872.07
Full scan blank card -background signal
©2011 Waters Corporation 17
Using RADAR to Evaluate Card Type To Be Used
DMPK ADMPK A
DMPK BDMPK B
DMPK CDMPK C
Time0.25 0.50 0.75 1.00 1.25 1.50 1.75 2.00 2.25 2.50 2.75
%
0
100
0.25 0.50 0.75 1.00 1.25 1.50 1.75 2.00 2.25 2.50 2.75
%
0
100
0.25 0.50 0.75 1.00 1.25 1.50 1.75 2.00 2.25 2.50 2.75
%
0
100
020210_JoM_DBS_cards_010 1: MRM of 3 Channels ES+ 309.2 > 281 (Alprazolam)
9.61e5
1.10
020210_JoM_DBS_cards_020 1: MRM of 3 Channels ES+ 309.2 > 281 (Alprazolam)
9.61e5
1.09
020210_JoM_DBS_cards_033 1: MRM of 3 Channels ES+ 309.2 > 281 (Alprazolam)
9.61e5
1.09
AnalyteResponse

©2011 Waters Corporation 18
Analytical Issues
Non – liquid format
Current work flow will not work with this format
Current approach require punching, either manual or
automated
Card background may cause issues
Matrix effects from blood components

©2011 Waters Corporation 19
Matrix effects from blood components
Gain adequate resolution from matrix interferences and
other analytes/ metabolites
Maximize sensitivity
Maintain or improve productivity
Removal of matrix components
Matrix – The Challenge

©2011 Waters Corporation 20
RADAR - Monitor matrix complexity
Time0.50 1.00 1.50 2.00
%
0
0.50 1.00 1.50 2.00
%
0
170210_JoM_DBS_135 2: MS2 ES+ TIC
1.54e10
2.01
1.90
1.561.42
1.28
2.24
170210_JoM_DBS_135 1: MRM of 3 Channels ES+ 309.2 > 281 (Alprazolam)
6.36e7
1.42
Time0.50 1.00 1.50 2.00
%
0
0.50 1.00 1.50 2.00
%
0
170210_JoM_DBS_138 2: MS2 ES+ TIC
1.50e10
1.91
1.79
1.67
1.61
0.810.611.30
2.132.26
170210_JoM_DBS_138 1: MRM of 3 Channels ES+ 309.2 > 281 (Alprazolam)
5.20e7
0.81
Gradient A Gradient B
Full Scan
MRMResolved more effectively from the endogenous blood and card matrix peaks
©2011 Waters Corporation 21
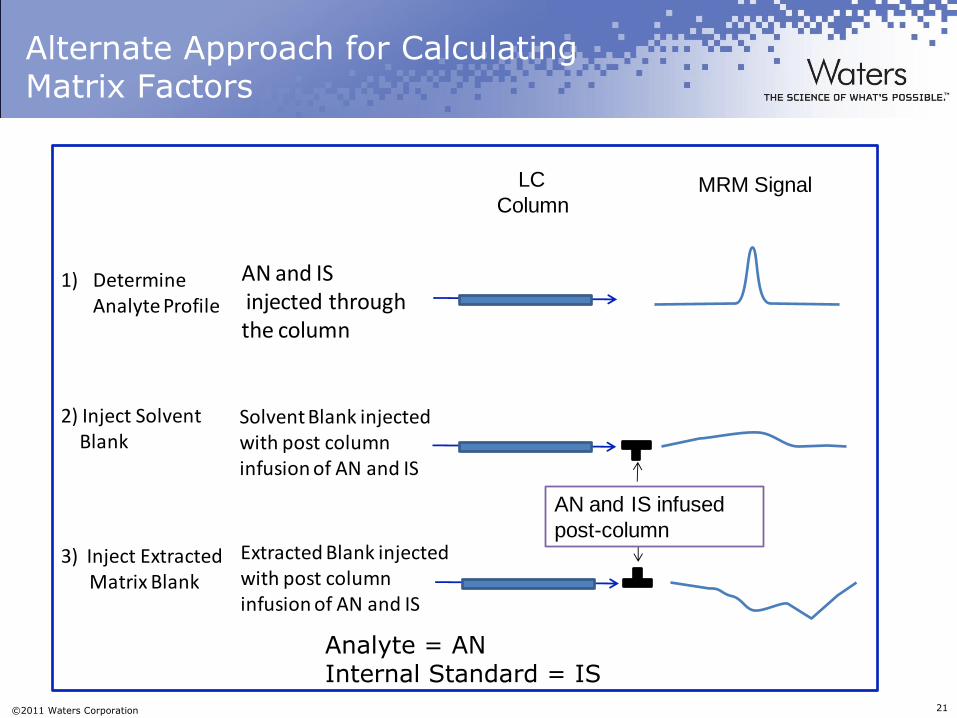
Alternate Approach for Calculating Matrix Factors
AN and ISinjected through the column
2) Inject Solvent Blank
3) Inject Extracted Matrix Blank
LC
Column
1) Determine Analyte Profile
Solvent Blank injected with post column infusion of AN and IS
Extracted Blank injected with post column infusion of AN and IS
MRM Signal
AN and IS infused
post-column
Analyte = ANInternal Standard = IS
©2011 Waters Corporation 22
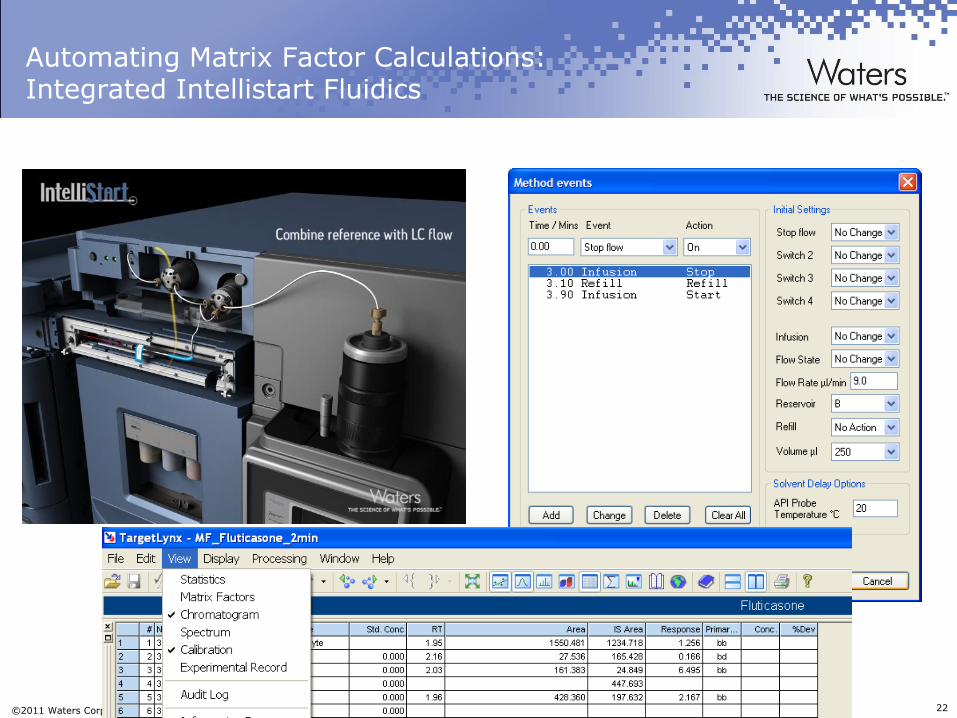
Automating Matrix Factor Calculations: Integrated Intellistart Fluidics
©2011 Waters Corporation 23
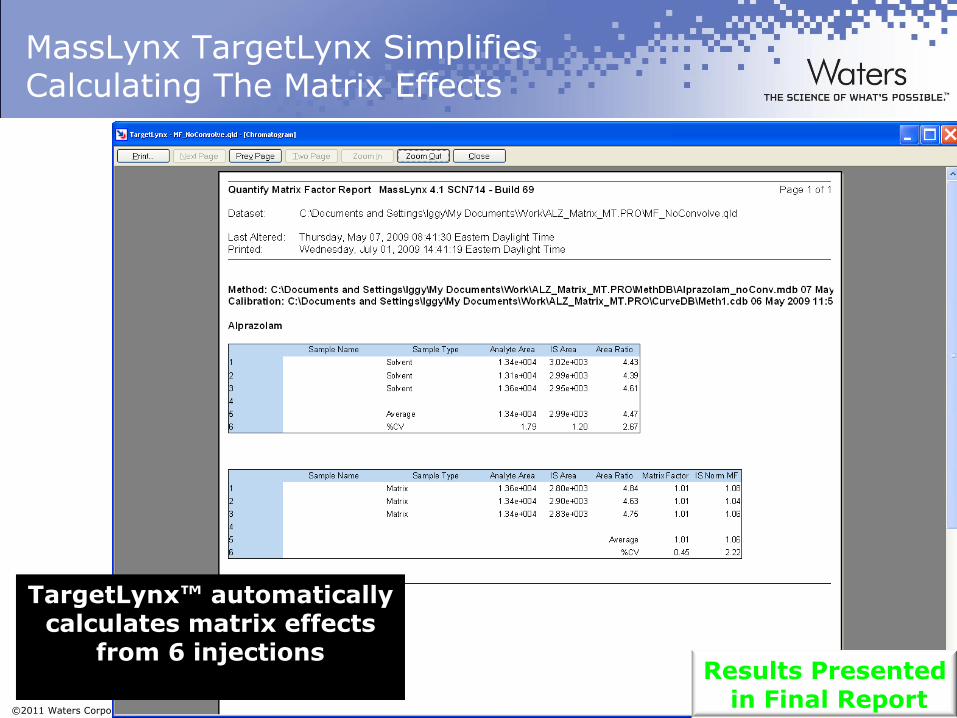
MassLynx TargetLynx Simplifies Calculating The Matrix Effects
Results Presentedin Final Report
TargetLynx™ automaticallycalculates matrix effects
from 6 injections

©2011 Waters Corporation 24
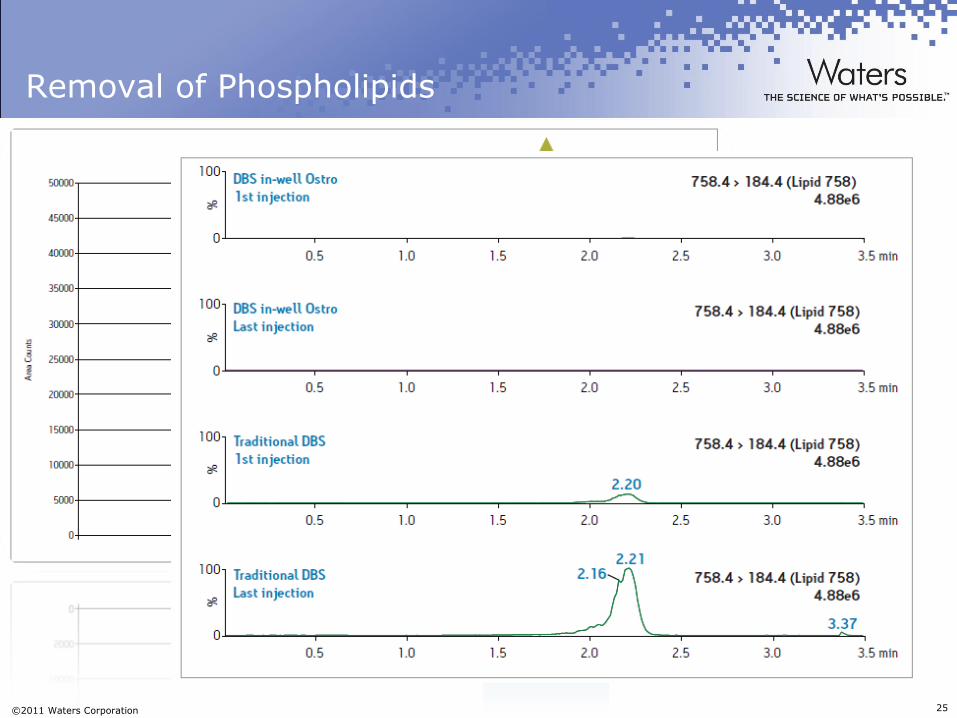
Removal of Phospholipids
©2011 Waters Corporation 25
Removal of Phospholipids

©2011 Waters Corporation 26
Removal of Phospholipids
©2011 Waters Corporation 27
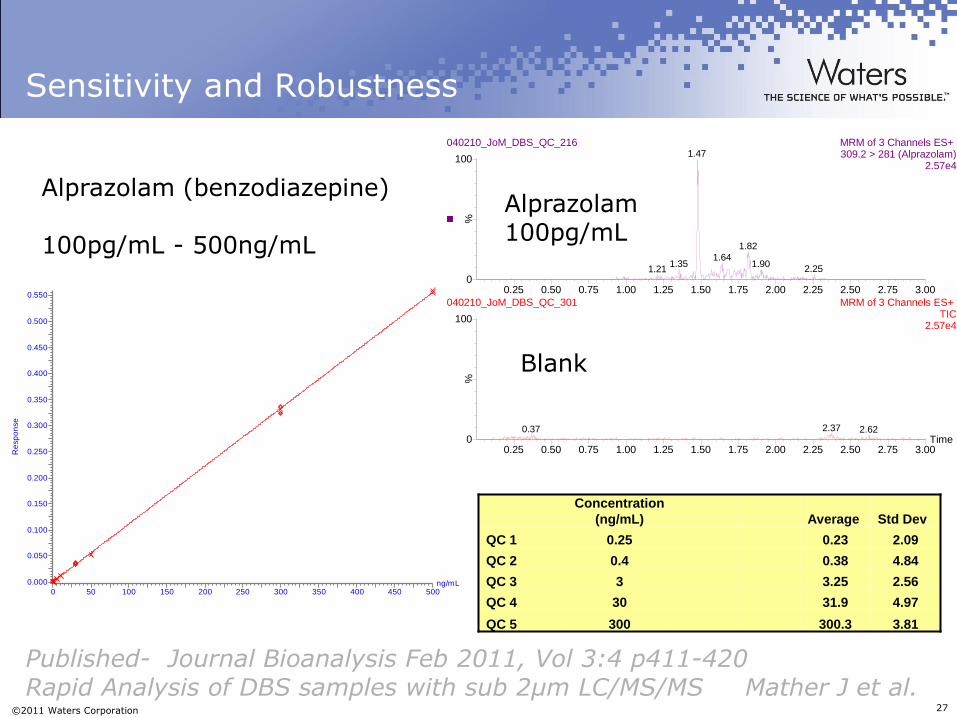
Sensitivity and Robustness
Time0.25 0.50 0.75 1.00 1.25 1.50 1.75 2.00 2.25 2.50 2.75 3.00
%
0
100
0.25 0.50 0.75 1.00 1.25 1.50 1.75 2.00 2.25 2.50 2.75 3.00
%
0
100
040210_JoM_DBS_QC_216 MRM of 3 Channels ES+ 309.2 > 281 (Alprazolam)
2.57e4
1.47
1.351.21
1.82
1.641.90
2.25
040210_JoM_DBS_QC_301 MRM of 3 Channels ES+ TIC
2.57e4
2.370.37 2.62
Concentration
(ng/mL) Average Std Dev
QC 1 0.25 0.23 2.09
QC 2 0.4 0.38 4.84
QC 3 3 3.25 2.56
QC 4 30 31.9 4.97
QC 5 300 300.3 3.81
Compound name: Alprazolam
Correlation coefficient: r = 0.999680, r^2 = 0.999360
Calibration curve: 0.00110984 * x + 0.000605461
Response type: Internal Std ( Ref 2 ), Area * ( IS Conc. / IS Area )
Curve type: Linear, Origin: Exclude, Weighting: 1/x, Axis trans: None
ng/mL0 50 100 150 200 250 300 350 400 450 500
Re
sp
on
se
0.000
0.050
0.100
0.150
0.200
0.250
0.300
0.350
0.400
0.450
0.500
0.550
Alprazolam (benzodiazepine)
100pg/mL - 500ng/mL
Alprazolam100pg/mL
Blank
Published- Journal Bioanalysis Feb 2011, Vol 3:4 p411-420Rapid Analysis of DBS samples with sub 2µm LC/MS/MS Mather J et al.
©2011 Waters Corporation 28
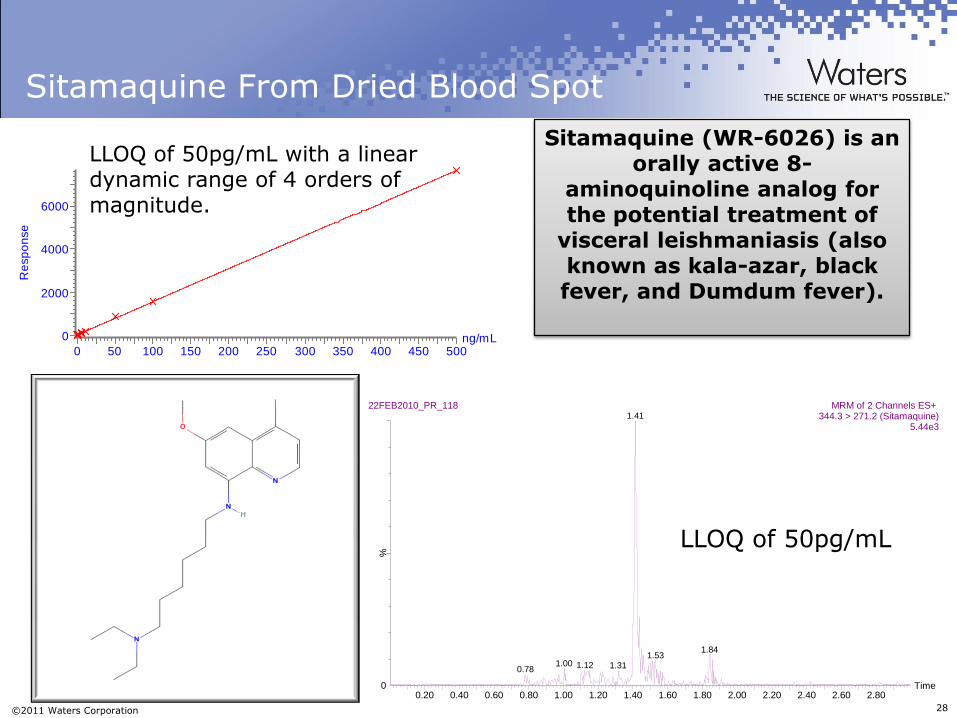
Sitamaquine From Dried Blood Spot Compound name: Sitamaquine
Correlation coefficient: r = 0.999910, r^2 = 0.999820
Calibration curve: 15.233 * x + 38.3894
Response type: External Std, Area
Curve type: Linear, Origin: Exclude, Weighting: Null, Axis trans: None
ng/mL0 50 100 150 200 250 300 350 400 450 500
Re
sp
on
se
0
2000
4000
6000
Time0.20 0.40 0.60 0.80 1.00 1.20 1.40 1.60 1.80 2.00 2.20 2.40 2.60 2.80
%
0
22FEB2010_PR_118 MRM of 2 Channels ES+ 344.3 > 271.2 (Sitamaquine)
5.44e3
1.41
1.000.78 1.12 1.31
1.841.53
Sitamaquine (WR-6026) is an orally active 8-
aminoquinoline analog for the potential treatment of
visceral leishmaniasis (also known as kala-azar, black fever, and Dumdum fever).
LLOQ of 50pg/mL with a linear dynamic range of 4 orders of magnitude.
LLOQ of 50pg/mL

©2011 Waters Corporation 29
Heart Cut Configuration – 2D UPLC/MS/MS
Trapping – Decrease Matrix Effects and Increase Sensitivity
At-Column Dilution –Inject Large Volume Samples in Strong Solvent
No evaporation & reconstitution

©2011 Waters Corporation 30
2 Dimensional Dried Blood Spot Analysis of Rosuvastatin
No ―At Column Dilution‖ With ―At Column Dilution‖
• Direct injection of methanol extract from DBS sample• 80uL injection of methanol• At column dilution

©2011 Waters Corporation 31
2 Dimensional UPLC/MS/MSBioanalysis
Blank100pg/mL
©2011 Waters Corporation 32
Conclusions
Dried Blood Spots offer a significant scientific and expense advantage.
The lower sample volume derived from the dried blood spots and the background card matrix poses a significant analytical challenge.
Information rich LC/MS/MS (RADAR) can simplify the process of DBS analysis/ method development.
Analysis times as low as 3 minutes possible.
2D LC to remove Matrix components (trap) and allow injection of large volume samples in high organic solvent.

©2011 Waters Corporation 33
Acknowledgements
Paul Rainville
Jennifer Simeone
Robert Plumb
David Little
Jessalynn Wheaton
Erin Chambers
Christopher Evans – GSK
Neil Spooner - GSK
Ian Wilson - Astra Zeneca