DRG-based hospital payment Experiences from 12 European ... · DRG-based hospital payment...
29
DRG-based hospital payment Experiences from 12 Experiences from 12 European countries Dr. med. Wilm Quentin, MSc HPPF Research Fellow Department of Health Care Management Berlin University of Technology WHO Collaborating Centre for Health Systems,Research and Management European Observatory on Health Systems and Policies 1 9 November 2011 Chess Seminar | Helsinki, Finland
Transcript of DRG-based hospital payment Experiences from 12 European ... · DRG-based hospital payment...

DRG-based hospitalpayment
Experiences from 12Experiences from 12European countries
Dr. med. Wilm Quentin, MSc HPPF
Research Fellow
Department of Health Care Management
Berlin University of Technology
WHO Collaborating Centre for Health Systems,Research and Management
European Observatory on Health Systems and Policies
19 November 2011 Chess Seminar | Helsinki, Finland

SuomiFinland
Countries covered by EuroDRG project9 November 2011 2Chess Seminar | Helsinki, Finland

Country Year of DRG
introduction
Original purpose(s) Principal purpose(s) in 2010
Austria 1997 Budgetary allocation Budgetary allocation, planning
England 1992 Patient classification Payment
Estonia 2003 Payment Payment
Finland 1995 Description of hospital
activity, benchmarking
Planning and management, benchmarking,
hospital billing
France 1991 Description of hospital activity Payment
Purposes of DRG systems in 12 European countries
9 November 2011 Chess Seminar | Helsinki, Finland 3
Germany 2003 Payment Payment
Ireland 1992 Budgetary allocation Budgetary allocation
Netherlands 2005 Payment Payment
Poland 2008 Payment Payment
Portugal 1984 Hospital output measurement Budgetary allocation
Spain
(Catalonia)
1996 Payment Payment, benchmarking
Sweden 1995 Payment Benchmarking, performance
measurement

Dimension
System
Activity
Expenditure
Control
Technical
EfficiencyQuality
Administrative
simplicityTransparencyNumber of
services per
case
Number
of cases
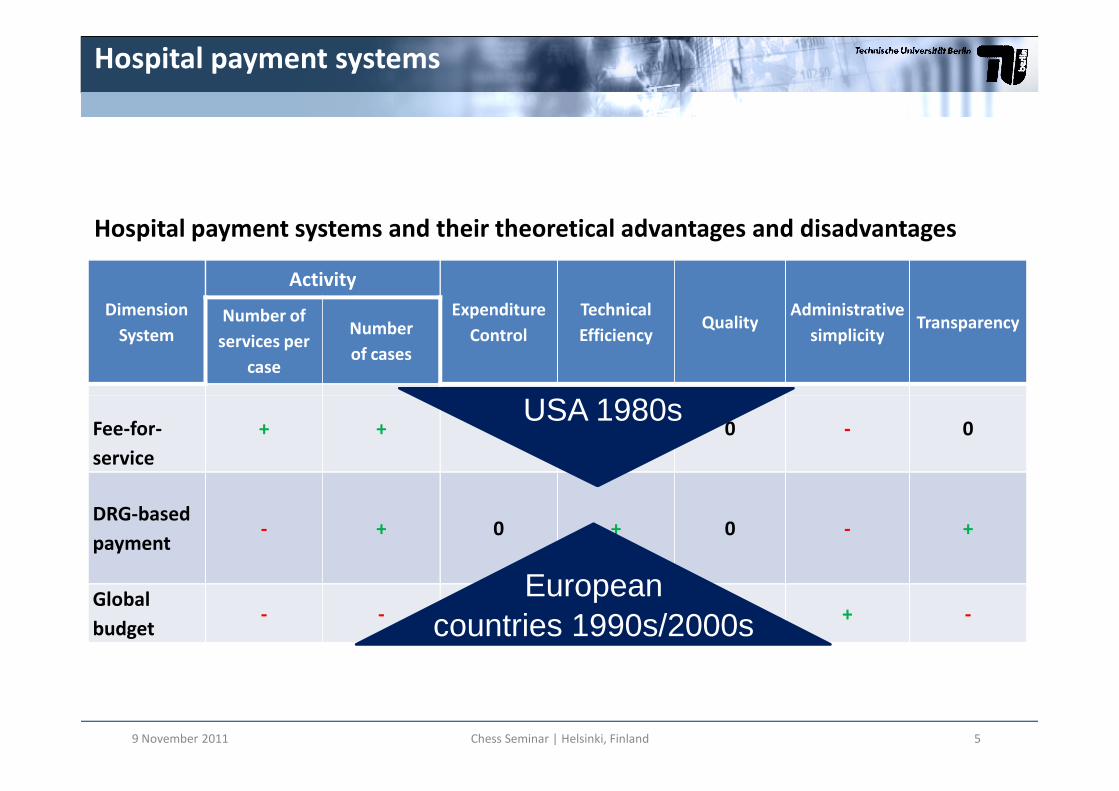
Hospital payment systems
Hospital payment systems and their theoretical advantages and disadvantages
9 November 2011 Chess Seminar | Helsinki, Finland 4
Fee-for-
service
+ + - 0 0 - 0
Global
budget- - + 0 0 + -
Dimension
System
Activity
Expenditure
Control
Technical
EfficiencyQuality
Administrative
simplicityTransparencyNumber of
services per
case
Number
of cases
Hospital payment systems
Hospital payment systems and their theoretical advantages and disadvantages
USA 1980s
9 November 2011 Chess Seminar | Helsinki, Finland 5
Fee-for-
service
+ + - 0 0 - 0
DRG-based
payment- + 0 + 0 - +
Global
budget- - + 0 0 + -
Europeancountries 1990s/2000s
USA 1980s
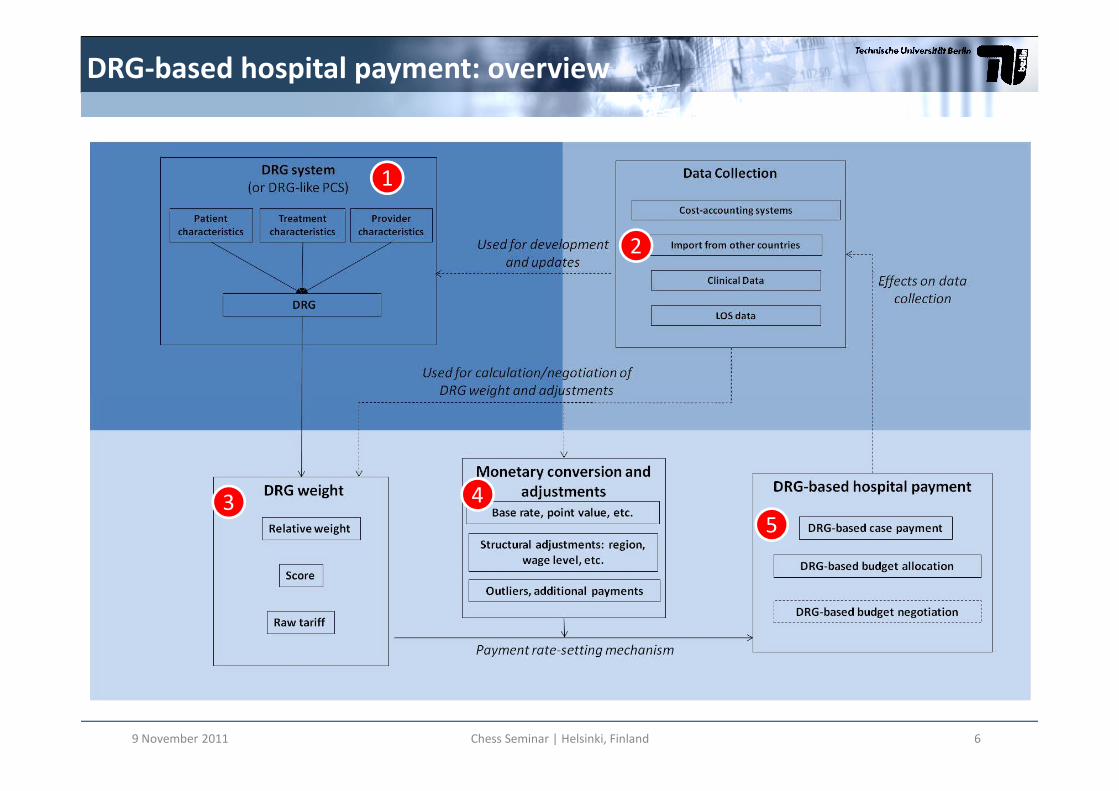
DRG-based hospital payment: overview
1
2
9 November 2011 Chess Seminar | Helsinki, Finland 6
3 4
5

DRG system 1: history1
Choosing a PCS: copied, further developed or self-developed?
9 November 2011 Chess Seminar | Helsinki, Finland 7

DRG system 2: basic characteristics1
AP-DRG AR-DRG G-DRG GHM NordDRG HRG JGP LKF DBC
DRGs / DRG-like groups 679 665 1,200 2,297 794 1,389 518 979 ≈30,000
MDCs / Chapters 25 24 26 28 28 23 16 - -
Partitions 2 3 3 4 2 2* 2* 2* -

DRG system 3: patient classification
9 November 2011 Chess Seminar | Helsinki, Finland 9
1

DRG system 4: patient classification 11
AP-DRG AR-DRG G-DRG GHM NordDRG HRG JGP LKF DBCClassification VariablesPatient characteristics
Age x x x x x x x x -Gender - - - - x - - - -Diagnoses x x x x x x x x xNeoplasms / Malignancy x x x - - - - - -Body Weight (Newborn) x x x x - - - - -Mental Health Legal Status - x x - - - - - -
Medical and management decision variablesAdmission Type - - - - - x x - -
9 November 2011 Chess Seminar | Helsinki, Finland 10
Admission Type - - - - - x x - -Procedures x x x x x x x x xMechanical Ventilation - - x x - - - - -Discharge Type x x x x x x x - -LOS / Same Day Status - x x x x x x - -
Structural characteristicsSetting (inpatient, outpatient, ICU etc.) - - - x - - - - xStay at Specialist Departments - - - - - - - x -Medical Specialty - - - - - - - - xDemands for Care - - - - - - - - x
Severity / Complexity Levels 3* 4 unlimited 5** 2 3 3 unlimited -Aggregate case complexity measure - PCCL PCCL x - - - - -
PCCL = Patient Clinical Complexity level
* not explicitly mentioned (Major CCs at MDC level plus 2 levels of severity at DRG level)** 4 levels of severity plus one GHM for short stays or outpatient care
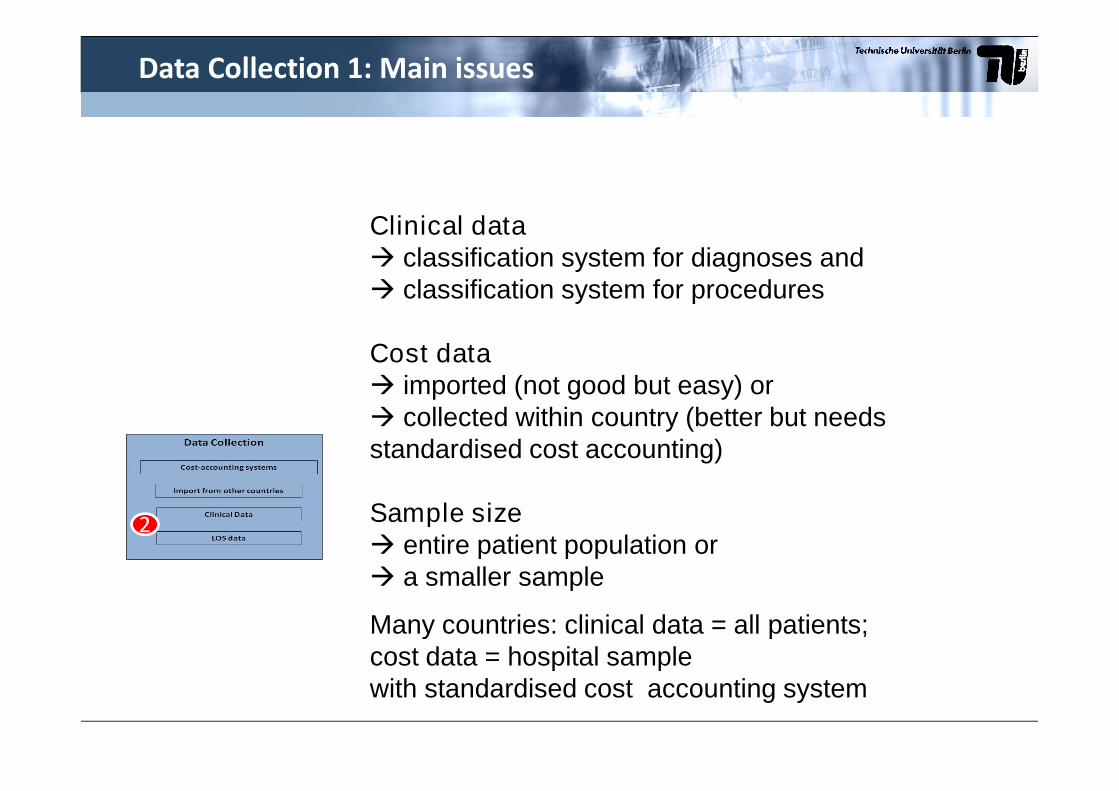
Clinical data classification system for diagnoses and classification system for procedures
Cost data imported (not good but easy) or
Data Collection 1: Main issues
imported (not good but easy) or collected within country (better but needsstandardised cost accounting)
Sample size entire patient population or a smaller sample
Many countries: clinical data = all patients;cost data = hospital samplewith standardised cost accounting system
2

Ddata collection 2: Cost data
Number (share) of costdata collecting hospitals
Direct costallocation to patients
Data used for calculationof DRG weights
Austria20 reference hospitals(~8% of all hospitals)
grosscosting x
England all hospitals top down microcosting x
EstoniaAll hospitals contracted by
the NHIFtop down microcosting x
Finland5 reference hospitals
(~30% of specialised care)bottom up microcosting x
2
(~30% of specialised care)
France99 hospitals (~ 13% ofinpatient admissions)
mainly top downmicrocosting
x
Germany125 hospitals
(~ 6% of all hospitals)mainly bottom up
microcostingx
Ireland - - -Poland - - -
Portugal - - -
The Netherlandsunit costs: 15-25 hospitals
(~ 24% of all hospitals)bottom up microcosting x
Spain - - -
Sweden(~ 62% of inpatient
admissions)bottom up microcosting x
9 November 2011 Chess Seminar | Helsinki, Finland 12

DRG-based hospital payment: overview
1
2
9 November 2011 Chess Seminar | Helsinki, Finland 13
3 4
5

Costs/revenues
Total costs
2) Increase revenue
11 p̂R
2p̂
Incentives of DRG-based hospital payment 1
LOS1a) Reduce LOS
1b) Reduce intensity of services1p̂R
9 November 2011 14Chess Seminar | Helsinki, Finland

Incentives of DRG-based hospital payment 2
Incentives of
DRG-based hospital payment
Strategies of hospitals
1. Reduce costs per patient a) Reduce length of stay
optimize internal care pathways
inappropriate early discharge (‘bloody discharge’)
b) Reduce intensity of provided services
avoid delivering unnecessary services
withhold necessary services (‘skimping/undertreatment’)
c) Select patients
specialize in treating patients for which the hospital has a competitive advantage
select low-cost patients within DRGs (‘cream-skimming’)
9 November 2011 Chess Seminar | Helsinki, Finland 15
select low-cost patients within DRGs (‘cream-skimming’)
2. Increase revenue per patient a) Change coding practice
improve coding of diagnoses and procedures
fraudulent reclassification of patients, e.g. by adding inexistent secondary diagnoses (‘up-
coding’)
b) Change practice patterns
provide services that lead to reclassification of patients into higher paying DRGs
(‘gaming/overtreatment’)
3. Increase number of patients a) Change admission rules
reduce waiting list
admit patients for unnecessary services (‘supplier-induced demand’)
b) Improve reputation of hospital
improve quality of services
focus efforts exclusively on measurable areas

What determines the strength of incentives?
1. Applicability of DRG weights and conversionrates
2. Type of Hospital payment• DRG-based case-payment Within or without global budgets Within or without global budgets
• DRG-based budget allocation
3. Percentage of total revenues related to DRGs
4. Availability of other funding
9 November 2011 Chess Seminar | Helsinki, Finland 16

DRG weightapproach
DRG weight
(unit)
Monetary
conversion (unit)
Hospital payment
rate (€)
Raw tariff 1.95 2000 € 3900 €X
DRG weight and monetary conversion
=
The two elements of “DRG payment rates”
Relativeweights
3000 € 1.3 3900 €
Scores 130 points 30 € 3900 €
X
X
179 November 2011 Chess Seminar | Helsinki, Finland
=
=

DRG weights across Europe
Country DRG weight
(unit)
Applicability of DRG weight
Austria Score Nationwide
England Raw tariff Nationwide
Estonia Relative weight Nationwide
Finland Relative weight National (8 districts), District-specific
(5 districts)
France Raw tariff Nationwide (separate tariffs for public and private hospitals)
Germany Relative weight Nationwide
3
9 November 2011 Chess Seminar | Helsinki, Finland 18
Ireland (Adapted) Relative weight Nationwide
(separate weights for paediatric hospitals)
Netherlands Raw tariff Nationwide (67% of DRGs),
hospital-specific (33% of DRGs)
Poland Score Nationwide (separate tariffs for emergencies, elective cases,
day cases)
Portugal (Adapted) Relative weight Nationwide
Spain (Catalonia) (1) (Adapted) Raw tariff
(AP-DRGs);
(2) (Imported) Relative weight
(CMS-DRGs)
(1) Nationwide
(AP-DRGs)
(2) Region-wide (CMS-DRGs)
Sweden Relative weight Nationwide,
county-specific (some counties)

Monetary conversion across Europe
Country Monetary conversion Applicability of conversion rate
Austria (Implicit) Point value Depending on state
England Market forces factor Hospital-specific
Estonia Base rate Nationwide
Finland Base rate Hospital-specific
France (1) Regional adjustment
(2) Transition coefficient (until 2012)
(1) Region-specific
(2) Hospital-specific
Germany Base rate State-wide
Ireland Base rates (1) Specific to one of four hospital peer
4
9 November 2011 Chess Seminar | Helsinki, Finland 19
groups
(2) Hospital-specific
Netherlands Direct (no conversion) Not applicable
Poland Point value Nationwide
Portugal Base rate Hospital peer group
Spain (Catalonia) (1) Direct (no conversion)
(2) Base rate
(1) Not applicable
(2) Region-wide (CMS-DRGs)
Sweden Base rate County-specific

Adjustments to DRG-based hospital payment
Definition of outliers
(trimming method)
Outliers as % of total
cases
Outlier payment
Deductions/payments Surcharges
Austria LOS (interquartile) ~ 12–15 Per day Per day
England LOS (interquartile) 7No
(but short-stay tariff)Per day
Estonia Cost (parametric). 9 ? FFS
Finland Cost (parametric). 5 No FFS
France LOS (interquartile)0.4
Per day Per day
4
9 November 2011 20Chess Seminar | Helsinki, Finland
France LOS (interquartile)0.4
(public hospitals)Per day Per day
Germany LOS (parametric) 22 Per day Per day
Ireland LOS (parametric) 6 Per day Per day
Netherlands – – Not applicable Not applicable
Poland LOS (interquartile) ~ 2No
(but short-stay tariff)Per day
Portugal LOS (interquartile) – Per day Per day
Spain (Catalonia) LOS (interquartile) 5 No No
Sweden Cost/LOS (parametric) 5 Varies varies
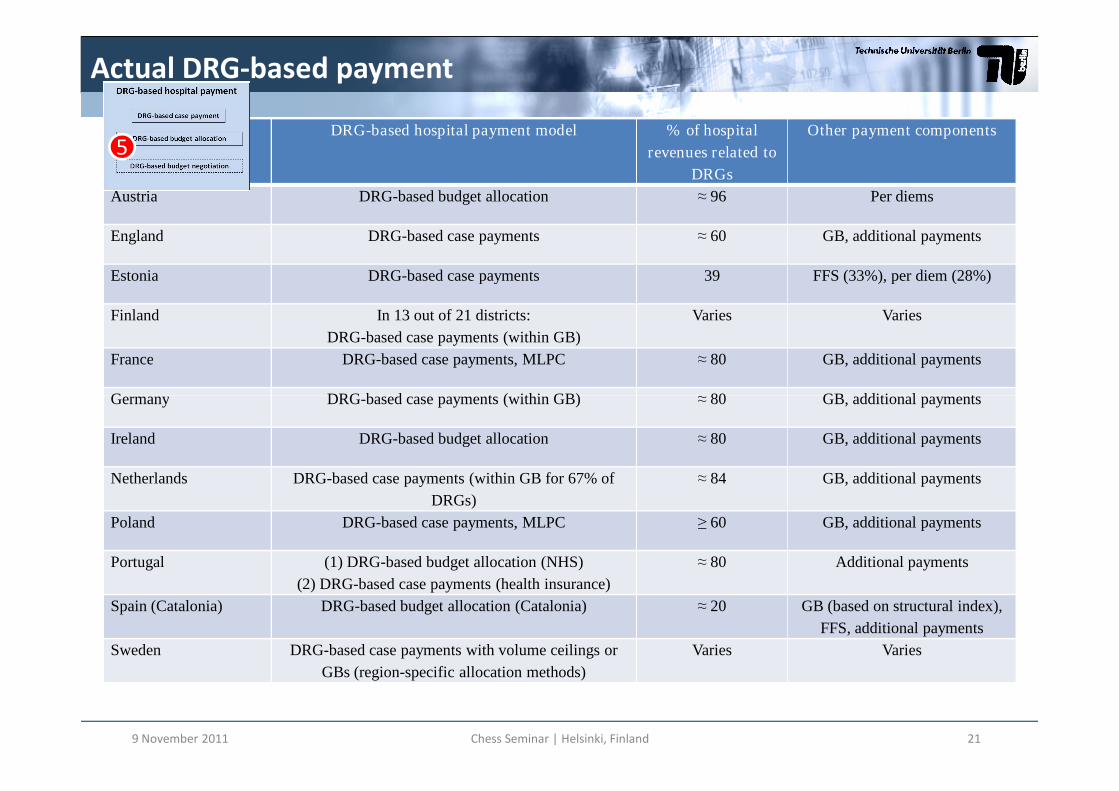
Actual DRG-based payment
Country DRG-based hospital payment model % of hospital
revenues related to
DRGs
Other payment components
Austria DRG-based budget allocation ≈ 96 Per diems
England DRG-based case payments ≈ 60 GB, additional payments
Estonia DRG-based case payments 39 FFS (33%), per diem (28%)
Finland In 13 out of 21 districts:
DRG-based case payments (within GB)
Varies Varies
France DRG-based case payments, MLPC ≈ 80 GB, additional payments
Germany DRG-based case payments (within GB) ≈ 80 GB, additional payments
5
9 November 2011 Chess Seminar | Helsinki, Finland 21
Germany DRG-based case payments (within GB) ≈ 80 GB, additional payments
Ireland DRG-based budget allocation ≈ 80 GB, additional payments
Netherlands DRG-based case payments (within GB for 67% of
DRGs)
≈ 84 GB, additional payments
Poland DRG-based case payments, MLPC ≥ 60 GB, additional payments
Portugal (1) DRG-based budget allocation (NHS)
(2) DRG-based case payments (health insurance)
≈ 80 Additional payments
Spain (Catalonia) DRG-based budget allocation (Catalonia) ≈ 20 GB (based on structural index),
FFS, additional payments
Sweden DRG-based case payments with volume ceilings or
GBs (region-specific allocation methods)
Varies Varies

DRG-based payment 1
Country DRG-based hospital payment model % of hospital
revenues related to
DRGs
Other payment components
Austria DRG-based budget allocation ≈ 96 Per diems
England DRG-based case payments ≈ 60 GB, additional payments
Estonia DRG-based case payments 39 FFS (33%), per diem (28%)
Finland In 13 out of 21 districts:
DRG-based case payments (within GB)
Varies Varies
France DRG-based case payments, MLPC ≈ 80 GB, additional payments
Germany DRG-based case payments (within GB) ≈ 80 GB, additional payments
5
9 November 2011 Chess Seminar | Helsinki, Finland 22
Germany DRG-based case payments (within GB) ≈ 80 GB, additional payments
Ireland DRG-based budget allocation ≈ 80 GB, additional payments
Netherlands DRG-based case payments (within GB for 67% of
DRGs)
≈ 84 GB, additional payments
Poland DRG-based case payments, MLPC ≥ 60 GB, additional payments
Portugal (1) DRG-based budget allocation (NHS)
(2) DRG-based case payments (health insurance)
≈ 80 Additional payments
Spain (Catalonia) DRG-based budget allocation (Catalonia) ≈ 20 GB (based on structural index),
FFS, additional payments
Sweden DRG-based case payments with volume ceilings or
GBs (region-specific allocation methods)
Varies Varies

Payments for infrastructure(e.g. buildings, expensive equipment)
Payments for non-patient care activities(e.g. teaching, research, emergency availability)
Payments for patients not classified into DRG system(e.g. outpatients, day cases, psychiatry, rehabilitation)
DRG-based payment 2: Mix of revenues
5
DRG-based case payments,DRG-based budget allocation
(possibly adjusted for outliers, quality, etc.)
Payments for patients not classified into DRG system(e.g. outpatients, day cases, psychiatry, rehabilitation)
Other types of payments for DRG-classified patients(e.g. global budgets, fee-for-service payments)
Additional payments for specific activities forDRG-classified patients (e.g. expensive drugs,innovations), possibly listed in DRG catalogues

Costs/revenues
Total costs
11 p̂R Deductions Surcharges
Inliers
4
Avoiding unintended consequences 1
LOS
1p̂R
Short-stayoutliers
Long-stayoutliers
Lower LOSthreshold
Upper LOSthreshold
shortp 1ˆ
9 November 2011 24Chess Seminar | Helsinki, Finland

Avoiding unintended consequences 2
Additional payments – selected countries
England France Germany Nether-lands
Payments perhospital stay
One One One Severalpossible
Payments for Unbundled Séances GHM for Supplementary NoPayments forspecific high-cost services
UnbundledHRGs for e.g.:• Chemotherapy•Radiotherapy•Renal dialysis•Diagnosticimaging•High-cost drugs
Séances GHM fore.g.:• Chemotherapy•Radiotherapy•Renal dialysis
Additionalpayments:• ICU• Emergency care• High-cost drugs
Supplementarypayments for e.g.:• Chemotherapy•Radiotherapy•Renal dialysis•Diagnostic imaging•High-cost drugs
No
Innovation-related add’lpayments
Yes Yes Yes Yes (fordrugs)
4

• England & Germany: no extra payment ifpatient readmitted within 30 days
• Germany: deduction for not submitting quality
Avoiding unintended consequences 3
Adjustments for Quality
• Germany: deduction for not submitting qualitydata
• England: up 1.5% reduction if qualitystandards are not met
• France: extra payments for qualityimprovement (e.g. regarding MRSA)
4

Avoiding unintended consequences 4
Country PCS Payment rate
Frequency of updates Time-lag to data Frequency of updates Time-lag to data
Austria Annual 2–4 years 4–5 years (updated when
necessary)
2–4 years
England Annual Minor revisions annually; irregular
overhauls about every 5–6 years
Annual 3 years (but adjusted for
inflation)
Estonia Irregular (first update
after 7 years)
1–2 years Annual 1–2 years
Finland Annual 1 year Annual 0–1 year
France Annual 1 year Annual 2 yearsFrance Annual 1 year Annual 2 years
Germany Annual 2 years Annual 2 years
Ireland Every 4 years Not applicable (imported
AR-DRGs)
Annual 1–2 years
Netherlands Irregular Not standardized Annual or when
considered necessary
2 years, or based on
negotiations
Poland Irregular – planned
twice per year
1 year Annual update only of
base rate
1 year
Portugal Irregular Not applicable (imported
AP-DRGs)
Irregular 2–3 years
Spain (Catalonia) Biennial Not applicable (imported
3-year-old
CMS-DRGs)
Annual 2–3 years
9 November 2011 Chess Seminar | Helsinki, Finland 27

Conclusions
• DRG-based hospital payment is the mainmethod of provider payment
• Countries have adjusted the systems to theirneeds on various dimensions
• To avoid unintended consequences:• To avoid unintended consequences:– DRG-based payment is operated together with
other payment mechanisms
– Outliers and and high cost services are reimbursedseparately
– DRG systems are continously refined (increasingnumber of groups)
9 November 2011 Chess Seminar | Helsinki, Finland 28

Thank you very much foryour time and attention!
All slides are available on:All slides are available on:www.mig.tu-berlin.de
29299 November 2011 Chess Seminar | Helsinki, Finland