DRE # Up-to-date data on crucial California real estate ...
1
Californians drop out of the labor force This chart shows California’s and the U.S. labor force participation (LFP) rate, the share of the population that is employed or unemployed and actively seeking employment. During the last decade of recovery, California’s LFP rate has remained below the U.S. average, never recovering from the 2008 recession. A further steep drop in the LFP rate occurred during the 2020 recession, to 59.8% in September 2020. Today’s declining LFP rate is a big reason why the unemployment rate has dropped quickly. When individuals drop out of the workforce they are no longer included in the unemployment count, giving a false impression of an improving jobs market. Real estate agents who watch the LFP rate, along with jobs numbers, will better understand the housing market than those who watch the misleading unemployment rate. Expect the LFP rate to remain at its present low level until the pandemic responses subside later in 2021 or early 2022. A second jobs recovery is needed to sustain the housing market This chart shows the number of jobs held in California each month. The gray bars indicate recessions. California employment continued to rise in October 2020, still down 1.4 million jobs from a year earlier following the historic job losses that took place in spring 2020. Jobs are now 8.3% below the December 2019 peak, an erasure of the past four years of job growth. Absent a second round of government stimulus to bolster consumer spending, expect to see more jobs lost in 2021 as businesses fail. With the expiration of foreclosure and eviction moratoriums that have kept jobless Californians housed in 2020, next year will see a flood of distressed sales and vacancies hit the market, outrunning buyer and tenant demand and pulling down home prices and rental rates. California home prices jump with low turnover and lower interest rates This chart shows home price movement averaged across California’s major metro areas. The blue line represents volatile low-tier price movement, the red line the mid-tier price movement and the green line shows the less volatile high-tier price movement. Home prices continued to inflate in September 2020. The most distortion was in the low tier, which experienced the largest gap between inventory and homebuyer demand. The statewide average for low-tier prices was 9% higher than a year earlier, as were mid-tier prices. High-tier prices were 8% higher than a year earlier. However, the forward trend for home prices will be down. Historic job losses and the growing shadow inventory of rising 90+ day mortgage delinquencies will lead to a wave of distressed sales when the foreclosure moratorium ends in 2021. Home prices are expected to fall in 2021 and bottom in 2023. Click on any chart for more informaon! DRE Licensing Courses • DRE Connuing Ed • NMLS Connuing Ed • Forms firsuesday.us / firsuesdayjournal.com / 951.781.7300 Analysis © RPI (Realty Publicaons, Inc.) Presented by Name Phone Email DRE # Up-to-date data on crucial California real estate trends from RPI (Realty Publicaons, Inc.) December 2020 • Vol. 10 • Issue 12 • 2020’s struggling jobs market foreshadows declining home prices in 2021
Transcript of DRE # Up-to-date data on crucial California real estate ...
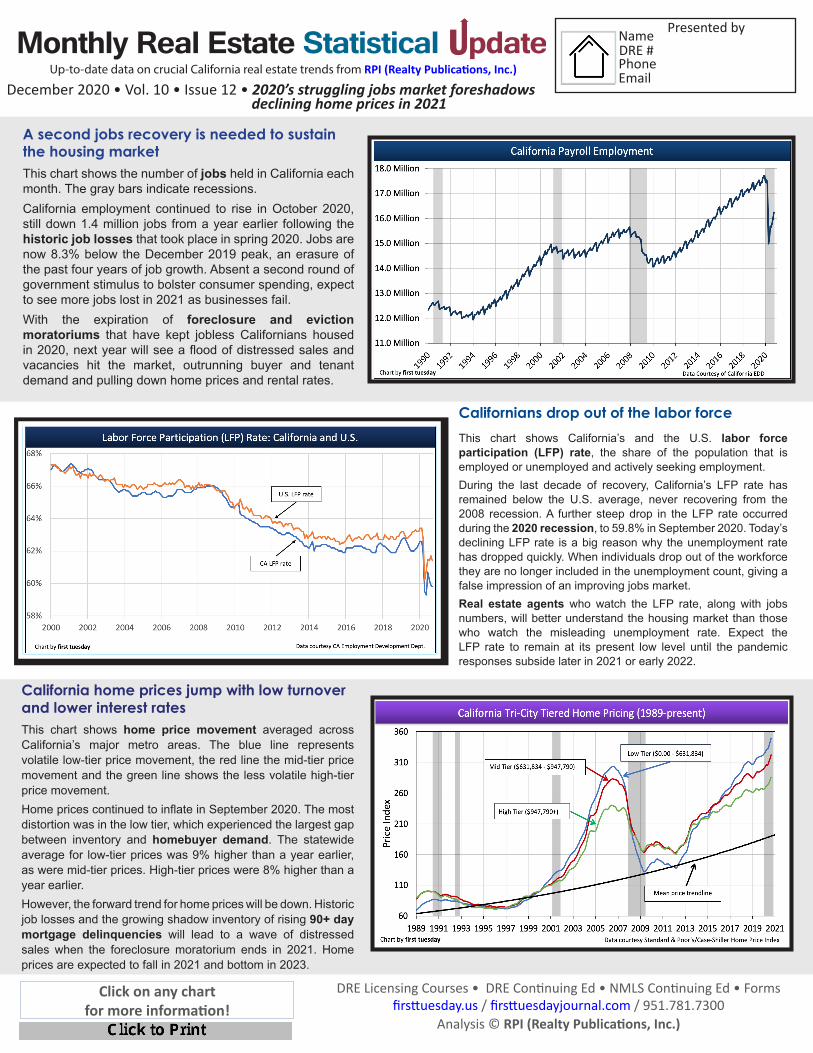
Californians drop out of the labor forceThis chart shows California’s and the U.S. labor force participation (LFP) rate, the share of the population that is employed or unemployed and actively seeking employment.During the last decade of recovery, California’s LFP rate has remained below the U.S. average, never recovering from the 2008 recession. A further steep drop in the LFP rate occurred during the 2020 recession, to 59.8% in September 2020. Today’s declining LFP rate is a big reason why the unemployment rate has dropped quickly. When individuals drop out of the workforce they are no longer included in the unemployment count, giving a false impression of an improving jobs market. Real estate agents who watch the LFP rate, along with jobs numbers, will better understand the housing market than those who watch the misleading unemployment rate. Expect the LFP rate to remain at its present low level until the pandemic responses subside later in 2021 or early 2022.
A second jobs recovery is needed to sustain the housing marketThis chart shows the number of jobs held in California each month. The gray bars indicate recessions.California employment continued to rise in October 2020, still down 1.4 million jobs from a year earlier following the historic job losses that took place in spring 2020. Jobs are now 8.3% below the December 2019 peak, an erasure of the past four years of job growth. Absent a second round of government stimulus to bolster consumer spending, expect to see more jobs lost in 2021 as businesses fail. With the expiration of foreclosure and eviction moratoriums that have kept jobless Californians housed in 2020, next year will see a flood of distressed sales and vacancies hit the market, outrunning buyer and tenant demand and pulling down home prices and rental rates.
California home prices jump with low turnover and lower interest ratesThis chart shows home price movement averaged across California’s major metro areas. The blue line represents volatile low-tier price movement, the red line the mid-tier price movement and the green line shows the less volatile high-tier price movement.Home prices continued to inflate in September 2020. The most distortion was in the low tier, which experienced the largest gap between inventory and homebuyer demand. The statewide average for low-tier prices was 9% higher than a year earlier, as were mid-tier prices. High-tier prices were 8% higher than a year earlier.However, the forward trend for home prices will be down. Historic job losses and the growing shadow inventory of rising 90+ day mortgage delinquencies will lead to a wave of distressed sales when the foreclosure moratorium ends in 2021. Home prices are expected to fall in 2021 and bottom in 2023.
Click on any chart for more information!
DRE Licensing Courses • DRE Continuing Ed • NMLS Continuing Ed • Formsfirsttuesday.us / firsttuesdayjournal.com / 951.781.7300
Analysis © RPI (Realty Publications, Inc.)
Presented byName
PhoneEmail
DRE #Up-to-date data on crucial California real estate trends from RPI (Realty Publications, Inc.)
December 2020 • Vol. 10 • Issue 12 • 2020’s struggling jobs market foreshadows declining home prices in 2021