DRAINAGE SUMMARY REPORT - Brookline, MA
108
Transcript of DRAINAGE SUMMARY REPORT - Brookline, MA


DRAINAGE SUMMARY REPORT
FOR PROPOSED MIXED-USE SITE DEVELOPMENT
500 HARVARD STREET, BROOKLINE, MA
PROPONENT:
ALLIED CAPITAL PROPERTIES
1368 BEACON STREET, SUITE 109
BROOKLINE, MA 02446
PREPARED BY:
ALLEN & MAJOR ASSOCIATES, INC.
100 COMMERCE WAY, SUITE 5
WOBURN, MA 01801
ISSUED: OCTOBER 13, 2020
REVISED: JANUARY 29, 2021
A&M PROJECT #2259-02


DRAINAGE SUMMARY REPORT
500 Harvard Street A&M Project # 2259-02
Brookline, MA October 13, 2020
Revised January 29, 2021
1-1
Section 1.0 Drainage Report
Table of Contents
SECTION 1.0 DRAINAGE REPORT .................................................................................................. 1-1
TABLE OF CONTENTS .......................................................................................................................... 1-1
LIST OF TABLES 1-1
• INTRODUCTION ............................................................................................................... 1-2
• SITE CATEGORIZATION FOR STORMWATER REGULATIONS .............................................. 1-2
• SITE LOCATION AND ACCESS .......................................................................................... 1-2
• EXISTING/PROPOSED SITE CONDITIONS .......................................................................... 1-2
• EXISTING SOIL CONDITIONS ........................................................................................... 1-3
• DRAINAGE ANALYSIS METHODOLOGY ........................................................................... 1-3
• PEAK RATE OF RUNOFF .................................................................................................. 1-3
• MA DEP STORMWATER PERFORMANCE STANDARDS ..................................................... 1-4
STANDARD #1: ............................................................................................................ 1-6
STANDARD #2: ............................................................................................................ 1-6
STANDARD #3: ............................................................................................................ 1-6
STANDARD #4: ............................................................................................................ 1-6
STANDARD #5: ............................................................................................................ 1-6
STANDARD #6: ............................................................................................................ 1-6
STANDARD #7: ............................................................................................................ 1-6
STANDARD #8: ............................................................................................................ 1-6
STANDARD #9: ............................................................................................................ 1-6
STANDARD #10: .......................................................................................................... 1-6
• MA DEP CHECKLIST FOR STORMWATER REPORTS ......................................................... 1-6
List of Tables
TABLE 1: STUDY POINT #1 (ON-SITE FLOW TO CATCH BASINS AND KENWOOD DRAINAGE SYSTEM) .... 1-3
TABLE 2: STUDY POINT #2 (OFF-SITE SHEET FLOW TO HARVARD STREET DRAINAGE SYSTEM) ............ 1-3


DRAINAGE SUMMARY REPORT
500 Harvard Street A&M Project # 2259-02
Brookline, MA October 13, 2020
Revised January 29, 2021
1-2
• INTRODUCTION
The purpose of this drainage summary report is to provide an overview of the proposed stormwater
management system for the proposed site development located at 500 Harvard Street, Brookline, MA.
The report will show by means of narrative, calculations, and exhibits that there is no increase in the peak
rates of runoff nor volumes from the site the at study point for all design storm events.
The site is currently developed and served as a former restaurant (Rubin’s Kosher Delicatessen). The
project proposes to raze the existing building and parking lot and construct a new residential multi-family
building. Site improvements include constructing a multi-story residential-use building (4,995± square
foot (s.f.) building footprint) with residential units and an on-site parking garage as well as site amenities
such as a fitness room and sidewalks.
• SITE CATEGORIZATION FOR STORMWATER REGULATIONS
The project is considered a new development under the MA DEP Stormwater Management Standards due
to the net increase in impervious area. The project has been designed to meet the performance standards
listed in 310 CMR 10.00 and further described in the Massachusetts Stormwater Handbook to the
maximum extent practicable. There is no alteration proposed nor any work proposed within any MA
DEP jurisdictional areas, so approval under the Massachusetts Wetlands Protection Act is not required.
• SITE LOCATION AND ACCESS
The property address is 500 Harvard Street, Brookline, MA 02446. The parcel is identified as Brookline
Parcel ID 072-01-00 and has a total land area of 6,969± square feet (0.16± acres). The site is a corner lot
with direct paved site access at curb cuts to Harvard Street and Kenwood Street.
• EXISTING/PROPOSED SITE CONDITIONS
The surface drainage flow was analyzed at two discharge points. Study Point #1 is the summation of a
portion of the site surface runoff directed to two catch basins on-site which discharge to an existing 12-
inch reinforced concrete drainage pipe near the intersection of Harvard Street and Kenwood Street, and
eventually to the municipal drainage system. Study point #2 is a discharge point just off-site where
surface runoff from the site which is not captured by the two catch basins on-site discharges to Harvard
Street and sheet flows east overland to a catch basin which is part of the Town of Brookline municipal
drainage system.
The existing site watershed is largely impervious. Only 1,113± square feet of the 6,969± square foot site
watershed is pervious, which is about 16% of the total site watershed. The site sheet flows towards two
existing catch basins on-site, and any runoff which leaves the site (such as that from landscaped areas
adjacent to Harvard Street) is captured by an existing catch basin located at a localized low-point near the
intersection of Harvard Street and Kenwood Street. The majority of the site stormwater runoff is captured
by the municipal drainage system that flows through the 12-inch drainage trunk line at the intersection of
Harvard Street and Kenwood Street (Study Point #1). The remainder of the site runoff directed to SP#2
flows overland to the east and is captured by an existing catch basin to the municipal drainage system in
Harvard Street.
The proposed site development increases the amount of imperious area within the watershed area. The
proposed watershed increases the impervious area by 638 square feet, or about 9.2% of the total site
watershed. Approximately 87% of the site is covered by the proposed building including the building
overhang. Roof stormwater is collected and discharges via a roof leader to a proposed drain manhole
above the 12-inch municipal drainage pipe in Harvard Street. The remaining site impervious area sheet
flows towards Harvard Street and Kenwood Street. The majority of site stormwater will continue to


DRAINAGE SUMMARY REPORT
500 Harvard Street A&M Project # 2259-02
Brookline, MA October 13, 2020
Revised January 29, 2021
1-3
discharge through the the 12-inch drainage trunk line at the intersection of Harvard Street and Kenwood
Street (Study Point #1). The remaining 406 s.f. is directed to SP#2.
• EXISTING SOIL CONDITIONS
For purposes of classifying the Hydrological Soil Group (HSG) the on-site soils were identified using the
USDA soil maps for Norfolk County. The site is shown entirely as soil type 628C – Canton-Urban land
complex. The drainage analysis uses HSG A for Canton-Urban land for both the existing and proposed
conditions. Test pits will be performed prior to construction.
A copy of the soil mapping is included in both the Appendix and Exhibits sections of this report.
• DRAINAGE ANALYSIS METHODOLOGY
A peak rate of runoff will be determined using techniques and data found in the following:
1. Urban Hydrology for Small Watersheds – Technical Release 55 by the United States Department
of Agriculture Soils Conservation Service, June 1986. Runoff curve numbers were obtained
from this reference.
2. HydroCAD© Stormwater Modeling System by HydroCAD Software Solutions LLC, version
10.00-26, 2020. The HydroCAD program was used to generate the runoff hydrographs for the
watershed areas, to determine discharge/stage/storage characteristics for the stormwater BMPs,
to perform drainage routing and to combine the results of the runoff hydrographs. HydroCAD
uses the TR-20 methodology of the SCS Unit Hydrograph procedure (SCS-UH).
3. Soil Survey of Middlesex County Massachusetts by United States Department of Agriculture,
NRCS. Soil types and boundaries were obtained from this reference.
• PEAK RATE OF RUNOFF
A storm water runoff analysis of the existing and proposed conditions includes an estimate of the peak
rate of runoff from various rainfall events. Peak runoff rates were developed using TR-55 Urban
Hydrology for Small Watersheds, developed by the U.S. Department of Commerce, Engineering Division
and the HydroCAD 10.00-26 computer program. Further, the analysis has been prepared in accordance
with the Town of Brookline requirements and standard engineering practices. The peak rate of runoff has
been estimated for each watershed during the 2, 10, 25, and 100-year storm events. The rainfall
intensities are based on the Technical Paper No. 40 (TP-40) rainfall values for Norfolk County, MA.
The stormwater runoff model shows that the proposed site development does not increase the rate nor volume of
runoff during all storm events at the point of analysis. The following table provides a summary of the estimated
peak rate and total runoff volume at the Study Point during each of the design storm events. The HydroCAD
worksheets are included in the following sections of this report.
Table 1: Study Point #1 (On-site Flow to Catch Basins and Kenwood Drainage System)
2-Year 10-Year 25-Year 100-Year
Existing Runoff (CFS) 0.35 0.59 0.71 0.90
Proposed Runoff (CFS) 0.27 0.40 0.49 0.89
PERCENT DECREASE 23.9% 32.2% 31.0% 1.1%
Existing Volume (CF) 1,092 1,850 2,266 2,898
Proposed Volume (CF) 1,008 1,772 2,184 2,805
PERCENT DECREASE 7.7% 4.2% 3.6% 3.2%


DRAINAGE SUMMARY REPORT
500 Harvard Street A&M Project # 2259-02
Brookline, MA October 13, 2020
Revised January 29, 2021
1-4
Table 2: Study Point #1 (Off-site Sheet Flow to Harvard Street Drainage System)
2-Year 10-Year 25-Year 100-Year
Existing Runoff (CFS) 0.03 0.04 0.05 0.06
Proposed Runoff (CFS) 0.03 0.04 0.05 0.06
PERCENT DECREASE 0% 0% 0% 0%
Existing Volume (CF) 101 153 180 221
Proposed Volume (CF) 100 151 178 219
PERCENT DECREASE 0.99% 1.3% 1.1% 0.90%
• MA DEP STORMWATER PERFORMANCE STANDARDS
The MA DEP Stormwater Management Policy was developed to improve water quality by implementing
performance standards for storm water management. The intent is to implement the stormwater
management standards through the review of filings by the issuing authority (Conservation Commission
or DEP). The following section outlines how the proposed Stormwater Management System meets the
standards set forth by the Policy.
BMP’s implemented in the design include:
Drain manholes with deep sumps
Subsurface infiltration chamber system with Isolator row
Temporary erosion and sedimentation controls will be incorporated into the construction phase of the
project. These temporary controls may include straw bale and/or silt fence barriers, inlet sediment traps,
diversion channels, and stabilized construction entrances as needed.
The Massachusetts Department of Environmental Protection has established ten (10) Stormwater
Management Standards. A project that meets or exceeds the standards is presumed to satisfy the
regulatory requirements regarding stormwater management. The Standards are as follows:
1. No new stormwater conveyances (e.g. outfalls) may discharge untreated stormwater directly to or
cause erosion in wetlands or waters of the Commonwealth.
2. Stormwater management systems shall be designed so that post-development peak discharge
rates do not exceed pre-development peak discharge rates. This Standard may be waived for
discharges to land subject to coastal storm flowage as defined in 310 CMR 10.04.
3. Loss of annual recharge to groundwater shall be eliminated or minimized through the use of
infiltration measures including environmentally sensitive site design, low impact development
techniques, stormwater best management practices, and good operation and maintenance. At a
minimum, the annual recharge from the post-development site shall approximate the annual
recharge from pre-development conditions based on soil type. This Standard is met when the
stormwater management system is designed to infiltrate the required recharge volume as
determined in accordance with the Massachusetts Stormwater Handbook.
4. Stormwater management systems shall be designed to remove 80% of the average annual post-
construction load of Total Suspended Solids (TSS). This Standard is met when:


DRAINAGE SUMMARY REPORT
500 Harvard Street A&M Project # 2259-02
Brookline, MA October 13, 2020
Revised January 29, 2021
1-5
a. Suitable practices for source control and pollution prevention are identified in a long-
term pollution prevention plan, and thereafter are implemented and maintained;
b. Structural stormwater best management practices are sized to capture the required
water quality volume determined in accordance with the Massachusetts Stormwater
Handbook; and
c. Pretreatment is provided in accordance with the Massachusetts Stormwater Handbook.
5. For land uses with higher potential pollutant loads, source control and pollution prevention shall
be implemented in accordance with the Massachusetts Stormwater Handbook to eliminate or reduce
the discharge of stormwater runoff from such land uses to the maximum extent practicable. If
through source control and/or pollution prevention all land uses with higher potential pollutant loads
cannot be completely protected from exposure to rain, snow, snow melt, and stormwater runoff, the
proponent shall use the specific structural stormwater BMPs determined by the Department to be
suitable for such uses as provided in the Massachusetts Stormwater Handbook. Stormwater
discharges from land uses with higher potential pollutant loads shall also comply with the
requirements of the Massachusetts Clean Waters Act, M.G.L. c. 21, §§ 26-53 and the regulations
promulgated thereunder at 314 CMR 3.00, 314 CMR 4.00 and 314 CMR 5.00.
6. Stormwater discharges within the Zone II or Interim Wellhead Protection Area of a public water
supply, and stormwater discharges near or to any other critical area, require the use of the specific
source control and pollution prevention measures and the specific structural stormwater best
management practices determined by the Department to be suitable for managing discharges to such
areas, as provided in the Massachusetts Stormwater Handbook. A discharge is near a critical area if
there is a strong likelihood of a significant impact occurring to said area, taking into account site-
specific factors. Stormwater discharges to Outstanding Resource Waters and Special Resource
Waters shall be removed and set back from the receiving water or wetland and receive the highest
and best practical method of treatment. A “storm water discharge” as defined in 314 CMR
3.04(2)(a)1 or (b) to an Outstanding Resource Water or Special Resource Water shall comply with
314 CMR 3.00 and 314 CMR 4.00. Stormwater discharges to a Zone I or Zone A are prohibited
unless essential to the operation of a public water supply.
7. A redevelopment project is required to meet the following Stormwater Management Standards
only to the maximum extent practicable: Standard 2, Standard 3, and the pretreatment and structural
best management practice requirements of Standards 4, 5, and 6. Existing stormwater discharges
shall comply with Standard 1 only to the maximum extent practicable. A redevelopment project shall
also comply with all other requirements of the Stormwater Management Standards and improve
existing conditions.
8. A plan to control construction-related impacts including erosion, sedimentation and other
pollutant sources during construction and land disturbance activities (construction period erosion,
sedimentation, and pollution prevention plan) shall be developed and implemented.
9. A long-term operation and maintenance plan shall be developed and implemented to ensure that
stormwater management systems function as designed.
10. All illicit discharges to the stormwater management system are prohibited.
The following calculations demonstrate that the proposed stormwater management system is in
compliance with the performance standards as outlined in the MA DEP Stormwater Management


DRAINAGE SUMMARY REPORT
500 Harvard Street A&M Project # 2259-02
Brookline, MA October 13, 2020
Revised January 29, 2021
1-6
Handbook.
STANDARD #1:
The proposed development will not introduce any new outfalls with direct discharge to a wetland area or
waters of the Commonwealth of Massachusetts.
STANDARD #2:
The proposed development has been designed so that the post-development peak discharge rates do not
exceed the predevelopment peak discharge rates. A summary of the existing and post-developed
discharge rates is included within this document (See page 1-3).
STANDARD #3:
Recharge is proposed on-site and calculations have been provided in the Appendix.
STANDARD #4:
The proposed stormwater management system has been designed to the maximum extent practical. Clean
building roof runoff makes up 87% of the site area. Clean roof runoff is captured and discharged to the
proposed subsurface infiltration system as well as the Brookline closed drainage system.
STANDARD #5:
The site is not considered a land use with higher potential pollutant loads (LUHPPL).
STANDARD #6:
The project site is not within a Zone II or ORW.
STANDARD #7:
The proposed project is considered a new development project due to the increase in impervious area over
existing conditions. The stormwater management system has been designed to meet the Standards as
outlined in the Massachusetts Stormwater Handbook.
STANDARD #8:
A plan to control construction-related impacts, including erosion, sedimentation and other pollutant
sources during construction and land disturbance activities will be developed.
STANDARD #9:
The project is considered a minor project under the Brookline Stormwater Management Article 8.26
General Bylaws as it disturbs less than one acre. At the discretion of the Brookline DPW, submission of
an operation and maintenance plan may be waived.
STANDARD #10:
There are no expected illicit discharges to the stormwater management system. The applicant will submit
the Illicit Discharge Compliance Statement prior to the discharge of stormwater runoff to the post-
construction stormwater best management practices and prior to the issuance of a Certificate of
Compliance.
• MA DEP CHECKLIST FOR STORMWATER REPORTS
See following pages.


1.1 - SW Checklist • 04/01/08 Stormwater Report Checklist • Page 1 of 8
Massachusetts Department of Environmental Protection Bureau of Resource Protection - Wetlands Program
Checklist for Stormwater Report
A. Introduction
Important: When filling out forms on the computer, use only the tab key to move your cursor - do not use the return key.
A Stormwater Report must be submitted with the Notice of Intent permit application to document compliance with the Stormwater Management Standards. The following checklist is NOT a substitute for the Stormwater Report (which should provide more substantive and detailed information) but is offered here as a tool to help the applicant organize their Stormwater Management documentation for their Report and for the reviewer to assess this information in a consistent format. As noted in the Checklist, the Stormwater Report must contain the engineering computations and supporting information set forth in Volume 3 of the Massachusetts Stormwater Handbook. The Stormwater Report must be prepared and certified by a Registered Professional Engineer (RPE) licensed in the Commonwealth. The Stormwater Report must include:
• The Stormwater Checklist completed and stamped by a Registered Professional Engineer (see page 2) that certifies that the Stormwater Report contains all required submittals.1 This Checklist is to be used as the cover for the completed Stormwater Report.
• Applicant/Project Name
• Project Address
• Name of Firm and Registered Professional Engineer that prepared the Report
• Long-Term Pollution Prevention Plan required by Standards 4-6 • Construction Period Pollution Prevention and Erosion and Sedimentation Control Plan required
by Standard 82
• Operation and Maintenance Plan required by Standard 9 In addition to all plans and supporting information, the Stormwater Report must include a brief narrative describing stormwater management practices, including environmentally sensitive site design and LID techniques, along with a diagram depicting runoff through the proposed BMP treatment train. Plans are required to show existing and proposed conditions, identify all wetland resource areas, NRCS soil types, critical areas, Land Uses with Higher Potential Pollutant Loads (LUHPPL), and any areas on the site where infiltration rate is greater than 2.4 inches per hour. The Plans shall identify the drainage areas for both existing and proposed conditions at a scale that enables verification of supporting calculations.
As noted in the Checklist, the Stormwater Management Report shall document compliance with each of the Stormwater Management Standards as provided in the Massachusetts Stormwater Handbook. The soils evaluation and calculations shall be done using the methodologies set forth in Volume 3 of the Massachusetts Stormwater Handbook. To ensure that the Stormwater Report is complete, applicants are required to fill in the Stormwater Report Checklist by checking the box to indicate that the specified information has been included in the Stormwater Report. If any of the information specified in the checklist has not been submitted, the applicant must provide an explanation. The completed Stormwater Report Checklist and Certification must be submitted with the Stormwater Report.
1 The Stormwater Report may also include the Illicit Discharge Compliance Statement required by Standard 10. If not included in the Stormwater Report, the Illicit Discharge Compliance Statement must be submitted prior to the discharge of stormwater runoff to the post-construction best management practices. 2 For some complex projects, it may not be possible to include the Construction Period Erosion and Sedimentation Control Plan in the Stormwater Report. In that event, the issuing authority has the discretion to issue an Order of Conditions that approves the project and includes a condition requiring the proponent to submit the Construction Period Erosion and Sedimentation Control Plan before commencing any land disturbance activity on the site.


1.1 - SW Checklist • 04/01/08 Stormwater Report Checklist • Page 3 of 8
Massachusetts Department of Environmental Protection Bureau of Resource Protection - Wetlands Program
Checklist for Stormwater Report
Checklist (continued)
LID Measures: Stormwater Standards require LID measures to be considered. Document what environmentally sensitive design and LID Techniques were considered during the planning and design of the project:
No disturbance to any Wetland Resource Areas
Site Design Practices (e.g. clustered development, reduced frontage setbacks)
Reduced Impervious Area (Redevelopment Only)
Minimizing disturbance to existing trees and shrubs
LID Site Design Credit Requested:
Credit 1
Credit 2
Credit 3
Use of “country drainage” versus curb and gutter conveyance and pipe
Bioretention Cells (includes Rain Gardens)
Constructed Stormwater Wetlands (includes Gravel Wetlands designs)
Treebox Filter
Water Quality Swale
Grass Channel
Green Roof
Other (describe):
Subsurface infiltration chamber system, manhole with deep sump
Standard 1: No New Untreated Discharges
No new untreated discharges
Outlets have been designed so there is no erosion or scour to wetlands and waters of the Commonwealth
Supporting calculations specified in Volume 3 of the Massachusetts Stormwater Handbook included.

1.1 - SW Checklist • 04/01/08 Stormwater Report Checklist • Page 4 of 8
Massachusetts Department of Environmental Protection Bureau of Resource Protection - Wetlands Program
Checklist for Stormwater Report
Checklist (continued)
Standard 2: Peak Rate Attenuation
Standard 2 waiver requested because the project is located in land subject to coastal storm flowage and stormwater discharge is to a wetland subject to coastal flooding.
Evaluation provided to determine whether off-site flooding increases during the 100-year 24-hour storm.
Calculations provided to show that post-development peak discharge rates do not exceed pre-
development rates for the 2-year and 10-year 24-hour storms. If evaluation shows that off-site flooding increases during the 100-year 24-hour storm, calculations are also provided to show that post-development peak discharge rates do not exceed pre-development rates for the 100-year 24-hour storm.
Standard 3: Recharge
Soil Analysis provided.
Required Recharge Volume calculation provided.
Required Recharge volume reduced through use of the LID site Design Credits.
Sizing the infiltration, BMPs is based on the following method: Check the method used.
Static Simple Dynamic Dynamic Field1
Runoff from all impervious areas at the site discharging to the infiltration BMP.
Runoff from all impervious areas at the site is not discharging to the infiltration BMP and calculations
are provided showing that the drainage area contributing runoff to the infiltration BMPs is sufficient to generate the required recharge volume.
Recharge BMPs have been sized to infiltrate the Required Recharge Volume.
Recharge BMPs have been sized to infiltrate the Required Recharge Volume only to the maximum extent practicable for the following reason:
Site is comprised solely of C and D soils and/or bedrock at the land surface
M.G.L. c. 21E sites pursuant to 310 CMR 40.0000
Solid Waste Landfill pursuant to 310 CMR 19.000
Project is otherwise subject to Stormwater Management Standards only to the maximum extent practicable.
Calculations showing that the infiltration BMPs will drain in 72 hours are provided.
Property includes a M.G.L. c. 21E site or a solid waste landfill and a mounding analysis is included.
1 80% TSS removal is required prior to discharge to infiltration BMP if Dynamic Field method is used.

1.1 - SW Checklist • 04/01/08 Stormwater Report Checklist • Page 5 of 8
Massachusetts Department of Environmental Protection Bureau of Resource Protection - Wetlands Program
Checklist for Stormwater Report
Checklist (continued)
Standard 3: Recharge (continued)
The infiltration BMP is used to attenuate peak flows during storms greater than or equal to the 10-
year 24-hour storm and separation to seasonal high groundwater is less than 4 feet and a mounding analysis is provided.
Documentation is provided showing that infiltration BMPs do not adversely impact nearby wetland resource areas.
Standard 4: Water Quality
The Long-Term Pollution Prevention Plan typically includes the following:
• Good housekeeping practices; • Provisions for storing materials and waste products inside or under cover;
• Vehicle washing controls;
• Requirements for routine inspections and maintenance of stormwater BMPs;
• Spill prevention and response plans; • Provisions for maintenance of lawns, gardens, and other landscaped areas;
• Requirements for storage and use of fertilizers, herbicides, and pesticides;
• Pet waste management provisions; • Provisions for operation and management of septic systems;
• Provisions for solid waste management;
• Snow disposal and plowing plans relative to Wetland Resource Areas;
• Winter Road Salt and/or Sand Use and Storage restrictions; • Street sweeping schedules;
• Provisions for prevention of illicit discharges to the stormwater management system;
• Documentation that Stormwater BMPs are designed to provide for shutdown and containment in the event of a spill or discharges to or near critical areas or from LUHPPL;
• Training for staff or personnel involved with implementing Long-Term Pollution Prevention Plan;
• List of Emergency contacts for implementing Long-Term Pollution Prevention Plan.
A Long-Term Pollution Prevention Plan is attached to Stormwater Report and is included as an attachment to the Wetlands Notice of Intent.
Treatment BMPs subject to the 44% TSS removal pretreatment requirement and the one inch rule for calculating the water quality volume are included, and discharge:
is within the Zone II or Interim Wellhead Protection Area
is near or to other critical areas
is within soils with a rapid infiltration rate (greater than 2.4 inches per hour)
involves runoff from land uses with higher potential pollutant loads.
The Required Water Quality Volume is reduced through use of the LID site Design Credits.
Calculations documenting that the treatment train meets the 80% TSS removal requirement and, if applicable, the 44% TSS removal pretreatment requirement, are provided.

1.1 - SW Checklist • 04/01/08 Stormwater Report Checklist • Page 6 of 8
Massachusetts Department of Environmental Protection Bureau of Resource Protection - Wetlands Program
Checklist for Stormwater Report
Checklist (continued)
Standard 4: Water Quality (continued)
The BMP is sized (and calculations provided) based on:
The ½” or 1” Water Quality Volume or
The equivalent flow rate associated with the Water Quality Volume and documentation is provided showing that the BMP treats the required water quality volume.
The applicant proposes to use proprietary BMPs, and documentation supporting use of proprietary
BMP and proposed TSS removal rate is provided. This documentation may be in the form of the propriety BMP checklist found in Volume 2, Chapter 4 of the Massachusetts Stormwater Handbook and submitting copies of the TARP Report, STEP Report, and/or other third party studies verifying performance of the proprietary BMPs.
A TMDL exists that indicates a need to reduce pollutants other than TSS and documentation showing
that the BMPs selected are consistent with the TMDL is provided.
Standard 5: Land Uses With Higher Potential Pollutant Loads (LUHPPLs)
The NPDES Multi-Sector General Permit covers the land use and the Stormwater Pollution
Prevention Plan (SWPPP) has been included with the Stormwater Report.
The NPDES Multi-Sector General Permit covers the land use and the SWPPP will be submitted prior
to the discharge of stormwater to the post-construction stormwater BMPs.
The NPDES Multi-Sector General Permit does not cover the land use.
LUHPPLs are located at the site and industry specific source control and pollution prevention measures have been proposed to reduce or eliminate the exposure of LUHPPLs to rain, snow, snow melt and runoff, and been included in the long term Pollution Prevention Plan.
All exposure has been eliminated.
All exposure has not been eliminated and all BMPs selected are on MassDEP LUHPPL list.
The LUHPPL has the potential to generate runoff with moderate to higher concentrations of oil and grease (e.g. all parking lots with >1000 vehicle trips per day) and the treatment train includes an oil grit separator, a filtering bioretention area, a sand filter or equivalent.
Standard 6: Critical Areas
The discharge is near or to a critical area and the treatment train includes only BMPs that MassDEP
has approved for stormwater discharges to or near that particular class of critical area.
Critical areas and BMPs are identified in the Stormwater Report.

1.1 - SW Checklist • 04/01/08 Stormwater Report Checklist • Page 7 of 8
Massachusetts Department of Environmental Protection Bureau of Resource Protection - Wetlands Program
Checklist for Stormwater Report
Checklist (continued)
Standard 7: Redevelopments and Other Projects Subject to the Standards only to the maximum extent practicable
The project is subject to the Stormwater Management Standards only to the maximum Extent
Practicable as a:
Limited Project
Small Residential Projects: 5-9 single family houses or 5-9 units in a multi-family development
provided there is no discharge that may potentially affect a critical area.
Small Residential Projects: 2-4 single family houses or 2-4 units in a multi-family development with a discharge to a critical area
Marina and/or boatyard provided the hull painting, service and maintenance areas are protected
from exposure to rain, snow, snow melt and runoff
Bike Path and/or Foot Path
Redevelopment Project
Redevelopment portion of mix of new and redevelopment.
Certain standards are not fully met (Standard No. 1, 8, 9, and 10 must always be fully met) and an
explanation of why these standards are not met is contained in the Stormwater Report.
The project involves redevelopment and a description of all measures that have been taken to
improve existing conditions is provided in the Stormwater Report. The redevelopment checklist found in Volume 2 Chapter 3 of the Massachusetts Stormwater Handbook may be used to document that the proposed stormwater management system (a) complies with Standards 2, 3 and the pretreatment and structural BMP requirements of Standards 4-6 to the maximum extent practicable and (b) improves existing conditions.
Standard 8: Construction Period Pollution Prevention and Erosion and Sedimentation Control
A Construction Period Pollution Prevention and Erosion and Sedimentation Control Plan must include the following information:
• Narrative; • Construction Period Operation and Maintenance Plan;
• Names of Persons or Entity Responsible for Plan Compliance;
• Construction Period Pollution Prevention Measures; • Erosion and Sedimentation Control Plan Drawings;
• Detail drawings and specifications for erosion control BMPs, including sizing calculations;
• Vegetation Planning;
• Site Development Plan; • Construction Sequencing Plan;
• Sequencing of Erosion and Sedimentation Controls;
• Operation and Maintenance of Erosion and Sedimentation Controls; • Inspection Schedule;
• Maintenance Schedule;
• Inspection and Maintenance Log Form.
A Construction Period Pollution Prevention and Erosion and Sedimentation Control Plan containing
the information set forth above has been included in the Stormwater Report.

1.1 - SW Checklist • 04/01/08 Stormwater Report Checklist • Page 8 of 8
Massachusetts Department of Environmental Protection Bureau of Resource Protection - Wetlands Program
Checklist for Stormwater Report
Checklist (continued)
Standard 8: Construction Period Pollution Prevention and Erosion and Sedimentation Control (continued)
The project is highly complex and information is included in the Stormwater Report that explains why it is not possible to submit the Construction Period Pollution Prevention and Erosion and Sedimentation Control Plan with the application. A Construction Period Pollution Prevention and Erosion and Sedimentation Control has not been included in the Stormwater Report but will be submitted before land disturbance begins.
The project is not covered by a NPDES Construction General Permit.
The project is covered by a NPDES Construction General Permit and a copy of the SWPPP is in the
Stormwater Report.
The project is covered by a NPDES Construction General Permit but no SWPPP been submitted.
The SWPPP will be submitted BEFORE land disturbance begins.
Standard 9: Operation and Maintenance Plan
The Post Construction Operation and Maintenance Plan is included in the Stormwater Report and
includes the following information:
Name of the stormwater management system owners;
Party responsible for operation and maintenance;
Schedule for implementation of routine and non-routine maintenance tasks;
Plan showing the location of all stormwater BMPs maintenance access areas;
Description and delineation of public safety features;
Estimated operation and maintenance budget; and
Operation and Maintenance Log Form.
The responsible party is not the owner of the parcel where the BMP is located and the Stormwater
Report includes the following submissions:
A copy of the legal instrument (deed, homeowner’s association, utility trust or other legal entity) that establishes the terms of and legal responsibility for the operation and maintenance of the project site stormwater BMPs;
A plan and easement deed that allows site access for the legal entity to operate and maintain
BMP functions.
Standard 10: Prohibition of Illicit Discharges
The Long-Term Pollution Prevention Plan includes measures to prevent illicit discharges;
An Illicit Discharge Compliance Statement is attached;
NO Illicit Discharge Compliance Statement is attached but will be submitted prior to the discharge of
any stormwater to post-construction BMPs.


Section 2.0 Existing HydroCAD Report
2 HYDROCAD WORKSHEETS .................................... EXISTING CONDITIONS


E-1
Existing Site Runoff to Catch Basins On-site
and Drainage in Kenwood
E-2
Sheet Flow Off-Site to Harvard St Drainage
E-SP-1
Municipal Drainage at Kenwood St.
E-SP-2
Municipal Drainage at Hrvard St.
Routing Diagram for Existing HCAD - 500 HarvardPrepared by Microsoft, Printed 1/28/2021
HydroCAD® 10.00-26 s/n 02881 © 2020 HydroCAD Software Solutions LLC
Subcat Reach Pond Link
Existing HCAD - 500 Harvard Printed 1/28/2021Prepared by Microsoft
Page 2HydroCAD® 10.00-26 s/n 02881 © 2020 HydroCAD Software Solutions LLC
Area Listing (all nodes)
Area
(sq-ft)
CN Description
(subcatchment-numbers)
1,113 39 >75% Grass cover, Good, HSG A (E-1)
3,530 98 Unconnected pavement, HSG A (E-1, E-2)
2,326 98 Unconnected roofs, HSG A (E-1)
6,969 89 TOTAL AREA

Existing HCAD - 500 Harvard Printed 1/28/2021Prepared by Microsoft
Page 3HydroCAD® 10.00-26 s/n 02881 © 2020 HydroCAD Software Solutions LLC
Soil Listing (all nodes)
Area
(sq-ft)
Soil
Group
Subcatchment
Numbers
6,969 HSG A E-1, E-2
0 HSG B
0 HSG C
0 HSG D
0 Other
6,969 TOTAL AREA
Existing HCAD - 500 Harvard Printed 1/28/2021Prepared by Microsoft
Page 4HydroCAD® 10.00-26 s/n 02881 © 2020 HydroCAD Software Solutions LLC
Ground Covers (all nodes)
HSG-A
(sq-ft)
HSG-B
(sq-ft)
HSG-C
(sq-ft)
HSG-D
(sq-ft)
Other
(sq-ft)
Total
(sq-ft)
Ground
Cover
Subcatchment
Numbers
1,113 0 0 0 0 1,113 >75% Grass cover,
Good
3,530 0 0 0 0 3,530 Unconnected
pavement
2,326 0 0 0 0 2,326 Unconnected roofs
6,969 0 0 0 0 6,969 TOTAL AREA

Type III 24-hr 2-Year Rainfall=3.20"Existing HCAD - 500 Harvard Printed 1/28/2021Prepared by Microsoft
Page 5HydroCAD® 10.00-26 s/n 02881 © 2020 HydroCAD Software Solutions LLC
Summary for Subcatchment E-1: Existing Site Runoff to Catch Basins On-site and Drainage in Kenwood
Runoff = 0.35 cfs @ 12.09 hrs, Volume= 1,092 cf, Depth= 2.00"
Runoff by SCS TR-20 method, UH=SCS, Weighted-CN, Time Span= 0.00-36.00 hrs, dt= 0.01 hrsType III 24-hr 2-Year Rainfall=3.20"
Area (sf) CN Description
1,113 39 >75% Grass cover, Good, HSG A2,326 98 Unconnected roofs, HSG A3,120 98 Unconnected pavement, HSG A
6,559 88 Weighted Average1,113 16.97% Pervious Area5,446 83.03% Impervious Area5,446 100.00% Unconnected
Tc Length Slope Velocity Capacity Description(min) (feet) (ft/ft) (ft/sec) (cfs)
6.0 Direct Entry, Direct Entry Tc
Subcatchment E-1: Existing Site Runoff to Catch Basins On-site and Drainage in Kenwood
Runoff
Hydrograph
Time (hours)3635343332313029282726252423222120191817161514131211109876543210
Flo
w (c
fs)
0.38
0.36
0.34
0.32
0.3
0.28
0.26
0.24
0.22
0.2
0.18
0.16
0.14
0.12
0.1
0.08
0.06
0.04
0.02
0
Type III 24-hr
2-Year Rainfall=3.20"
Runoff Area=6,559 sf
Runoff Volume=1,092 cf
Runoff Depth=2.00"
Tc=6.0 min
CN=88
0.35 cfs
Type III 24-hr 2-Year Rainfall=3.20"Existing HCAD - 500 Harvard Printed 1/28/2021Prepared by Microsoft
Page 6HydroCAD® 10.00-26 s/n 02881 © 2020 HydroCAD Software Solutions LLC
Summary for Subcatchment E-2: Sheet Flow Off-Site to Harvard St Drainage
Runoff = 0.03 cfs @ 12.08 hrs, Volume= 101 cf, Depth= 2.97"
Runoff by SCS TR-20 method, UH=SCS, Weighted-CN, Time Span= 0.00-36.00 hrs, dt= 0.01 hrsType III 24-hr 2-Year Rainfall=3.20"
Area (sf) CN Description
410 98 Unconnected pavement, HSG A
410 100.00% Impervious Area410 100.00% Unconnected
Tc Length Slope Velocity Capacity Description(min) (feet) (ft/ft) (ft/sec) (cfs)
6.0 Direct Entry, Direct Entry
Subcatchment E-2: Sheet Flow Off-Site to Harvard St Drainage
Runoff
Hydrograph
Time (hours)3635343332313029282726252423222120191817161514131211109876543210
Flo
w (c
fs)
0.032
0.03
0.028
0.026
0.024
0.022
0.02
0.018
0.016
0.014
0.012
0.01
0.008
0.006
0.004
0.002
0
Type III 24-hr
2-Year Rainfall=3.20"
Runoff Area=410 sf
Runoff Volume=101 cf
Runoff Depth=2.97"
Tc=6.0 min
CN=98
0.03 cfs

Type III 24-hr 2-Year Rainfall=3.20"Existing HCAD - 500 Harvard Printed 1/28/2021Prepared by Microsoft
Page 7HydroCAD® 10.00-26 s/n 02881 © 2020 HydroCAD Software Solutions LLC
Summary for Reach E-SP-1: Municipal Drainage at Kenwood St.
Inflow Area = 6,559 sf, 83.03% Impervious, Inflow Depth = 2.00" for 2-Year eventInflow = 0.35 cfs @ 12.09 hrs, Volume= 1,092 cfOutflow = 0.35 cfs @ 12.09 hrs, Volume= 1,092 cf, Atten= 0%, Lag= 0.0 min
Routing by Stor-Ind+Trans method, Time Span= 0.00-36.00 hrs, dt= 0.01 hrs
Reach E-SP-1: Municipal Drainage at Kenwood St.
InflowOutflow
Hydrograph
Time (hours)3635343332313029282726252423222120191817161514131211109876543210
Flo
w (c
fs)
0.38
0.36
0.34
0.32
0.3
0.28
0.26
0.24
0.22
0.2
0.18
0.16
0.14
0.12
0.1
0.08
0.06
0.04
0.02
0
Inflow Area=6,559 sf0.35 cfs
0.35 cfs
Type III 24-hr 2-Year Rainfall=3.20"Existing HCAD - 500 Harvard Printed 1/28/2021Prepared by Microsoft
Page 8HydroCAD® 10.00-26 s/n 02881 © 2020 HydroCAD Software Solutions LLC
Summary for Reach E-SP-2: Municipal Drainage at Hrvard St.
Inflow Area = 410 sf,100.00% Impervious, Inflow Depth = 2.97" for 2-Year eventInflow = 0.03 cfs @ 12.08 hrs, Volume= 101 cfOutflow = 0.03 cfs @ 12.08 hrs, Volume= 101 cf, Atten= 0%, Lag= 0.0 min
Routing by Stor-Ind+Trans method, Time Span= 0.00-36.00 hrs, dt= 0.01 hrs
Reach E-SP-2: Municipal Drainage at Hrvard St.
InflowOutflow
Hydrograph
Time (hours)3635343332313029282726252423222120191817161514131211109876543210
Flo
w (c
fs)
0.032
0.03
0.028
0.026
0.024
0.022
0.02
0.018
0.016
0.014
0.012
0.01
0.008
0.006
0.004
0.002
0
Inflow Area=410 sf0.03 cfs
0.03 cfs

Type III 24-hr 10-Year Rainfall=4.70"Existing HCAD - 500 Harvard Printed 1/28/2021Prepared by Microsoft
Page 9HydroCAD® 10.00-26 s/n 02881 © 2020 HydroCAD Software Solutions LLC
Summary for Subcatchment E-1: Existing Site Runoff to Catch Basins On-site and Drainage in Kenwood
Runoff = 0.59 cfs @ 12.09 hrs, Volume= 1,850 cf, Depth= 3.38"
Runoff by SCS TR-20 method, UH=SCS, Weighted-CN, Time Span= 0.00-36.00 hrs, dt= 0.01 hrsType III 24-hr 10-Year Rainfall=4.70"
Area (sf) CN Description
1,113 39 >75% Grass cover, Good, HSG A2,326 98 Unconnected roofs, HSG A3,120 98 Unconnected pavement, HSG A
6,559 88 Weighted Average1,113 16.97% Pervious Area5,446 83.03% Impervious Area5,446 100.00% Unconnected
Tc Length Slope Velocity Capacity Description(min) (feet) (ft/ft) (ft/sec) (cfs)
6.0 Direct Entry, Direct Entry Tc
Subcatchment E-1: Existing Site Runoff to Catch Basins On-site and Drainage in Kenwood
Runoff
Hydrograph
Time (hours)3635343332313029282726252423222120191817161514131211109876543210
Flo
w (c
fs)
0.65
0.6
0.55
0.5
0.45
0.4
0.35
0.3
0.25
0.2
0.15
0.1
0.05
0
Type III 24-hr
10-Year Rainfall=4.70"
Runoff Area=6,559 sf
Runoff Volume=1,850 cf
Runoff Depth=3.38"
Tc=6.0 min
CN=88
0.59 cfs
Type III 24-hr 10-Year Rainfall=4.70"Existing HCAD - 500 Harvard Printed 1/28/2021Prepared by Microsoft
Page 10HydroCAD® 10.00-26 s/n 02881 © 2020 HydroCAD Software Solutions LLC
Summary for Subcatchment E-2: Sheet Flow Off-Site to Harvard St Drainage
Runoff = 0.04 cfs @ 12.08 hrs, Volume= 153 cf, Depth= 4.46"
Runoff by SCS TR-20 method, UH=SCS, Weighted-CN, Time Span= 0.00-36.00 hrs, dt= 0.01 hrsType III 24-hr 10-Year Rainfall=4.70"
Area (sf) CN Description
410 98 Unconnected pavement, HSG A
410 100.00% Impervious Area410 100.00% Unconnected
Tc Length Slope Velocity Capacity Description(min) (feet) (ft/ft) (ft/sec) (cfs)
6.0 Direct Entry, Direct Entry
Subcatchment E-2: Sheet Flow Off-Site to Harvard St Drainage
Runoff
Hydrograph
Time (hours)3635343332313029282726252423222120191817161514131211109876543210
Flo
w (c
fs)
0.048
0.046
0.044
0.042
0.04
0.038
0.036
0.034
0.032
0.03
0.028
0.026
0.024
0.022
0.02
0.018
0.016
0.014
0.012
0.01
0.008
0.006
0.004
0.002
0
Type III 24-hr
10-Year Rainfall=4.70"
Runoff Area=410 sf
Runoff Volume=153 cf
Runoff Depth=4.46"
Tc=6.0 min
CN=98
0.04 cfs

Type III 24-hr 10-Year Rainfall=4.70"Existing HCAD - 500 Harvard Printed 1/28/2021Prepared by Microsoft
Page 11HydroCAD® 10.00-26 s/n 02881 © 2020 HydroCAD Software Solutions LLC
Summary for Reach E-SP-1: Municipal Drainage at Kenwood St.
Inflow Area = 6,559 sf, 83.03% Impervious, Inflow Depth = 3.38" for 10-Year eventInflow = 0.59 cfs @ 12.09 hrs, Volume= 1,850 cfOutflow = 0.59 cfs @ 12.09 hrs, Volume= 1,850 cf, Atten= 0%, Lag= 0.0 min
Routing by Stor-Ind+Trans method, Time Span= 0.00-36.00 hrs, dt= 0.01 hrs
Reach E-SP-1: Municipal Drainage at Kenwood St.
InflowOutflow
Hydrograph
Time (hours)3635343332313029282726252423222120191817161514131211109876543210
Flo
w (c
fs)
0.65
0.6
0.55
0.5
0.45
0.4
0.35
0.3
0.25
0.2
0.15
0.1
0.05
0
Inflow Area=6,559 sf0.59 cfs
0.59 cfs
Type III 24-hr 10-Year Rainfall=4.70"Existing HCAD - 500 Harvard Printed 1/28/2021Prepared by Microsoft
Page 12HydroCAD® 10.00-26 s/n 02881 © 2020 HydroCAD Software Solutions LLC
Summary for Reach E-SP-2: Municipal Drainage at Hrvard St.
Inflow Area = 410 sf,100.00% Impervious, Inflow Depth = 4.46" for 10-Year eventInflow = 0.04 cfs @ 12.08 hrs, Volume= 153 cfOutflow = 0.04 cfs @ 12.08 hrs, Volume= 153 cf, Atten= 0%, Lag= 0.0 min
Routing by Stor-Ind+Trans method, Time Span= 0.00-36.00 hrs, dt= 0.01 hrs
Reach E-SP-2: Municipal Drainage at Hrvard St.
InflowOutflow
Hydrograph
Time (hours)3635343332313029282726252423222120191817161514131211109876543210
Flo
w (c
fs)
0.045
0.04
0.035
0.03
0.025
0.02
0.015
0.01
0.005
0
Inflow Area=410 sf0.04 cfs
0.04 cfs

Type III 24-hr 25-Year Rainfall=5.50"Existing HCAD - 500 Harvard Printed 1/28/2021Prepared by Microsoft
Page 13HydroCAD® 10.00-26 s/n 02881 © 2020 HydroCAD Software Solutions LLC
Summary for Subcatchment E-1: Existing Site Runoff to Catch Basins On-site and Drainage in Kenwood
Runoff = 0.71 cfs @ 12.09 hrs, Volume= 2,266 cf, Depth= 4.15"
Runoff by SCS TR-20 method, UH=SCS, Weighted-CN, Time Span= 0.00-36.00 hrs, dt= 0.01 hrsType III 24-hr 25-Year Rainfall=5.50"
Area (sf) CN Description
1,113 39 >75% Grass cover, Good, HSG A2,326 98 Unconnected roofs, HSG A3,120 98 Unconnected pavement, HSG A
6,559 88 Weighted Average1,113 16.97% Pervious Area5,446 83.03% Impervious Area5,446 100.00% Unconnected
Tc Length Slope Velocity Capacity Description(min) (feet) (ft/ft) (ft/sec) (cfs)
6.0 Direct Entry, Direct Entry Tc
Subcatchment E-1: Existing Site Runoff to Catch Basins On-site and Drainage in Kenwood
Runoff
Hydrograph
Time (hours)3635343332313029282726252423222120191817161514131211109876543210
Flo
w (c
fs)
0.75
0.7
0.65
0.6
0.55
0.5
0.45
0.4
0.35
0.3
0.25
0.2
0.15
0.1
0.05
0
Type III 24-hr
25-Year Rainfall=5.50"
Runoff Area=6,559 sf
Runoff Volume=2,266 cf
Runoff Depth=4.15"
Tc=6.0 min
CN=88
0.71 cfs
Type III 24-hr 25-Year Rainfall=5.50"Existing HCAD - 500 Harvard Printed 1/28/2021Prepared by Microsoft
Page 14HydroCAD® 10.00-26 s/n 02881 © 2020 HydroCAD Software Solutions LLC
Summary for Subcatchment E-2: Sheet Flow Off-Site to Harvard St Drainage
Runoff = 0.05 cfs @ 12.08 hrs, Volume= 180 cf, Depth= 5.26"
Runoff by SCS TR-20 method, UH=SCS, Weighted-CN, Time Span= 0.00-36.00 hrs, dt= 0.01 hrsType III 24-hr 25-Year Rainfall=5.50"
Area (sf) CN Description
410 98 Unconnected pavement, HSG A
410 100.00% Impervious Area410 100.00% Unconnected
Tc Length Slope Velocity Capacity Description(min) (feet) (ft/ft) (ft/sec) (cfs)
6.0 Direct Entry, Direct Entry
Subcatchment E-2: Sheet Flow Off-Site to Harvard St Drainage
Runoff
Hydrograph
Time (hours)3635343332313029282726252423222120191817161514131211109876543210
Flo
w (c
fs)
0.055
0.05
0.045
0.04
0.035
0.03
0.025
0.02
0.015
0.01
0.005
0
Type III 24-hr
25-Year Rainfall=5.50"
Runoff Area=410 sf
Runoff Volume=180 cf
Runoff Depth=5.26"
Tc=6.0 min
CN=98
0.05 cfs

Type III 24-hr 25-Year Rainfall=5.50"Existing HCAD - 500 Harvard Printed 1/28/2021Prepared by Microsoft
Page 15HydroCAD® 10.00-26 s/n 02881 © 2020 HydroCAD Software Solutions LLC
Summary for Reach E-SP-1: Municipal Drainage at Kenwood St.
Inflow Area = 6,559 sf, 83.03% Impervious, Inflow Depth = 4.15" for 25-Year eventInflow = 0.71 cfs @ 12.09 hrs, Volume= 2,266 cfOutflow = 0.71 cfs @ 12.09 hrs, Volume= 2,266 cf, Atten= 0%, Lag= 0.0 min
Routing by Stor-Ind+Trans method, Time Span= 0.00-36.00 hrs, dt= 0.01 hrs
Reach E-SP-1: Municipal Drainage at Kenwood St.
InflowOutflow
Hydrograph
Time (hours)3635343332313029282726252423222120191817161514131211109876543210
Flo
w (c
fs)
0.75
0.7
0.65
0.6
0.55
0.5
0.45
0.4
0.35
0.3
0.25
0.2
0.15
0.1
0.05
0
Inflow Area=6,559 sf0.71 cfs
0.71 cfs
Type III 24-hr 25-Year Rainfall=5.50"Existing HCAD - 500 Harvard Printed 1/28/2021Prepared by Microsoft
Page 16HydroCAD® 10.00-26 s/n 02881 © 2020 HydroCAD Software Solutions LLC
Summary for Reach E-SP-2: Municipal Drainage at Hrvard St.
Inflow Area = 410 sf,100.00% Impervious, Inflow Depth = 5.26" for 25-Year eventInflow = 0.05 cfs @ 12.08 hrs, Volume= 180 cfOutflow = 0.05 cfs @ 12.08 hrs, Volume= 180 cf, Atten= 0%, Lag= 0.0 min
Routing by Stor-Ind+Trans method, Time Span= 0.00-36.00 hrs, dt= 0.01 hrs
Reach E-SP-2: Municipal Drainage at Hrvard St.
InflowOutflow
Hydrograph
Time (hours)3635343332313029282726252423222120191817161514131211109876543210
Flo
w (c
fs)
0.055
0.05
0.045
0.04
0.035
0.03
0.025
0.02
0.015
0.01
0.005
0
Inflow Area=410 sf0.05 cfs
0.05 cfs

Type III 24-hr 100-Year Rainfall=6.70"Existing HCAD - 500 Harvard Printed 1/28/2021Prepared by Microsoft
Page 17HydroCAD® 10.00-26 s/n 02881 © 2020 HydroCAD Software Solutions LLC
Summary for Subcatchment E-1: Existing Site Runoff to Catch Basins On-site and Drainage in Kenwood
Runoff = 0.90 cfs @ 12.08 hrs, Volume= 2,898 cf, Depth= 5.30"
Runoff by SCS TR-20 method, UH=SCS, Weighted-CN, Time Span= 0.00-36.00 hrs, dt= 0.01 hrsType III 24-hr 100-Year Rainfall=6.70"
Area (sf) CN Description
1,113 39 >75% Grass cover, Good, HSG A2,326 98 Unconnected roofs, HSG A3,120 98 Unconnected pavement, HSG A
6,559 88 Weighted Average1,113 16.97% Pervious Area5,446 83.03% Impervious Area5,446 100.00% Unconnected
Tc Length Slope Velocity Capacity Description(min) (feet) (ft/ft) (ft/sec) (cfs)
6.0 Direct Entry, Direct Entry Tc
Subcatchment E-1: Existing Site Runoff to Catch Basins On-site and Drainage in Kenwood
Runoff
Hydrograph
Time (hours)3635343332313029282726252423222120191817161514131211109876543210
Flo
w (c
fs)
1
0
Type III 24-hr
100-Year Rainfall=6.70"
Runoff Area=6,559 sf
Runoff Volume=2,898 cf
Runoff Depth=5.30"
Tc=6.0 min
CN=88
0.90 cfs
Type III 24-hr 100-Year Rainfall=6.70"Existing HCAD - 500 Harvard Printed 1/28/2021Prepared by Microsoft
Page 18HydroCAD® 10.00-26 s/n 02881 © 2020 HydroCAD Software Solutions LLC
Summary for Subcatchment E-2: Sheet Flow Off-Site to Harvard St Drainage
Runoff = 0.06 cfs @ 12.08 hrs, Volume= 221 cf, Depth= 6.46"
Runoff by SCS TR-20 method, UH=SCS, Weighted-CN, Time Span= 0.00-36.00 hrs, dt= 0.01 hrsType III 24-hr 100-Year Rainfall=6.70"
Area (sf) CN Description
410 98 Unconnected pavement, HSG A
410 100.00% Impervious Area410 100.00% Unconnected
Tc Length Slope Velocity Capacity Description(min) (feet) (ft/ft) (ft/sec) (cfs)
6.0 Direct Entry, Direct Entry
Subcatchment E-2: Sheet Flow Off-Site to Harvard St Drainage
Runoff
Hydrograph
Time (hours)3635343332313029282726252423222120191817161514131211109876543210
Flo
w (c
fs)
0.065
0.06
0.055
0.05
0.045
0.04
0.035
0.03
0.025
0.02
0.015
0.01
0.005
0
Type III 24-hr
100-Year Rainfall=6.70"
Runoff Area=410 sf
Runoff Volume=221 cf
Runoff Depth=6.46"
Tc=6.0 min
CN=98
0.06 cfs

Type III 24-hr 100-Year Rainfall=6.70"Existing HCAD - 500 Harvard Printed 1/28/2021Prepared by Microsoft
Page 19HydroCAD® 10.00-26 s/n 02881 © 2020 HydroCAD Software Solutions LLC
Summary for Reach E-SP-1: Municipal Drainage at Kenwood St.
Inflow Area = 6,559 sf, 83.03% Impervious, Inflow Depth = 5.30" for 100-Year eventInflow = 0.90 cfs @ 12.08 hrs, Volume= 2,898 cfOutflow = 0.90 cfs @ 12.08 hrs, Volume= 2,898 cf, Atten= 0%, Lag= 0.0 min
Routing by Stor-Ind+Trans method, Time Span= 0.00-36.00 hrs, dt= 0.01 hrs
Reach E-SP-1: Municipal Drainage at Kenwood St.
InflowOutflow
Hydrograph
Time (hours)3635343332313029282726252423222120191817161514131211109876543210
Flo
w (c
fs)
1
0
Inflow Area=6,559 sf0.90 cfs
0.90 cfs
Type III 24-hr 100-Year Rainfall=6.70"Existing HCAD - 500 Harvard Printed 1/28/2021Prepared by Microsoft
Page 20HydroCAD® 10.00-26 s/n 02881 © 2020 HydroCAD Software Solutions LLC
Summary for Reach E-SP-2: Municipal Drainage at Hrvard St.
Inflow Area = 410 sf,100.00% Impervious, Inflow Depth = 6.46" for 100-Year eventInflow = 0.06 cfs @ 12.08 hrs, Volume= 221 cfOutflow = 0.06 cfs @ 12.08 hrs, Volume= 221 cf, Atten= 0%, Lag= 0.0 min
Routing by Stor-Ind+Trans method, Time Span= 0.00-36.00 hrs, dt= 0.01 hrs
Reach E-SP-2: Municipal Drainage at Hrvard St.
InflowOutflow
Hydrograph
Time (hours)3635343332313029282726252423222120191817161514131211109876543210
Flo
w (c
fs)
0.065
0.06
0.055
0.05
0.045
0.04
0.035
0.03
0.025
0.02
0.015
0.01
0.005
0
Inflow Area=410 sf0.06 cfs
0.06 cfs


Section 3.0 Proposed HydroCAD Report
3 HYDROCAD WORKSHEETS .............................. PROPOSED CONDITIONS


P-1A
Proposed Site Runoff
(SE Building Roof)
P-1B
Roof Runoff to
Municipal System
P-2
Landscaped Area to
Infiltration System
P-3
Rear Sidewalk Sheet
Flow from Site to
Harvard St. Drainage
P-SP-1
Municipal Drain System
P-SP-2
Study Point #2 - Off-Site
Flow to Harvard St
Drainage
1P
Underground Infiltration
System UIS-1
Routing Diagram for Proposed HCAD - 500 HarvardPrepared by Microsoft, Printed 1/28/2021
HydroCAD® 10.00-26 s/n 02881 © 2020 HydroCAD Software Solutions LLC
Subcat Reach Pond Link
Proposed HCAD - 500 Harvard Printed 1/28/2021Prepared by Microsoft
Page 2HydroCAD® 10.00-26 s/n 02881 © 2020 HydroCAD Software Solutions LLC
Area Listing (all nodes)
Area
(sq-ft)
CN Description
(subcatchment-numbers)
475 39 >75% Grass cover, Good, HSG A (P-2)
426 98 Unconnected pavement, HSG A (P-2, P-3)
6,068 98 Unconnected roofs, HSG A (P-1A, P-1B)
6,969 94 TOTAL AREA

Proposed HCAD - 500 Harvard Printed 1/28/2021Prepared by Microsoft
Page 3HydroCAD® 10.00-26 s/n 02881 © 2020 HydroCAD Software Solutions LLC
Soil Listing (all nodes)
Area
(sq-ft)
Soil
Group
Subcatchment
Numbers
6,969 HSG A P-1A, P-1B, P-2, P-3
0 HSG B
0 HSG C
0 HSG D
0 Other
6,969 TOTAL AREA
Proposed HCAD - 500 Harvard Printed 1/28/2021Prepared by Microsoft
Page 4HydroCAD® 10.00-26 s/n 02881 © 2020 HydroCAD Software Solutions LLC
Ground Covers (all nodes)
HSG-A
(sq-ft)
HSG-B
(sq-ft)
HSG-C
(sq-ft)
HSG-D
(sq-ft)
Other
(sq-ft)
Total
(sq-ft)
Ground
Cover
Subcatchment
Numbers
475 0 0 0 0 475 >75% Grass cover,
Good
426 0 0 0 0 426 Unconnected
pavement
6,068 0 0 0 0 6,068 Unconnected roofs
6,969 0 0 0 0 6,969 TOTAL AREA

Type III 24-hr 2-Year Rainfall=3.20"Proposed HCAD - 500 Harvard Printed 1/28/2021Prepared by Microsoft
Page 5HydroCAD® 10.00-26 s/n 02881 © 2020 HydroCAD Software Solutions LLC
Summary for Subcatchment P-1A: Proposed Site Runoff (SE Building Roof)
Runoff = 0.16 cfs @ 12.08 hrs, Volume= 557 cf, Depth= 2.97"
Runoff by SCS TR-20 method, UH=SCS, Weighted-CN, Time Span= 0.00-36.00 hrs, dt= 0.01 hrsType III 24-hr 2-Year Rainfall=3.20"
Area (sf) CN Description
2,254 98 Unconnected roofs, HSG A
2,254 100.00% Impervious Area2,254 100.00% Unconnected
Tc Length Slope Velocity Capacity Description(min) (feet) (ft/ft) (ft/sec) (cfs)
6.0 Direct Entry, 6.0 Min. Direct Entry
Subcatchment P-1A: Proposed Site Runoff (SE Building Roof)
Runoff
Hydrograph
Time (hours)3635343332313029282726252423222120191817161514131211109876543210
Flo
w (c
fs)
0.18
0.17
0.16
0.15
0.14
0.13
0.12
0.11
0.1
0.09
0.08
0.07
0.06
0.05
0.04
0.03
0.02
0.01
0
Type III 24-hr
2-Year Rainfall=3.20"
Runoff Area=2,254 sf
Runoff Volume=557 cf
Runoff Depth=2.97"
Tc=6.0 min
CN=98
0.16 cfs
Type III 24-hr 2-Year Rainfall=3.20"Proposed HCAD - 500 Harvard Printed 1/28/2021Prepared by Microsoft
Page 6HydroCAD® 10.00-26 s/n 02881 © 2020 HydroCAD Software Solutions LLC
Summary for Subcatchment P-1B: Roof Runoff to Municipal System
Runoff = 0.27 cfs @ 12.08 hrs, Volume= 943 cf, Depth= 2.97"
Runoff by SCS TR-20 method, UH=SCS, Weighted-CN, Time Span= 0.00-36.00 hrs, dt= 0.01 hrsType III 24-hr 2-Year Rainfall=3.20"
Area (sf) CN Description
3,814 98 Unconnected roofs, HSG A
3,814 100.00% Impervious Area3,814 100.00% Unconnected
Tc Length Slope Velocity Capacity Description(min) (feet) (ft/ft) (ft/sec) (cfs)
6.0 Direct Entry,
Subcatchment P-1B: Roof Runoff to Municipal System
Runoff
Hydrograph
Time (hours)3635343332313029282726252423222120191817161514131211109876543210
Flo
w (c
fs)
0.3
0.28
0.26
0.24
0.22
0.2
0.18
0.16
0.14
0.12
0.1
0.08
0.06
0.04
0.02
0
Type III 24-hr
2-Year Rainfall=3.20"
Runoff Area=3,814 sf
Runoff Volume=943 cf
Runoff Depth=2.97"
Tc=6.0 min
CN=98
0.27 cfs

Type III 24-hr 2-Year Rainfall=3.20"Proposed HCAD - 500 Harvard Printed 1/28/2021Prepared by Microsoft
Page 7HydroCAD® 10.00-26 s/n 02881 © 2020 HydroCAD Software Solutions LLC
Summary for Subcatchment P-2: Landscaped Area to Infiltration System
Runoff = 0.00 cfs @ 23.98 hrs, Volume= 0 cf, Depth= 0.00"
Runoff by SCS TR-20 method, UH=SCS, Weighted-CN, Time Span= 0.00-36.00 hrs, dt= 0.01 hrsType III 24-hr 2-Year Rainfall=3.20"
Area (sf) CN Adj Description
475 39 >75% Grass cover, Good, HSG A20 98 Unconnected pavement, HSG A
495 41 40 Weighted Average, UI Adjusted475 95.96% Pervious Area20 4.04% Impervious Area20 100.00% Unconnected
Tc Length Slope Velocity Capacity Description(min) (feet) (ft/ft) (ft/sec) (cfs)
6.0 Direct Entry, Direct Entry
Subcatchment P-2: Landscaped Area to Infiltration System
Runoff
Hydrograph
Time (hours)3635343332313029282726252423222120191817161514131211109876543210
Flo
w (c
fs)
0
0
0
0
0
0
0
0
0
0
0
0
0
0
0
0
0
0
0
Type III 24-hr
2-Year Rainfall=3.20"
Runoff Area=495 sf
Runoff Volume=0 cf
Runoff Depth=0.00"
Tc=6.0 min
UI Adjusted CN=40
0.00 cfs
Type III 24-hr 2-Year Rainfall=3.20"Proposed HCAD - 500 Harvard Printed 1/28/2021Prepared by Microsoft
Page 8HydroCAD® 10.00-26 s/n 02881 © 2020 HydroCAD Software Solutions LLC
Summary for Subcatchment P-3: Rear Sidewalk Sheet Flow from Site to Harvard St. Drainage
Runoff = 0.03 cfs @ 12.08 hrs, Volume= 100 cf, Depth= 2.97"
Runoff by SCS TR-20 method, UH=SCS, Weighted-CN, Time Span= 0.00-36.00 hrs, dt= 0.01 hrsType III 24-hr 2-Year Rainfall=3.20"
Area (sf) CN Description
406 98 Unconnected pavement, HSG A
406 100.00% Impervious Area406 100.00% Unconnected
Tc Length Slope Velocity Capacity Description(min) (feet) (ft/ft) (ft/sec) (cfs)
6.0 Direct Entry, Direct Entry
Subcatchment P-3: Rear Sidewalk Sheet Flow from Site to Harvard St. Drainage
Runoff
Hydrograph
Time (hours)3635343332313029282726252423222120191817161514131211109876543210
Flo
w (c
fs)
0.032
0.03
0.028
0.026
0.024
0.022
0.02
0.018
0.016
0.014
0.012
0.01
0.008
0.006
0.004
0.002
0
Type III 24-hr
2-Year Rainfall=3.20"
Runoff Area=406 sf
Runoff Volume=100 cf
Runoff Depth=2.97"
Tc=6.0 min
CN=98
0.03 cfs

Type III 24-hr 2-Year Rainfall=3.20"Proposed HCAD - 500 Harvard Printed 1/28/2021Prepared by Microsoft
Page 9HydroCAD® 10.00-26 s/n 02881 © 2020 HydroCAD Software Solutions LLC
Summary for Reach P-SP-1: Municipal Drain System
Inflow Area = 6,563 sf, 92.76% Impervious, Inflow Depth = 1.84" for 2-Year eventInflow = 0.27 cfs @ 12.08 hrs, Volume= 1,008 cfOutflow = 0.27 cfs @ 12.08 hrs, Volume= 1,008 cf, Atten= 0%, Lag= 0.0 min
Routing by Stor-Ind+Trans method, Time Span= 0.00-36.00 hrs, dt= 0.01 hrs
Reach P-SP-1: Municipal Drain System
InflowOutflow
Hydrograph
Time (hours)3635343332313029282726252423222120191817161514131211109876543210
Flo
w (c
fs)
0.3
0.28
0.26
0.24
0.22
0.2
0.18
0.16
0.14
0.12
0.1
0.08
0.06
0.04
0.02
0
Inflow Area=6,563 sf0.27 cfs
0.27 cfs
Type III 24-hr 2-Year Rainfall=3.20"Proposed HCAD - 500 Harvard Printed 1/28/2021Prepared by Microsoft
Page 10HydroCAD® 10.00-26 s/n 02881 © 2020 HydroCAD Software Solutions LLC
Summary for Reach P-SP-2: Study Point #2 - Off-Site Flow to Harvard St Drainage
Inflow Area = 406 sf,100.00% Impervious, Inflow Depth = 2.97" for 2-Year eventInflow = 0.03 cfs @ 12.08 hrs, Volume= 100 cfOutflow = 0.03 cfs @ 12.08 hrs, Volume= 100 cf, Atten= 0%, Lag= 0.0 min
Routing by Stor-Ind+Trans method, Time Span= 0.00-36.00 hrs, dt= 0.01 hrs
Reach P-SP-2: Study Point #2 - Off-Site Flow to Harvard St Drainage
InflowOutflow
Hydrograph
Time (hours)3635343332313029282726252423222120191817161514131211109876543210
Flo
w (c
fs)
0.032
0.03
0.028
0.026
0.024
0.022
0.02
0.018
0.016
0.014
0.012
0.01
0.008
0.006
0.004
0.002
0
Inflow Area=406 sf0.03 cfs
0.03 cfs

Type III 24-hr 2-Year Rainfall=3.20"Proposed HCAD - 500 Harvard Printed 1/28/2021Prepared by Microsoft
Page 11HydroCAD® 10.00-26 s/n 02881 © 2020 HydroCAD Software Solutions LLC
Summary for Pond 1P: Underground Infiltration System UIS-1
Inflow Area = 2,749 sf, 82.72% Impervious, Inflow Depth = 2.43" for 2-Year eventInflow = 0.16 cfs @ 12.08 hrs, Volume= 558 cfOutflow = 0.00 cfs @ 17.02 hrs, Volume= 65 cf, Atten= 98%, Lag= 296.2 minDiscarded = 0.00 cfs @ 0.00 hrs, Volume= 0 cfPrimary = 0.00 cfs @ 17.02 hrs, Volume= 65 cf
Routing by Stor-Ind method, Time Span= 0.00-36.00 hrs, dt= 0.01 hrsPeak Elev= 43.72' @ 17.02 hrs Surf.Area= 263 sf Storage= 496 cfFlood Elev= 46.50' Surf.Area= 263 sf Storage= 640 cf
Plug-Flow detention time= 759.5 min calculated for 65 cf (12% of inflow)Center-of-Mass det. time= 436.8 min ( 1,193.3 - 756.5 )
Volume Invert Avail.Storage Storage Description
#1A 40.00' 364 cf 14.75'W x 17.86'L x 5.00'H Field A1,317 cf Overall - 276 cf Embedded = 1,041 cf x 35.0% Voids
#2A 42.00' 276 cf ADS_StormTech SC-740 +Cap x 6 Inside #1Effective Size= 44.6"W x 30.0"H => 6.45 sf x 7.12'L = 45.9 cfOverall Size= 51.0"W x 30.0"H x 7.56'L with 0.44' Overlap6 Chambers in 3 Rows
640 cf Total Available Storage
Storage Group A created with Chamber Wizard
Device Routing Invert Outlet Devices
#1 Primary 43.70' 12.0" Round Culvert L= 34.0' Ke= 0.200 Inlet / Outlet Invert= 43.70' / 43.36' S= 0.0100 '/' Cc= 0.900 n= 0.013 Corrugated PE, smooth interior, Flow Area= 0.79 sf
#2 Discarded 40.00' 1.420 in/hr Exfiltration over Surface area from 40.00' - 40.00' Excluded Surface area = 263 sf
#3 Device 1 43.70' 4.0' long x 0.5' breadth Broad-Crested Rectangular Weir Head (feet) 0.20 0.40 0.60 0.80 1.00 Coef. (English) 2.80 2.92 3.08 3.30 3.32
Discarded OutFlow Max=0.00 cfs @ 0.00 hrs HW=40.00' (Free Discharge)2=Exfiltration ( Controls 0.00 cfs)
Primary OutFlow Max=0.00 cfs @ 17.02 hrs HW=43.72' (Free Discharge)1=Culvert (Barrel Controls 0.00 cfs @ 0.57 fps)
3=Broad-Crested Rectangular Weir (Passes 0.00 cfs of 0.04 cfs potential flow)
Type III 24-hr 2-Year Rainfall=3.20"Proposed HCAD - 500 Harvard Printed 1/28/2021Prepared by Microsoft
Page 12HydroCAD® 10.00-26 s/n 02881 © 2020 HydroCAD Software Solutions LLC
Pond 1P: Underground Infiltration System UIS-1
InflowOutflowDiscardedPrimary
Hydrograph
Time (hours)3635343332313029282726252423222120191817161514131211109876543210
Flo
w (c
fs)
0.18
0.17
0.16
0.15
0.14
0.13
0.12
0.11
0.1
0.09
0.08
0.07
0.06
0.05
0.04
0.03
0.02
0.01
0
Inflow Area=2,749 sf
Peak Elev=43.72'
Storage=496 cf
0.16 cfs
0.00 cfs
0.00 cfs0.00 cfs

Type III 24-hr 10-Year Rainfall=4.70"Proposed HCAD - 500 Harvard Printed 1/28/2021Prepared by Microsoft
Page 13HydroCAD® 10.00-26 s/n 02881 © 2020 HydroCAD Software Solutions LLC
Summary for Subcatchment P-1A: Proposed Site Runoff (SE Building Roof)
Runoff = 0.24 cfs @ 12.08 hrs, Volume= 838 cf, Depth= 4.46"
Runoff by SCS TR-20 method, UH=SCS, Weighted-CN, Time Span= 0.00-36.00 hrs, dt= 0.01 hrsType III 24-hr 10-Year Rainfall=4.70"
Area (sf) CN Description
2,254 98 Unconnected roofs, HSG A
2,254 100.00% Impervious Area2,254 100.00% Unconnected
Tc Length Slope Velocity Capacity Description(min) (feet) (ft/ft) (ft/sec) (cfs)
6.0 Direct Entry, 6.0 Min. Direct Entry
Subcatchment P-1A: Proposed Site Runoff (SE Building Roof)
Runoff
Hydrograph
Time (hours)3635343332313029282726252423222120191817161514131211109876543210
Flo
w (c
fs)
0.26
0.24
0.22
0.2
0.18
0.16
0.14
0.12
0.1
0.08
0.06
0.04
0.02
0
Type III 24-hr
10-Year Rainfall=4.70"
Runoff Area=2,254 sf
Runoff Volume=838 cf
Runoff Depth=4.46"
Tc=6.0 min
CN=98
0.24 cfs
Type III 24-hr 10-Year Rainfall=4.70"Proposed HCAD - 500 Harvard Printed 1/28/2021Prepared by Microsoft
Page 14HydroCAD® 10.00-26 s/n 02881 © 2020 HydroCAD Software Solutions LLC
Summary for Subcatchment P-1B: Roof Runoff to Municipal System
Runoff = 0.40 cfs @ 12.08 hrs, Volume= 1,419 cf, Depth= 4.46"
Runoff by SCS TR-20 method, UH=SCS, Weighted-CN, Time Span= 0.00-36.00 hrs, dt= 0.01 hrsType III 24-hr 10-Year Rainfall=4.70"
Area (sf) CN Description
3,814 98 Unconnected roofs, HSG A
3,814 100.00% Impervious Area3,814 100.00% Unconnected
Tc Length Slope Velocity Capacity Description(min) (feet) (ft/ft) (ft/sec) (cfs)
6.0 Direct Entry,
Subcatchment P-1B: Roof Runoff to Municipal System
Runoff
Hydrograph
Time (hours)3635343332313029282726252423222120191817161514131211109876543210
Flo
w (c
fs)
0.44
0.42
0.4
0.38
0.36
0.34
0.32
0.3
0.28
0.26
0.24
0.22
0.2
0.18
0.16
0.14
0.12
0.1
0.08
0.06
0.04
0.02
0
Type III 24-hr
10-Year Rainfall=4.70"
Runoff Area=3,814 sf
Runoff Volume=1,419 cf
Runoff Depth=4.46"
Tc=6.0 min
CN=98
0.40 cfs

Type III 24-hr 10-Year Rainfall=4.70"Proposed HCAD - 500 Harvard Printed 1/28/2021Prepared by Microsoft
Page 15HydroCAD® 10.00-26 s/n 02881 © 2020 HydroCAD Software Solutions LLC
Summary for Subcatchment P-2: Landscaped Area to Infiltration System
Runoff = 0.00 cfs @ 12.50 hrs, Volume= 7 cf, Depth= 0.17"
Runoff by SCS TR-20 method, UH=SCS, Weighted-CN, Time Span= 0.00-36.00 hrs, dt= 0.01 hrsType III 24-hr 10-Year Rainfall=4.70"
Area (sf) CN Adj Description
475 39 >75% Grass cover, Good, HSG A20 98 Unconnected pavement, HSG A
495 41 40 Weighted Average, UI Adjusted475 95.96% Pervious Area20 4.04% Impervious Area20 100.00% Unconnected
Tc Length Slope Velocity Capacity Description(min) (feet) (ft/ft) (ft/sec) (cfs)
6.0 Direct Entry, Direct Entry
Subcatchment P-2: Landscaped Area to Infiltration System
Runoff
Hydrograph
Time (hours)3635343332313029282726252423222120191817161514131211109876543210
Flo
w (c
fs)
0.000
0.000
0.000
0.000
0.000
0.000
0.000
0.000
0.000
0.000
0.000
0.000
0.000
0
0
0
0
0
Type III 24-hr
10-Year Rainfall=4.70"
Runoff Area=495 sf
Runoff Volume=7 cf
Runoff Depth=0.17"
Tc=6.0 min
UI Adjusted CN=40
0.00 cfs
Type III 24-hr 10-Year Rainfall=4.70"Proposed HCAD - 500 Harvard Printed 1/28/2021Prepared by Microsoft
Page 16HydroCAD® 10.00-26 s/n 02881 © 2020 HydroCAD Software Solutions LLC
Summary for Subcatchment P-3: Rear Sidewalk Sheet Flow from Site to Harvard St. Drainage
Runoff = 0.04 cfs @ 12.08 hrs, Volume= 151 cf, Depth= 4.46"
Runoff by SCS TR-20 method, UH=SCS, Weighted-CN, Time Span= 0.00-36.00 hrs, dt= 0.01 hrsType III 24-hr 10-Year Rainfall=4.70"
Area (sf) CN Description
406 98 Unconnected pavement, HSG A
406 100.00% Impervious Area406 100.00% Unconnected
Tc Length Slope Velocity Capacity Description(min) (feet) (ft/ft) (ft/sec) (cfs)
6.0 Direct Entry, Direct Entry
Subcatchment P-3: Rear Sidewalk Sheet Flow from Site to Harvard St. Drainage
Runoff
Hydrograph
Time (hours)3635343332313029282726252423222120191817161514131211109876543210
Flo
w (c
fs)
0.046
0.044
0.042
0.04
0.038
0.036
0.034
0.032
0.03
0.028
0.026
0.024
0.022
0.02
0.018
0.016
0.014
0.012
0.01
0.008
0.006
0.004
0.002
0
Type III 24-hr
10-Year Rainfall=4.70"
Runoff Area=406 sf
Runoff Volume=151 cf
Runoff Depth=4.46"
Tc=6.0 min
CN=98
0.04 cfs

Type III 24-hr 10-Year Rainfall=4.70"Proposed HCAD - 500 Harvard Printed 1/28/2021Prepared by Microsoft
Page 17HydroCAD® 10.00-26 s/n 02881 © 2020 HydroCAD Software Solutions LLC
Summary for Reach P-SP-1: Municipal Drain System
Inflow Area = 6,563 sf, 92.76% Impervious, Inflow Depth = 3.24" for 10-Year eventInflow = 0.40 cfs @ 12.08 hrs, Volume= 1,772 cfOutflow = 0.40 cfs @ 12.08 hrs, Volume= 1,772 cf, Atten= 0%, Lag= 0.0 min
Routing by Stor-Ind+Trans method, Time Span= 0.00-36.00 hrs, dt= 0.01 hrs
Reach P-SP-1: Municipal Drain System
InflowOutflow
Hydrograph
Time (hours)3635343332313029282726252423222120191817161514131211109876543210
Flo
w (c
fs)
0.44
0.42
0.4
0.38
0.36
0.34
0.32
0.3
0.28
0.26
0.24
0.22
0.2
0.18
0.16
0.14
0.12
0.1
0.08
0.06
0.04
0.02
0
Inflow Area=6,563 sf0.40 cfs
0.40 cfs
Type III 24-hr 10-Year Rainfall=4.70"Proposed HCAD - 500 Harvard Printed 1/28/2021Prepared by Microsoft
Page 18HydroCAD® 10.00-26 s/n 02881 © 2020 HydroCAD Software Solutions LLC
Summary for Reach P-SP-2: Study Point #2 - Off-Site Flow to Harvard St Drainage
Inflow Area = 406 sf,100.00% Impervious, Inflow Depth = 4.46" for 10-Year eventInflow = 0.04 cfs @ 12.08 hrs, Volume= 151 cfOutflow = 0.04 cfs @ 12.08 hrs, Volume= 151 cf, Atten= 0%, Lag= 0.0 min
Routing by Stor-Ind+Trans method, Time Span= 0.00-36.00 hrs, dt= 0.01 hrs
Reach P-SP-2: Study Point #2 - Off-Site Flow to Harvard St Drainage
InflowOutflow
Hydrograph
Time (hours)3635343332313029282726252423222120191817161514131211109876543210
Flo
w (c
fs)
0.045
0.04
0.035
0.03
0.025
0.02
0.015
0.01
0.005
0
Inflow Area=406 sf0.04 cfs
0.04 cfs

Type III 24-hr 10-Year Rainfall=4.70"Proposed HCAD - 500 Harvard Printed 1/28/2021Prepared by Microsoft
Page 19HydroCAD® 10.00-26 s/n 02881 © 2020 HydroCAD Software Solutions LLC
Summary for Pond 1P: Underground Infiltration System UIS-1
Inflow Area = 2,749 sf, 82.72% Impervious, Inflow Depth = 3.69" for 10-Year eventInflow = 0.24 cfs @ 12.08 hrs, Volume= 846 cfOutflow = 0.08 cfs @ 12.38 hrs, Volume= 353 cf, Atten= 68%, Lag= 17.8 minDiscarded = 0.00 cfs @ 0.00 hrs, Volume= 0 cfPrimary = 0.08 cfs @ 12.38 hrs, Volume= 353 cf
Routing by Stor-Ind method, Time Span= 0.00-36.00 hrs, dt= 0.01 hrsPeak Elev= 43.84' @ 12.38 hrs Surf.Area= 263 sf Storage= 513 cfFlood Elev= 46.50' Surf.Area= 263 sf Storage= 640 cf
Plug-Flow detention time= 322.2 min calculated for 353 cf (42% of inflow)Center-of-Mass det. time= 171.8 min ( 923.1 - 751.3 )
Volume Invert Avail.Storage Storage Description
#1A 40.00' 364 cf 14.75'W x 17.86'L x 5.00'H Field A1,317 cf Overall - 276 cf Embedded = 1,041 cf x 35.0% Voids
#2A 42.00' 276 cf ADS_StormTech SC-740 +Cap x 6 Inside #1Effective Size= 44.6"W x 30.0"H => 6.45 sf x 7.12'L = 45.9 cfOverall Size= 51.0"W x 30.0"H x 7.56'L with 0.44' Overlap6 Chambers in 3 Rows
640 cf Total Available Storage
Storage Group A created with Chamber Wizard
Device Routing Invert Outlet Devices
#1 Primary 43.70' 12.0" Round Culvert L= 34.0' Ke= 0.200 Inlet / Outlet Invert= 43.70' / 43.36' S= 0.0100 '/' Cc= 0.900 n= 0.013 Corrugated PE, smooth interior, Flow Area= 0.79 sf
#2 Discarded 40.00' 1.420 in/hr Exfiltration over Surface area from 40.00' - 40.00' Excluded Surface area = 263 sf
#3 Device 1 43.70' 4.0' long x 0.5' breadth Broad-Crested Rectangular Weir Head (feet) 0.20 0.40 0.60 0.80 1.00 Coef. (English) 2.80 2.92 3.08 3.30 3.32
Discarded OutFlow Max=0.00 cfs @ 0.00 hrs HW=40.00' (Free Discharge)2=Exfiltration ( Controls 0.00 cfs)
Primary OutFlow Max=0.07 cfs @ 12.38 hrs HW=43.84' (Free Discharge)1=Culvert (Barrel Controls 0.07 cfs @ 1.78 fps)
3=Broad-Crested Rectangular Weir (Passes 0.07 cfs of 0.56 cfs potential flow)
Type III 24-hr 10-Year Rainfall=4.70"Proposed HCAD - 500 Harvard Printed 1/28/2021Prepared by Microsoft
Page 20HydroCAD® 10.00-26 s/n 02881 © 2020 HydroCAD Software Solutions LLC
Pond 1P: Underground Infiltration System UIS-1
InflowOutflowDiscardedPrimary
Hydrograph
Time (hours)3635343332313029282726252423222120191817161514131211109876543210
Flo
w (c
fs)
0.26
0.24
0.22
0.2
0.18
0.16
0.14
0.12
0.1
0.08
0.06
0.04
0.02
0
Inflow Area=2,749 sf
Peak Elev=43.84'
Storage=513 cf
0.24 cfs
0.08 cfs
0.00 cfs
0.08 cfs

Type III 24-hr 25-Year Rainfall=5.50"Proposed HCAD - 500 Harvard Printed 1/28/2021Prepared by Microsoft
Page 21HydroCAD® 10.00-26 s/n 02881 © 2020 HydroCAD Software Solutions LLC
Summary for Subcatchment P-1A: Proposed Site Runoff (SE Building Roof)
Runoff = 0.28 cfs @ 12.08 hrs, Volume= 988 cf, Depth= 5.26"
Runoff by SCS TR-20 method, UH=SCS, Weighted-CN, Time Span= 0.00-36.00 hrs, dt= 0.01 hrsType III 24-hr 25-Year Rainfall=5.50"
Area (sf) CN Description
2,254 98 Unconnected roofs, HSG A
2,254 100.00% Impervious Area2,254 100.00% Unconnected
Tc Length Slope Velocity Capacity Description(min) (feet) (ft/ft) (ft/sec) (cfs)
6.0 Direct Entry, 6.0 Min. Direct Entry
Subcatchment P-1A: Proposed Site Runoff (SE Building Roof)
Runoff
Hydrograph
Time (hours)3635343332313029282726252423222120191817161514131211109876543210
Flo
w (c
fs)
0.3
0.28
0.26
0.24
0.22
0.2
0.18
0.16
0.14
0.12
0.1
0.08
0.06
0.04
0.02
0
Type III 24-hr
25-Year Rainfall=5.50"
Runoff Area=2,254 sf
Runoff Volume=988 cf
Runoff Depth=5.26"
Tc=6.0 min
CN=98
0.28 cfs
Type III 24-hr 25-Year Rainfall=5.50"Proposed HCAD - 500 Harvard Printed 1/28/2021Prepared by Microsoft
Page 22HydroCAD® 10.00-26 s/n 02881 © 2020 HydroCAD Software Solutions LLC
Summary for Subcatchment P-1B: Roof Runoff to Municipal System
Runoff = 0.47 cfs @ 12.08 hrs, Volume= 1,673 cf, Depth= 5.26"
Runoff by SCS TR-20 method, UH=SCS, Weighted-CN, Time Span= 0.00-36.00 hrs, dt= 0.01 hrsType III 24-hr 25-Year Rainfall=5.50"
Area (sf) CN Description
3,814 98 Unconnected roofs, HSG A
3,814 100.00% Impervious Area3,814 100.00% Unconnected
Tc Length Slope Velocity Capacity Description(min) (feet) (ft/ft) (ft/sec) (cfs)
6.0 Direct Entry,
Subcatchment P-1B: Roof Runoff to Municipal System
Runoff
Hydrograph
Time (hours)3635343332313029282726252423222120191817161514131211109876543210
Flo
w (c
fs)
0.5
0.45
0.4
0.35
0.3
0.25
0.2
0.15
0.1
0.05
0
Type III 24-hr
25-Year Rainfall=5.50"
Runoff Area=3,814 sf
Runoff Volume=1,673 cf
Runoff Depth=5.26"
Tc=6.0 min
CN=98
0.47 cfs

Type III 24-hr 25-Year Rainfall=5.50"Proposed HCAD - 500 Harvard Printed 1/28/2021Prepared by Microsoft
Page 23HydroCAD® 10.00-26 s/n 02881 © 2020 HydroCAD Software Solutions LLC
Summary for Subcatchment P-2: Landscaped Area to Infiltration System
Runoff = 0.00 cfs @ 12.37 hrs, Volume= 15 cf, Depth= 0.36"
Runoff by SCS TR-20 method, UH=SCS, Weighted-CN, Time Span= 0.00-36.00 hrs, dt= 0.01 hrsType III 24-hr 25-Year Rainfall=5.50"
Area (sf) CN Adj Description
475 39 >75% Grass cover, Good, HSG A20 98 Unconnected pavement, HSG A
495 41 40 Weighted Average, UI Adjusted475 95.96% Pervious Area20 4.04% Impervious Area20 100.00% Unconnected
Tc Length Slope Velocity Capacity Description(min) (feet) (ft/ft) (ft/sec) (cfs)
6.0 Direct Entry, Direct Entry
Subcatchment P-2: Landscaped Area to Infiltration System
Runoff
Hydrograph
Time (hours)3635343332313029282726252423222120191817161514131211109876543210
Flo
w (c
fs)
0.002
0.002
0.001
0.001
0.001
0.001
0.001
0.001
0.001
0.001
0.001
0.000
0.000
0.000
0.000
0
0
Type III 24-hr
25-Year Rainfall=5.50"
Runoff Area=495 sf
Runoff Volume=15 cf
Runoff Depth=0.36"
Tc=6.0 min
UI Adjusted CN=40
0.00 cfs
Type III 24-hr 25-Year Rainfall=5.50"Proposed HCAD - 500 Harvard Printed 1/28/2021Prepared by Microsoft
Page 24HydroCAD® 10.00-26 s/n 02881 © 2020 HydroCAD Software Solutions LLC
Summary for Subcatchment P-3: Rear Sidewalk Sheet Flow from Site to Harvard St. Drainage
Runoff = 0.05 cfs @ 12.08 hrs, Volume= 178 cf, Depth= 5.26"
Runoff by SCS TR-20 method, UH=SCS, Weighted-CN, Time Span= 0.00-36.00 hrs, dt= 0.01 hrsType III 24-hr 25-Year Rainfall=5.50"
Area (sf) CN Description
406 98 Unconnected pavement, HSG A
406 100.00% Impervious Area406 100.00% Unconnected
Tc Length Slope Velocity Capacity Description(min) (feet) (ft/ft) (ft/sec) (cfs)
6.0 Direct Entry, Direct Entry
Subcatchment P-3: Rear Sidewalk Sheet Flow from Site to Harvard St. Drainage
Runoff
Hydrograph
Time (hours)3635343332313029282726252423222120191817161514131211109876543210
Flo
w (c
fs)
0.055
0.05
0.045
0.04
0.035
0.03
0.025
0.02
0.015
0.01
0.005
0
Type III 24-hr
25-Year Rainfall=5.50"
Runoff Area=406 sf
Runoff Volume=178 cf
Runoff Depth=5.26"
Tc=6.0 min
CN=98
0.05 cfs

Type III 24-hr 25-Year Rainfall=5.50"Proposed HCAD - 500 Harvard Printed 1/28/2021Prepared by Microsoft
Page 25HydroCAD® 10.00-26 s/n 02881 © 2020 HydroCAD Software Solutions LLC
Summary for Reach P-SP-1: Municipal Drain System
Inflow Area = 6,563 sf, 92.76% Impervious, Inflow Depth = 3.99" for 25-Year eventInflow = 0.49 cfs @ 12.15 hrs, Volume= 2,184 cfOutflow = 0.49 cfs @ 12.15 hrs, Volume= 2,184 cf, Atten= 0%, Lag= 0.0 min
Routing by Stor-Ind+Trans method, Time Span= 0.00-36.00 hrs, dt= 0.01 hrs
Reach P-SP-1: Municipal Drain System
InflowOutflow
Hydrograph
Time (hours)3635343332313029282726252423222120191817161514131211109876543210
Flo
w (c
fs)
0.5
0.45
0.4
0.35
0.3
0.25
0.2
0.15
0.1
0.05
0
Inflow Area=6,563 sf0.49 cfs
0.49 cfs
Type III 24-hr 25-Year Rainfall=5.50"Proposed HCAD - 500 Harvard Printed 1/28/2021Prepared by Microsoft
Page 26HydroCAD® 10.00-26 s/n 02881 © 2020 HydroCAD Software Solutions LLC
Summary for Reach P-SP-2: Study Point #2 - Off-Site Flow to Harvard St Drainage
Inflow Area = 406 sf,100.00% Impervious, Inflow Depth = 5.26" for 25-Year eventInflow = 0.05 cfs @ 12.08 hrs, Volume= 178 cfOutflow = 0.05 cfs @ 12.08 hrs, Volume= 178 cf, Atten= 0%, Lag= 0.0 min
Routing by Stor-Ind+Trans method, Time Span= 0.00-36.00 hrs, dt= 0.01 hrs
Reach P-SP-2: Study Point #2 - Off-Site Flow to Harvard St Drainage
InflowOutflow
Hydrograph
Time (hours)3635343332313029282726252423222120191817161514131211109876543210
Flo
w (c
fs)
0.055
0.05
0.045
0.04
0.035
0.03
0.025
0.02
0.015
0.01
0.005
0
Inflow Area=406 sf0.05 cfs
0.05 cfs

Type III 24-hr 25-Year Rainfall=5.50"Proposed HCAD - 500 Harvard Printed 1/28/2021Prepared by Microsoft
Page 27HydroCAD® 10.00-26 s/n 02881 © 2020 HydroCAD Software Solutions LLC
Summary for Pond 1P: Underground Infiltration System UIS-1
Inflow Area = 2,749 sf, 82.72% Impervious, Inflow Depth = 4.38" for 25-Year eventInflow = 0.28 cfs @ 12.08 hrs, Volume= 1,003 cfOutflow = 0.17 cfs @ 12.19 hrs, Volume= 511 cf, Atten= 40%, Lag= 6.2 minDiscarded = 0.00 cfs @ 0.00 hrs, Volume= 0 cfPrimary = 0.17 cfs @ 12.19 hrs, Volume= 511 cf
Routing by Stor-Ind method, Time Span= 0.00-36.00 hrs, dt= 0.01 hrsPeak Elev= 43.90' @ 12.19 hrs Surf.Area= 263 sf Storage= 523 cfFlood Elev= 46.50' Surf.Area= 263 sf Storage= 640 cf
Plug-Flow detention time= 269.0 min calculated for 511 cf (51% of inflow)Center-of-Mass det. time= 138.9 min ( 888.7 - 749.8 )
Volume Invert Avail.Storage Storage Description
#1A 40.00' 364 cf 14.75'W x 17.86'L x 5.00'H Field A1,317 cf Overall - 276 cf Embedded = 1,041 cf x 35.0% Voids
#2A 42.00' 276 cf ADS_StormTech SC-740 +Cap x 6 Inside #1Effective Size= 44.6"W x 30.0"H => 6.45 sf x 7.12'L = 45.9 cfOverall Size= 51.0"W x 30.0"H x 7.56'L with 0.44' Overlap6 Chambers in 3 Rows
640 cf Total Available Storage
Storage Group A created with Chamber Wizard
Device Routing Invert Outlet Devices
#1 Primary 43.70' 12.0" Round Culvert L= 34.0' Ke= 0.200 Inlet / Outlet Invert= 43.70' / 43.36' S= 0.0100 '/' Cc= 0.900 n= 0.013 Corrugated PE, smooth interior, Flow Area= 0.79 sf
#2 Discarded 40.00' 1.420 in/hr Exfiltration over Surface area from 40.00' - 40.00' Excluded Surface area = 263 sf
#3 Device 1 43.70' 4.0' long x 0.5' breadth Broad-Crested Rectangular Weir Head (feet) 0.20 0.40 0.60 0.80 1.00 Coef. (English) 2.80 2.92 3.08 3.30 3.32
Discarded OutFlow Max=0.00 cfs @ 0.00 hrs HW=40.00' (Free Discharge)2=Exfiltration ( Controls 0.00 cfs)
Primary OutFlow Max=0.17 cfs @ 12.19 hrs HW=43.90' (Free Discharge)1=Culvert (Barrel Controls 0.17 cfs @ 2.22 fps)
3=Broad-Crested Rectangular Weir (Passes 0.17 cfs of 1.03 cfs potential flow)
Type III 24-hr 25-Year Rainfall=5.50"Proposed HCAD - 500 Harvard Printed 1/28/2021Prepared by Microsoft
Page 28HydroCAD® 10.00-26 s/n 02881 © 2020 HydroCAD Software Solutions LLC
Pond 1P: Underground Infiltration System UIS-1
InflowOutflowDiscardedPrimary
Hydrograph
Time (hours)3635343332313029282726252423222120191817161514131211109876543210
Flo
w (c
fs)
0.3
0.28
0.26
0.24
0.22
0.2
0.18
0.16
0.14
0.12
0.1
0.08
0.06
0.04
0.02
0
Inflow Area=2,749 sf
Peak Elev=43.90'
Storage=523 cf
0.28 cfs
0.17 cfs
0.00 cfs
0.17 cfs

Type III 24-hr 100-Year Rainfall=6.70"Proposed HCAD - 500 Harvard Printed 1/28/2021Prepared by Microsoft
Page 29HydroCAD® 10.00-26 s/n 02881 © 2020 HydroCAD Software Solutions LLC
Summary for Subcatchment P-1A: Proposed Site Runoff (SE Building Roof)
Runoff = 0.34 cfs @ 12.08 hrs, Volume= 1,214 cf, Depth= 6.46"
Runoff by SCS TR-20 method, UH=SCS, Weighted-CN, Time Span= 0.00-36.00 hrs, dt= 0.01 hrsType III 24-hr 100-Year Rainfall=6.70"
Area (sf) CN Description
2,254 98 Unconnected roofs, HSG A
2,254 100.00% Impervious Area2,254 100.00% Unconnected
Tc Length Slope Velocity Capacity Description(min) (feet) (ft/ft) (ft/sec) (cfs)
6.0 Direct Entry, 6.0 Min. Direct Entry
Subcatchment P-1A: Proposed Site Runoff (SE Building Roof)
Runoff
Hydrograph
Time (hours)3635343332313029282726252423222120191817161514131211109876543210
Flo
w (c
fs)
0.38
0.36
0.34
0.32
0.3
0.28
0.26
0.24
0.22
0.2
0.18
0.16
0.14
0.12
0.1
0.08
0.06
0.04
0.02
0
Type III 24-hr
100-Year Rainfall=6.70"
Runoff Area=2,254 sf
Runoff Volume=1,214 cf
Runoff Depth=6.46"
Tc=6.0 min
CN=98
0.34 cfs
Type III 24-hr 100-Year Rainfall=6.70"Proposed HCAD - 500 Harvard Printed 1/28/2021Prepared by Microsoft
Page 30HydroCAD® 10.00-26 s/n 02881 © 2020 HydroCAD Software Solutions LLC
Summary for Subcatchment P-1B: Roof Runoff to Municipal System
Runoff = 0.58 cfs @ 12.08 hrs, Volume= 2,054 cf, Depth= 6.46"
Runoff by SCS TR-20 method, UH=SCS, Weighted-CN, Time Span= 0.00-36.00 hrs, dt= 0.01 hrsType III 24-hr 100-Year Rainfall=6.70"
Area (sf) CN Description
3,814 98 Unconnected roofs, HSG A
3,814 100.00% Impervious Area3,814 100.00% Unconnected
Tc Length Slope Velocity Capacity Description(min) (feet) (ft/ft) (ft/sec) (cfs)
6.0 Direct Entry,
Subcatchment P-1B: Roof Runoff to Municipal System
Runoff
Hydrograph
Time (hours)3635343332313029282726252423222120191817161514131211109876543210
Flo
w (c
fs)
0.6
0.55
0.5
0.45
0.4
0.35
0.3
0.25
0.2
0.15
0.1
0.05
0
Type III 24-hr
100-Year Rainfall=6.70"
Runoff Area=3,814 sf
Runoff Volume=2,054 cf
Runoff Depth=6.46"
Tc=6.0 min
CN=98
0.58 cfs

Type III 24-hr 100-Year Rainfall=6.70"Proposed HCAD - 500 Harvard Printed 1/28/2021Prepared by Microsoft
Page 31HydroCAD® 10.00-26 s/n 02881 © 2020 HydroCAD Software Solutions LLC
Summary for Subcatchment P-2: Landscaped Area to Infiltration System
Runoff = 0.00 cfs @ 12.14 hrs, Volume= 30 cf, Depth= 0.73"
Runoff by SCS TR-20 method, UH=SCS, Weighted-CN, Time Span= 0.00-36.00 hrs, dt= 0.01 hrsType III 24-hr 100-Year Rainfall=6.70"
Area (sf) CN Adj Description
475 39 >75% Grass cover, Good, HSG A20 98 Unconnected pavement, HSG A
495 41 40 Weighted Average, UI Adjusted475 95.96% Pervious Area20 4.04% Impervious Area20 100.00% Unconnected
Tc Length Slope Velocity Capacity Description(min) (feet) (ft/ft) (ft/sec) (cfs)
6.0 Direct Entry, Direct Entry
Subcatchment P-2: Landscaped Area to Infiltration System
Runoff
Hydrograph
Time (hours)3635343332313029282726252423222120191817161514131211109876543210
Flo
w (c
fs)
0.005
0.005
0.004
0.004
0.003
0.003
0.002
0.002
0.001
0.001
0
Type III 24-hr
100-Year Rainfall=6.70"
Runoff Area=495 sf
Runoff Volume=30 cf
Runoff Depth=0.73"
Tc=6.0 min
UI Adjusted CN=40
0.00 cfs
Type III 24-hr 100-Year Rainfall=6.70"Proposed HCAD - 500 Harvard Printed 1/28/2021Prepared by Microsoft
Page 32HydroCAD® 10.00-26 s/n 02881 © 2020 HydroCAD Software Solutions LLC
Summary for Subcatchment P-3: Rear Sidewalk Sheet Flow from Site to Harvard St. Drainage
Runoff = 0.06 cfs @ 12.08 hrs, Volume= 219 cf, Depth= 6.46"
Runoff by SCS TR-20 method, UH=SCS, Weighted-CN, Time Span= 0.00-36.00 hrs, dt= 0.01 hrsType III 24-hr 100-Year Rainfall=6.70"
Area (sf) CN Description
406 98 Unconnected pavement, HSG A
406 100.00% Impervious Area406 100.00% Unconnected
Tc Length Slope Velocity Capacity Description(min) (feet) (ft/ft) (ft/sec) (cfs)
6.0 Direct Entry, Direct Entry
Subcatchment P-3: Rear Sidewalk Sheet Flow from Site to Harvard St. Drainage
Runoff
Hydrograph
Time (hours)3635343332313029282726252423222120191817161514131211109876543210
Flo
w (c
fs)
0.065
0.06
0.055
0.05
0.045
0.04
0.035
0.03
0.025
0.02
0.015
0.01
0.005
0
Type III 24-hr
100-Year Rainfall=6.70"
Runoff Area=406 sf
Runoff Volume=219 cf
Runoff Depth=6.46"
Tc=6.0 min
CN=98
0.06 cfs

Type III 24-hr 100-Year Rainfall=6.70"Proposed HCAD - 500 Harvard Printed 1/28/2021Prepared by Microsoft
Page 33HydroCAD® 10.00-26 s/n 02881 © 2020 HydroCAD Software Solutions LLC
Summary for Reach P-SP-1: Municipal Drain System
Inflow Area = 6,563 sf, 92.76% Impervious, Inflow Depth = 5.13" for 100-Year eventInflow = 0.89 cfs @ 12.09 hrs, Volume= 2,805 cfOutflow = 0.89 cfs @ 12.09 hrs, Volume= 2,805 cf, Atten= 0%, Lag= 0.0 min
Routing by Stor-Ind+Trans method, Time Span= 0.00-36.00 hrs, dt= 0.01 hrs
Reach P-SP-1: Municipal Drain System
InflowOutflow
Hydrograph
Time (hours)3635343332313029282726252423222120191817161514131211109876543210
Flo
w (c
fs)
1
0
Inflow Area=6,563 sf0.89 cfs
0.89 cfs
Type III 24-hr 100-Year Rainfall=6.70"Proposed HCAD - 500 Harvard Printed 1/28/2021Prepared by Microsoft
Page 34HydroCAD® 10.00-26 s/n 02881 © 2020 HydroCAD Software Solutions LLC
Summary for Reach P-SP-2: Study Point #2 - Off-Site Flow to Harvard St Drainage
Inflow Area = 406 sf,100.00% Impervious, Inflow Depth = 6.46" for 100-Year eventInflow = 0.06 cfs @ 12.08 hrs, Volume= 219 cfOutflow = 0.06 cfs @ 12.08 hrs, Volume= 219 cf, Atten= 0%, Lag= 0.0 min
Routing by Stor-Ind+Trans method, Time Span= 0.00-36.00 hrs, dt= 0.01 hrs
Reach P-SP-2: Study Point #2 - Off-Site Flow to Harvard St Drainage
InflowOutflow
Hydrograph
Time (hours)3635343332313029282726252423222120191817161514131211109876543210
Flo
w (c
fs)
0.065
0.06
0.055
0.05
0.045
0.04
0.035
0.03
0.025
0.02
0.015
0.01
0.005
0
Inflow Area=406 sf0.06 cfs
0.06 cfs

Type III 24-hr 100-Year Rainfall=6.70"Proposed HCAD - 500 Harvard Printed 1/28/2021Prepared by Microsoft
Page 35HydroCAD® 10.00-26 s/n 02881 © 2020 HydroCAD Software Solutions LLC
Summary for Pond 1P: Underground Infiltration System UIS-1
Inflow Area = 2,749 sf, 82.72% Impervious, Inflow Depth = 5.43" for 100-Year eventInflow = 0.34 cfs @ 12.08 hrs, Volume= 1,244 cfOutflow = 0.33 cfs @ 12.11 hrs, Volume= 752 cf, Atten= 4%, Lag= 1.4 minDiscarded = 0.00 cfs @ 0.00 hrs, Volume= 0 cfPrimary = 0.33 cfs @ 12.11 hrs, Volume= 752 cf
Routing by Stor-Ind method, Time Span= 0.00-36.00 hrs, dt= 0.01 hrsPeak Elev= 43.99' @ 12.11 hrs Surf.Area= 263 sf Storage= 535 cfFlood Elev= 46.50' Surf.Area= 263 sf Storage= 640 cf
Plug-Flow detention time= 228.0 min calculated for 751 cf (60% of inflow)Center-of-Mass det. time= 114.5 min ( 862.6 - 748.1 )
Volume Invert Avail.Storage Storage Description
#1A 40.00' 364 cf 14.75'W x 17.86'L x 5.00'H Field A1,317 cf Overall - 276 cf Embedded = 1,041 cf x 35.0% Voids
#2A 42.00' 276 cf ADS_StormTech SC-740 +Cap x 6 Inside #1Effective Size= 44.6"W x 30.0"H => 6.45 sf x 7.12'L = 45.9 cfOverall Size= 51.0"W x 30.0"H x 7.56'L with 0.44' Overlap6 Chambers in 3 Rows
640 cf Total Available Storage
Storage Group A created with Chamber Wizard
Device Routing Invert Outlet Devices
#1 Primary 43.70' 12.0" Round Culvert L= 34.0' Ke= 0.200 Inlet / Outlet Invert= 43.70' / 43.36' S= 0.0100 '/' Cc= 0.900 n= 0.013 Corrugated PE, smooth interior, Flow Area= 0.79 sf
#2 Discarded 40.00' 1.420 in/hr Exfiltration over Surface area from 40.00' - 40.00' Excluded Surface area = 263 sf
#3 Device 1 43.70' 4.0' long x 0.5' breadth Broad-Crested Rectangular Weir Head (feet) 0.20 0.40 0.60 0.80 1.00 Coef. (English) 2.80 2.92 3.08 3.30 3.32
Discarded OutFlow Max=0.00 cfs @ 0.00 hrs HW=40.00' (Free Discharge)2=Exfiltration ( Controls 0.00 cfs)
Primary OutFlow Max=0.33 cfs @ 12.11 hrs HW=43.99' (Free Discharge)1=Culvert (Barrel Controls 0.33 cfs @ 2.65 fps)
3=Broad-Crested Rectangular Weir (Passes 0.33 cfs of 1.75 cfs potential flow)
Type III 24-hr 100-Year Rainfall=6.70"Proposed HCAD - 500 Harvard Printed 1/28/2021Prepared by Microsoft
Page 36HydroCAD® 10.00-26 s/n 02881 © 2020 HydroCAD Software Solutions LLC
Pond 1P: Underground Infiltration System UIS-1
InflowOutflowDiscardedPrimary
Hydrograph
Time (hours)3635343332313029282726252423222120191817161514131211109876543210
Flo
w (c
fs)
0.38
0.36
0.34
0.32
0.3
0.28
0.26
0.24
0.22
0.2
0.18
0.16
0.14
0.12
0.1
0.08
0.06
0.04
0.02
0
Inflow Area=2,749 sf
Peak Elev=43.99'
Storage=535 cf
0.34 cfs
0.33 cfs
0.00 cfs
0.33 cfs

Section 4.0 Site Exhibits
4 EXHIBITS
USGS MAP
AERIAL PHOTO – NORTHERLY VIEW
BROOKLINE FLOODPLAIN MAP
FEMA FIRM MAP
USDA SOILS MAP


Section 5.0 Appendix
5 APPENDIX
RAINFALL DATA
MANNING’S ROUGHNESS NUMBERS
NRCS SOILS REPORT
DEP STANDARD CALCULATIONS


F-2 Hydrology Handbook for Conservation Commissioners March 2002
F-1. Rainfall Data for Massachusetts from Rainfall Frequency Atlas of the United States
(TP-40)
!" Users of this Handbook should note that current MA DEP written guidance (see DEP
Waterlines newsletter -- Fall 2000) requires the use of TP-40 Rainfall Data for calculations
under the Wetlands Protection Regulations and the Stormwater Management Policy. More
stringent design storms may be used under a local bylaw or ordinance. However, DEP will
continue to require the use of TP-40 in any case it reviews under the Wetlands Protection
Act and Stormwater Management Policy.
Adjusted Technical Paper 40 Design Storms for 24-hour Event by County
County Name 1-yr 2-yr 5-yr 10-yr 25-yr 50-yr 100-yr
24-hr 24-hr 24-hr 24-hr 24-hr 24-hr 24-hr
Barnstable 2.5 3.6 4.5 4.8 5.7 6.4 7.1
Berkshire 2.5 2.9 3.8 4.4 5.1 5.9 6.4
Bristol 2.5 3.4 4.3 4.8 5.6 6.3 7.0
Dukes 2.5 3.6 4.6 4.9 5.8 6.5 7.2
Essex 2.5 3.1 3.9 4.5 5.4 5.9 6.5
Franklin 2.5 2.9 3.8 4.3 5.1 5.8 6.2
Hampden 2.5 3.0 4.0 4.6 5.3 6.0 6.5
Hampshire 2.5 3.0 3.9 4.5 5.2 5.9 6.4
Middlesex 2.5 3.1 4.0 4.5 5.3 5.9 6.5
Nantucket 2.5 3.6 4.6 4.9 5.8 6.5 7.2
Norfolk 2.5 3.2 4.1 4.7 5.5 6.1 6.7
Plymouth 2.5 3.4 4.3 4.7 5.6 6.2 7.0
Suffolk 2.5 3.2 4.0 4.6 5.5 6.0 6.6
Worcester 2.5 3.0 4.0 4.5 5.3 5.9 6.5
drobinson
Highlight
drobinson
Highlight
drobinson
Highlight
drobinson
Highlight
drobinson
Highlight


United StatesDepartment ofAgriculture
A product of the NationalCooperative Soil Survey,a joint effort of the UnitedStates Department ofAgriculture and otherFederal agencies, Stateagencies including theAgricultural ExperimentStations, and localparticipants
Custom Soil Resource Report forNorfolk and Suffolk Counties, Massachusetts
NaturalResourcesConservationService
October 5, 2020


9
Custom Soil Resource ReportSoil Map
4690
550
4690
580
4690
610
4690
640
4690
670
4690
700
4690
730
4690
520
4690
550
4690
580
4690
610
4690
640
4690
670
4690
700
4690
730
324440 324470 324500 324530 324560 324590 324620 324650 324680 324710 324740
324440 324470 324500 324530 324560 324590 324620 324650 324680 324710 324740
42° 20' 56'' N71
° 7
' 53'
' W42° 20' 56'' N
71° 7
' 39'
' W
42° 20' 49'' N
71° 7
' 53'
' W
42° 20' 49'' N
71° 7
' 39'
' W
N
Map projection: Web Mercator Corner coordinates: WGS84 Edge tics: UTM Zone 19N WGS840 50 100 200 300
Feet0 20 40 80 120
MetersMap Scale: 1:1,520 if printed on A landscape (11" x 8.5") sheet.
Soil Map may not be valid at this scale.

MAP LEGEND MAP INFORMATION
Area of Interest (AOI)Area of Interest (AOI)
SoilsSoil Map Unit Polygons
Soil Map Unit Lines
Soil Map Unit Points
Special Point FeaturesBlowout
Borrow Pit
Clay Spot
Closed Depression
Gravel Pit
Gravelly Spot
Landfill
Lava Flow
Marsh or swamp
Mine or Quarry
Miscellaneous Water
Perennial Water
Rock Outcrop
Saline Spot
Sandy Spot
Severely Eroded Spot
Sinkhole
Slide or Slip
Sodic Spot
Spoil Area
Stony Spot
Very Stony Spot
Wet Spot
Other
Special Line Features
Water FeaturesStreams and Canals
TransportationRails
Interstate Highways
US Routes
Major Roads
Local Roads
BackgroundAerial Photography
The soil surveys that comprise your AOI were mapped at 1:25,000.
Warning: Soil Map may not be valid at this scale.
Enlargement of maps beyond the scale of mapping can cause misunderstanding of the detail of mapping and accuracy of soil line placement. The maps do not show the small areas of contrasting soils that could have been shown at a more detailed scale.
Please rely on the bar scale on each map sheet for map measurements.
Source of Map: Natural Resources Conservation ServiceWeb Soil Survey URL: Coordinate System: Web Mercator (EPSG:3857)
Maps from the Web Soil Survey are based on the Web Mercator projection, which preserves direction and shape but distorts distance and area. A projection that preserves area, such as the Albers equal-area conic projection, should be used if more accurate calculations of distance or area are required.
This product is generated from the USDA-NRCS certified data as of the version date(s) listed below.
Soil Survey Area: Norfolk and Suffolk Counties, MassachusettsSurvey Area Data: Version 16, Jun 11, 2020
Soil map units are labeled (as space allows) for map scales 1:50,000 or larger.
Date(s) aerial images were photographed: Sep 11, 2019—Oct 5, 2019
The orthophoto or other base map on which the soil lines were compiled and digitized probably differs from the background imagery displayed on these maps. As a result, some minor shifting of map unit boundaries may be evident.
Custom Soil Resource Report
10

Map Unit Legend
Map Unit Symbol Map Unit Name Acres in AOI Percent of AOI
603 Urban land, wet substratum, 0 to 3 percent slopes
5.9 51.8%
628C Canton-Urban land complex, 3 to 15 percent slopes
5.5 48.2%
Totals for Area of Interest 11.5 100.0%
Map Unit DescriptionsThe map units delineated on the detailed soil maps in a soil survey represent the soils or miscellaneous areas in the survey area. The map unit descriptions, along with the maps, can be used to determine the composition and properties of a unit.
A map unit delineation on a soil map represents an area dominated by one or more major kinds of soil or miscellaneous areas. A map unit is identified and named according to the taxonomic classification of the dominant soils. Within a taxonomic class there are precisely defined limits for the properties of the soils. On the landscape, however, the soils are natural phenomena, and they have the characteristic variability of all natural phenomena. Thus, the range of some observed properties may extend beyond the limits defined for a taxonomic class. Areas of soils of a single taxonomic class rarely, if ever, can be mapped without including areas of other taxonomic classes. Consequently, every map unit is made up of the soils or miscellaneous areas for which it is named and some minor components that belong to taxonomic classes other than those of the major soils.
Most minor soils have properties similar to those of the dominant soil or soils in the map unit, and thus they do not affect use and management. These are called noncontrasting, or similar, components. They may or may not be mentioned in a particular map unit description. Other minor components, however, have properties and behavioral characteristics divergent enough to affect use or to require different management. These are called contrasting, or dissimilar, components. They generally are in small areas and could not be mapped separately because of the scale used. Some small areas of strongly contrasting soils or miscellaneous areas are identified by a special symbol on the maps. If included in the database for a given area, the contrasting minor components are identified in the map unit descriptions along with some characteristics of each. A few areas of minor components may not have been observed, and consequently they are not mentioned in the descriptions, especially where the pattern was so complex that it was impractical to make enough observations to identify all the soils and miscellaneous areas on the landscape.
The presence of minor components in a map unit in no way diminishes the usefulness or accuracy of the data. The objective of mapping is not to delineate pure taxonomic classes but rather to separate the landscape into landforms or landform segments that have similar use and management requirements. The delineation of such segments on the map provides sufficient information for the development of resource plans. If intensive use of small areas is planned, however,
Custom Soil Resource Report
11

onsite investigation is needed to define and locate the soils and miscellaneous areas.
An identifying symbol precedes the map unit name in the map unit descriptions. Each description includes general facts about the unit and gives important soil properties and qualities.
Soils that have profiles that are almost alike make up a soil series. Except for differences in texture of the surface layer, all the soils of a series have major horizons that are similar in composition, thickness, and arrangement.
Soils of one series can differ in texture of the surface layer, slope, stoniness, salinity, degree of erosion, and other characteristics that affect their use. On the basis of such differences, a soil series is divided into soil phases. Most of the areas shown on the detailed soil maps are phases of soil series. The name of a soil phase commonly indicates a feature that affects use or management. For example, Alpha silt loam, 0 to 2 percent slopes, is a phase of the Alpha series.
Some map units are made up of two or more major soils or miscellaneous areas. These map units are complexes, associations, or undifferentiated groups.
A complex consists of two or more soils or miscellaneous areas in such an intricate pattern or in such small areas that they cannot be shown separately on the maps. The pattern and proportion of the soils or miscellaneous areas are somewhat similar in all areas. Alpha-Beta complex, 0 to 6 percent slopes, is an example.
An association is made up of two or more geographically associated soils or miscellaneous areas that are shown as one unit on the maps. Because of present or anticipated uses of the map units in the survey area, it was not considered practical or necessary to map the soils or miscellaneous areas separately. The pattern and relative proportion of the soils or miscellaneous areas are somewhat similar. Alpha-Beta association, 0 to 2 percent slopes, is an example.
An undifferentiated group is made up of two or more soils or miscellaneous areas that could be mapped individually but are mapped as one unit because similar interpretations can be made for use and management. The pattern and proportion of the soils or miscellaneous areas in a mapped area are not uniform. An area can be made up of only one of the major soils or miscellaneous areas, or it can be made up of all of them. Alpha and Beta soils, 0 to 2 percent slopes, is an example.
Some surveys include miscellaneous areas. Such areas have little or no soil material and support little or no vegetation. Rock outcrop is an example.
Custom Soil Resource Report
12

Norfolk and Suffolk Counties, Massachusetts
603—Urban land, wet substratum, 0 to 3 percent slopes
Map Unit SettingNational map unit symbol: vkylMean annual precipitation: 32 to 50 inchesMean annual air temperature: 45 to 50 degrees FFrost-free period: 120 to 200 daysFarmland classification: Not prime farmland
Map Unit CompositionUrban land: 85 percentMinor components: 15 percentEstimates are based on observations, descriptions, and transects of the mapunit.
Description of Urban Land
SettingParent material: Excavated and filled land over herbaceous organic material
and/or alluvium and/or marine deposits
Minor Components
UdorthentsPercent of map unit: 13 percentHydric soil rating: Unranked
BeachesPercent of map unit: 2 percentHydric soil rating: Unranked
628C—Canton-Urban land complex, 3 to 15 percent slopes
Map Unit SettingNational map unit symbol: vktbElevation: 0 to 1,000 feetMean annual precipitation: 32 to 54 inchesMean annual air temperature: 43 to 54 degrees FFrost-free period: 120 to 240 daysFarmland classification: Not prime farmland
Map Unit CompositionCanton and similar soils: 70 percentUrban land: 20 percentMinor components: 10 percentEstimates are based on observations, descriptions, and transects of the mapunit.
Custom Soil Resource Report
13

Description of Canton
SettingLandform: Ice-contact slopesLandform position (two-dimensional): ShoulderLandform position (three-dimensional): Side slopeDown-slope shape: ConvexAcross-slope shape: ConvexParent material: Friable coarse-loamy eolian deposits over loose sandy and
gravelly ablation till
Typical profileH1 - 0 to 3 inches: fine sandy loamH2 - 3 to 18 inches: fine sandy loamH3 - 18 to 60 inches: gravelly loamy sand
Properties and qualitiesSlope: 3 to 8 percentDepth to restrictive feature: 18 to 36 inches to strongly contrasting textural
stratificationDrainage class: Well drainedRunoff class: LowCapacity of the most limiting layer to transmit water (Ksat): High (2.00 to 6.00
in/hr)Depth to water table: More than 80 inchesFrequency of flooding: NoneFrequency of ponding: NoneAvailable water capacity: Very low (about 2.7 inches)
Interpretive groupsLand capability classification (irrigated): None specifiedLand capability classification (nonirrigated): 2eHydrologic Soil Group: AEcological site: F144AY034CT - Well Drained Till UplandsHydric soil rating: No
Description of Urban Land
SettingParent material: Excavated and filled land
Minor Components
MontaukPercent of map unit: 4 percentHydric soil rating: No
ScituatePercent of map unit: 2 percentHydric soil rating: No
CharltonPercent of map unit: 2 percentHydric soil rating: No
UdorthentsPercent of map unit: 2 percentHydric soil rating: Unranked
Custom Soil Resource Report
14
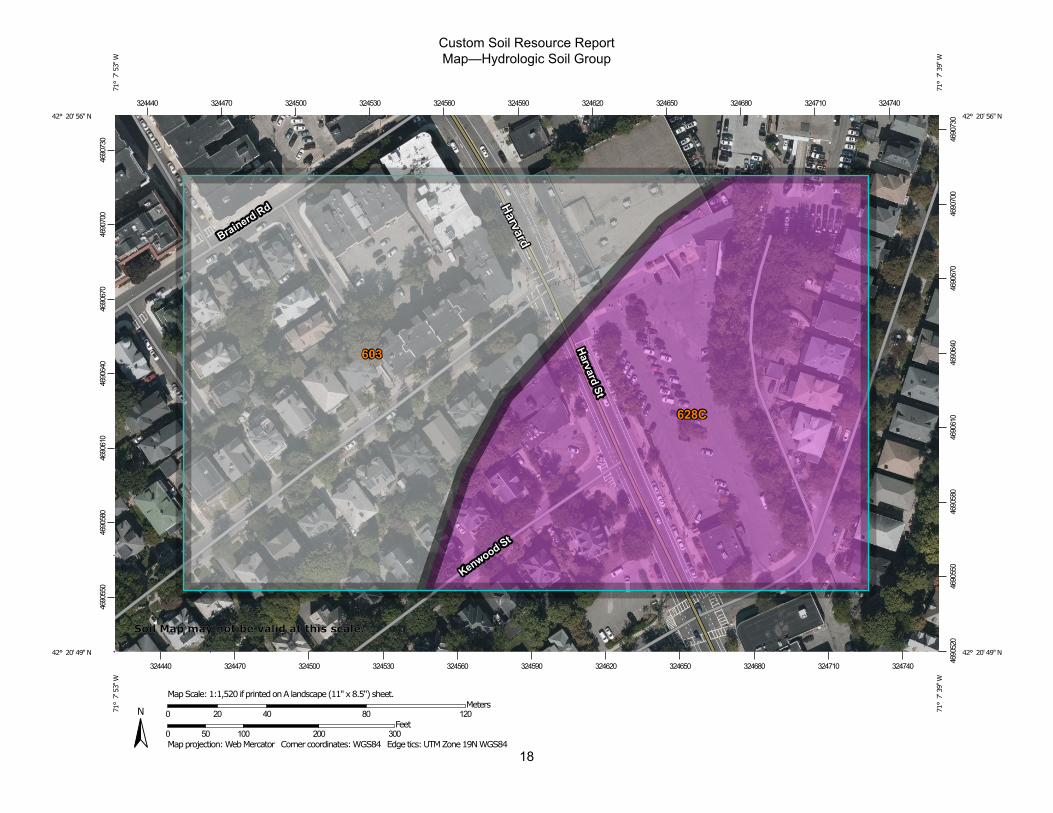
18
Custom Soil Resource ReportMap—Hydrologic Soil Group
4690
550
4690
580
4690
610
4690
640
4690
670
4690
700
4690
730
4690
520
4690
550
4690
580
4690
610
4690
640
4690
670
4690
700
4690
730
324440 324470 324500 324530 324560 324590 324620 324650 324680 324710 324740
324440 324470 324500 324530 324560 324590 324620 324650 324680 324710 324740
42° 20' 56'' N71
° 7
' 53'
' W42° 20' 56'' N
71° 7
' 39'
' W
42° 20' 49'' N
71° 7
' 53'
' W
42° 20' 49'' N
71° 7
' 39'
' W
N
Map projection: Web Mercator Corner coordinates: WGS84 Edge tics: UTM Zone 19N WGS840 50 100 200 300
Feet0 20 40 80 120
MetersMap Scale: 1:1,520 if printed on A landscape (11" x 8.5") sheet.
Soil Map may not be valid at this scale.

MAP LEGEND MAP INFORMATION
Area of Interest (AOI)Area of Interest (AOI)
SoilsSoil Rating Polygons
A
A/D
B
B/D
C
C/D
D
Not rated or not available
Soil Rating LinesA
A/D
B
B/D
C
C/D
D
Not rated or not available
Soil Rating PointsA
A/D
B
B/D
C
C/D
D
Not rated or not available
Water FeaturesStreams and Canals
TransportationRails
Interstate Highways
US Routes
Major Roads
Local Roads
BackgroundAerial Photography
The soil surveys that comprise your AOI were mapped at 1:25,000.
Warning: Soil Map may not be valid at this scale.
Enlargement of maps beyond the scale of mapping can cause misunderstanding of the detail of mapping and accuracy of soil line placement. The maps do not show the small areas of contrasting soils that could have been shown at a more detailed scale.
Please rely on the bar scale on each map sheet for map measurements.
Source of Map: Natural Resources Conservation ServiceWeb Soil Survey URL: Coordinate System: Web Mercator (EPSG:3857)
Maps from the Web Soil Survey are based on the Web Mercator projection, which preserves direction and shape but distorts distance and area. A projection that preserves area, such as the Albers equal-area conic projection, should be used if more accurate calculations of distance or area are required.
This product is generated from the USDA-NRCS certified data as of the version date(s) listed below.
Soil Survey Area: Norfolk and Suffolk Counties, MassachusettsSurvey Area Data: Version 16, Jun 11, 2020
Soil map units are labeled (as space allows) for map scales 1:50,000 or larger.
Date(s) aerial images were photographed: Sep 11, 2019—Oct 5, 2019
The orthophoto or other base map on which the soil lines were compiled and digitized probably differs from the background imagery displayed on these maps. As a result, some minor shifting of map unit boundaries may be evident.
Custom Soil Resource Report
19

Table—Hydrologic Soil Group
Map unit symbol Map unit name Rating Acres in AOI Percent of AOI
603 Urban land, wet substratum, 0 to 3 percent slopes
5.9 51.8%
628C Canton-Urban land complex, 3 to 15 percent slopes
A 5.5 48.2%
Totals for Area of Interest 11.5 100.0%
Rating Options—Hydrologic Soil Group
Aggregation Method: Dominant Condition
Component Percent Cutoff: None Specified
Tie-break Rule: Higher
Custom Soil Resource Report
20


Allen & Major Associates, Inc. Computation Sheet
Title By DMR
Project 500 Harvard Street, Brookline, MA Chk'd CMQ
Date Issued October 8, 2020 Apprv'd CMQ
Revised January 29, 2021
Stormwater Recharge/Water Quality Volume Table
V WQ = Required Water Quality Treatment Volume (ft3
)
D WQ = Water Quality Depth (in)
W'SHED Area (Sq. Ft) Landscaped HSG A (F=.65) HSG B (F=.35)
P-1A 2,254 0 2,254 0 0.650 2,254 122 0.5 94
P-1B 3,814 0 3,814 0 0.650 3,814 207 0.5 159
P-2 495 475 20 0 0.650 20 1 0.5 1
P-3 406 0 406 0 0.650 406 22 0.5 17
Total 6,969 475 6,494 3 352 271
V WQ D WQ (Inch)
A IMP = Impervious Area (excluding non-metal roofs)
Impervious Area (Square Feet)
MA DEP Standard Calculations
Rv = F * Impervious Area
Rv = Required Recharge Volume, expressed in ft3
, cubic yards or acre-feet
F = Target Depth Factor associated with each Hydraulic Soil Group
Impervious Area = pavement & rooftop area on site
F Avg. (Inches)
Water Quality Volume Required
Rv (ft3
)
Impervious Area
(Sq. Ft)
Recharge Required
Page 1 of 4


Allen & Major Associates, Inc. Computation Sheet
Title By DMR
Project 500 Harvard Street, Brookline, MA Chk'd CMQ
Date Issued October 8, 2020 Apprv'd CMQ
Revised January 29, 2021
MA DEP Standard Calculations
Stormwater Recharge Summary
Required (cf) Provided (cf)Rv = 352 492
Rv = 352 492
Water Quality Volume
V WQ = Required Water Quality Treatment Volume, expressed in ft3
D WQ = Water Quality Depth
A IMP = Impervious Area (pavement & rooftop area excluding non-metal roofs)
Required (cf) Provided (cf)V WQ = 271 492
V WQ = 271 492
Underground Infiltration System #1 (Contributing Watershed P-1A)
Underground Infiltration System #1 (Contributing Watershed P-1A)
Total
Rv = Required Recharge Volume, expressed in ft3
, cubic yards or acre-feet
Rv = F * Impervious Area
Total
F = Target Depth Factor associated with each Hydraulic Soil Group
Page 2 of 4


Allen & Major Associates, Inc. Computation Sheet
Title By DMR
Project 500 Harvard Street, Brookline, MA Chk'd CMQ
Date Issued October 8, 2020 Apprv'd CMQ
Revised January 29, 2021
MA DEP Standard Calculations
Draindown Within 72 HoursTimedrawdown=(Rv) (1/Design Infiltration Rate in inches per hour) (Conversion for inches to feet) (1/bottom area in feet)
1.4
264
492
15.75
Infiltration Volume (ft3) =
Bottom Area (ft2) =
Underground Infiltration System #1 (HSG-A, Sand)
Infiltration Rate (in/Hr)=
Timedrawdown (Hours)=
Page 3 of 4


Allen & Major Associates, Inc. Computation Sheet
Title By DMR
Project 500 Harvard Street, Brookline, MA Chk'd CMQ
Date Issued October 8, 2020 Apprv'd CMQ
Revised January 29, 2021
MA DEP Standard Calculations
Water Table System Bottom Vertical Separation Attenuated System
38.00* 40.00 4.0 No No
*Assumed ESHGWT to be verified in field with test pits in infiltration system footprint prior to construction
Mounding Analysis RequiredInfiltration System
1
Mounding Analysis
Page 4 of 4


N:Projects/001-01/Forms/Affidav/Const.doc
Illicit Discharge Compliance Statement
Responsibility:
The Owner is responsible for ultimate compliance with all provisions of the Massachusetts Stormwater
Management Policy, the USEPA NPDES Construction General Permit and responsible for identifying
and eliminating illicit discharges (as defined by the USEPA).
OWNER NAME: Allied Capital Properties
ADDRESS: 1368 Beacon Street, Suite 109
Brookline, MA 02446
TEL. NUMBER: (617) 842-8889
Engineer’s Compliance Statement:
To the best of my knowledge, the attached plans, computations and specifications meet the requirements
of Standard 10 of the Massachusetts Stormwater Handbook regarding illicit discharges to the stormwater
management system and that no detectable illicit discharges exist on the site. All documents and
attachments were prepared under my direction and qualified personnel properly gathered and evaluated
the information submitted, to the best of my knowledge.
Included with this statement are site plans, drawn to scale, that identify the location of systems for
conveying stormwater on the site and show that these systems do not allow the entry of any illicit
discharges into the stormwater management system. The plans also show any systems for conveying
wastewater and/or groundwater on the site and show that there are no connections between the
stormwater and wastewater systems.
For a redevelopment project (if applicable), all actions taken to identify and remove illicit discharges,
including without limitation, visual screening, dye or smoke testing, and the removal of any sources of
illicit discharges to the stormwater management system are documented and included with this statement.


Section 6.0 Site Plans
6 WATERSHED PLANS
EWS EXISTING WATERSHED PLAN
PWS PROPOSED WATERSHED PLAN
C-102 GRADING AND DRAINAGE PLAN