Drag And Drop Graphical User Interface For Process … · Drag-and-Drop Graphical User Interface...
15
AC 2008-2602: DRAG-AND-DROP GRAPHICAL USER INTERFACE FOR PROCESS CONTROL EDUCATION Ruben Morales-Menendez, Tecnologico de Monterrey Tomas Lopez , Tecnologico de Monterrey Ricardo Ramirez Medoza, Institute Tecnologico De Monterrey Luis E Garza, Tecnologico de Monterrey © American Society for Engineering Education, 2008 Page 13.451.1
-
Upload
vuongthuan -
Category
Documents
-
view
231 -
download
0
Transcript of Drag And Drop Graphical User Interface For Process … · Drag-and-Drop Graphical User Interface...
AC 2008-2602: DRAG-AND-DROP GRAPHICAL USER INTERFACE FORPROCESS CONTROL EDUCATION
Ruben Morales-Menendez, Tecnologico de Monterrey
Tomas Lopez , Tecnologico de Monterrey
Ricardo Ramirez Medoza, Institute Tecnologico De Monterrey
Luis E Garza, Tecnologico de Monterrey
© American Society for Engineering Education, 2008
Page 13.451.1
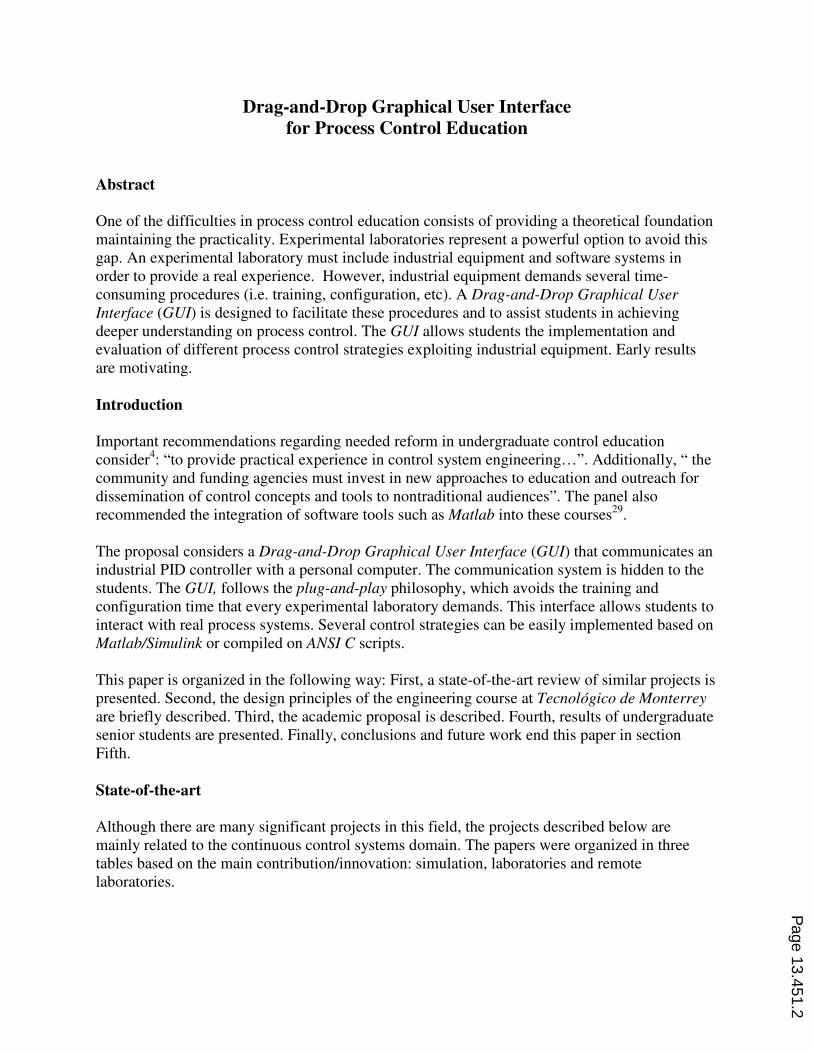
Drag-and-Drop Graphical User Interface
for Process Control Education
Abstract
One of the difficulties in process control education consists of providing a theoretical foundation
maintaining the practicality. Experimental laboratories represent a powerful option to avoid this
gap. An experimental laboratory must include industrial equipment and software systems in
order to provide a real experience. However, industrial equipment demands several time-
consuming procedures (i.e. training, configuration, etc). A Drag-and-Drop Graphical User
Interface (GUI) is designed to facilitate these procedures and to assist students in achieving
deeper understanding on process control. The GUI allows students the implementation and
evaluation of different process control strategies exploiting industrial equipment. Early results
are motivating.
Introduction
Important recommendations regarding needed reform in undergraduate control education
consider4: “to provide practical experience in control system engineering…”. Additionally, “ the
community and funding agencies must invest in new approaches to education and outreach for
dissemination of control concepts and tools to nontraditional audiences”. The panel also
recommended the integration of software tools such as Matlab into these courses29
.
The proposal considers a Drag-and-Drop Graphical User Interface (GUI) that communicates an
industrial PID controller with a personal computer. The communication system is hidden to the
students. The GUI, follows the plug-and-play philosophy, which avoids the training and
configuration time that every experimental laboratory demands. This interface allows students to
interact with real process systems. Several control strategies can be easily implemented based on
Matlab/Simulink or compiled on ANSI C scripts.
This paper is organized in the following way: First, a state-of-the-art review of similar projects is
presented. Second, the design principles of the engineering course at Tecnológico de Monterrey
are briefly described. Third, the academic proposal is described. Fourth, results of undergraduate
senior students are presented. Finally, conclusions and future work end this paper in section
Fifth.
State-of-the-art
Although there are many significant projects in this field, the projects described below are
mainly related to the continuous control systems domain. The papers were organized in three
tables based on the main contribution/innovation: simulation, laboratories and remote
laboratories.
Page 13.451.2
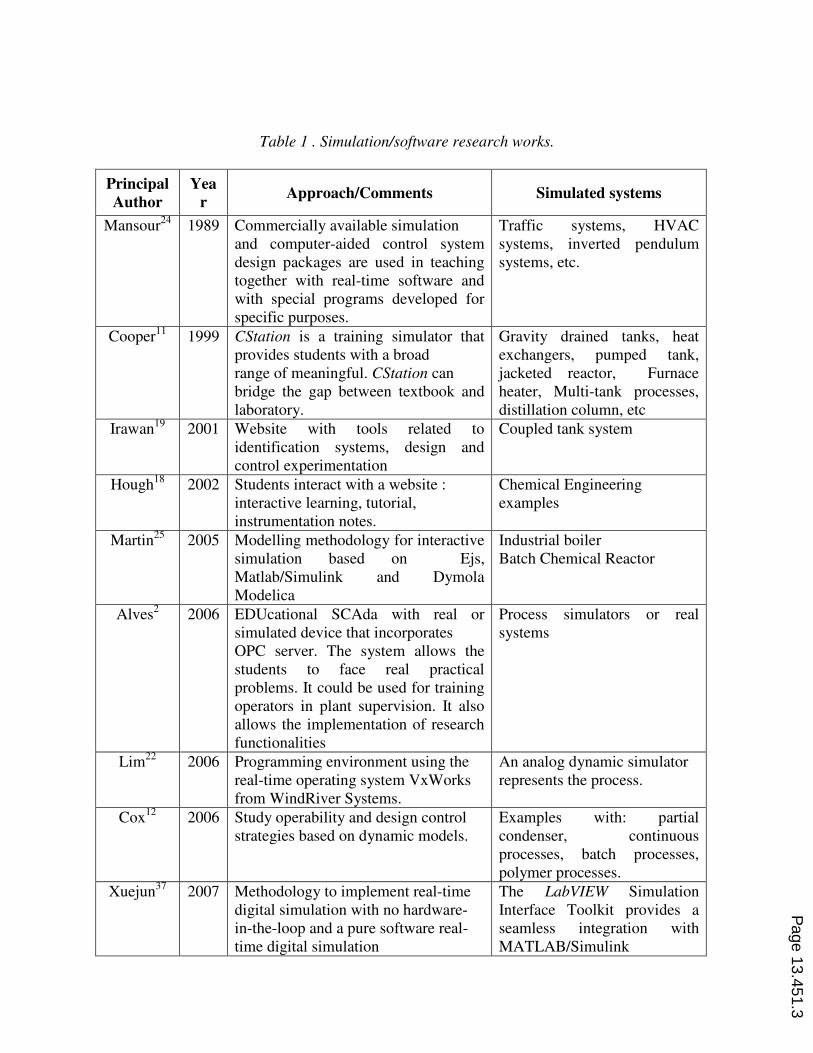
Table 1 . Simulation/software research works.
Principal
Author
Yea
r Approach/Comments Simulated systems
Mansour24
1989 Commercially available simulation
and computer-aided control system
design packages are used in teaching
together with real-time software and
with special programs developed for
specific purposes.
Traffic systems, HVAC
systems, inverted pendulum
systems, etc.
Cooper11
1999 CStation is a training simulator that
provides students with a broad
range of meaningful. CStation can
bridge the gap between textbook and
laboratory.
Gravity drained tanks, heat
exchangers, pumped tank,
jacketed reactor, Furnace
heater, Multi-tank processes,
distillation column, etc
Irawan19
2001 Website with tools related to
identification systems, design and
control experimentation
Coupled tank system
Hough18
2002 Students interact with a website :
interactive learning, tutorial,
instrumentation notes.
Chemical Engineering
examples
Martin25
2005 Modelling methodology for interactive
simulation based on Ejs,
Matlab/Simulink and Dymola
Modelica
Industrial boiler
Batch Chemical Reactor
Alves2 2006 EDUcational SCAda with real or
simulated device that incorporates
OPC server. The system allows the
students to face real practical
problems. It could be used for training
operators in plant supervision. It also
allows the implementation of research
functionalities
Process simulators or real
systems
Lim22
2006 Programming environment using the
real-time operating system VxWorks
from WindRiver Systems.
An analog dynamic simulator
represents the process.
Cox12
2006 Study operability and design control
strategies based on dynamic models.
Examples with: partial
condenser, continuous
processes, batch processes,
polymer processes.
Xuejun37
2007 Methodology to implement real-time
digital simulation with no hardware-
in-the-loop and a pure software real-
time digital simulation
The LabVIEW Simulation
Interface Toolkit provides a
seamless integration with
MATLAB/Simulink
Page 13.451.3
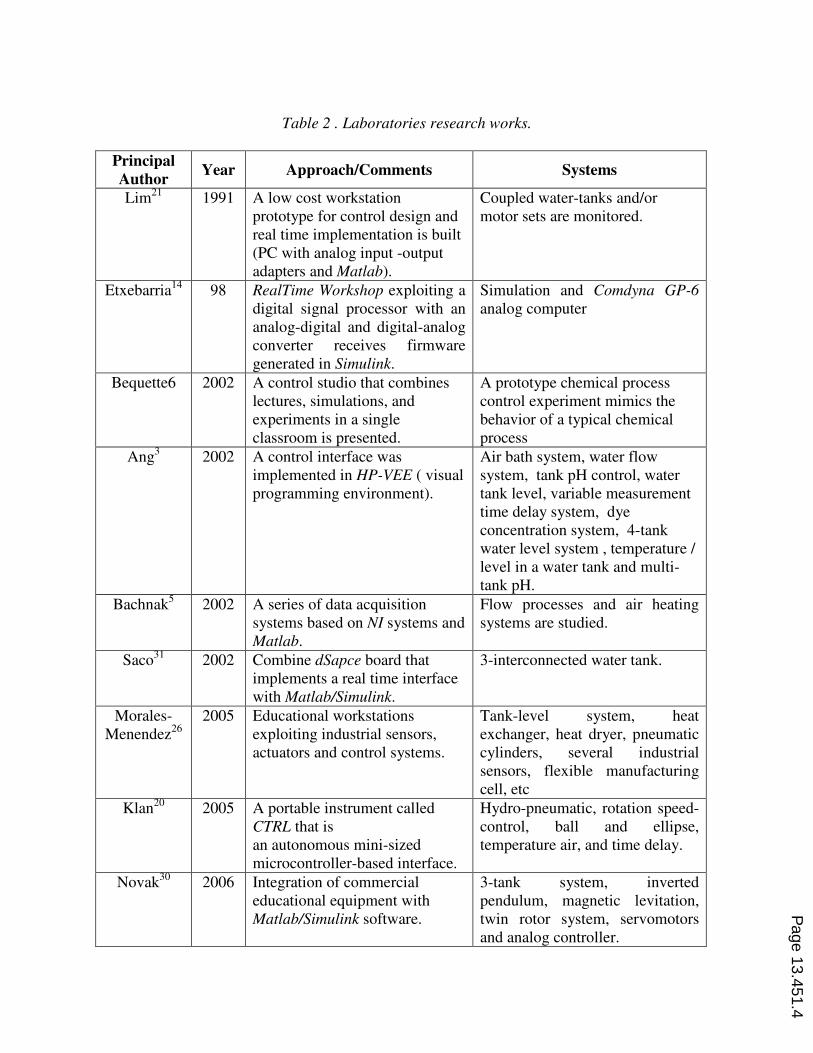
Table 2 . Laboratories research works.
Principal
Author Year Approach/Comments Systems
Lim21
1991 A low cost workstation
prototype for control design and
real time implementation is built
(PC with analog input -output
adapters and Matlab).
Coupled water-tanks and/or
motor sets are monitored.
Etxebarria14
98 RealTime Workshop exploiting a
digital signal processor with an
analog-digital and digital-analog
converter receives firmware
generated in Simulink.
Simulation and Comdyna GP-6
analog computer
Bequette6 2002 A control studio that combines
lectures, simulations, and
experiments in a single
classroom is presented.
A prototype chemical process
control experiment mimics the
behavior of a typical chemical
process
Ang3 2002 A control interface was
implemented in HP-VEE ( visual
programming environment).
Air bath system, water flow
system, tank pH control, water
tank level, variable measurement
time delay system, dye
concentration system, 4-tank
water level system , temperature /
level in a water tank and multi-
tank pH.
Bachnak5 2002 A series of data acquisition
systems based on NI systems and
Matlab.
Flow processes and air heating
systems are studied.
Saco31
2002 Combine dSapce board that
implements a real time interface
with Matlab/Simulink.
3-interconnected water tank.
Morales-
Menendez26
2005 Educational workstations
exploiting industrial sensors,
actuators and control systems.
Tank-level system, heat
exchanger, heat dryer, pneumatic
cylinders, several industrial
sensors, flexible manufacturing
cell, etc
Klan20
2005 A portable instrument called
CTRL that is
an autonomous mini-sized
microcontroller-based interface.
Hydro-pneumatic, rotation speed-
control, ball and ellipse,
temperature air, and time delay.
Novak30
2006 Integration of commercial
educational equipment with
Matlab/Simulink software.
3-tank system, inverted
pendulum, magnetic levitation,
twin rotor system, servomotors
and analog controller.
Page 13.451.4
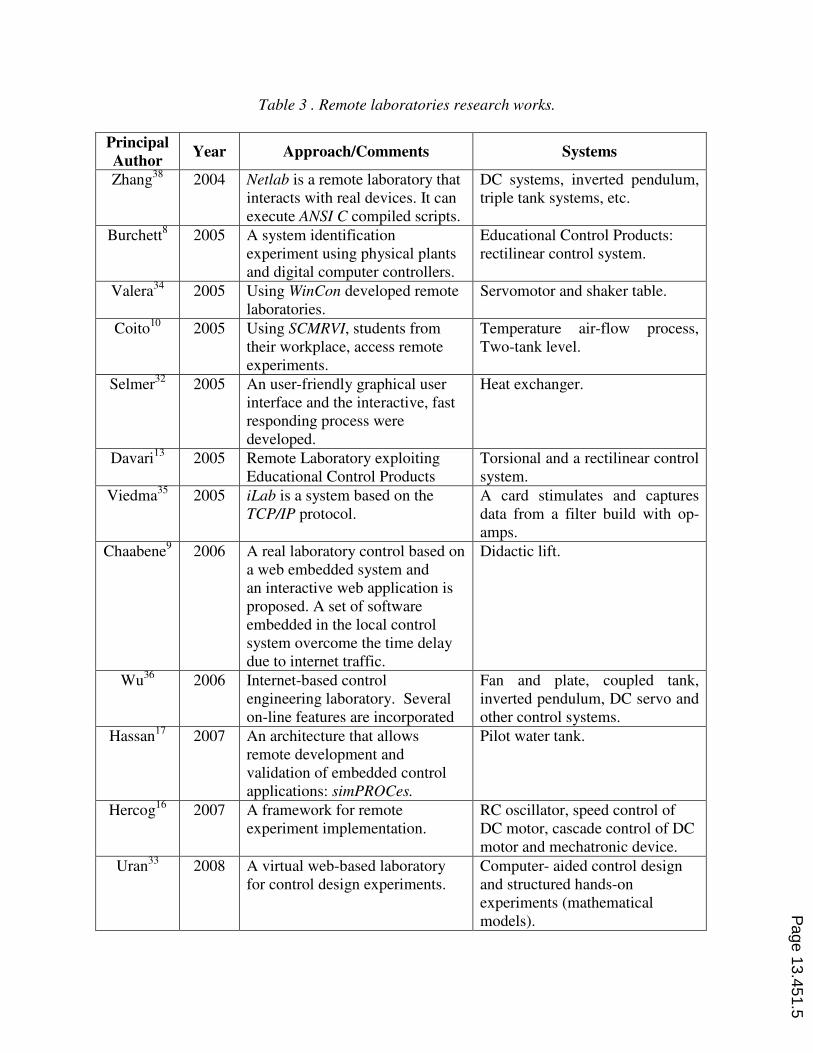
Table 3 . Remote laboratories research works.
Principal
Author Year Approach/Comments Systems
Zhang38
2004 Netlab is a remote laboratory that
interacts with real devices. It can
execute ANSI C compiled scripts.
DC systems, inverted pendulum,
triple tank systems, etc.
Burchett8 2005 A system identification
experiment using physical plants
and digital computer controllers.
Educational Control Products:
rectilinear control system.
Valera34
2005 Using WinCon developed remote
laboratories.
Servomotor and shaker table.
Coito10
2005 Using SCMRVI, students from
their workplace, access remote
experiments.
Temperature air-flow process,
Two-tank level.
Selmer32
2005 An user-friendly graphical user
interface and the interactive, fast
responding process were
developed.
Heat exchanger.
Davari13
2005 Remote Laboratory exploiting
Educational Control Products
Torsional and a rectilinear control
system.
Viedma35
2005 iLab is a system based on the
TCP/IP protocol.
A card stimulates and captures
data from a filter build with op-
amps.
Chaabene9 2006 A real laboratory control based on
a web embedded system and
an interactive web application is
proposed. A set of software
embedded in the local control
system overcome the time delay
due to internet traffic.
Didactic lift.
Wu36
2006 Internet-based control
engineering laboratory. Several
on-line features are incorporated
Fan and plate, coupled tank,
inverted pendulum, DC servo and
other control systems.
Hassan17
2007 An architecture that allows
remote development and
validation of embedded control
applications: simPROCes.
Pilot water tank.
Hercog16
2007 A framework for remote
experiment implementation.
RC oscillator, speed control of
DC motor, cascade control of DC
motor and mechatronic device.
Uran33
2008 A virtual web-based laboratory
for control design experiments.
Computer- aided control design
and structured hands-on
experiments (mathematical
models).
Page 13.451.5
Educational Principles of Design
Two main directions are taken into account for the design of an engineering course at
Tecnológico de Monterrey: the 2015 Mission and the Accreditation Board of Engineering and
Technology (ABET1) criteria.
Based on a wide survey with industry leaders, students, faculty members, and ex-alumni the new
2015 mission of the Tecnológico de Monterrey is to prepare students and transfer knowledge: (1)
to promote the international competitiveness of business enterprises based on knowledge,
innovation, technological development, and sustainable development, … with this mission
(among other objectives), the Tecnológico de Monterrey and its community are committed to
contribute to the educational, social, economic, and political improvement of México.
ABET1
is a well known recognized accreditor for college and university programs in applied
science, computing, engineering, and technology. ABET criteria effective for evaluations during
the 2006-2007 accreditation cycle states that engineering programs must demonstrate that their
students attain several outcomes (Criterion 3). Through this project, (b) and (e) outcomes will be
specifically promoted: (b) ability to design and conduct experiments, as well as to analyze and
interpret data, and (e) ability to identify, formulate, and solve engineering problems.
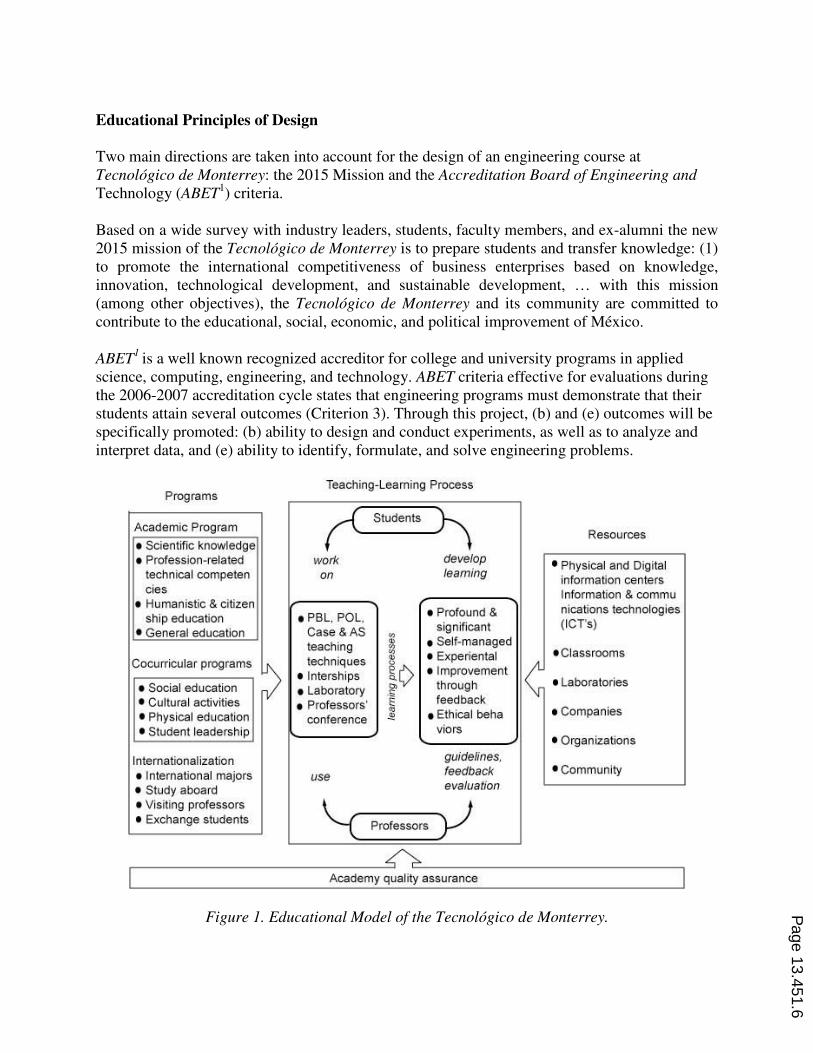
Figure 1. Educational Model of the Tecnológico de Monterrey.
Page 13.451.6
Following these directions, an educational model was developed at the Tecnológico de
Monterrey, Figure 1. This educational model has been characterized by its richness on
information technologies (i.e. Blackboard suite7) and the systematic incorporation of teaching
techniques.
Students assume an active role in their learning process and build knowledge on the basis of their
own experience and by reflecting on the same, under the direction and guidance of their
professors.
Professors rely on teaching techniques that enrich students’ curricular education on the basis of a
practical, professional approach achieved through teamwork and active participation. Some of
the teaching techniques are: the case method, project-oriented learning, problem-based learning,
collaborative learning, and other techniques centered on active learning, such as research-based
learning and learning-service.
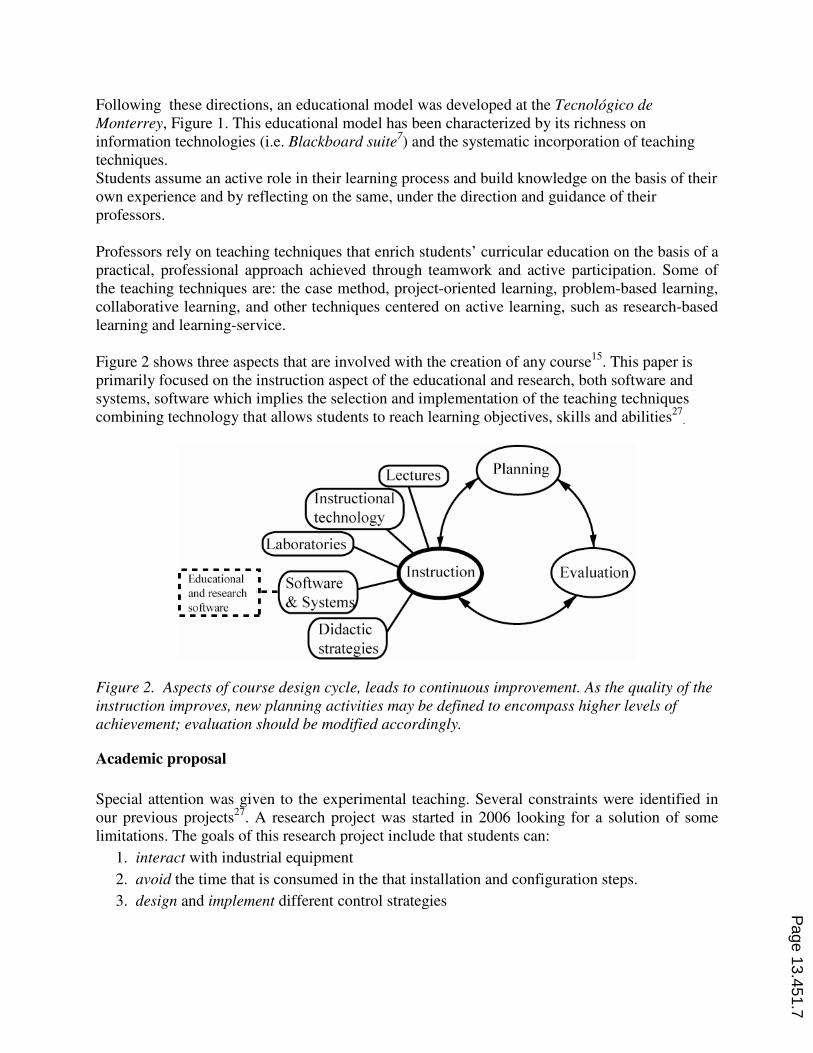
Figure 2 shows three aspects that are involved with the creation of any course15
. This paper is
primarily focused on the instruction aspect of the educational and research, both software and
systems, software which implies the selection and implementation of the teaching techniques
combining technology that allows students to reach learning objectives, skills and abilities27
.
Figure 2. Aspects of course design cycle, leads to continuous improvement. As the quality of the
instruction improves, new planning activities may be defined to encompass higher levels of
achievement; evaluation should be modified accordingly. Academic proposal
Special attention was given to the experimental teaching. Several constraints were identified in
our previous projects27
. A research project was started in 2006 looking for a solution of some
limitations. The goals of this research project include that students can:
1. interact with industrial equipment
2. avoid the time that is consumed in the that installation and configuration steps.
3. design and implement different control strategies
Page 13.451.7
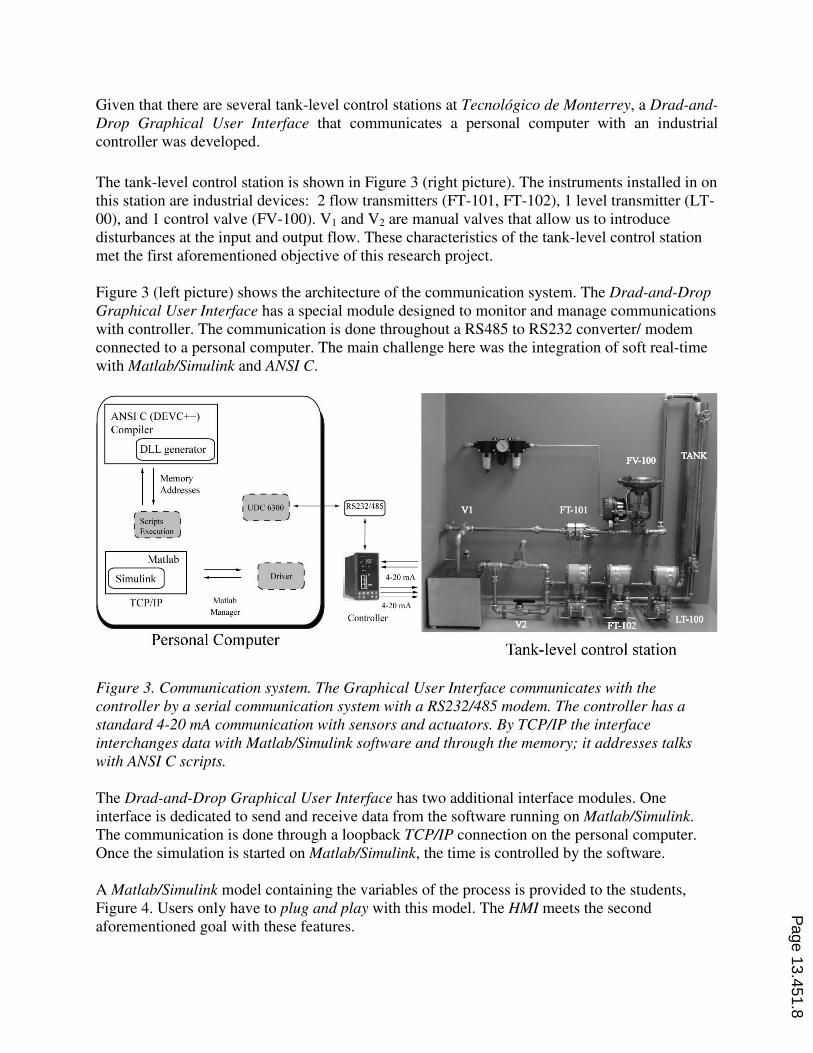
Given that there are several tank-level control stations at Tecnológico de Monterrey, a Drad-and-
Drop Graphical User Interface that communicates a personal computer with an industrial
controller was developed.
The tank-level control station is shown in Figure 3 (right picture). The instruments installed in on
this station are industrial devices: 2 flow transmitters (FT-101, FT-102), 1 level transmitter (LT-
00), and 1 control valve (FV-100). V1 and V2 are manual valves that allow us to introduce
disturbances at the input and output flow. These characteristics of the tank-level control station
met the first aforementioned objective of this research project.
Figure 3 (left picture) shows the architecture of the communication system. The Drad-and-Drop
Graphical User Interface has a special module designed to monitor and manage communications
with controller. The communication is done throughout a RS485 to RS232 converter/ modem
connected to a personal computer. The main challenge here was the integration of soft real-time
with Matlab/Simulink and ANSI C.
Figure 3. Communication system. The Graphical User Interface communicates with the
controller by a serial communication system with a RS232/485 modem. The controller has a
standard 4-20 mA communication with sensors and actuators. By TCP/IP the interface
interchanges data with Matlab/Simulink software and through the memory; it addresses talks
with ANSI C scripts.
The Drad-and-Drop Graphical User Interface has two additional interface modules. One
interface is dedicated to send and receive data from the software running on Matlab/Simulink.
The communication is done through a loopback TCP/IP connection on the personal computer.
Once the simulation is started on Matlab/Simulink, the time is controlled by the software.
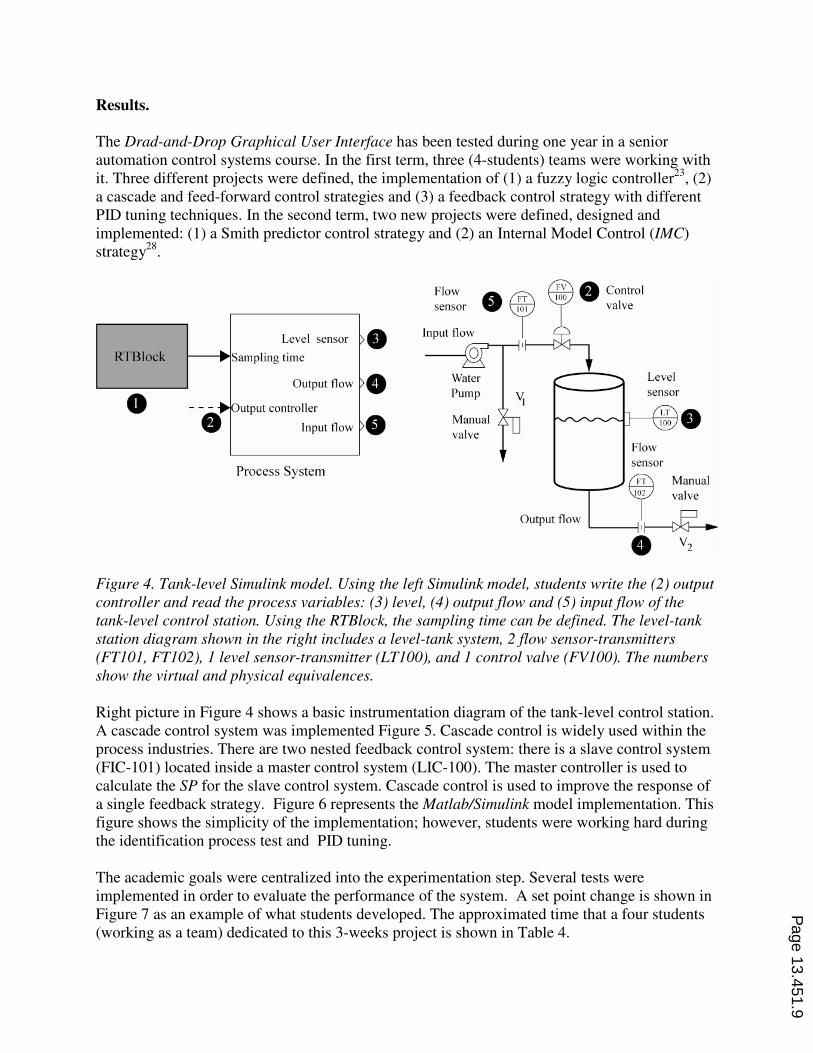
A Matlab/Simulink model containing the variables of the process is provided to the students,
Figure 4. Users only have to plug and play with this model. The HMI meets the second
aforementioned goal with these features.
Page 13.451.8
Results.
The Drad-and-Drop Graphical User Interface has been tested during one year in a senior
automation control systems course. In the first term, three (4-students) teams were working with
it. Three different projects were defined, the implementation of (1) a fuzzy logic controller23
, (2)
a cascade and feed-forward control strategies and (3) a feedback control strategy with different
PID tuning techniques. In the second term, two new projects were defined, designed and
implemented: (1) a Smith predictor control strategy and (2) an Internal Model Control (IMC)
strategy28
.
Figure 4. Tank-level Simulink model. Using the left Simulink model, students write the (2) output
controller and read the process variables: (3) level, (4) output flow and (5) input flow of the
tank-level control station. Using the RTBlock, the sampling time can be defined. The level-tank
station diagram shown in the right includes a level-tank system, 2 flow sensor-transmitters
(FT101, FT102), 1 level sensor-transmitter (LT100), and 1 control valve (FV100). The numbers
show the virtual and physical equivalences.
Right picture in Figure 4 shows a basic instrumentation diagram of the tank-level control station.
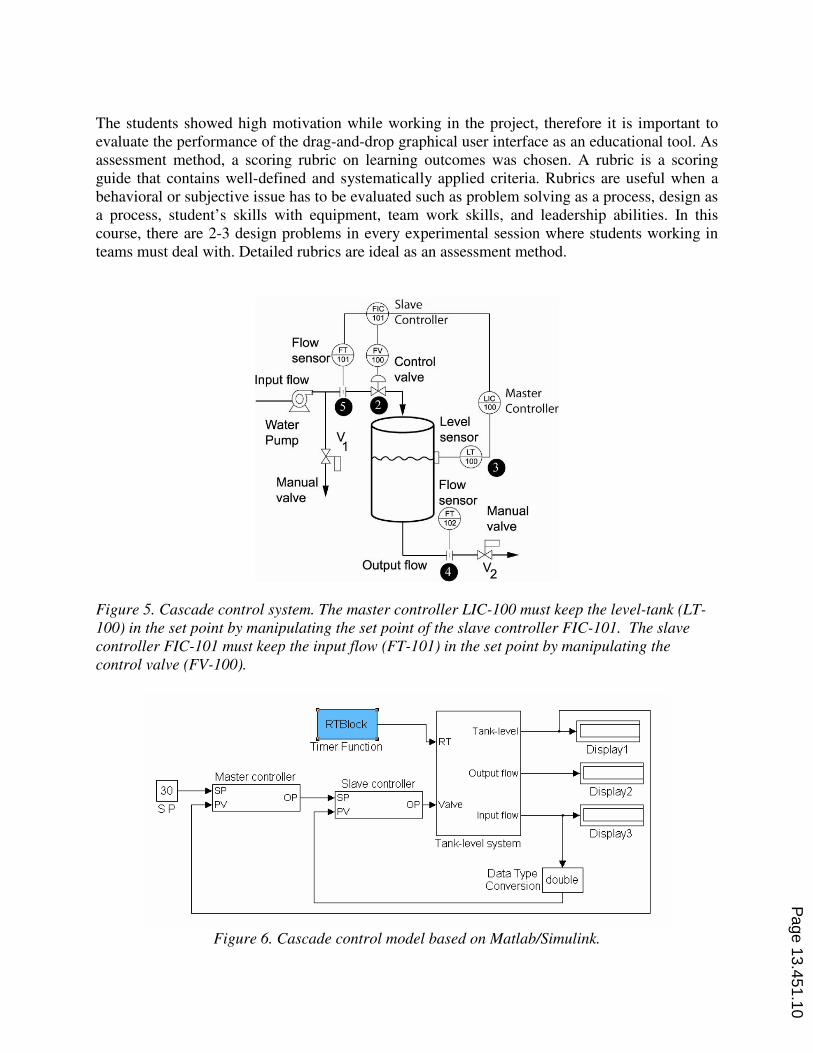
A cascade control system was implemented Figure 5. Cascade control is widely used within the
process industries. There are two nested feedback control system: there is a slave control system
(FIC-101) located inside a master control system (LIC-100). The master controller is used to
calculate the SP for the slave control system. Cascade control is used to improve the response of
a single feedback strategy. Figure 6 represents the Matlab/Simulink model implementation. This
figure shows the simplicity of the implementation; however, students were working hard during
the identification process test and PID tuning.
The academic goals were centralized into the experimentation step. Several tests were
implemented in order to evaluate the performance of the system. A set point change is shown in
Figure 7 as an example of what students developed. The approximated time that a four students
(working as a team) dedicated to this 3-weeks project is shown in Table 4.
Page 13.451.9
The students showed high motivation while working in the project, therefore it is important to
evaluate the performance of the drag-and-drop graphical user interface as an educational tool. As
assessment method, a scoring rubric on learning outcomes was chosen. A rubric is a scoring
guide that contains well-defined and systematically applied criteria. Rubrics are useful when a
behavioral or subjective issue has to be evaluated such as problem solving as a process, design as
a process, student’s skills with equipment, team work skills, and leadership abilities. In this
course, there are 2-3 design problems in every experimental session where students working in
teams must deal with. Detailed rubrics are ideal as an assessment method.
Figure 5. Cascade control system. The master controller LIC-100 must keep the level-tank (LT-
100) in the set point by manipulating the set point of the slave controller FIC-101. The slave
controller FIC-101 must keep the input flow (FT-101) in the set point by manipulating the
control valve (FV-100).
Figure 6. Cascade control model based on Matlab/Simulink.
Page 13.451.10
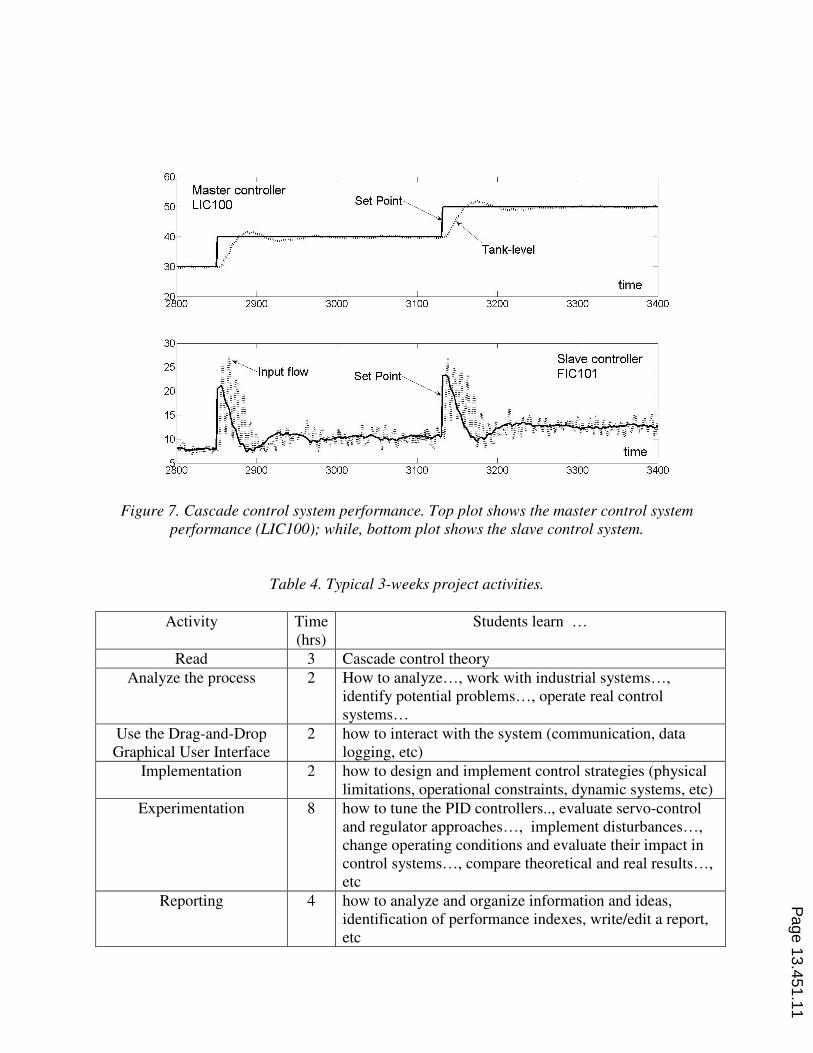
Figure 7. Cascade control system performance. Top plot shows the master control system
performance (LIC100); while, bottom plot shows the slave control system.
Table 4. Typical 3-weeks project activities.
Activity Time
(hrs)
Students learn …
Read 3 Cascade control theory
Analyze the process 2 How to analyze…, work with industrial systems…,
identify potential problems…, operate real control
systems…
Use the Drag-and-Drop
Graphical User Interface
2 how to interact with the system (communication, data
logging, etc)
Implementation 2 how to design and implement control strategies (physical
limitations, operational constraints, dynamic systems, etc)
Experimentation 8 how to tune the PID controllers.., evaluate servo-control
and regulator approaches…, implement disturbances…,
change operating conditions and evaluate their impact in
control systems…, compare theoretical and real results…,
etc
Reporting 4 how to analyze and organize information and ideas,
identification of performance indexes, write/edit a report,
etc
Page 13.451.11
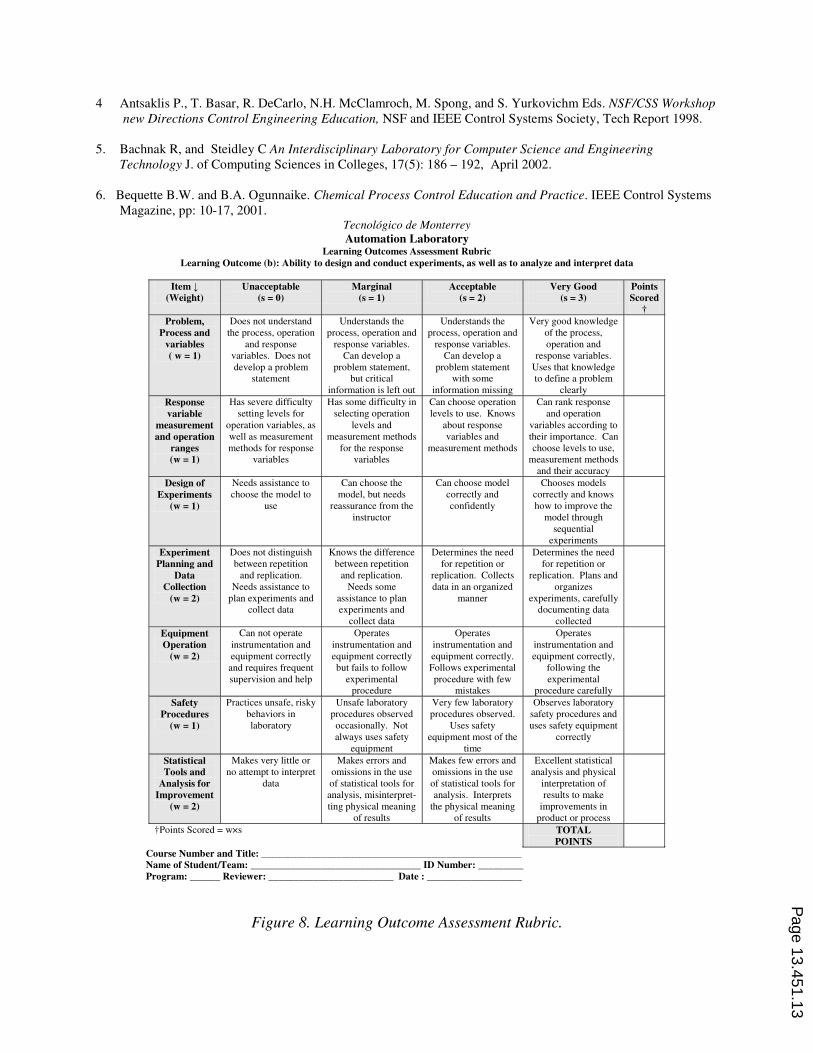
According to ABET1 criteria, Figure 8 shows an example of the Learning Outcome Assessment
Rubric for Learning Outcome (b) Ability to design and conduct experiments, as well as to
analyze and interpret data. With this detailed rubric, each student is assessed in several issues:
(1) Problem, process and variables definition, (2) Response variable measurement and operation
ranges interpretation, (3) Design of experiments, (4) Experiment planning and data collection,
(5) Equipment operation, (6) Safety procedures, and (7) Statistical tools and analysis for
improvement.
Each of previous issues has a specific weight (w), and there is a suggested scale (s) for each
score. Using this matrix, a better feedback can be obtained. However, sometimes it is
recommended to derive a holistic rubric from the detailed rubric. A holistic rubric allows you to
asses different skills of the students for accreditation purposes once or twice rather than on each
experimental session. For example, sometimes writing skills are more important than designing
an experiment or student competencies with laboratory equipment. Certainly, to assess all of the
laboratory skills in each experimental session will be overload for everyone.
Conclusions
This academic proposal helps students to develop and operate real control systems. This
facilitates the teaching/learning for students with no background in electrical or computer
sciences. Also, the gap between theory and practice is eliminated through hands-on laboratory
sessions.
Several skills and abilities are promoted as part of the teaching system. Starting from a real
problem, students can find the context for significant learning and what they need to find and
learn. Working with real problems allows the students to develop concrete abilities. Students,
assuming control over their learning process, may evaluate the results. So, theory may be better
understood, thus facilitating knowledge transference to other contexts.
Future work. Reduction of sampling time is mandatory. The Drag-and-Drop Graphial User
Interface can be improved with an OPC interface. This increases the number of devices to
communicate with; also, the communication system with them will be more reliable.
Acknowledgement
The authors would like to thank Miguel A. Romero-Ogawa for providing tailored rubrics;
Sebastian Aviña for sharing their experimental results.
Bibliography
1. ABET. Criteria for Accrediting Engineering Programs Effective for Evaluations during the 2006-2007
Accreditation Cycle. Technical report, Accreditation Board of Engineering and Technology, 2005.
2. Alves R, J.E Normey, A. Merino, and C. de Prada. EDUSCA (EDUcational SCAda): Features and
Applications. In 7th Adv. in Control Education, Spain, 2006.
3. Ang S., and R.D. Braatz. Experimental Projects for the Process Control Laboratory. Chem. Eng. Edu., 36:182-
187, 2002.
Page 13.451.12
4 Antsaklis P., T. Basar, R. DeCarlo, N.H. McClamroch, M. Spong, and S. Yurkovichm Eds. NSF/CSS Workshop
new Directions Control Engineering Education, NSF and IEEE Control Systems Society, Tech Report 1998.
5. Bachnak R, and Steidley C An Interdisciplinary Laboratory for Computer Science and Engineering
Technology J. of Computing Sciences in Colleges, 17(5): 186 – 192, April 2002.
6. Bequette B.W. and B.A. Ogunnaike. Chemical Process Control Education and Practice. IEEE Control Systems
Magazine, pp: 10-17, 2001. Tecnológico de Monterrey
Automation Laboratory Learning Outcomes Assessment Rubric
Learning Outcome (b): Ability to design and conduct experiments, as well as to analyze and interpret data
Item ↓
(Weight)
Unacceptable
(s = 0)
Marginal
(s = 1)
Acceptable
(s = 2)
Very Good
(s = 3)
Points
Scored
†
Problem,
Process and
variables
( w = 1)
Does not understand
the process, operation
and response
variables. Does not
develop a problem
statement
Understands the
process, operation and
response variables.
Can develop a
problem statement,
but critical
information is left out
Understands the
process, operation and
response variables.
Can develop a
problem statement
with some
information missing
Very good knowledge
of the process,
operation and
response variables.
Uses that knowledge
to define a problem
clearly
Response
variable
measurement
and operation
ranges
(w = 1)
Has severe difficulty
setting levels for
operation variables, as
well as measurement
methods for response
variables
Has some difficulty in
selecting operation
levels and
measurement methods
for the response
variables
Can choose operation
levels to use. Knows
about response
variables and
measurement methods
Can rank response
and operation
variables according to
their importance. Can
choose levels to use,
measurement methods
and their accuracy
Design of
Experiments
(w = 1)
Needs assistance to
choose the model to
use
Can choose the
model, but needs
reassurance from the
instructor
Can choose model
correctly and
confidently
Chooses models
correctly and knows
how to improve the
model through
sequential
experiments
Experiment
Planning and
Data
Collection
(w = 2)
Does not distinguish
between repetition
and replication.
Needs assistance to
plan experiments and
collect data
Knows the difference
between repetition
and replication.
Needs some
assistance to plan
experiments and
collect data
Determines the need
for repetition or
replication. Collects
data in an organized
manner
Determines the need
for repetition or
replication. Plans and
organizes
experiments, carefully
documenting data
collected
Equipment
Operation
(w = 2)
Can not operate
instrumentation and
equipment correctly
and requires frequent
supervision and help
Operates
instrumentation and
equipment correctly
but fails to follow
experimental
procedure
Operates
instrumentation and
equipment correctly.
Follows experimental
procedure with few
mistakes
Operates
instrumentation and
equipment correctly,
following the
experimental
procedure carefully
Safety
Procedures
(w = 1)
Practices unsafe, risky
behaviors in
laboratory
Unsafe laboratory
procedures observed
occasionally. Not
always uses safety
equipment
Very few laboratory
procedures observed.
Uses safety
equipment most of the
time
Observes laboratory
safety procedures and
uses safety equipment
correctly
Statistical
Tools and
Analysis for
Improvement
(w = 2)
Makes very little or
no attempt to interpret
data
Makes errors and
omissions in the use
of statistical tools for
analysis, misinterpret-
ting physical meaning
of results
Makes few errors and
omissions in the use
of statistical tools for
analysis. Interprets
the physical meaning
of results
Excellent statistical
analysis and physical
interpretation of
results to make
improvements in
product or process
†Points Scored = w×s TOTAL
POINTS
Course Number and Title: ____________________________________________________
Name of Student/Team: __________________________________ ID Number: _________
Program: ______ Reviewer: _________________________ Date : ___________________
Figure 8. Learning Outcome Assessment Rubric.
Page 13.451.13
7. Blackboard Academic Suite, www.blackboard.com
8 Burchett B.T. and Layton R.A., An Undergraduate System Identification Experiment, Proceedings of the ACC,
7(8-10) :5145-5149, June 2005.
9. Chaabene M, K. Mkaouar, and R Souissi. A Web-based Control of a Real Laboratory for Process Engineering
Education. In World Automation Congress, Hungry, July 2006.
10. Coito F, Almeida P, and Palma L.B, SMCRVI - a Labview/Matlab based Tool for Remote Monitoring and
Control, ETFA 2005. 10th
IEEE Conference, 2(6):19-22 Sept. 2005.
11. Cooper D.J. and D. Dougherty. Enhancing Process Control Education with the Control Station Training
Simulator. Computer Applications in Engineering Education, (7):203-212, 1999.
12. Cox R.K. , J.F. Smith, and Y. Dimitratos. Can Simulation Technology Enable a Paradigm Shift in Process
Control? Modeling for the rest of us. Computers and Chemical Engineering, 30:1542-1552, 2006.
13. Davari A, and Chandrasekara C. Control experimentation for undergraduate student, Proceedings of the ACC,
7(8-10): 5156-5161, June 2005.
14. Etxebarria V, Lizarraga I, and Alcalde, J. An Integrated Environment for Practical Control Engineering
Course, Int J.of Electrical Eng. Education, 35(1):3-13, Jan 1998.
15. Felder R M, and Brent R Designing a Teaching Courses to Satisfy the ABET Engineering Criteria J. of Eng.
Education, 7-25, 2003.
16. Hercog D., B Gergi·c, S Uran, and K Jezernik. A DSP- Based Remote Control Laboratory. IEEE Trans on
Industrial Electronics, 54(6):3057-3068, 2007.
17. Hassan H., C. Dominguez, J.M. Martinez, and J. Albaladejo. Remote Laboratory Architecture for the Validation
of Industrial Applications Control. IEEE Trans on Industrial Electronics, 54(6):3094-3102, 2007.
18. Hough M, Word E, Yip S, and Marlin T. A Web Site to Support Active Student Learning in Process Control
American Society for Eng. Education. Proceedings of the ASEE 2002 Annual Conference & Exposition, 2002.
19. Irawan R., M. Ooi, G. Yeung, E. Weyer, D. Nesic, and I. I. Mareels. A Virtual Laboratory Experience based
on a Double Tank Apparatus . In 40th
IEEE Conf. on Decision and Control, 3, pp: 2815-2820, 2001.
20. Klan P., M . Hoefreiter, J. Machacek, O. Modrlak, L. Smutny, and V. Vacek. Process Models for a New
Control Education Laboratory. In 16th
IFAC World Congress, pp: 139-144, Prague, Czech Republic, 2005.
21. Lim K W, Ong C T, and Sivagnanam E. Development of a Low Cost Control Workstation, Proceedings.
IECON '91, pp: 1375–1379, Nov 1991. 22. Lim D.J.. A laboratory Course in Real-Time Software for the Control of Dynamic Systems. IEEE Transactions
on Education, 49(3):346-354, 2006.
23 Lopez T, Morales-Menendez, Ramírez R, Guedea F A Human Machine Interface for Teaching Continuous
Control Systems, 27th
IASTED MIC pp 166-171, Austria 2008 .
24. Mansour M, and Schaufelberger W. Software and Laboratory Experiments Using Computers in Control
Education, Control Systems Magazine, IEEE, 9(3):19 – 24 , April 1989.
Page 13.451.14
25. Martin C., A. Urquia, and S. Dormido. Object-Oriented Modeling of Virtual Laboratories for Control
Education, 16th
IFAC World Congress, Prague, Czech Republic 2005.
26. Morales-Menéndez R, Ramirez R, Limón J, Ramírez M de J, Educational Technology at Monterrey Tech Int.
Conf on Computers and Advanced Technology Education, 221-226, Aruba 2005.
27. Morales-Menéndez, R Sánchez Chávez, IY Control Engineering Education at Monterrey Tech. ACC 2006
Minneapolis USA, pp: 286-291. June 2006.
28. Morales-Menéndez, R, Lopez T, Ramírez R, Garza LE Simplifying the Practical Approach of the Process
Control Teaching To appear in 17th
IFAC World Congress Seoul Korea, July 2008.
29. Murray R.M., K.J. Astrom, S.P. Boy, R.W. Brockett, and G. Stein Future Directions in Control in an
Information-rich World IEEE Control Systems Mag. 23(2):20-33,2003.
30. Novak J., P Chalupa, and V Bobal. New Laboratory Course for Control Education. In 7th
Advances in
Control Education, 1, Madrid, Spain, 2006.
31. Saco R, Pires E, and Godfrid C. Real time controlled laboratory plant for control education Frontiers in
Education, FIE 2002. 32nd
Annual, 1, pp:12-16, 2002.
32 Selmer A, Goodson M, Kraft M, Sen S, McNeill V. F, Johnston B, and Colton C, Performing process control
experiments across the Atlantic Chemical Eng. Education, pp:232-237, Summer 2005.
33. Uran S. and K. Jezernik. Virtual Laboratory for Creative Control Design Experiments. IEEE Transactions on
Education, 51(1):69-75, 2008.
34. Valera A, Diez J.L, Valles M, and Albertos P. Virtual and Remote Control Laboratory Development Control
Systems Magazine, IEEE , 25(1):35-39, Feb. 2005.
35 Viedma G, Dancy I.J, and Lundberg K.H., A Web-based linear-systems iLab, Proceedings of the ACC 2005,
7(8-10), pp: 5139-5144, June 2005.
36 Wu H., Y. Yang, W. Qingquan, and S. Zhu. An Internet-based Control Engineering Laboratory for
Undergraduate and Graduate Education. In IEEE Int. Conf.on Automation Science and Eng., pages 546-550.
IEEE,October 2006.
37. Xuejun X., X. Ping, Y. Sheng, and L. Ping. Real-time Digital Simulation of Control System with LabVIEW
Simulation Interface Toolkit. In 26th Chinese Control Conf, pages 318-322, China, July 26-31 2007.
38. Zhang S, Wu H, Lin Q, and Zhu S. Netlab-based Control Experiments for Control Engineering Education,
ICARCV 2004, 3(6-9):2188-2193, Dec. 2004.
Page 13.451.15