
draft... · Web viewGenerally, the expected market growth rate in dividends per share (a key input)...
152
Access arrangement draft decision Envestra Ltd 2013–17 Part 3 Appendices September 2012
Transcript of draft... · Web viewGenerally, the expected market growth rate in dividends per share (a key input)...

Access arrangement draft decisionEnvestra Ltd
2013–17
Part 3Appendices
September 2012

© Commonwealth of Australia 2012
This work is copyright. Apart from any use permitted by the Copyright Act 1968, no part may be reproduced without permission of the Australian Competition and Consumer Commission. Requests and inquiries concerning reproduction and rights should be addressed to the Director Publishing, Australian Competition and Consumer Commission, GPO Box 3131, Canberra ACT 2601.
Contents Contents...............................................................................................i
B Rate of return...............................................................................1
C Real cost escalation....................................................................69
D Terms and conditions – Submissions............................................90
E Outsourcing..............................................................................101
A – Capital expenditure is a confidential appendix
AER draft decision | Envestra 2013–17 | Draft decision appendices i

B Rate of returnIn attachment 4, the AER presented its considerations on why a rate of return of 7.16 per cent (subject to updating) is a preferable alternative that is commensurate with prevailing conditions in the market for funds. It noted this appendix would address some matters including arguments raised by Envestra and further technical analysis of the evidence.
B.1 Risk free rate
In attachment 4.3.2, the AER presented why a risk free rate based on 10 year CGS measured as close as practically possible to the commencement of the regulatory period is the most appropriate.
This appendix discusses additional material relevant to the risk free rate:
the selection of an appropriate averaging period
contentions raised in the CEG report submitted by Envestra
a long term average as an alternative averaging period
the term of the risk free rate
the EnergyAustralia matter
the Telstra matter
the expectations theory on the term structure of interest rates.
Envestra's main contentions for proposing a 'long term' cost of equity
B.1.1The selection of an appropriate averaging period
In attachment 4 the AER noted that there would be further discussion in this appendix of Envestra's proposed averaging period for the cost of debt. This section contains that discussion.
In its access arrangement proposal, Envestra proposed the use of a short averaging period for the cost of debt. But, Envestra did not specify when the averaging period would occur. Envestra stated that it would lodge a separate and confidential request with the AER to agree, prior to the final decision, the averaging period for setting the cost of debt.1 The AER had previously outlined in a letter to Envestra that it considered the nomination of an averaging period an integral part of a complete access arrangement proposal.2
On 5 April 2012, the AER sent a letter to Envestra to formalise an agreement for nominating an averaging period. The AER proposed the following conditions:
1 Envestra, Access arrangement information, March 2012, p. 162. 2 AER, Letter to Envestra, 8 December 2011.
AER draft decision | Envestra 2013–17 | Draft decision appendices 1
1. At the time of publishing Envestra's proposal the AER will publish an indicative timeline for decisions.
2. The AER will notify Envestra, at least 20 business days before and not more than 25 business days before, the release of its draft decision on the revisions to the Envestra access arrangement, of the date on which that draft decision is expected to be released and the date on which the final decision is expected to be released.
3. Not later than 10 business days following the AER's notification, Envestra undertakes to advise the AER of its nominated averaging period. Envestra's nominated averaging period will be for a period commencing after the expected release date of the draft decision and ending not later than 15 business days before the expected release date of the final decision. The advice will specify the term of the averaging period which must be at least 10 and not more than 40 business days.3
On 13 April 2012, Envestra responded that it did not accept that the averaging period be nominated 10 business days after the AER's notification.4 Envestra proposed that the conditions applied in the Envestra South Australia and Queensland draft decision should be applied in this decision.5 On 16 April 2012, the AER sent another letter to inform Envestra that it considered its access arrangement proposal was 'deficient in respect of the averaging period'.6 The AER informed Envestra that it had decided to:
...stop-the-clock for any period taken by Envestra to provide information, relevant to the decision maker's decision on the proposal, in response to a notice or requirement issued by the AER under the law.7
The AER reiterated that the conditions outlined in the 5 April letter would be acceptable.
In a letter dated 27 April 2012 Envestra accepted the conditions, though it did not agree that its proposal was deficient.8 Envestra also noted that:
... Envestra may be required by the National Gas rules and Law to revise the proposed nominated averaging period in the event that is becomes apparent that that period would not result in a rate of return that is commensurate with the prevailing conditions in the market for funds. Any such change would require the occurrence of a significant external event that was not known at the time the proposed averaging period was initially set.
In a letter dated 2 May 2012, the AER responded that it accepted that Envestra would provide an averaging period prior to the release of the draft decision.9
The AER sent a letter to Envestra on 20 August 2012 informing it of the expected release date of the draft and final decisions and requesting the nomination of an averaging period consistent with the conditions outlined in the letter of 5 April.10
3 AER, Letter to Envestra, 5 April 2012.4 Envestra, Letter to the AER, 13 April 2012.5 Envestra accepted the constraint that any nominated averaging period start after the date of
the draft decision and finish no later than 15 business days from the expected release date of the final decision. Envestra, Letter to the AER, 12 April 2012.
6 AER, Letter to Envestra, 16 April 20127 AER Letter to Envestra, 16 April 2012.8 Envestra, Letter to the AER, 26 April 2012.9 AER, Letter to the Envestra, 2 May 201210 AER, Letter to Envestra, 20 August 2012
AER draft decision | Envestra 2013–17 | Draft decision appendices 2
On 31 August 2012, Envestra provided an averaging period on a confidential basis. Envestra's proposed period is consistent with the conditions outlined in the AER's letter dated 5 April 2012. The AER therefore accepts Envestra's proposed averaging period for the cost of debt.
In the 31 August letter, Envestra did not qualify its proposed averaging period for the cost of debt, such as with the additional condition outlined in its letter dated 27 April 2012. However, to the extent that Envestra still presses the condition outlined in the 27 April letter, the AER does not accept that condition. This is because:
Leaving open the right to revise the averaging period would introduce unbalanced incentives. Service providers have an incentive to seek a WACC that is as high as possible, because it will increase their profits. If a service provider can select an averaging period by observing market yields, this may introduce the possibility of upward bias because they could select a period with the highest yield available.11 Service providers would be unlikely to depart from the process where such departure is not in its financial interests.
It is also important for the AER to hold Envestra to the method as proposed. Doing so promotes certainty, consistency and predictability in regulatory decision making.12
It is therefore preferable for there to be no conditions attached to a proposed averaging period. This allows the AER to make a draft decision on the averaging period and it also provides Envestra with certainty so that it can make any necessary financial arrangements. These concerns are also discussed in section 4.3.2.
For the cost of equity, Envestra proposed a long term average estimate of the risk free rate of 5.99 per cent.13 The AER does not approve the method proposed by Envestra for determining the risk free rate for the cost of equity. The AER does not consider that a long term average is likely to produce an appropriate estimate of the risk free rate, as discussed at appendix B.1.3. The AER considers a prevailing risk free rate will produce the most appropriate estimate and is preferable.14
For this draft decision, the AER has used an indicative 20 business day averaging period ending on 10 August. The indicative risk free rate has been applied for both the cost of equity and the cost of debt. For the final decision the risk free rate for both the cost of debt and the cost of equity will be updated to reflect the averaging period proposed by Envestra.
11 Lally, M., Expert Report of Martin Thomas Lally, February 2011, pp. 9-10. Lally's comments in this report were made about a specific approach proposed in the relevant determination but are consistent with the approach taken by the AER in this decision.
12 As noted above, the absence of either an averaging period or a process of nomination from SP AusNet’s proposals was significant enough for the AER to find its proposal deficient. The AER formed the same position in relation to Envestra's and Multinet's proposals.
13 Envestra, Access arrangement information, March 2012, p. 156.14 Section 4.3.2 provides analysis supporting this conclusion.
AER draft decision | Envestra 2013–17 | Draft decision appendices 3

B.1.2CEG contentions
Envestra submitted a report it commissioned from CEG that makes a number of contentions about the risk free rate. This appendix addresses these additional matters. CEG's main contentions specific to the operation of the CGS market appear to be15:
There is unprecedented demand for CGS
There is a shortage of supply of CGS in Australia
The CGS market is out of line with other bond markets in Australia
CGS yields have been volatile over the last few years
The AER considers each of these issues below. In some cases, the AER largely agrees with CEG's observations, whereas in other cases the AER disagrees. However at the outset it is important to highlight that it is unclear to the AER what conclusion CEG seeks to draw from these observations and contentions. CEG does not argue these contentions make CGS an inappropriate proxy for the risk free rate in Australia.
CEG contention: There is unprecedented demand for CGS
Under this contention there appear to be three main arguments:
There is a flight to quality
Demand from non-resident investors is high
Basel III requirements are placing huge demands on the CGS market
Each of these arguments is discussed below.
There is a 'flight to quality'
The AER accepts that there may have been 'flight to quality' periods since the onset of the Global Financial Crisis (GFC) or at least, behaviour that fits that description.
A definition of a flight to quality may include:
Flight to quality episodes involve a combination of extreme risk- or uncertainty-aversion, weaknesses in the balance sheets of key financial intermediaries, and strategic or speculative behavior, that increases credit spreads on all but the safest and most liquid assets.16
There have been periods since the onset of the GFC that could be described as being flight to quality periods. However, the AER does not consider there has been a sustained flight to quality since the onset of the GFC. Glenn Stevens recently made the following comment:
15 CEG, Risk free rate and MRP in the CAPM, March 2012, 20–32. 16 Caballero, R. and Kurlat, P., MIT Department of Economics Working Paper No. 08-21, Flight to
Quality and Bailouts: Policy Remarks and a Literature Review, 9 October 2008, p. 1.
AER draft decision | Envestra 2013–17 | Draft decision appendices 4
We saw one such one bout of anxiety in the middle of this year when financial markets displayed increasing nervousness about the finances of the Spanish banking system and the Spanish sovereign.
The general increase in risk aversion saw yields on bonds issued by some European sovereigns spike higher; while those for Germany, the US and the UK declined to record lows. This flight to safety also saw market yields on Australian government debt decline to the lowest levels since Federation. Meanwhile many European economies saw a further contraction of economic activity and share markets decline sharply.17
A flight to quality would not provide justification to depart from a prevailing estimate of the risk free rate. Demand for highly liquid assets is likely to increase in a flight to quality period.18 This would, all else the same, push the yield on risk free assets down. These actions reflect changes in investor expectations and perceptions of the relative value of a risk free asset and would not undermine the risk free nature of that asset.19
Shortly before RBA Governor Glenn Stevens made the comments above, the RBA provided the following advice:
I therefore remain of the view that CGS yields are the most appropriate measure of a risk-free rate in Australia.20
This suggests that the RBA does not consider a flight to quality period makes CGS an inappropriate proxy for the risk free rate.
Demand from non-resident investors is high
The AER accepts that demand for CGS from non-resident investors has increased over the past few years and non-resident investors now hold a large portion of CGS. This conclusion is supported by the RBA in its advice to the AER:
Within the Australian market, one notable source of demand for risk-free assets has come from non-resident investors, whose holdings of CGS now comprise more than three-quarters of outstanding supply.21
The number of AAA rated sovereigns globally has fallen over the past few years. The Treasury and AOFM note that 'Australia is currently one of only eight sovereigns to have a AAA rating with a stable outlook from all three major credit rating agencies.'22
The AER does not consider an increase in demand for CGS from non-resident investors, and subsequent decline in CGS yields, suggests a short averaging period is inappropriate. In the WACC Review final decision (2009), the AER stated its position that the benchmark firm operates in markets that inevitably include 17 Glenn Stevens, Opening Statement to the House of Representatives - 24 August 2012 - Hansard
script, p. 2. 18 Caballero, R. and Kurlat, P., MIT Department of Economics Working Paper No. 08-21: Flight to
Quality and Bailouts: Policy Remarks and a Literature Review, 9 October 2008, p. 2. 19 Discussed further in section 4.3.2. 20 Reserve Bank of Australia, Letter to the ACCC: The Commonwealth Government Securities
Market, 16 July 2012, p. 1 (RBA, Letter regarding the CGS market, July 2012). 21 RBA, Letter regarding the CGS market, July 2012, p. 1. 22 Australian Treasury and Australian Office of Financial Management, The Commonwealth
Government Securities Market, July 2012, p. 2 (Treasury and AOFM, Letter regarding the CGS Market, July 2012).
AER draft decision | Envestra 2013–17 | Draft decision appendices 5

non-resident investors.23 The Joint Industry Association also considered this to be appropriate in a submission on the topic:
(A)ny empirical domestic data on the risk-free rate, MRP, equity beta and gamma parameters have, or will certainly continue to be influenced by, both domestic and international investors.24
While the WACC Review is not binding in a gas context, the AER continues to hold this view. Increased non-resident ownership of CGS is reasonable in today's global markets. The increase in demand for CGS from non-resident investors is likely to reflect the low risk nature of CGS and the deep and liquid AAA-rated market.
Basel III requirements are placing huge demands on the CGS market
The AER accepts that Basel III requirements are imposing requirements on the way an Authorised Deposit-taking Institution (ADI) manages its risk. However, the AER does not accept that Basel III requirements are placing undue strain on the CGS market.
The effect of the Basel III requirements is to require these institutions to hold quantities of liquid assets on their balance sheet large enough to withstand a 30-day stress scenario.25 CEG argued that these requirements are placing strain on the CGS market.26
CEG also referred to a speech by Guy Debelle, Assistant Governor of the Reserve Bank, in which he describes the creation of the Committed Liquidity Facility.27 CEG submitted that the creation of this facility demonstrates that the CGS market is constrained. CEG stated:
Importantly, Assistant Governor Debelle was clearly expressing the view that the liquidity premium in the CGS market was, in November 2011, at historically very high levels (and seemingly well in excess of 15bp). The implementation of Basel III can be expected to ensure that this remains so in the foreseeable future.28
The Committed Liquidity Facility was in fact created for the very purpose of ensuring the CGS market continues to function well:
Specifically, the creation of a committed liquidity facility (CLF) by the Reserve Bank is intended to prevent a situation in which the liquidity in the CGS market is impaired or in which the premia attached to CGS are increased beyond reasonable levels.29
23 AER, Final decision: Electricity transmission and distribution network service providers: Review of the weighted average cost of capital (WACC) parameters, 1 May 2009, p. 101 (AER, Final Decision: WACC Review, May 2009).
24 Joint Industry Associations (Energy Networks Association, The Australian Pipeline Industry Association Ltd and Grid Australia), Network industry submission: AER Issues Paper, Review of the Weighted Average Cost of Capital (WACC) parameters for electricity transmission and distribution, 24 September 2008, p. 28 (see also pp. 22, 24, 160, 174).
25 G. Debelle (Assistant Governor, Financial Markets, RBA), Speech to the APRA Basel III Implementation Workshop 2011: The Committed Liquidity Facility, 23 November 2011, p. 1 (Debelle, Speech on the committed liquidity facility, November 2011)
26 CEG, Risk free rate and MRP in the CAPM, March 2012, pp. 30-32.27 CEG, Risk free rate and MRP in the CAPM, March 2012, pp. 30-32.28 CEG, Risk free rate and MRP in the CAPM, March 2012, p. 32.29 RBA, Letter regarding the CGS market, July 2012, p. 1.
AER draft decision | Envestra 2013–17 | Draft decision appendices 6

The AER accepts this advice that the CGS market will continue to function well in the presence of Basel III requirements. Furthermore, Assistant Governor Debelle's comments suggest that, over the years prior to the onset of the GFC, the liquidity premium may have been unusually low.30
Advice from the RBA and Treasury in 2007 suggested the use of nominal CGS as a proxy for the risk free rate was appropriate.31 The AER does not consider it appropriate to attempt to determine an average, or 'normal', liquidity premium and only accept prevailing CGS when the observed premium is equal to the 'normal' premium.
The AER has confidence those authorities understand the requirements in their jurisdiction and have put in place adequate measures to address potential concerns. The AER concludes that the current demand for CGS does not undermine its usefulness as a proxy for the risk free rate.
CEG contention: There is a shortage of supply of CGS in Australia
The AER does not accept that there is a shortage of supply of CGS in Australia. Consequently, the AER does not accept that there is a 'scarcity premium' included in CGS yields.
As discussed in attachment 4.3.2 above, the Australian Government has a stated position recognising the need to ensure sufficient CGS are available to maintain liquidity in the market.32
CEG made the following statement:
This shortage of CGS is well understood to have resulted in a scarcity premium for CGS in recent years - and hance a depressed yield.33
CEG provided no empirical evidence of a shortage of supply in the CGS market. CEG also did not discuss how a shortage of supply might be defined or investigated. CEG refer to a quote from Assistant Governor Debelle that 'government paper has been in short supply for many years.' CEG appear to suggest that Assistant Governor Debelle is suggesting that government paper is currently in short supply and that this is commonly understood. For the following reasons, the AER does not consider this to be an accurate suggestion.
Assistant Governor Debelle's comments were made in the context of estimating a historical average liquidity premium that necessarily included the period before the onset of the GFC. CGS were in relatively lower supply at that time.34 Contrary to CEG's assertion, it does not follow that the supply of CGS is currently low or that prevailing CGS yields are an inappropriate proxy for the risk free rate.
30 Debelle, Speech on the committed liquidity facility, November 2011, p. 2. 31 RBA, Letter to the AER, August 2007, p. 1; Australian Treasury, The Treasury Bond yield as a
proxy for the CAPM risk-free rate, August 2007, p. 1.32 Initially stated in 02-03 Budget www.budget.gov.au/2003-04/bp1/html/bst7.htm; reaffirmed in
11-12 budget. www.budget.gov.au/2011-12/content/bp1/html/bp1_bst7-03.htm33 CEG, Risk free rate and MRP in the CAPM, March 2012, p. 29. 34 Treasury and AOFM, Letter regarding the CGS Market, July 2012, p. 2.
AER draft decision | Envestra 2013–17 | Draft decision appendices 7

Prior to the GFC the supply of CGS was lower than it is now. In 2007 CGS on issue was approximately $50 billion. As a result of changes to fiscal policy since that time, CGS on issue is now around $235 billion.35 The AER does not consider that an increase in supply of this magnitude is likely to suggest a shortage of supply. Further, the advice from the Australian Treasury and AOFM provides the AER with confidence that there is currently no shortage of supply in the CGS market.
As there is no shortage of supply in the CGS market, there is unlikely to be a scarcity premium unreasonably pushing the yield on CGS down.
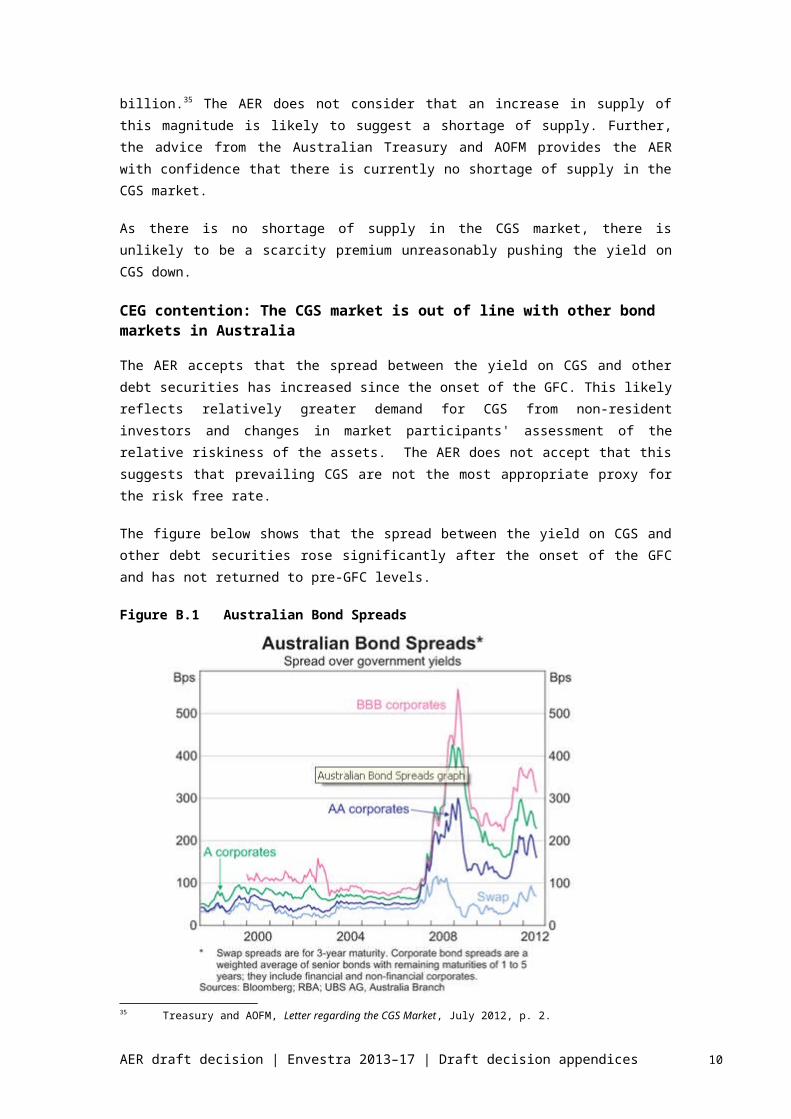
CEG contention: The CGS market is out of line with other bond markets in Australia
The AER accepts that the spread between the yield on CGS and other debt securities has increased since the onset of the GFC. This likely reflects relatively greater demand for CGS from non-resident investors and changes in market participants' assessment of the relative riskiness of the assets. The AER does not accept that this suggests that prevailing CGS are not the most appropriate proxy for the risk free rate.
The figure below shows that the spread between the yield on CGS and other debt securities rose significantly after the onset of the GFC and has not returned to pre-GFC levels.
Figure B.1 Australian Bond Spreads
Source: RBA
The figure below shows that the widening of spreads can also be observed in the semi-government bond market. 35 Treasury and AOFM, Letter regarding the CGS Market, July 2012, p. 2.
AER draft decision | Envestra 2013–17 | Draft decision appendices 8

Figure B.2 Semi-government spreads to CGS
Source: Bloomberg, AER
The RBA advice notes that '(t)his widening [of spreads] indeed confirms the market's assessment of the risk-free nature of CGS and reflects a general increase in risk premia on other assets.'36
The Treasury and AOFM advice makes the following statement:
Other issuers of Australian dollar-denominated debt may not have benefited from this increased demand to the same extent as the Commonwealth owing to investment mandate limitations and/or perceived or actual lower levels of liquidity in other types of debt.37
Possibly adding to the spread for semi-government bonds, the September Quarter RBA Bulletin states:
The increase in spreads during periods of heightened risk aversion may in part reflect the fact that some investors, particularly offshore investors, are not always familiar with the extent of vertical fiscal integration in Australia, whereby state governments receive a large share of their revenue via redistributions of Australian Government tax receipts.38
Increased demand from non-resident investors has also likely had an influence on the increased spreads. Demand from non-resident investors has been proportionately larger in the CGS market over the past few years. The Treasury and AOFM advice notes that non-resident ownership of CGS increased from around 50 per cent in mid-2009 to around 76 per cent in March 2012.39 The advice also notes that non-resident ownership of semi-government securities has
36 RBA, Letter regarding the CGS market, July 2012, p. 1.37 Treasury and AOFM, Letter regarding the CGS Market, July 2012, p. 2.38 Lancaster and Dowling, The Australian Semi-government Bond Market, RBA bulletin, September
Quarter 2011, p. 54. 39 Treasury and AOFM, Letter regarding the CGS Market, July 2012, p. 2.
AER draft decision | Envestra 2013–17 | Draft decision appendices 9
increased in the same period, albeit by a smaller amount.40 As discussed in section 4.3.2 above, the AER does not consider that increased demand from non-resident investors makes CGS an inappropriate proxy for the risk free rate.
Relative risk assessments are considered in the context of the MRP; found in attachment 4.3.3.
The AER notes that CEG assert that the yield on semi-government securities have not fallen to the same degree as CGS.41 The AER accepts this is the case. However, semi-government bonds have fallen considerably since the onset of the GFC.
Over the period from mid-2009 to March 2012 the yield on semi government debt has fallen by approximately 100 basis points on average. Before the onset of the GFC the yield on semi government bonds was higher than at present. This suggests that while semi-government bond yields have not moved in lock-step with CGS yields, the forces acting upon them have been very similar. The Figure below demonstrates this clearly.
Figure B.3 CGS and semi-government indices over time
Source: Bloomberg, AER
CEG contention: CGS yields have been volatile over the last few years
The AER acknowledges that CGS yields change over time; this does not make CGS yields an inappropriate proxy for the risk free rate. Changes in CGS yields reflect 40 Treasury and AOFM, Letter regarding the CGS Market, July 2012, p. 2.41 CEG, Risk free rate and MRP in the CAPM, March 2012, pp. 21-25.
AER draft decision | Envestra 2013–17 | Draft decision appendices 10

changes in investor expectations and CGS yields therefore remain the best estimate of the forward looking risk free rate at any point in time.42
CEG comment that CGS yields have been very volatile over the past few years:
The nominal and CPI indexed yield on 10 year CGS have been very volatile over the last three years. Twice in this period, first in early 2009 and then in late 2011, yields have fallen to levels not previously seen in the last fifty years.43
The CEG report does not explore in any detail what the volatility of CGS yields has actually been over the last three years. CEG point to a graph of CGS yields and suggest this demonstrates volatility.44
The AER has examined observed changes in average CGS yields since 1981. The observed change in the monthly average yield is displayed in Figure B.4 below. This analysis is not strictly volatility analysis. Nevertheless, it is useful as it provides an indication of how much CGS yields have historically changed from period to period.
Figure B.4 Observed change of monthly average nominal CGS yields
Source: RBA, AER analysis
The graph suggests that CGS yields have not been relatively more volatile when compared to observed changes. This observation is likewise reflected in the observed change of daily average yields since 1995 as shown in Figure B.5 below.
42 Discussed further in section 4.3.2. 43 CEG, Risk free rate and MRP in the CAPM, March 2012, p. i. 44 CEG, Risk free rate and MRP in the CAPM, March 2012, pp. 4.
AER draft decision | Envestra 2013–17 | Draft decision appendices 11

Figure B.5 Observed change of daily average nominal CGS yields
Source: RBA, AER analysis
CEG's concerns appear to rest primarily with the low level of prevailing CGS yields, rather than volatility. This is clear from CEG's statement above. The AER has considered the effect of the low level of prevailing CGS yields in sections 4.3.4 and 4.3.9 when considering the relationship between the MRP and the risk free rate, and the overall rate of return.
B.1.3Long term average as an alternative option
The AER has given consideration to the alternative of using a long term average historical estimate of the risk free rate and concludes that this would not be an acceptable approach, given the requirements of the NGR. This is because, as discussed below, there is limited evidence that the cost of equity is stable through time, a long term average is not consistent with the present value principle and would expose regulatory decisions to bias.
The AER has consistently employed an approach where it estimates a forward looking MRP and risk free rate based on the best evidence available. CEG proposed departure from this consistent approach to the use of a long term historical average for estimating the risk free rate.45 CEG proposed the use of inflation indexed bonds averaged over the period from July 1993.46 This approach was proposed by Envestra Victoria and Albury, SP AusNet and Multinet in their respective initial access arrangement proposals, but not by APA GasNet.47 45 CEG, Risk free rate and MRP in the CAPM, March 2012, p. 41-47. 46 CEG, Risk free rate and MRP in the CAPM, March 2012, p. 45-46. 47 Envestra, Access arrangement information, 30 March 2012, p. 156; SP AusNet, Access
arrangement information, 30 March 2012, p. 189 ; Multinet, Access arrangement information, 30 March 2012, p. 154; APA GasNet, Access arrangement submission, 31 March 2012, p. 132–133.
AER draft decision | Envestra 2013–17 | Draft decision appendices 12

CEG stated:
An historical average estimate of the cost of equity can be a reliable proxy for the prevailing cost of equity if the cost of equity is stable through time.48
The AER gives consideration to the relationship between the risk free rate and MRP in section 4.3.4 above and considers that there is little evidence that the cost of equity is stable through time.
The reasoning for a departure from the use of prevailing estimates is not clear. Firstly, Envestra Victoria and Albury, SP AusNet, Multinet and CEG appear to argue that there are problems in the CGS market. These concerns are addressed in section 1.3.1 above. Secondly, they appear to suggest that using prevailing estimates of CGS yields is inconsistent with using historical estimates of the MRP. This is a mischaracterisation of the AER's approach as discussed in section 1.3.3.
The AER has a number of concerns with using a long term average approach. Importantly, a long term average is not consistent with the present value principle. Lally found that 'the Present Value principle requires use of the risk free rate at the beginning of the regulatory period.'49
As discussed in section 1.3.1, a strict interpretation of the present value principle requires the use of the risk free rate on the first day of the period. However, a pragmatic allowance is made from using this strict interpretation of the present value principle. The allowance is to use a short averaging period as close as practically possible to the beginning of the regulatory period. This reduces the exposure of regulated businesses to unreasonable variation that can be reflected in the yield for a single day.
As Lally points out:
Rates averaged over a much longer historical period would be inconsistent with the present value principle, i.e., they would violate it without offering any incremental pragmatic justification.50
Indeed, the AER considers that a long term average would likely introduce problems that are not involved with using a prevailing rate.
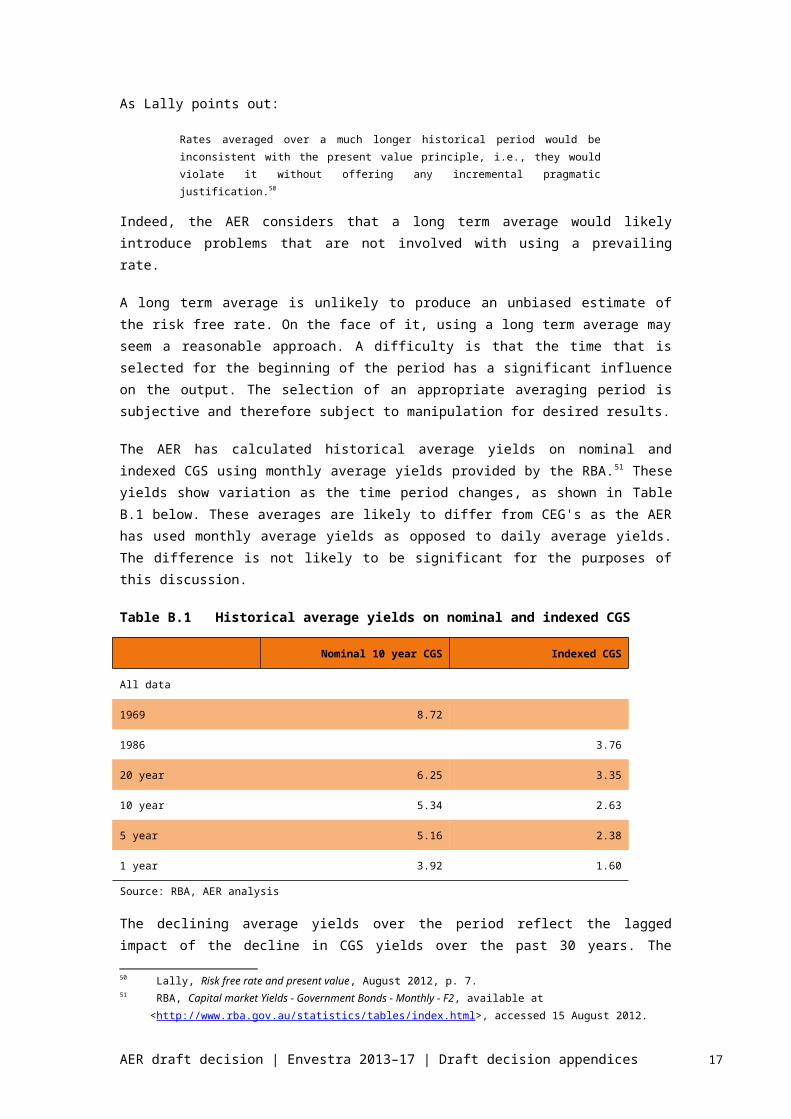
A long term average is unlikely to produce an unbiased estimate of the risk free rate. On the face of it, using a long term average may seem a reasonable approach. A difficulty is that the time that is selected for the beginning of the period has a significant influence on the output. The selection of an appropriate averaging period is subjective and therefore subject to manipulation for desired results.
The AER has calculated historical average yields on nominal and indexed CGS using monthly average yields provided by the RBA.51 These yields show variation as the time period changes, as shown in Table B.1 below. These averages are 48 CEG, Risk free rate and MRP in the CAPM, March 2012, p. i.49 M. Lally, The risk free rate and the present value principle, 22 August 2012, p. 3 (Lally, Risk free
rate and present value, August 2012)50 Lally, Risk free rate and present value, August 2012, p. 7.51 RBA, Capital market Yields - Government Bonds - Monthly - F2, available at
<http://www.rba.gov.au/statistics/tables/index.html>, accessed 15 August 2012.
AER draft decision | Envestra 2013–17 | Draft decision appendices 13

likely to differ from CEG's as the AER has used monthly average yields as opposed to daily average yields. The difference is not likely to be significant for the purposes of this discussion.
Table B.1 Historical average yields on nominal and indexed CGS
Nominal 10 year CGS Indexed CGS
All data
1969 8.72
1986 3.76
20 year 6.25 3.35
10 year 5.34 2.63
5 year 5.16 2.38
1 year 3.92 1.60
Source: RBA, AER analysis
The declining average yields over the period reflect the lagged impact of the decline in CGS yields over the past 30 years. The figure below demonstrates this lagged impact. When interest rates decline, or increase, over time, a longer historical averaging period produces a greater difference between the observed yield and the historical average. The 20 year average is higher than the 10 year average, for example.
Figure B.2 Average nominal CGS yields through time
Source: RBA, AER analysis
Envestra proposed a long term average estimate of the risk free rate of 5.99 per cent.52 This is consistent with advice Envestra received from CEG.53 CEG proposed
52 Envestra, Access arrangement information, March 2012, p. 156.53 CEG, Risk free rate and MRP in the CAPM, March 2012, p. 45.
AER draft decision | Envestra 2013–17 | Draft decision appendices 14

the use of inflation indexed CGS from July 1993 plus an estimate of the future inflation rate of 2.50 per cent.54 CEG suggested that July 1993 is a reasonable time to begin the estimation period because this is approximately when the RBA formally adopted an inflation targeting regime.55
The AER has a number of reservations with this reasoning. Firstly, the selection of the starting point for the averaging period is subjective. In this case, for example, there is a question about whether the adoption of inflation targeting was seen as credible by market participants at that point in time. The credibility of the inflation targeting regime is important because if expectations did not immediately match the target band, then the yield on CGS may have been higher than if expectations did match the target band.56 This suggests that a historical average over this period might not be a reliable proxy for the real risk free rate in combination with an inflation estimate of 2.5 per cent.
Secondly, the quality of the historical data is important and at times uncertain. As CEG note, indexed CGS went through a period of very limited supply in the years prior to the GFC.57 Indeed, the RBA and Australian Treasury confirmed this in advice to the AER.58 This suggests that a historical average of indexed CGS is unlikely to provide an accurate reflection of the real risk free rate over the period.
There are likely to be many alternative long term historical periods that could be used to determine a historical average with positives and negatives for all such historical periods. However, each of these alternatives is an inferior alternative compared to prevailing yields on long dated CGS.59
The Tribunal recently acknowledged the difficulties in determining an appropriate long term averaging period:
Clearly, the 'right' period for the estimation of capital market parameters that are to be included in calculations of the WACC under the CAPM is one that is likely never to be agreed by parties in a rate of return calculation.60
These comments were made in the context of the Tribunal's decision on MRP where long term averages are commonly used. Nevertheless, they capture the AER's concerns about using a long term average for the risk free rate, particularly as a short term average captures market participant's current expectations for the future.
The AER concludes that a long term averaging period is not appropriate and does not result in the best possible estimate in the circumstances. The inherent subjectivity in selecting a period for a long term average increases the likelihood of bias in the estimate of the risk free rate.
54 CEG, Risk free rate and MRP in the CAPM, March 2012 p. 45.55 CEG, Risk free rate and MRP in the CAPM, March 2012 p. 16, 4556 'A change in expected inflation will cause the same change in the nominal interest rate.' R.
Brealey, S. Myers, G. Partington, and D. Robinson, Principles of Corporate Finance, McGraw-Hill Australia: First Australian Edition, 2007, p. 691.
57 CEG, Risk free rate and MRP in the CAPM, March 2012, p. 4558 RBA, Letter regarding the CGS market, July 2012, p. 1. 59 Discussed further in section 4.3.2. 60 Australian Competition Tribunal, Application by DBNGP(WA) Transmission Pty Ltd (No 3) [2012]
ACompT 14, 26 July 2012, paragraph 149.
AER draft decision | Envestra 2013–17 | Draft decision appendices 15

B.1.4The term of the risk free rate
The term of the risk free rate
Envestra proposed the use of a 10 year term and the AER accepts a 10 year term is appropriate. The AER notes, however, that the selection of an appropriate term is not straightforward.
When determining the term of the risk free rate there are a number of considerations involved. It is important to consider consistency with the present value principle. The AER has also previously considered actual practices by regulated businesses.61 Finally, a 10 year term ensures consistency in this decision between the risk free rate used for the cost of equity and that used for the cost of debt, including in the calculation of the MRP and DRP. On balance, the use of a 10 year term is appropriate for this decision.
The present value principle is a fundamental element when determining the term of the risk free rate. The AER notes that there are divergent schools of thought on the appropriate term to ensure consistency with the present value principle.
Associate Professor Lally suggests that the AER should use a term that is consistent with the regulatory period when estimating a risk free rate at the start of the period.62 This suggests the AER should use a 5 year term. Professor Davis has also expressed support for this approach.63
On the other hand, the AER notes that there are arguments in favour of using a longer term to more closely match the life of the assets.64 Broadly, the argument suggests that regulated assets have long lives and corresponding cash flows, therefore the duration of the risk free rate should be as long as is practically possible.
In the WACC Review in 2009, the AER also considered arguments put forward by businesses that common practice was to use long dated financing to manage refinancing risk.65 This formed an important consideration for the estimation of the DRP using a 10 year term.66 In contrast, the ERA has recently analysed the average maturity of debt issued by regulated businesses and found this to be approximately 5 years.67
Consistency between the cost of equity and the cost of debt may also be important. This would mean that the MRP and DRP would need to be estimated consistently. In the recent DBNGP matter, the Tribunal supported the ERA's
61 AER, Final Decision: WACC Review, May 2009, p. 148–149.62 Lally, Risk free rate and present value, August 2012, p. 16.63 K. Davis, Determining debt costs in access pricing, a report to IPART, February 2011, p. 1. 64 A. Damodaran, What is the riskfree rate? A search for the Basic Building Block, December 2008,
p. 6-7. 65 AER, Final Decision: WACC Review, May 2009, pp. 156-166. 66 AER, Final Decision: WACC Review, May 2009, p. 168. 67 ERA, Final Decision on Proposed Revisions to the Access Arrangement for the Dampier to
Bunbury Natural Gas Pipeline, Submitted by DBNGP (WA) Transmission Pty Ltd, 31 October 2011, pp. 126–130 (ERA, Final decision: DBNGP access arrangement, October 2011).
AER draft decision | Envestra 2013–17 | Draft decision appendices 16
consideration that this consistency is important.68 The Tribunal considered consistency with the calculation of the DRP to be most important.69
In summary, while there are arguments in favour of a shorter term, it is appropriate at this time to continue to use a 10 year term. The AER therefore accepts Envestra's proposal. The AER also notes that a 10 year term is likely to provide a conservative estimate of the risk free rate.
B.1.5 The EnergyAustralia matter
CEG’s submission referred to the Tribunal’s decision in Application by EnergyAustralia and Others [2009] ACompT 8 (the EnergyAustralia matter) to support the position that the averaging period does not need to be as close as practically possible to the commencement of the regulatory control period.70 The AER has considered carefully whether the Tribunal's decision in the EnergyAustralia matter demonstrates that the approach applied in this decision inappropriate.
There is a history of the AER applying Tribunal decisions. There are two such examples in this determination. The AER has applied the Tribunal’s decision on gamma.71 Also, the AER has followed the Tribunal’s decision on the use of the Bloomberg fair value curve to estimate the DRP.72
In the time since the EnergyAustralia matter, the Federal Court has handed down its judgement in ActewAGL Distribution v The Australian Energy Regulator [2011] FCA 639 (the ActewAGL matter). Also, the Tribunal handed down its decision in Application by Telstra Corporation Limited ABN 33 051 775 556 [2010] ACompT 1 (the Telstra matter).73 Further, as the EnergyAustralia matter considered provisions in the transitional chapter 6 of the NER, there are differences in the legislation involved. Therefore, despite its history of applying the Tribunal's decisions, the circumstances surrounding the risk free rate for this determination and the EnergyAustralia matter are somewhat different. Specifically:
68 Australian Competition Tribunal, Application by DBNGP(WA) Transmission Pty Ltd (No 3) [2012] ACompT 14, 26 July 2012, paragraph 131.
69 Australian Competition Tribunal, Application by DBNGP(WA) Transmission Pty Ltd (No 3) [2012] ACompT 14, 26 July 2012, paragraph 132.
70 CEG, Risk free rate and MRP in the CAPM, March 2012, p. v. Source document is Australian Competition Tribunal, Application by EnergyAustralia and Others (includes corrigendum dated 1 December 2009) [2009] ACompT 8, 12 November 2009.
71 Australian Competition Tribunal, Application by Energex Limited (Gamma) (No 5) [2011] ACompT 9, 12 May 2011.
72 Australian Competition Tribunal, Application by Envestra Ltd (No 2) [2012] ACompT 3, 11 January 2012. Also, in the Victorian electricity distribution determination, the AER accepted Jemena Electricity Network's proposed averaging period, despite it being inconsistent with the SRI methodology. This was on the basis of the Tribunal's decision in the EnergyAustralia matter. The AER stated at the time that it was still examining the full implications of the Tribunal's decision and its relationship to the requirements of the SRI as well as to the broader NER framework. AER, Final decision: Victorian electricity distribution network service providers: Distribution determination 2011–15, October 2010, pp. 477–478 (AER, Final decision: Victorian distribution determination, October 2010).
73 Australian Competition Tribunal, Application by Telstra Corporation Limited ABN 33 051 775 556 [2010] ACompT 1, 10 May 2010.
AER draft decision | Envestra 2013–17 | Draft decision appendices 17

The Envestra decision is made under the NGL and NGR. In contrast, the Energy Australia decision was made under the NEL and NER. Further, the Energy Australia decision was made under transitional provisions of the NER. There are differences in the legislation involved in the EnergyAustralia matter and the legislation the AER applies for the Envestra decision.
The legislation in the EnergyAustralia matter included provisions deeming the MRP to be 6 per cent.74 It is not clear to the AER the extent to which these provisions influenced the Tribunal's decision.75 To the extent this occurred, the AER considers this interpretation was not appropriate. In the ActewAGL matter, the Federal Court upheld the AER's reasons for rejecting ActewAGL's submission that the risk free rate should be adjusted to take into account variations in the MRP. A key reason of the AER was that adjusting the risk free rate to make up for a higher MRP was an attempt by ActewAGL to circumvent the legislation and would undermine the intended certainty provided under the regulatory regime through the deeming provisions.76
At any rate, the legislation here does not include deeming provisions and instead enables the rate of return, including the MRP where the CAPM is adopted as the well accepted financial model, to reflect prevailing conditions in the market for funds. As discussed in attachment 4, the AER has consistently held a position that each WACC parameter should be estimated based on considerations relevant to that parameter, rather than to deal with issues relating to another parameter. In the Telstra matter, the Tribunal made its position clear that CGS yields during the global financial crisis remained representative of the risk free rate, and the mere fact that the yields were 'low' did not change this conclusion.
In the EnergyAustralia matter, the Tribunal considered that the NER's drafting results in cost of capital needing to represent the return required by investors at the start of each regulatory year. As mentioned above, the legislation here has no such drafting. Also, the Federal Court recognised that the capital asset pricing model (CAPM) requires the use of the most current information for deriving the cost of capital. According to the Federal Court, in theory, this involves the use of the risk free rate at the beginning of the regulatory control period. For the reasons set out in section 4.3.2, the use of the risk free rate near the beginning of the regulatory control period is also consistent with the building block model required under the NGR. Advice from Associate Professor Lally supports both that the CAPM requires the most current risk free rate and that the building block model requires the use of a risk free rate commensurate with prevailing market conditions at the start of the regulatory control period.
In the EnergyAustralia matter, the Tribunal’s reasons for finding that the AER acted unreasonably in withholding consent to EnergyAustralia’s proposed averaging period included that the AER did not examine the evidence regarding forward interest rates.77 However, the Federal Court noted evidence
74 NER, Transitional chapter 6 clause 6.5.2(b)75 Some support for the conclusion that they did can be found at paragraph 73(d)(1) where the
Tribunal stated that a principle assisting it in the determination of the issue was '...whether the period proposed is likely to result in an unbiased risk free rate, given that the equity beta and the market risk premium are deemed to be 1.0 [sic} and 6.0 per cent respectively'. Australian Competition Tribunal, Application by EnergyAustralia and Others (includes corrigendum dated 1 December 2009) [2009] ACompT 8, 12 November 2009.
76 Federal Court of Australia, ActewAGL Distribution v The Australian Energy Regulator [2011] FCA 639, 8 June 2011, paragraph 148.
77 Australian Competition tribunal, Application by EnergyAustralia and Others (includes corrigendum dated 1 December 2009) [2009] ACompT 8, 12 November 2009, paragraph 94.
AER draft decision | Envestra 2013–17 | Draft decision appendices 18

that no Australian regulator has done so. It also very much doubted that the NER required the AER to deploy forward rates to make the averaging period decision.78
Further the EnergyAustralia matter involved a legislative regime where a service provider's proposal has presumptive approval, and the AER cannot unreasonably withhold its approval. In contrast, the rate of return provision in the NGR is a full discretion provision. This means the AER retains the discretion to not approve a service provider's proposal, even where that proposal complies with and is consistent with the relevant legislative requirements and criteria. If the AER considers there is a preferable alternative that also complies with and is consistent with the relevant legislative provisions it may implement it.79
As the Federal Court noted, the Tribunal and the Federal Court apply different tests. However, given the differences noted above, the AER does not consider it appropriate to merely apply the Tribunal’s decision in the EnergyAustralia matter as if it were a precedent. Accordingly, in these circumstances, the AER does not consider that it should accept on face value that the Tribunal’s decision demonstrates that the approach applied in this decision is inappropriate. Instead, throughout attachment 4 and this appendix the AER has assessed all of the evidence available on its merits.
For the reasons set out in this decision the AER does not consider the Tribunal's decision in the EnergyAustralia demonstrates that the approach applied in this decision is inappropriate.
In the remainder of this section the AER considers:
The Tribunal's and the Federal Court's interpretations of the statutory scheme under clause 6.5.2 of the NER.
The usefulness of forward interest rates in assessing a proposed risk free rate averaging period.
In section 4.3.2 the AER considers the economic insights that can be gained from the 'present value principle' and how this principle is consistent with both the use of the building block model and the use of the CAPM. In section B.1.6 the AER considers the Tribunal's considerations in the Telstra matter.
The Tribunal's and the Federal Court's interpretation of the statutory scheme
In withholding its approval to EnergyAustralia's proposed averaging period, the AER stated that the AER's regulatory practice was supported by accepted expert views in the economic and finance literature.80 In response to the reports referenced by the AER, the Tribunal set out its interpretation of the statutory scheme:78 Federal Court of Australia, ActewAGL Distribution v The Australian energy Regulator [2011] FCA
639, 8 June 2011, paragraph 145. 79 NGR, r. 40(3)80 The AER referenced the following three reports in support of this statement: M. Lally,
Determining the risk free rate for regulated companies, August 2002; K. Davis, Report on the risk free interest rate and equity and debt beta determination in the WACC, 28 August 2003; M. Lally, The cost of capital for regulated utilities—Report prepared for the QCA, 26 February 2004 (Lally, Cost of capital for regulated utilities, February 2004).
AER draft decision | Envestra 2013–17 | Draft decision appendices 19

The rate of return, or WACC, is applied to the value of the regulatory asset base of the NSP as at the beginning of a regulatory year to produce the return on capital (in dollar terms) for that regulatory year (cl 6.5.2(a)). (The regulatory asset base is updated each year (cl 6.5.1(e)(2).) Thus the WACC is applied in each of the five regulatory years within the regulatory control period. It follows that the WACC to be applied each year should in principle be the rate of return required by investors at the beginning of that year. This rate of return would naturally be expected to differ from year to year.
That is not, however, the scheme set out in cl 6.5.2. Rather it provides for a single value of the WACC to be calculated and applied to each year's starting regulatory asset base.
…
The risk free rate, whether agreed or specified, is, it seems to be agreed by all parties, that which prevails at some time (the averaging period) prior to the start of the regulatory control period; similarly with the benchmark corporate bond rate. Those inputs might generate a rate of return value reasonably close to that actually required by investors at the start of the regulatory control period, and applied to the first year's starting regulatory base. But with changes in market conditions over the regulatory control period, it is hard to see why the rate of return value would represent the return required by investors at, say, the start of the final year of the regulatory control period.
In the meantime, the risk free rate and corporate bonds rates would almost certainly have varied from their initial values. Consequently, there appears to be no virtue in setting those rates at values that prevailed close to the start of the regulatory control period, or to the publication of a final determination.
It may be accepted that, [the AER's practice] …and the practice of regulators more generally has been to apply a nominal risk free rate averaging period closer to the start of the regulatory period. This practice has been supported by economic experts. The Tribunal observes, however, that this is not a universal practice. In market conditions that are not wildly out of the norm, this may be expected to provide a figure that is fairly close to being an unbiased estimate of the risk free rate consistent with market conditions at the time of the final determination; and may consequently be expected to provide a reasonable estimate of the rate of return on capital that would be required by investors at the time of the final determination.
But as explained above, there is no proper basis for seeking such an estimate. The views of economic experts appear to be based on a model where the regulatory control period is considered to be a single period (of five years), not five consecutive one-year periods. In the scheme set out in the Transitional Rules, the nexus is broken between the period to which the rate of return applies and the period for which that rate of return is estimated. Once that is realised, the basis for withholding agreement to an averaging period proposed by EA falls away. [Emphasis added]81
As is clear from this quote, the Tribunal considered that the statutory scheme rendered expert economic advice in support of the AER's position irrelevant. The Tribunal's view appears to be that the rate of return set under clause 6.5.2 of the NER needs to be representative of the (10 year) return required by investors at the start of each year of the regulatory control period.82 Once again, the NGR do not contain any drafting similar to that the Tribunal referred to. Therefore, it appears that the EnergyAustralia decision has limited influence in the present circumstances.81 Australian Competition Tribunal, Application by EnergyAustralia and Others (includes
corrigendum dated 1 December 2009) [2009] ACompT 8, 12 November 200982 The term of the risk free rate was deemed to be 10 years in the transitional chapter 6 clause
6.5.2 that applied in the EnergyAustralia matter.
AER draft decision | Envestra 2013–17 | Draft decision appendices 20

In the ActewAGL matter, the Federal Court was careful to point out that the tests it applied on judicial review are different from the tests applied in the Tribunal's merits review. The Federal Court expressly stated that the Tribunal's view on the merits of the AER's decision were irrelevant in the judicial review.83 However, in commenting on the statutory scheme, the Federal Court also stated:
The relevant equation is that which determines the return on equity (ke), which paragraph (b) provides must be determined using the Capital Asset Pricing Model (“CAPM”) and certain defined parameters. …
The Capital Asset Pricing Model requires the use of the most current information for deriving the rate of return. This in theory involves the use of the risk-free rate on the day that required returns are to be estimated (in this case, the beginning of the regulatory period). Nevertheless, there are recognised problems with the use of an on-the-day rate which an averaging period is intended to address. In particular, deploying an averaging period will minimise day-to-day volatility in the market.84 [Emphasis added]
Clearly, this is not an express statement that the Tribunal's interpretation is incorrect. However, it appears that the Tribunal considered clause 6.5.2(a) to require the rate of return to be that required by investors at the beginning of each regulatory year. On the other hand, the Federal Court recognised that the CAPM—proposed by Envestra and approved by the AER—requires the rate of return to be that required by investors at the beginning of the regulatory period. It seems difficult to reconcile the two statements. Based on this reason and others,85 the AER considers that the economic evidence it presented in the EnergyAustalia matter remains relevant. Further, the economic evidence presented in Associate Professor Lally's report to the Federal Court in the ActewAGL matter and recent advice to the AER is also relevant. Those reports are considered in the section 4.3.2.
On this basis, the AER considers that, conceptually, the rate of return set under the CAPM should represent the return required by investors at the beginning of the regulatory control period (over the relevant forward looking period). The AER does not consider that rule 87 of the NGR requires a rate of return (over the specified term) representative of the return required by investors at the start of each year of the regulatory control period.
The use of forward interest rates
In the EnergyAustralia matter, the Tribunal said the AER should use forward interest rates to assess a service provider's proposed averaging period. The Tribunal stated:
Rather than assume that the rate at a closer date would give a better estimate, the AER should have examined the evidence regarding expected future rates. Such evidence of forward interest rates, ie, rates that will apply
83 Federal Court of Australia, ActewAGL Distribution v The Australian Energy Regulator [2011] FCA 639, 8 June 2011, paragraph 113.
84 Federal Court of Australia, ActewAGL Distribution v The Australian Energy Regulator [2011] FCA 639, 8 June 2011, paragraphs 22 and 28.
85 For example, if the Tribunal's interpretation is correct, it seems that the AER misinterpreted clause 6.5.2(a). If so, it seems likely that the Federal Court would have made a similar finding. However, it did not. The AER acknowledges that the Federal Court did not address this issue in detail.
AER draft decision | Envestra 2013–17 | Draft decision appendices 21

at some future time for a prospective period, is available from market data. Comparisons could be made between the rates expected to prevail during the averaging period proposed by the NSP and rates expected at later periods. But it follows from the Tribunal's reasoning that it would be insufficient and inappropriate to only compare with rates expected to prevail close to the time of the final determination.86
The AER has considered the usefulness of forward interest rates to assess the averaging period's predictability of the risk free rate at a future point in time. In their reports to the Federal Court, Lally and Houston advised that they were not aware of any Australian regulatory decision in which forward rates had been used to guide the selection of an averaging period for the risk free rate.87
Lally further advised that there were 'two major difficulties' in using forward interest rates in this way. On the first major difficulty, he advised that the appropriate predictor of a future interest rate is not the forward rate but the forward rate less the term premium.88 On estimating the term premium, Lally stated:
However, the sizes of the term premiums vary over time and they are not precisely determinable. So, any attempt to estimate the extent to which an interest rate at a given point in time is a biased predictor of a subsequent rate would be fraught with difficulty.
Lally concluded:
…in choosing an interest rate to serve as the best predictor of the rate prevailing at a particular future point in time, the best interest rate will be that which is closest in time to the predicted date.89
As is clear from the Tribunal's decision, the Tribunal's view on the usefulness of forward interest rates was based on its view that the relevant rate of return is that required by investors at the start of each year of the regulatory control period rather than the rate required at the start of the regulatory control period. The AER does not agree with this position, as explained above.
The problems associated with using forward interest rates that Lally raised were in the context of predicting the 'spot' interest rate at the start of the regulatory control period—a period only two months after the publication of the AER's final decision. If forward interest rates are an unsuitable predictor of interest rates over such a short time horizon, they would appear to be at least an equally unsuitable predictor of the 'spot' interest rate at more distant points in the future (which is the context in which the Tribunal considered them).
Accordingly, there are both in principle and practical difficulties with using forward interest rates in determining the risk free rate.86 Australian Competition Tribunal, Application by EnergyAustralia and Others (includes
corrigendum dated 1 December 2009) [2009] ACompT 8, 12 November 2009, paragraph 94. 87 Federal Court of Australia, ActewAGL Distribution v The Australian Energy Regulator [2011] FCA
639, 8 June 2011, paragraph 145.88 Lally advised this is because the 'expectations hypothesis' is not a satisfactory characterisation
of the term structure of interest rates. Lally went on to explain that even if the expectations hypothesis held, the use of forward interest rates to assess two different averaging periods is still a flawed approach. M. Lally, Expert report of Martin Thomas Lally, 13 February 2011, p. 15 (Lally, Expert report, February 2011).
89 Lally, Expert report, February 2011, p. 15.
AER draft decision | Envestra 2013–17 | Draft decision appendices 22

In the ActewAGL matter there was some debate between the experts on the use of forward interest rates, in a context that involves a deemed MRP value. That aside, Justice Katzmann concluded:
Whether or not the criticism of the AER's decision is valid, I very much doubt the AER is bound by the statutory scheme to deploy forward rates to make the averaging period decision.90
Based on the Federal Court's view, the AER concludes that the use of forward interest rates to assess averaging periods is not a requirement of the NER (let alone the NGR). Based on Lally's advice, the AER also concludes there are sound economic reasons for not using forward interest rates. The AER has not used forward interest rates to assess Envestra's proposed averaging period.
For the above reasons, the AER considers that the Tribunal's comments do not demonstrate that an averaging period as close as practically possible to the commencement of the regulatory control period is not appropriate.
B.1.6The Telstra matter
The AER has reviewed the Tribunal decision in Telstra Corporation Limited ABN 33 051 775 556 [2010] ACompT 1, 10 May 2010. The Tribunal's reasons appear to support the approach adopted by the AER in this decision.
Like this decision, the Telstra matter also involved the appropriate estimation of the risk free rate at a time when CGS yields were 'low' compared to historically observed rates. The ACCC adopted a 4.51 per cent risk free rate. Telstra submitted the risk free rate was 6.33 per cent.91
Telstra submitted that the global financial crisis had significantly impacted on the yields of CGS resulting in an anomalous or unrepresentative risk free rate value during the relevant averaging period. The Tribunal disagreed. The Tribunal considered:
The dispute turns on whether the data derived over the period chosen by the ACCC is anomalous or unrepresentative.
The risk free rate refers to the return from an asset with no risk of default. There is every reason to assume (and little evidence to doubt) that the yields on commonwealth bonds over this period continued to provide an accurate proxy for a return on assets bearing no risk of default. To the extent that the yields factored the impacts of the global financial crisis, the bond rate continued to provide a representative indicator of the risk-free rate.
It is also not unusual for yields to move from time to time in order to reflect prevailing market conditions and the expectations about the prospect for prices into the future. A downward movement in yields over this period is therefore hardly anomalous, given market conditions.92
90 Australian Competition Tribunal, Application by EnergyAustralia and Others (includes corrigendum dated 1 December 2009) [2009] ACompT 8, 12 November 2009, paragraph 145.
91 Australian Competition Tribunal, Telstra Corporation Limited ABN 33 051 775 556 [2010] ACompT 1, 10 May 2010, paragraph 364.
92 Australian Competition Tribunal, Telstra Corporation Limited ABN 33 051 775 556 [2010] ACompT 1, 10 May 2010, paragraph 415-417.
AER draft decision | Envestra 2013–17 | Draft decision appendices 23

The Tribunal also stated that Telstra's proposal introduced value judgements. This is similar to the AER's findings, in this appendix, that a long term average creates the potential for arbitrariness and introduces subjectivity into the estimation of the risk free rate. The Tribunal considered:
… that the approach advanced by Telstra would impose an obligation on the regulator (or the Tribunal) to make value judgments. Those value judgments include whether the period over which the data is taken is in some manner unusual, and whether the data derived is in some way anomalous or unrepresentative of the value that should apply to that parameter. This could involve predicting future rates, although means are available to do that.93
It is clear that the Tribunal did not consider that the decrease in CGS yields caused by the effects of the global financial crisis impinged upon CGS yields being an appropriate proxy for the risk free rate.94
The Tribunal made its position clear that CGS yields during the global financial crisis remained representative of the risk free rate. The mere fact that the yields were 'low' did not change this conclusion.
The averaging period in the Telstra matter was in March to April 2009 and resulted in a risk free rate of 4.51 per cent. The indicative averaging period adopted by the AER for Envestra is in August 2012 and results in a risk free rate of 2.98 per cent. The Tribunal's reasons why CGS yields remained an appropriate proxy for the risk free rate in March to April 2009 continue to apply in August 2012.
B.1.7The expectations theory on the term structure of interest rates
In sections 1.3.1 and 1.3.3 the AER raised the concept of the term structure of interest rates and the relevance of the ‘expectations theory’ when considering a forward looking estimate of the risk free rate. The expectations theory provides support for the use of prevailing 10 year CGS yields as forward looking estimates. The theory is further explained in this section.
The expectations theory is generally regarded as an important part of the explanation of the term structure of interest rates.95 The term structure is also commonly referred to as the yield curve.96 As Brailsford, Heaney and Bilson describe:
[The expectations theory] says that the only reason for an upward-sloping term structure is that investors expect future spot rates to be higher than
93 Australian Competition Tribunal, Telstra Corporation Limited ABN 33 051 775 556 [2010] ACompT 1, 10 May 2010, paragraph 418.
94 In a recent determination process Aurora Energy Pty Ltd submitted that the Tribunal's comments at paragraph 422 supported a departure from a short tem average approach. The AER does not take the same interpretation of those comments. Further discussion can be found in the Aurora final determination. AER, Final distribution determination: Aurora Energy Pty Ltd 2012–13 to 2016–17, Appendixes, April 2012, p. 11–13 (section A.1.4).
95 E. Elton, M. Gruber, S. Brown and W. Goetzmann, Modern Portfolio Theory and Investment Analysis, Wiley: Eighth edition, 2010, pp. 516–521.
96 G. Peirson, R. Brown, S. Easton and P. Howard, Business Finance, McGraw-Hill: Eighth edition, 2003, p. 103.
AER draft decision | Envestra 2013–17 | Draft decision appendices 24

current spot rates; and the only reason for a declining term structure is that investors expect spot rates to fall below current levels. The expectations hypothesis also implies that investing in short-term bonds...gives exactly the same return as investing in long-term bonds.97
The expectations theory suggests then that current yields on long-dated bonds incorporate current market yields on short dated bonds and expectations of future market yields on short dated bonds. This relationship is explained in the following mathematical expression98:
(1+0Rn) = (1+0R1)(1+E0[1R2])...(1+E0[n-1Rn])
Where:
E0[sRn ]= expected nominal yield per annum for the period from time s to time n,
with expectations formed at time 0
0Rs = nominal yield per annum observed now for the period 0 to s
The expectations theory is not the only theory that has been developed to explain the term structure of interest rates. Other theories are the ‘liquidity premium theory’, the ‘segmented markets theory’ and the ‘preferred habitat theory’.
The expectations theory is unlikely to provide a complete explanation of the term structure of interest rates.99 There are many factors that may influence the term structure. Notwithstanding this, the expectations theory provides an important and relevant understanding of the term structure of interest rates.
B.1.8Envestra's main contentions for proposed a long term cost of equity
Envestra proposed a cost of equity estimate of 10.8 per cent using the 'long term' approach. It suggested this approach avoids short term movements in CGS yields from distorting the return on equity. It is also consistent with the method used to derive the other CAPM variables and reflects the long term nature of the assets it is funding.100
The AER considers using an averaging period as close as possible to the start of the regulatory period is appropriate. The prevailing 10 year CGS yield reflects the risk free rate over the next 10 years. The AER also notes determining the averaging period for a long term average introduces arbitrariness and may produce an upward bias. The AER discusses its considerations in attachment 4.3.2.
97 T. Brailsford, R. Heaney, and C. Bilson, Investments: concepts and applications, Nelson Australia Pty Ltd: Third edition, 2007, p. 710.
98 T. Brailsford, R. Heaney, and C. Bilson, Investments: concepts and applications, Nelson Australia Pty Ltd: Third edition, 2007, p. 156.
99 These concerns have been raised by Lally when considering the use of forward interest rates to predict future interest rates. Lally, Expert report, February 2011, p. 15–17.
100 Envestra, Albury access arrangement information, March 2012, p. 142; Envestra, Victoria access arrangement information, March 2012, p. 158.
AER draft decision | Envestra 2013–17 | Draft decision appendices 25

As discussed in attachment 4.3.4, both risk free rate and the MRP determined by the AER are forward looking estimates, although they are estimated using different types of data.
Although regulated assets are generally long term, it is important to note the regulatory returns are updated every five years. The NGR prescribe the use of the building block model when the AER is calculating the total revenue allowance.101 As noted by Dr. Darryl Biggar, the building block model is a tool for ensuring the present value of the revenue streams of the regulated firm matches the present value of its expenditures.102 For the risk free rate, an averaging period that is as close as practical to the start of the regulatory period promotes consistency with the CAPM, the building block model and the present value principle. On the other hand, Lally noted a long term average risk free rate would not satisfy the present value principle.103 This is discussed in detail in section B.1.3 above.
B.2 Market risk premium
Envestra proposed a 'current' MRP of 8.3 per cent based on the CEG's dividend growth model estimate.104 Envestra also submitted reports prepared by Capital Research and NERA, advocating the DGM and the regime switching model, respectively. In addition to DGM and regime switching model, the AER also considered other methods (namely, the SFG method and the VAA implied volatility glide path approach) because they are other forms of forward measure, and have been previously proposed by the businesses. It notes those other forward measures currently do not support an MRP above 6 per cent.
In this appendix, the AER considers:
further analysis on the use of arithmetic and geometric averages to estimate historical excess returns
survey evidence:
an assessment of survey evidence against the criteria suggested by the Australian Competition Tribunal in the Envestra matter
an explanation of ‘triangulation’ and its use in refining survey evidence
DGM estimates
consultants' view
CEG's approaches
Capital Research's DGM estimates
NERA's regime switching model
101 NGR, r. 76102 Biggar, D, Public utility regulation in Australia: Where have we got to? Where should we be going, Working paper no. 4, ACCC / AER working
paper series, July 2011, p. 58.103 Lally, Risk free rate and present value, August 2012, p. 3104 Envestra, Albury access arrangement information, March 2012, pp. 143-144; Envestra, Victoria
access arrangement information, March 2012, pp. 156-157.
AER draft decision | Envestra 2013–17 | Draft decision appendices 26

the report by Professor McKenzie and Associate Professor PartingtonAssociate Professor Lally's advice
the SFG method (implied volatility, credit spread and dividend yield)
VAA's implied volatility glide path approach
further analysis of NERA's regime switching model
further analysis of the SFG method (implied volatility, credit spreads, dividend yields)
further analysis on the VAA implied volatility glide path approach
market commentary
reasons for the AER's departure from the WACC review
After considering all available approaches to estimate the MRP, the AER applied its judgement and considered an MRP of 6 per cent is the best estimate in the circumstances and commensurate with prevailing conditions in the market for funds.
B.2.1Arithmetic and geometric averages of historical excess returns
Historical excess market returns are highly sensitive to the method of averaging returns over multiple periods. Handley, for example, found the historical excess market return (relative to bonds) for the period 1958-2011 was 3.5 per cent using a geometric average or 6.1 per cent using an arithmetic average.105
If returns vary over time, then a geometric average will always be less than an arithmetic average—the greater the volatility in returns is, the greater is the difference between an arithmetic average and a geometric average.106 With the level of volatility present in historical stock market returns, a difference of around 200 basis points (2 per cent) is common. Box B.1 uses a simple numeric example to explain the difference between an arithmetic average and a geometric average.
Box B1.1 The difference between arithmetic averages and geometric averagesArithmetic averages are more appropriate when observations are considered independent in a statistical sense. In contrast, geometric averages are more appropriate when observations are related to each other over time—for example, if yearly excess returns are the relevant observations, then returns can be expected to accumulate over time. As long as returns vary over time a geometric average will always be less than an arithmetic average. The greater the volatility
105 J. Handley, An estimate of the historical equity risk premium for the period 1883 to 2011, April 2012, p. 6. Estimates are based on an assumed value of imputation credits of 0.35.
106 For example, if an index starts at 100, falls to 80 and then increases again to 100, the arithmetic average return is 2.5 per cent (the average of the initial 20 per cent fall and subsequent 25 per cent rise) and the geometric average return is zero (because the value of the index at the end of the second period is the same as at the beginning of the first period).
AER draft decision | Envestra 2013–17 | Draft decision appendices 27

in returns is, the greater is the difference between arithmetic and geometric averages.
The difference between arithmetic and geometric averages becomes apparent through a simple example. Suppose an index starts at 100, falls to 80 (a loss of 20 per cent) by the end of year 1 and then increases again to 100 (a gain of 25 per cent) by the end of year 2.
The arithmetic average return simply takes the average of the rates of return over the life of the investment. In this example, the arithmetic average rate of return = (rate of return in year 1+ rate of return in year 2) / total years of investment = (-20% + 25%) /2 = 2.5%.
On the other hand, a geometric average rate of return measures the change between the initial value and final value of the investment over the life of the investment. In this example, the geometric average rate of return = (final value of the investment / initial investment) ^ (1 / total years of investment) - 1 = (100 / 100 ) ^ (1/2) – 1 = 0%.
If 0 per cent annual return is applied to the index for two years, then the index is at 100 by the end of year 2. This zero return is consistent with the outcome that the index has not changed after two years. By contrast over a two year investment horizon, the arithmetic average would overstate the return because the index value has not changed after two years.
However, if the investment horizon is one year, then the arithmetic return would be the correct estimate. To form an expectation about one year in the future based on historical evidence one would look at what is possible over a one year horizon. In this example, we assume either a loss of 20 per cent or a gain of 25 per cent. Assuming these outcomes are of equal possibility, the expected return would be 2.5 per cent. In this case, the geometric average would be an underestimate of the expected forward looking return.
Since the WACC review, the AER has developed a deeper understanding of the averaging of historical excess returns over multiple periods. It considered the arithmetic average of one year historical excess returns overstates the arithmetic average of 10 year historical excess returns. It held this position in the Envestra South Australia decision (and subsequent decisions),107 so had regard to both arithmetic and geometric averages in considering the appropriate value for the MRP in this decision.
107 See: AER, Final decision: Envestra Ltd access arrangement proposal for the SA gas network 2011–2016, June 2011 p. 191 (AER, Final decision: Envestra access arrangement SA, June 2011); AER, Final decision: Envestra Ltd access arrangement proposal for the Qld gas network 2011–2016, June 2011, p. 179 (AER, Final decision: Envestra access arrangement Qld, June 2011); AER, Final distribution determination, Aurora Energy Pty Ltd 2012–13 to 2016–17, April 2012, p. 145 (AER, Final decision: Aurora distribution determination, April 2012); AER, Final decision: APTPPL access arrangement, August 2012, p. 69.
AER draft decision | Envestra 2013–17 | Draft decision appendices 28

In July 2011, Envestra sought review by the Australian Competition Tribunal of the AER's reliance on geometric averages, among other matters.108. In that matter, the AER considered the following:
The arithmetic average of 10 year historical excess returns would likely be an unbiased estimator of a forward looking 10 year return (the appropriate benchmark).
However, historical excess returns are conventionally estimated as the arithmetic or geometric average of one year returns. The historical excess return evidence available to the AER was based on this one year returns. Accordingly, the AER interpreted the (one year return) data based on the strengths and weaknesses of how closely the data reflected the relevant benchmark (being a 10 year rate, expressed in annual terms).
Mathematically, if the one year historical excess returns are variable, then the arithmetic average of one year historical excess returns overstates the arithmetic average of 10 year historical excess returns. This overstatement occurs because the process of averaging one year returns does not account for the cumulative effect of returns over a 10 year horizon.
Also mathematically, if the one year historical excess returns are variable, then the geometric average of one year historical excess returns understates the arithmetic average of 10 year historical excess returns.
The AER concluded the arithmetic average of the data it considered was an overestimate of the relevant benchmark and the best estimate of historical excess returns over a 10 year period was likely to be somewhere between the geometric and arithmetic averages of annual excess returns.109
The Tribunal stated it did not have to decide this matter, but made some comments. It appeared to agree with the AER when noting:
It may be accepted that an arithmetic mean of historical excess returns is an unbiased estimate of expected future one year returns. It is not, however, an unbiased estimate of expected future returns over longer time horizons. A geometric mean of historical annual returns does not provide an unbiased estimate of expected returns over longer time horizons, either.110
The AER considered a report prepared by SFG in the Roma to Brisbane Pipeline process. In that report, SFG submitted it was wrong to place any reliance on geometric averages and to the extent that reliance is (incorrectly) placed on geometric averages, the resulting MRP estimate is downwards biased. SFG presented a Harvard Business School case note in support of this position.111
The AER sought advice from McKenzie and Partington on the SFG report and Harvard Business School case note. In their February 2012 supplementary MRP report, McKenzie and Partington explained the Harvard case study 'assumes away
108 See Australian Competition Tribunal, Application by Envestra Ltd (No 2) [2012] ACompT 3, 11 January 2012 and Australian Competition Tribunal, Application by Envestra Ltd (No 2) [2012] ACompT 4, 11 January 2012.
109 Corrs Chambers Westgarth, Appendix B—market risk premium, the Australian Energy Regulator’s submissions, 11 November 2011, pp. 17–18.
110 Australian Competition Tribunal, Application by Envestra Ltd (No 2) [2012] ACompT 3, 11 January 2012, paragraph 157.
111 SFG, Market risk premium, Report for APT Petroleum Pipelines Ltd, 11 October 2011, p. 16 (SFG, MRP for APTPPL, October 2011).
AER draft decision | Envestra 2013–17 | Draft decision appendices 29

the source of bias in arithmetic averages'.112 The AER does not consider it is appropriate to assume no uncertainty about the mean of the distribution when analysing historical excess returns. Accordingly, it did not find SFG's evidence persuasive.
SFG also submitted the MRP in the CAPM is an expected return, so the arithmetic average (not the geometric average) 'must' be used.113 The Tribunal previously dismissed this argument when Envestra presented it:
Envestra's submission that, because the CAPM model uses expected returns, only the arithmetic mean may be used cannot be accepted once it is understood that the arithmetic mean of annual historic returns is not an unbiased estimate of expected ten-year returns.114
McKenzie and Partington supported the AER's view. After a review of literature on arithmetic and geometric averages, they concluded:
The evidence solidly supports the AER's position that over the ten year regulatory period the unbiased MRP lies somewhere between the arithmetic average and the geometric average of annual returns.115
The AER also considered a recent NERA report, which argued against using geometric averages116. NERA argued the WACC is used to determine regulated revenue using the building block equation; this equation deals with one year returns. Similarly, the AER noted the new advice from Lally that no compounding effect occurs in regulatory situations. Without a compounding effect, the arithmetic mean is preferable to geometric mean if annual returns are independent and drawn from the same distribution.117
The AER noted the building block model is a tool to achieve an outcome whereby the present value of expected revenue equals the present value of expected expenditure over the life of the regulated assets. From this perspective, the AER considers an appropriate discount rate requires the evaluation of an expected multi-period cost of equity.118 Further as shown in attachment 4, the arithmetic averages of historical excess returns range from 4.9 to 6.1 per cent. Accordingly, even if the AER were to only rely on the arithmetic average, this would not change its position on the appropriate MRP value.
112 In the Harvard case study, it assumes the probability of distribution is known. Since there is no uncertainty about the arithmetic mean of the return, the probably of measuring the MRP as discussed in the MRP section largely goes away. See further discussion at: M. McKenzie and G. Partington, Report to the AER, Supplementary report on the equity market risk premium, 22 February 2012, pp. 5–6 (McKenzie and Partington, Supplementary report on the MRP, February 2012).
113 SFG, MRP for APTPPL, October 2011, p.1 8.114 Australian Competition Tribunal, Application by Envestra Ltd (No 2) [2012] ACompT 3, 11
January 2012, paragraph 157.115 McKenzie, and Partington, Supplementary report on the MRP, February 2012, pp. 5–7.116 NERA Economic Consulting, The market risk premium: A report for CitiPower, Jemena, Powercor,
SP AusNet and United Energy, February 2012 (NERA, MRP for the Vic electricity DNSPs, February 2012).
117 M. Lally, The cost of equity and the market risk premium, 25 July 2012, pp. 31–32 (Lally, Cost of equity and the MRP, July 2012).
118 The AER’s consideration was discussed in detail in AER, Draft decision, APT Petroleum Pipeline Pty Limited access arrangement proposal for the Roma to Brisbane Pipeline 12 April 2012 – 30 June 2017, April 2012, pp. 295–296.
AER draft decision | Envestra 2013–17 | Draft decision appendices 30

Further, in the Envestra matter, the Tribunal also queried whether there is a method to produce an unbiased estimate. It stated it could not form a conclusion on that issue based on the material before it.
The AER sought McKenzie and Partington's advice on whether such a method is available. They analysed alternative proposals in the literature and concluded in their February 2012 MRP report that no single best estimator is indisputably best for long run excess returns. Given current knowledge, McKenzie and Partington recommended the use of both arithmetic averages and geometric averages, tempered by an understanding of their inherent biases.119 The advice of McKenzie and Partington supported the AER continuance with its current approach.
The AER notes the consultants have different views, which need assessing to determine a reasonable approach. In view of the conflicting evidence, the AER considers it should review both arithmetic and geometric averages when considering the historical estimates of the MRP. It is aware of potential deficiencies with both averages, so does not exclusively rely on one or the other. In attachment 4.3.3, the AER had regard to both arithmetic and geometric averages of historical excess returns tempered by an understanding of the biases associated with these averages.
B.2.2Survey evidence
Addressing the Tribunal’s comments on the use of survey evidence
The AER considers survey results are relevant as they reflect the forward looking MRP applied in practice. The Tribunal reviewed the final decision for Envestra, which included the issue regarding the use of survey evidence to inform the value of MRP.120 The Tribunal stated while it did not have to decide this matter, it made a few comments:
Surveys must be treated with great caution when being used in this context. Consideration must be given at least to the types of questions asked, the wording of those questions, the sample of respondents, the number of respondents, the number of non-respondents and the timing of the survey. Problems in any of these can lead to the survey results being largely valueless or potentially inaccurate.
When presented with survey evidence that contains a high number of non-respondents as well as a small number of respondents in the desired categories of expertise, it is dangerous for the AER to place any determinative weight on the results.
In its February 2012 report, NERA raised similar questions about the use of survey evidence. About the surveys that the AER cited, NERA stated:
the surveys typically do not explain how those surveyed were chosen
a majority of those surveyed did not respond
119 McKenzie, and Partington, Supplementary report on the MRP, February 2012, pp. 7–9.120 Australian Competition Tribunal, Application by Envestra Limited (No 2) [2012] ACompT 3, 11
January 2012, paragraphs 165–166.
AER draft decision | Envestra 2013–17 | Draft decision appendices 31

it is unclear what incentives were provided to ensure respondents would provide accurate responses
whether respondents supplied MRP estimates that use continuously compounded or not continuously compounded returns is unclear
the risk-free rate that respondents use is unclear
the relevance of some of the surveys is unclear given changes in market conditions since the surveys were conducted.121
In light of the Tribunal's comments, the AER engaged McKenzie and Partington to review the Tribunal's criteria on survey evidence. The following sections discuss the main findings of McKenzie and Partington and the AER’s own review. These findings apply to much of the concerns raised by NERA.
Timing of the survey
The AER considers the timing of the surveys is reasonably clear: Across the surveys, it ranged from 2000 to February 2011. Comparison of survey results over different time periods can provide information on how market practitioners’ perception of the MRP change over time. By considering survey results for the past 10 years, the AER notes market participants have not changed their view on the MRP. This consistency in survey responses over time suggests the AER can reasonably rely on the earlier surveys.
Sample of respondents
Financial managers, expert valuers, actuaries and finance academics were the target respondents of surveys. These professionals apply the MRP, so the AER considers the surveys' target populations can make informed judgments about the MRP. McKenzie and Partington supported this view in their February 2012 MRP report.122 In their August 2012 report, McKenzie and Partington further noted many surveys clearly described the selection of the sample surveyed. These academic papers would be published only with a clear explanation of how the sample was chosen.123
Wording of survey questionnaires
The quality of questionnaire wording is important for reducing bias and promoting the accuracy of survey results. The AER agrees with McKenzie and Partington that the adequacy of survey wording can be subjective to judge and often relies on the quality of the authors. 124
It also agrees that confidence can be enhanced when the work is published in a refereed academic journal, or when the survey is repeated. In the former case, the work has to be peer reviewed. In the latter case, a stable set of questions allows comparison of responses over time. With repeated surveys, the observed 121 NERA, MRP for the Vic electricity DNSPs, February 2012, p. 31.122 McKenzie and Partington, Supplementary report on the MRP, February 2012, p. 17.123 M. McKenzie, and G. Partington, Report to the AER: Review of regime switching framework and
critique of survey evidence, 7 September 2012, p. 27 (McKenzie and Partington, MRP: regime switching framework and survey evidence, September 2012, p.27)
124 McKenzie and Partington, Supplementary report on the MRP, February 2012, pp. 17–18.
AER draft decision | Envestra 2013–17 | Draft decision appendices 32

changes over time are less susceptible to issues with the wording. Further, any significant problems with wording and respondents' interpretation of questions may be detected and corrected over time.125 In terms of the surveys cited here, most were published in refereed journals and/or repeated over time.126 The AER is thus reasonably satisfied with the adequacy of the wording in the survey questionnaires.
Adjustment for imputation credits
The AER noted some surveys implicitly acknowledged imputation credits:
Truong, Partington and Peat (2008) found 15 per cent of responses adjusted for the value of imputation credits. Of the remaining 85 per cent of responses, the main reasons given for not adjusting for imputation credits were:
it was too difficult
it would have a very small impact
it was unnecessary because the market already adjusts stock prices for the value of imputation credits, which are thus already reflected in the cost of capital estimate.
In Asher (2001) survey, 27 of 49 respondents indicated they adjusted their MRP estimates for imputation credits.
The AER also notes other surveys suggested respondents do not typically allow for imputation credits. Even for the surveys that discussed imputation credits, the extent of adjustments made to the MRP estimate was unclear. McKenzie and Partington acknowledged this uncertainty and noted any adjustment for imputation would likely be within the margin of measurement error. They thus recommended the AER take the survey evidence at face value, but tempered by the uncertainty of whether an imputation credit adjustment is needed.127 The AER accounted for this uncertainty when interpreting survey evidence.
Survey response rate and non-response bias
The AER considers a sufficient level of response rate is important for survey evidence. But what constitutes a sufficiently large sample is subjective. McKenzie and Partington suggested a sample size of more than 30 is sufficiently large statistically so a representative sample of 30 respondents is expected to be adequate.128 Most surveys considered in this decision received around 30 responses.
The AER recognises low response rates are a common problem with the survey evidence. However, while the number of responses in a survey is important, the main concern is whether respondents are representative of the target population. 125 McKenzie and Partington, Supplementary report on the MRP, February 2012, pp. 17–18.126 Truong, Partington and Peat (2008) and Asher (2011) were published in academic journals.
Fernandez surveys are repeated over time. KPMG (2005), Capital Research (2006) and Bishop (2009) are neither of these.
127 McKenzie and Partington, MRP: regime switching framework and survey evidence, September 2012, p. 28.
128 McKenzie and Partington, Supplementary report on the MRP, February 2012, pp. 17–18.
AER draft decision | Envestra 2013–17 | Draft decision appendices 33
That is, for some reason, non respondents may systematically favour a different MRP from that of the respondents of the survey. McKenzie and Partington supported this view.129
A direct assessment of representativeness is difficult because the responses of the non-respondents are unknown. McKenzie and Partington noted Graham and Harvey (2010) concluded the response rate is not a significant concern for representativeness, for the following reasons:
The response rate was within the range documented in many other survey studies.
Graham and Harvey (2001) conducted a standard test for non-response biases and found no evidence of bias.
Brav, Graham, Harvey and Michaely (2005) conducted a captured sample survey at a national conference in addition to an Internet survey. The captured survey responses (to which over two-thirds participated) were qualitatively identical to those for the Internet survey (to which 8 per cent responded)
Brav, Graham, Harvey and Michaely (2005) contrasted survey responses to archival data from Compustat and found archival evidence was consistent with the responses from the survey sample.
Campello, Graham, and Harvey(2010) showed the December 2008 response sample was fairly representative of the firms included in the commonly used Compustat database.
The AER recognises the surveys considered in this decision do not specifically address the non-response bias. However, Graham and Harvey's findings are likely to apply to the other survey evidence, so the AER is reasonably satisfied low response rates or a potential non response bias is not reason to exclude the survey evidence from consideration.
Triangulation
McKenzie and Partington placed weight on the survey evidence because triangulation across surveys enhanced their confidence in the results. The idea behind triangulation is that a specific survey may be subject to a type of bias, even if that bias is not evident. However, this problem would be much less likely to be consistent across surveys with diverse methods and different target populations.
McKenzie and Partington illustrated triangulation in survey evidence considered by the AER. They found the Australian surveys conducted using different methods and different target populations at different times supported a MRP estimate of 6 per cent:
...consider an illustration of triangulation in action. The KPMG survey looks at the market risk premiums used in expert reports. This might be criticised on the basis that the same expert might have produced many reports and thus that one expert’s views are overweighted. If that expert’s view is divergent from other experts, then the result will be a biased estimate of the MRP for the expert sample. The effect is analogous to non-response bias in a
129 McKenzie and Partington, Supplementary report on the MRP, February 2012, pp. 18–19.
AER draft decision | Envestra 2013–17 | Draft decision appendices 34

traditional questionnaire survey. Bishop (2009) addresses this problem by surveying experts’ reports and collecting the MRP by expert, so each expert’s opinion is equally weighted. Bishop also uses a different, although probably overlapping, sample of reports to KPMG. Both studies give a MRP of 6%, thus confidence is enhanced that the MRP used by experts is 6%.130
The triangulation of survey results is a relevant consideration. By examining a wide range of survey evidence, which uses different methods and targets different respondents, it improves the reliability of survey results.
Conclusion on survey evidence
Survey evidence reflects the forward looking MRP when applied in practice. It is subject to limitations, such as the uncertainty on imputation credit adjustment. However, based on its own review and the advice from McKenzie and Partington, the AER considers survey based estimates of the MRP are relevant to inform the forward looking MRP. In this decision, it considered a range of survey evidence conducted in different time periods and targeted at different respondents. The evidence supported a forward looking MRP of 6 per cent as the best estimate in the current circumstances.
B.2.3DGM estimates
DGM analysis can provide information on the expected MRP. It examines the forecast future distributions of businesses and derives the cost of equity that makes these distributions consistent with the market valuation of the equity of those businesses. However, the AER considers the DGM based estimates of the return on equity and inferred estimates of the MRP are highly sensitive to the assumptions made. If all assumptions are not sound, estimated results from DGM analysis may be inaccurate.131 McKenzie and Partington supported this view in their December 2011 MRP report:
Clearly valuation model estimates are sensitive to the assumed growth rate and a major challenge with valuation models is determining the long run expected growth rate. There is no consensus on this rate and all sorts of assumptions are used: the growth rate in GDP; the inflation rate; the interest rate; and so on. A potential error in forming long run growth estimates is to forget that this growth in part comes about because of injections of new equity capital by shareholders. Without allowing for this injection of capital, growth rates will be overstated and in the Gordon model this leads to an overestimate of the MRP.132
In the WACC review and its recent decisions, the AER considered the following: The implied MRP produced by DGM estimates is sensitive to both the model
specification and the exact point in time of estimation.
No input assumptions are reliable. Generally, the expected market growth rate in dividends per share (a key input) is proxied with analysts' short term
130 McKenzie and Partington, Supplementary report on the MRP, February 2012, p. 20.131 Corporate finance texts have noted '[t]he simple constant-growth DCF [discounted cash flows]
formula is an extremely useful rule of thumb' but '[n]aive trust in the formula has led many financial analysts to silly conclusions'. R. Brealey, S. Myers and F. Allen, Principles of Corporate Finance, McGraw-Hill Boston: 9th International Edition, 2008, p. 95.
132 M. McKenzie and G. Partington, Report to Corrs Chambers Westgarth: Equity market risk premium, 21 December 2011, p. 25 (McKenzie and Partington, Equity market risk premium, December 2011).
AER draft decision | Envestra 2013–17 | Draft decision appendices 35
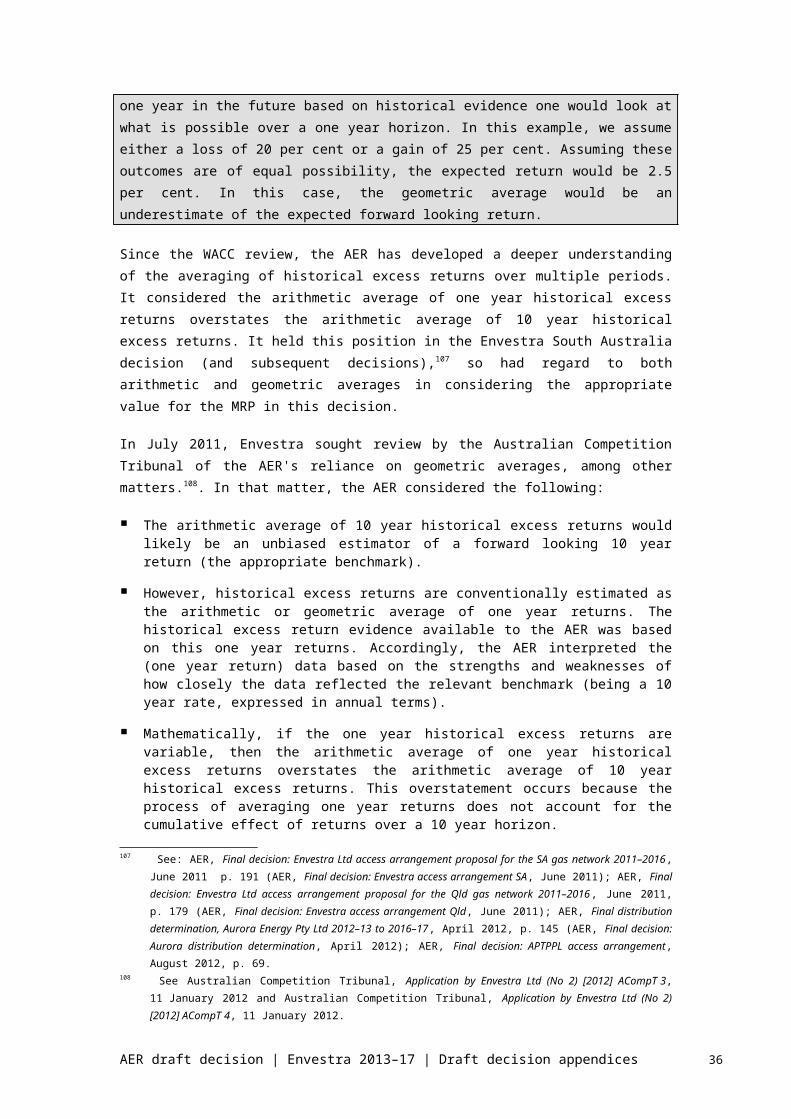
forecasts of market wide earnings per share growth, or long term expectations of GDP growth (or both). Associate Professor Lally advised such proxies are likely to produce an upward bias in the MRP estimates.133
Regulators had previously been wary to lower the MRP when DGM estimates were below 6 per cent.134 The AER is similarly wary to increase the MRP (based on DGM estimates) even though the DGM estimates can produce estimates above 6 per cent.
At the WACC review, academics (Officer and Bishop, and CEG) and industry representatives (ENA) considered DGM estimates should be used as a 'cross check' on the reasonableness of other methods to estimate the MRP, rather than as the primary method.135
Although DGM is extensively used by the US economic regulators in estimating the return on equity136, it is not well accepted for use in the Australian context.137
The AER considered submissions advocating DGM inferred MRP estimates. CEG, Capital Research, NERA and Lally all recommended the DGM for estimating a forwarding looking MRP. The DGM estimates derived by CEG, Capital Research and NERA supported an MRP estimate above 6 per cent. But, while DGM based analysis can provide information on the expected MRP, the AER considers the limitations discussed below limit the emphasis that should be attached to that analysis.
DGM estimates and its assumptions
BHP, McKenzie and Partington, and Lally supported the view that DGM estimates are highly sensitive to the assumptions made.138 Further, different consultants produce widely different DGM based MRP estimates over a short period. Table B.1 illustrates the consultants' current estimates, which range from 6.18 per cent to 9.56 per cent.
Table B.1 Recent DGM based MRP estimates produced by consultants
Dividend yieldDividend
per share growth
RFR MRP estimate
CEG (March 2012) 5.68% 6.60% 3.77% 8.52%
Capital Research (Feb 2012) 4.70% 7.00% 5.08% 6.62%
Capital Research (Feb 2012) 5.23% 7.00% 5.08% 7.15%
133 Lally, Cost of equity and the MRP, July 2012, pp. 11–18.134 AER, Final decision: WACC review, May 2009, p. 220.135 AER, Final decision: WACC review, May 2009, pp. 218–219.136 CEG, Risk free rate and MRP in the CAPM, March 2012, p. 38.137 The AER understands that the US might have better quality data for DGM analysis. 138 BHP Billiton, Submission to the AER: APA GasNet access arrangement proposal, 29 June 2012,
pp. 13–14; McKenzie and Partington, Equity market risk premium, December 2011, pp. 23–27; Lally, Cost of equity and the MRP, July 2012, pp. 15–18.
AER draft decision | Envestra 2013–17 | Draft decision appendices 36
Capital Research (Feb 2012) 5.71% 7.00% 5.08% 7.63%
Capital Research (Mar 2012) 6.29% 7.00% 3.73% 9.56%
NERA (Feb 2012) Bloomberg and IBES forecasts
5.65% 3.96% 7.72–7.75%
NERA (Feb 2012) Bloomberg and IBES forecasts
5.65% 5.50% 6.18–6.21%
NERA (March 2012) Bloomberg and IBES forecasts
5.65% 3.99% 7.69–7.72%
Sources: CEG, Capital Research, NERA.
In the February 2012 report, Capital Research estimated an implied MRP range of 6.6 to 7.5 per cent. In estimating this range, it assumed a compound average growth rate of 7 per cent based on analysts' forecast, and a theta value of between 0 and 0.5.139 Capital Research's analysis demonstrated the sensitivity of the DGM analysis to its assumptions. Capital Research illustrated an increase of 0.5 in the theta assumption translates to a 0.8 to 1.2 per cent increase in the implied MRP.140 Further, in the March 2012 report, Capital Research updated this estimate to 9.6 per cent (an increase of more than 2 per cent) with a more recent risk free rate and a net theta value of 0.2625.141
NERA’s DGM estimates also illustrated this problem. NERA estimated an MRP of 5.06 per cent in February 2011 based on the DGM analysis. Using the same dividend yield and growth assumptions, the MRP estimate was at 8.01 per cent in December 2011—a difference of 295 basis points.142 This difference was a result of the lower risk free rate. Table B.2 illustrates the sensitivity of NERA's DGM analysis to different risk free rates.
Table B.2 NERA MRP estimates with different risk free rates
Risk free rate Dividend yield Dividend per share growth MRP estimate
139 Capital Research, Forward estimate of the market risk premium: Update: A response to the draft distribution determination by the AER for Aurora Energy Pty Ltd, February 2012, pp. 19–23 (Capital Research, MRP estimate for the Aurora determination, February 2012).
140 Capital Research, MRP estimate for the Aurora determination, February 2012, table 2, p.21.141 Capital Research, Forward estimate of the market risk premium: Update: A report prepared for
the Victorian gas transmission and distribution businesses: APA Group, Envestra, Multinet Gas and SP AusNet, March 2012, p. 33 (Capital Research, MRP estimate for the Vic NSPs, March 2012).
142 NERA, Prevailing conditions and the market risk premium: A report for APA Group, Envestra, Multinet and SP AusNet, March 2012, pp. 49–50 (NERA, Prevailing conditions and the MRP, March 2012).
AER draft decision | Envestra 2013–17 | Draft decision appendices 37

5.47% Bloomberg consensus forecasts 5.65% 5.06%
3.99% Bloomberg consensus forecasts 5.65% 7.69%
3.67% Bloomberg consensus forecasts 5.65% 8.01%
Source: NERA, Prevailing conditions and the market risk premium, March 2012, pp. 39 and 50.
Similarly, tables 1.4-1.6 below illustrate how sensitive CEG's DGM based estimate is to different assumptions. The MRP estimates move ‘one-for-one’ with the changes in assumptions.
Table B.3 MRP estimates with different growth assumptions
DPS growth Div yield RFR MRP estimate
6.60% 5.68% 3.77% 8.52%
6.00% 5.68% 3.77% 7.91%
3.50% 5.68% 3.77% 5.41%
0.00% 5.68% 3.77% 1.91%
Source: AER analysis
Table B.4 MRP estimates with different dividend yield assumptions
DPS growth Div yield RFR MRP estimate
6.60% 5.68% 3.77% 8.52%
6.60% 5.00% 3.77% 7.83%
6.60% 3.00% 3.77% 5.83%
6.60% 1.00% 3.77% 3.83%
Source: AER analysis
Table B.5 MRP estimates with different prevailing risk free rates
DPS growth Div yield RFR MRP estimate
AER draft decision | Envestra 2013–17 | Draft decision appendices 38
6.60% 5.68% 3.77% 8.52%
6.60% 5.68% 3.00% 9.28%
6.60% 5.68% 5.00% 7.28%
6.60% 5.68% 6.00% 6.28%
Source: AER analysis
Bias in DGM estimates
Lally noted other problems with the DGM analysis:
At a given time, the estimated cost of equity for the market is assumed to be the same for all future years. This ‘perfect offsetting’ hypothesis is implausible.
The method assumes the current value of the market matches the present value of future dividends. If the current value of the market is below the present value of future dividends, then the resulting estimate of the market risk premium will be too high.
Short term fluctuations in the market’s earnings retention rate have a significant impact on the estimates. The DGM method does not account for these changes.143
In addition to the above limitations, Lally identified two further problems with the 8.5 per cent MRP estimate derived by CEG:
By using the historical dividend yield, CEG ignores the (1+g) term in deriving the market cost of equity.
It is inappropriate for CEG to set the dividend growth to the long term GDP growth. By making such an assumption, the expected long term growth rate in all dividends from all companies would exceed that for gross domestic product. This outcome is logically impossible.144
Lally considered the net effect of these two problems is to overestimate the MRP by about 1 per cent. This overestimation is additional to the limitations discussed above.145
The AER also considered a report by Capital Research in 2005, which derived negative MRP estimates from DGM analysis for the period 1980–2004. Capital Research suggested a negative result is ‘nonsense’ and noted:
...We must be careful not to ask too much of this model. Recall that it is based on a constant growth assumption. Any model which makes such highly stylised and constant assumptions about the world is going to struggle to be relevant in a world undergoing dramatic changes. The result of the model suggesting negative risk premia is an outcome of a too precious model rather than the investment world being irrational.146
143 Lally, Cost of equity and the MRP, July 2012, pp. 15–18.144 Lally, Cost of equity and the MRP, July 2012, pp. 18–20.145 Lally, Cost of equity and the MRP, July 2012, p. 20.146 Capital Research, Australian market risk premium, January 2005, pp. 31–32.
AER draft decision | Envestra 2013–17 | Draft decision appendices 39

Similarly, the AER notes the CEG AMP method was producing MRP estimates at or below zero per cent back in 1994. The AER does not consider a zero or a negative MRP is realistic at any particular point in time. Lally supported this view:
...this assumption underlying Figure 8 can be tested by observing that the model gives rise to an estimated market risk premium of zero in 1994; this outcome is not plausible and therefore suggests that the underlying assumption is not plausible.147
The AER notes DGM analysis is producing high positive MRP estimates. However, it is not aware of evidence suggesting the estimates derived from DGM analysis are more reliable now than in 1994. Further, no new information has come to light that causes the AER to rely more on DGM estimates.
B.2.4Consultants’ views
The AER considered views from different consultants on the best estimate of the MRP. These views included:
views submitted by Envestra in support of its proposal—that is, the CEG approaches, Capital Research DGM estimates, and NERA regime switching model
advice received by the AER—that is, the McKenzie and Partington report and Lally's advice
approaches proposed by other regulated businesses in recent regulatory processes—that is, the VAA implied volatility glide path approach and the SFG method.
Different consultants have widely different views. After carefully assessing these views, the AER places limited emphasis on DGM, the regime switching model, implied volatility glide path approach and other financial market indicators in estimating the value of the 10 year forward looking MRP. Its reasons are set out below.
CEG's approaches
CEG proposed three alternative approaches to estimate the cost of equity:
use DGM to directly estimate the cost of equity for comparable firms
use DGM to estimate the cost of equity for the market portfolio and derive a DGM estimate for the MRP
estimate a normal level for cost of equity for the reference service and make adjustments based on the current market evidence.148
The DGM estimates proposed by CEG are subject to the same limitations as discussed in the previous section. Lally further noted the CEG approaches are subject to problems, including errors in the AMP method, exposure to fluctuations in the earnings payout rate and ambiguity over the appropriate averaging
147 Lally, Cost of equity and MRP, July 2012, p. 22.148 CEG, Risk free rate and MRP in the CAPM, March 2012, p. 49.
AER draft decision | Envestra 2013–17 | Draft decision appendices 40
period.149 The AER considers these problems are relevant, so places limited emphasis on the CEG approaches.
Capital Research's DGM estimates
Capital Research advocated using DGM to directly estimate the forward MRP. It suggested the best forward looking MRP is 9.6 per cent, assuming a risk free rate of 3.73 per cent and a net theta of 0.2625.150
Capital Research's DGM estimate is subject to the same limitation as discussed in the DGM section. In addition, the DGM assumes growth at a constant rate in perpetuity. Capital Research use analysts' forecast dividend growth as a proxy. 151 Analysts' forecast is often based on short to medium terms. The AER considers using analysts' forecast growth rate in the DGM analysis is likely to result in an upward bias in the MRP. Mckenzie and Partington supported this view:
Since analysts only cover a subset of firms, whether we get a representative estimate for the market is an open question. Another problem is that analyst’s forecasts are known to be biased (generally upwards) and subject to gaming (see Scherbina, 2004, and Easton and Sommers, 2006).152
NERA's regime switching model
NERA produced DGM estimates of 7.69 and 7.72 per cent based on Bloomberg and I/B/E/S forecasts. However, NERA proposed a regime switching model would provide the most suitable MRP in the prevailing market condition. This model is highly complex and involves:
determining the appropriate assumptions of high and low volatility states
estimating the current probability of being in the high volatility state
using a Markov chain to roll over this probability
calculating a short term MRP in relation to the three month bill return
deriving a forward one year bill rate
converting the short term MRP to a five year MRP.153
The AER is not aware of any regulators that used a regime switching model in deriving their MRP estimates. Further, this complex process could create errors in calculation.154 In their August 2012 report, McKenzie and Partington found the NERA regime switching model is not a good fit of the data and does not provide sensible volatility estimates. They also noted the SFG report that reviewed the
149 Lally, Cost of equity and the MRP, July 2012, pp. 11–23.150 Capital Research, MRP estimate for the Vic NSPs, March 2012, p. 33151 Capital Research, MRP estimate for the Aurora determination, February 2012, pp. 19–23.152 McKenzie and Partington, Equity market risk premium, December 2011, p. 26.153 NERA, Prevailing conditions and the MRP, March 2012, pp. 24–31.154 For example, NERA estimated the probability of the market remaining in the high volatility state
was 0.935 per cent and the probability of it remaining in the low volatility state was 0.951 per cent. However, NERA estimated probability of the high volatility state for 2012–2016 based on the probability of it remaining in the low volatility state (0.951).
AER draft decision | Envestra 2013–17 | Draft decision appendices 41

NERA regime switching model did not provide insights to address this problem.155 Section B.2.5 details the AER’s considerations of the NERA regime switching model.
McKenzie and Partington report
In their December 2011 MRP report, Professor McKenzie and Associate Professor Partington considered four areas of evidence: historical excess returns, survey evidence, DGM analysis and other methods (including using international data, credit spreads and implied volatilities). They advised placing weight on historical excess returns and survey evidence; DGM and other methods can be used only as reasonableness checks and need to be interpreted with caution. McKenzie and Partington concluded there is little persuasive evidence for deviating from the long standing regulatory consensus of a market risk premium estimate of 6 per cent. If anything, the risk with this estimate is that it may prove to be an overstatement.156 McKenzie and Partington remained of this view in their February 2012 and August 2012 report, after having reviewed further materials submitted by businesses.157 The AER accepts McKenzie and Partington’s advice and considers their approach supports an MRP estimate of 6 per cent.
Lally's advice
Associate Professor Lally reviewed the AER's current approach and three approaches suggested by CEG. Lally found a number of problems with the CEG DGM approach and concluded DGM should be considered as a complement to rather than a substitute for the AER's current approach.158
The AER considers that Lally broadly supported the methodology to estimating the MRP adopted by the AER. In addition to the historical excess returns and survey evidence, Lally advised weight should also be placed on other methodologies including the Siegal approach, the DGM analysis and results from international markets.159
SFG's method
SFG proposed the three financial market indicators (implied volatility, credit spread and dividend yield) for estimating a 10 year forward looking MRP:
Implied volatility relies on contentious assumptions to derive an MRP estimate.160 In particular, the assumption that the price of risk per unit of implied volatility is constant is disputed on theoretical and empirical grounds.161 As noted above, this method provides only a short term estimate
155 McKenzie and Partington, MRP: Regime switching framework and survey evidence, September 2012, pp. 21–22.
156 McKenzie and Partington, Equity market risk premium, December 2011, pp. 36–37.157 McKenzie and Partington, Supplementary report on the MRP, February 2012, p. 5.
McKenzie and Partington, MRP: Regime switching framework and survey evidence, September 2012, pp. 24–25.
158 Lally, Cost of equity and the MRP, July 2012, p. 3.159 Lally, Cost of equity and the MRP, July 2012, p. 34.160 Further, the appropriate measure of implied volatility is difficult to determine, with different
measures (based on different underlying options) producing conflicting figures.161 See discussions in AER, Draft decision: Envestra Ltd: Access arrangement proposal for the SA
gas network 2011–2016, 17 February 2011, pp. 282–283 (AER, Draft decision: Envestra access
AER draft decision | Envestra 2013–17 | Draft decision appendices 42

of the MRP (usually three months, matching the term of the implied volatility measure), and the AER is unaware of any settled method to extrapolate to a longer term. Given the relevant MRP is the 10 year forward looking rate, the AER placed limited weight on the MRP estimate derived on this basis.
Credit spread refers to the difference in yields between bonds with high (AAA rated) and low (BBB rated) credit ratings. Similarly, relative debt spreads will differ based on the method chosen to measure the bond yields. McKenzie and Partington noted this method has no well developed, reliable and precise way to separate out the effect of changes in the MRP from other effects.162 Given this key limitation to the credit spread analysis, the AER placed limited weight on this method when determining the 10 year forward looking MRP.
Dividend yield in this context this is calculated for the entire market, using forecast distributions (dividends) for all firms in a broad share market index divided by the total value of those shares. The dividend yield estimate will differ based on the choice of index, the method of obtaining and aggregating dividend forecasts, and the horizon of those dividend forecasts. The AER considers the key limitation is the unclear relationship (if any) between dividend yield and the 10 year forward looking MRP.
Section B.2.6 details the AER’s assessment of the three financial market indicators.
VAA's implied volatility approach
In its 2010 report, the VAA suggested an implied volatility glide path approach in estimating the MRP.163 It derived the one year MRP estimate from the Black-Scholes option pricing formula for 12 month ASX200 index call options, then estimated a geometric average MRP over five years. The AER considers this approach is not a reliable method of estimating a forward looking 10 year MRP. It has the following concerns with this approach:
The MRP estimate relies on an assumption that the market risk per unit of option implied volatility is constant at 0.5.
Academic literature suggests option implied volatility is too highly variable to be used as a basis for estimating the forward looking 10 year MRP.
Projecting MRP estimates on this short term basis can result in highly variable estimates being produced over different short periods of time.164
Section B.2.7 details the AER's consideration of implied volatility.
arrangement SA, February 2011).162 McKenzie and Partington, Equity market risk premium, December 2011, pp. 30–31.163 VAA, Market risk premium: Comments on the AER draft distribution determination for Victorian
electricity distribution network service providers, July 2010, p. 19 (VAA, MRP for Vic electricity DNSPs, July 2010).
164 The Australian Competition Tribunal also recognised this view, in the DBNGP decision. See: Australian Competition Tribunal, Application by DBNGP (WA) Transmission Pty Ltd (No 3) [2012] ACompT 14, 26 July 2012, paragraphs 153–154.
AER draft decision | Envestra 2013–17 | Draft decision appendices 43
B.2.5NERA's regime switching model
NERA estimated an MRP of 8.44 per cent from the regime switching model. NERA submitted this estimate provided the most suitable guide to the MRP prevailing in the market because it provided an estimate of the MRP in each future year.165
NERA’s regime switching model was based on Hamilton (1989), in which the probability of being in each state is governed by a Markov chain (the probability of being in the high-volatility state next year will depend only on whether the process is currently in the high-volatility state). It calculated continuously compounded MRP estimates for each of the five future years using Brailsford, Handley and Maheswaran (2011) data and annualised 3 month bill rates. NERA then converted these continuously compounded MRP estimates into average not continuously compounded return of 8.44 per cent. 166 SFG peer reviewed NERA's regime switching model. SFG concluded NERA approach is appropriate for obtaining a prevailing MRP estimate in current circumstances.167
The AER engaged McKenzie and Partington to review this approach. They concluded the NERA regime switching model was not a good fit of the data and did not provide sensible volatility estimates. McKenzie and Partington fitted Handley (2012) data to a number of models. Although none of the switching models fit the data particularly well, relatively, the restricted switching model was the best fit. Further, McKenzie and Partington examined a simple GARCH model and found this model was more consistent with events in the equity markets than regime switching models. They advised the AER to reject NERA's approach on the grounds of misspecification of the functional form of the model.168
The AER notes McKenzie and Partington's view is relevant. It does not consider NERA's regime switching model can provide the best MRP estimate prevailing in the market when this model is misspecified. The AER also notes this model uses a Markov chain to govern the transition from one state to another. The stochastic nature of the states implies there is great uncertainty of the estimated current state. Tsay (2010) noted it is much harder to estimate a Markov switching model than other models because the states are not directly observable.169 Mckenzie and Partington illustrated this uncertainty with the Brailsford, Handley and Mahareshwan (2012) data:
... Figure [9] also features two horizontal dashed lines that represent one and two standard deviations of this data. These standard deviation based reference points serve to highlight the arbitrary nature of the two regime approach NERA (2012) take to modelling volatility. One could just as easily argue that rather than two regimes (high and low), a three regime approach is more sensible with a low, average and high volatility regime classified using
165 NERA, Prevailing conditions and the MRP, March 2012, p. 42.166 NERA, Prevailing conditions and the MRP, March 2012, pp. 24–31.167 SFG, Review of NERA regime-switching framework: Report for APA Group, Envestra, Multinet Gas
and SP AusNet, 29 March 2012, p. 8 (SFG, Review of NERA regime-switching framework, March 2012).
168 McKenzie and Partington, MRP: Regime switching framework and survey evidence, September 2012, pp. 5–25.
169 R. Tsay, Wiley series in probability and statistics: Analysis of financial time series, Wiley: Third edition, 2010, p. 187.
AER draft decision | Envestra 2013–17 | Draft decision appendices 44

these standard deviation based reference points. In fact, an n‐regime approach is possible, where n is > 1, with no compelling argument to be made for any one approach. The two regime model is certainly easier to estimate, however, ease of estimation is not a particularly valid justification for model choice.170
Table B.1 Brailsford, Handley and Mahareshwan (2012) data with different source indices highlighted
Source: McKenzie and Partington, Review of regime switching framework and critique of survey evidence, 27 August 2012, Figure 9
B.2.6SFG financial market indicators
The AER considered the use of other financial market indicators put forward in recent SFG reports as relevant to the estimation of the prevailing MRP. SFG used three financial market indicators—implied volatility, dividend yields and relative debt spreads—as 'conditioning variables' to adjust the MRP estimate around its long run average.171
The SFG approach using financial market indicators was put forward:
by Envestra in March 2011 as part of the South Australia and Queensland gas access arrangements172
by APTPPL (a subsidiary of APA Group) in October 2011 as part of the Roma to Brisbane Pipeline gas access arrangement173
by the Victorian electricity distribution network service providers (noting the overlap in ownership between these businesses and the Victorian gas networks) in a February 2012 submission on Aurora's regulatory determination174
170 McKenzie and Partington, MRP: Regime switching framework and survey evidence, September 2012, p. 20.
171 SFG, Market risk premium: An updated assessment and the derivation of conditional and unconditional estimates: Report for the Victorian electricity distribution businesses, 20 February 2012, pp. 8–13, 26–30 (SFG, Conditional and unconditional MRP for the Vic DNSPs, February 2012).
172 SFG, Issues affecting the estimation of MRP: Report for Envestra, 21 March 2011.173 SFG, MRP for APTPPL, October 2011.174 SFG, Conditional and unconditional MRP for the Vic DNSPs, February 2012.
AER draft decision | Envestra 2013–17 | Draft decision appendices 45

This technique was not proposed by Envestra in this review. The Victorian gas networks (including Envestra) did jointly commission two reports from SFG on the estimation of the MRP,175 but neither report included this technique.
Before assessing the combined SFG approach, the AER considers below each of the three financial market indicators put forward by SFG as relevant to the estimation of the MRP.
Implied volatility
Implied volatility is calculated from observing the price of put or call options over a broad share market index, such as the S&P/ASX 200. Applying a mathematical formula allows the calculation of the level of market volatility expected by market participants over the life of the underlying options.176 Hence, the term of the implied volatility will accord with the option term—usually three months, but ranging between one year and one month.177 The underlying principle is that higher implied volatility is indicative of higher risk and consequently a higher MRP.
The AER considered the use of implied volatility to inform the forward looking MRP in the WACC review and its previous decisions.178 The AER considers it cannot be used directly to estimate the MRP for the following reasons:
Term mismatch—the implied volatility measures are short term and there is no reasonable method to extrapolate to a longer term, but the relevant MRP term is 10 years.179
Measurement problems—different implied volatility measures produce different (and sometimes conflicting) results. Further, there is evidence that these measures are systematically biased (upwards).180
Contentious assumptions—observing the amount of risk (via implied volatility) does not equate to the price of that risk (which is what is relevant to the MRP). This gap is most commonly breached by assuming a constant ratio (for example, if the current implied volatility is double the long run average, then the MRP will also be double its long run average. This assumption is disputed on theoretical and empirical grounds.181
175 SFG, Review of NERA regime-switching framework, March 2012; and SFG, Market risk premium: Response to selected issues arising out of the AER final decision for Envestra (South Australia): Report for APA Group, Envestra, Multinet and SP AusNet, 29 March 2012 (SFG, Response on MRP for the Vic DNSPs, March 2012).
176 The Black-Scholes option pricing model is most often used, but other methods are possible.177 To clarify, options are sold with different maturities beyond this range, but the implied volatility
calculations are found only at these short term horizons.178 See AER, Final decision: WACC review, May 2009, pp. 231–234; AER, Draft decision: Envestra
access arrangement SA, February 2011, pp. 282–283; and AER, Final decision: Envestra access arrangement SA, June 2011, pp. 196–197.
179 See the discussion below on the VAA implied volatility glide path approach; also see AER, Draft decision: Envestra access arrangement SA, February 2011, pp. 282–283; and AER, Final decision: Envestra access arrangement SA, June 2011, pp. 196–197.
180 See the discussion of Chernov (2007) and Santa-Clara and Yan (2010) in AER, Draft decision: Envestra access arrangement SA, February 2011, pp. 282–283; and AER, Final decision: Envestra access arrangement SA, June 2011, pp. 196–197.
181 McKenzie, and Partington, Supplementary report on the MRP, February 2012. Also see the discussion of Doran (2005) in AER, Draft decision: Envestra access arrangement SA, February 2011, pp. 282–283; and AER, Final decision: Envestra access arrangement SA, June 2011, pp. 196–197.
AER draft decision | Envestra 2013–17 | Draft decision appendices 46

The AER’s view is shared by McKenzie and Partington who concluded in their February 2012 supplementary MRP report:182
Further work on this technique (implied volatility) might be warranted, but given the current state of play it could hardly be regarded as a validated method, let alone an accurate and reliable adjustment to the MRP.
When using its conditioning variables approach, SFG assessed implied volatility using 3 month options over the S&P/ASX 200 (labelled the Citibank Volatility Index or VIX). In its various reports, SFG stated that since the VIX was above its long run average, this indicated that the MRP was similarly above its long run average.183 Figure B.1 shows the value of this measure of implied volatility relative to its long run average level across the period since the global financial crisis.
Figure B.1 Implied volatility (VIX) over time
Source: Citibank VIX implied volatility index (3 month put/call options on S&P/ASX 200), sourced via Bloomberg code CITJAVIX.
As is evident from this figure, implied volatility is quite variable and can change substantially in months. The AER considers that this variability suggests implied volatility is not a reliable method to estimate the MRP. Figure also shows that although implied volatility rose dramatically during the GFC, this peak has subsided and the level of implied volatility has dropped below the long run average on several occasions.
182 McKenzie and Partington, Supplementary report on the MRP, February 2012, pp. 26–27 183 Since the SFG assessment of implied volatility is relative to the 'baseline' long run average, the
choice of baseline period is particularly important to the final result. The AER has previously noted that SFG inappropriately chose a shorter (post 2000) baseline period in its analysis, rather than the longest available data series; see AER, Final decision: APTPPL access arrangement, August 2012, pp. 222, 225–226.
AER draft decision | Envestra 2013–17 | Draft decision appendices 47
0
10
20
30
40
50
60
70
Jul-06 Jan-07 Jul-07 Jan-08 Jul-08 Jan-09 Jul-09 Jan-10 Jul-10 Jan-11 Jul-11 Jan-12 Jul-12
VolatilityIndex
VIX Index VIX Index long run average (1997-2012)
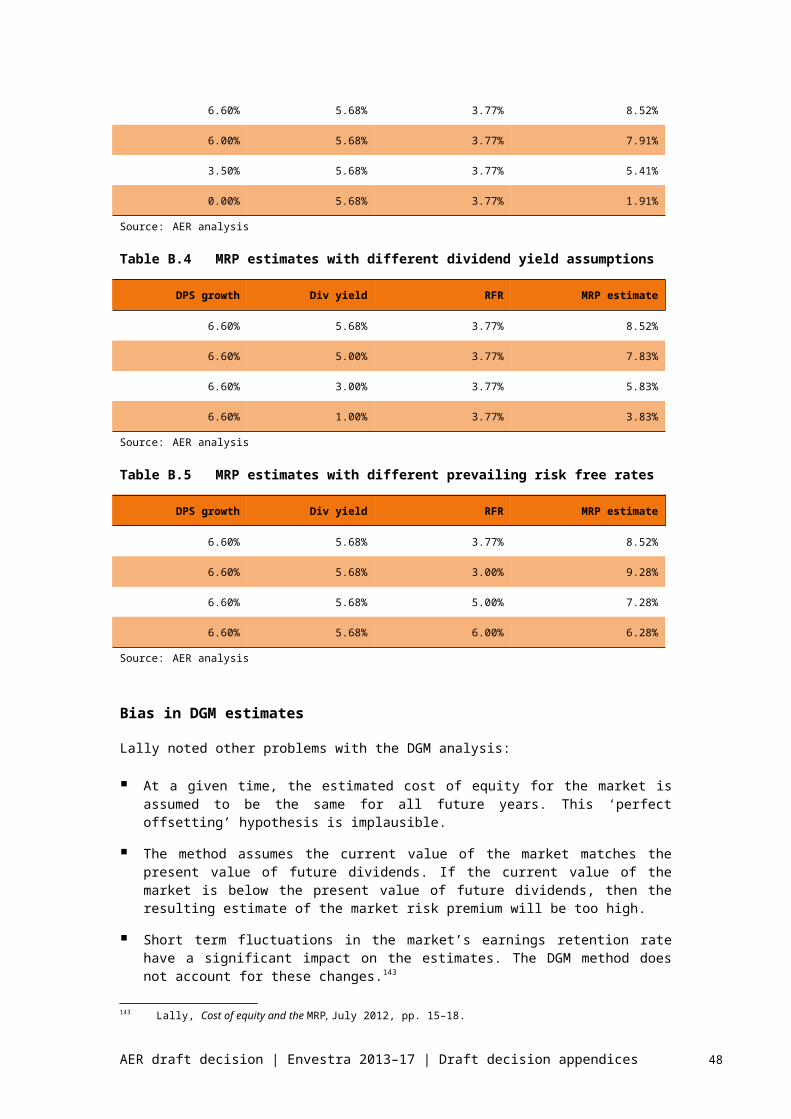
SFG advocated using the most recent data available when inferring the current MRP from implied volatility.184 Using data updated to 10 August 2012, it measures at 15.2 per cent, slightly below the long run average of 18.8 per cent (measured from the commencement of the data series in 1997). If this latest point estimate is used to inform the forward looking 10 year MRP, it appears to support a value at or slightly below the long term average MRP (that is, 6 per cent).185
Credit spreads
SFG also proposed the use of credit spreads to inform the estimation of the MRP. The idea is that the difference between an index of the yield to maturity on BBB-rated bonds and a corresponding index of AAA-rated bonds proxies for credit or default risk. During recessions, this debt yield spread widens, commensurate with an increase in risk premiums generally which implies a higher risk premium for equity.186
The AER considered the use of credit spreads to inform the forward looking MRP. But the AER considers a direct comparison of the yield on debt and the MRP is problematic. McKenzie and Partington supported this view for the following reasons:187
McKenzie and Partington expected the widening credit spreads during the GFC were substantially driven by increasing concern about the risk of default and this concern dries up the liquidity in debt markets. A combination of default premiums and liquidity premiums, therefore drove up returns in debt markets.
Given the GFC, the default risk component of the credit spread might reasonably be expected to have increased. Consequently, much of the change in debt yields during and after the GFC is likely due to a changed assessment of default risk.
A key element of the GFC was increasing credit risk, with a widespread perception that default risk had increased sharply. Consequently, the expected cash flow on risky debt declined, which caused the price of the debt to fall. Because the yield is calculated on the promised cash flow relative to the price, the yield on risky debt went up and the credit spread widened. This outcome would have happened even if the MRP, or debt betas, did not change.
An increase in credit spreads due to increased default risk does not automatically require a shift in the MRP. The MRP is an expected return and the yields on debt are a promised return. The promised return is only the same as the expected return for debt when there is no default risk. For all other debt the promised return is higher than the expected return. Because the debt yield and the MRP measure different things, effectively they are measured in different dimensions, they are not constrained to move in the same way and comparisons between them can be misleading.
184 However, it appeared that SFG did not always update its reports to include the most recent data, even allowing for a short practical delay encompassing analysis and publication. See AER, Final decision: APTPPLaccess arrangement, August 2012, pp. 218–226.
185 Briefly, the proposed relationship is that the current value of implied volatility relative to its long term average is indicative of the current value of the market risk premium relative to its long term average.
186 SFG, MRP for APTPPL, October 2011, p. 11. 187 McKenzie and Partington, Supplementary report on the MRP, February 2012, pp. 21–23.
AER draft decision | Envestra 2013–17 | Draft decision appendices 48

Dividend yields
Dividend yields refer to the forecast dividends (or other distributions) for all shares in a broad based market index divided by the current price of all shares in that index. A data provider generally aggregates the dividend forecasts from reports by different equity analysts, with the forecast horizon generally one year. The dividend yield is thus a simple indicator of the expected return to equity holders through dividends (although not allowing for capital gains/losses or imputation credits) over the next year. While closely related to the DGM, dividend yields are a different direct indicator of MRP.188
SFG stated higher dividend yields indicate a higher MRP. It is based this claim on several academic studies that found a statistically significant relationship when using dividend yields to predict equity market returns. 189 The intuitive explanation was that when dividend yields were high, a given set of cash flows was being discounted at a higher rate, indicating a higher MRP. In the February 2012 report, SFG estimated the dividend yield for the Australian share market at 31 January 2012 was 4.69 per cent. This value was above the long run average dividend yield, supporting an MRP above its long run average (SFG proposed 7 per cent).190
But the AER does not use the dividend yield approach to inform its MRP estimate because evidence of a relationship between the two is insufficient. While the AER acknowledges the three reports cited by SFG191 a broader consideration of the academic literature (by McKenzie and Partington) does not indicate the relationship is statistically reliable.192 The AER agrees with McKenzie and Partington's conclusion on this matter:193
SFG presents the dividend yield as a conditioning variable as though it were established fact. In contrast, in our main report we begin by excluding consideration of predictive models based on dividend yield. This is because in our view, this is still a developing area of research, rather than a well developed practical tool. We are not alone in this view as it is shared by others such as Dimson, Marsh and Staunton (2011), who are leading scholars in the area of the MRP.
The AER considers the underlying mechanism relating dividend yields and the MRP (as presented by SFG) is not persuasive. SFG appears to overlook other factors that could result in a higher observed dividend yield even when the MRP was unchanged (or lower).194 The forecast horizon for the dividends is short (generally one year); so a reduction in expected dividends beyond this point 188 More specifically, the DGM includes consideration of changes in dividends beyond the immediate
dividend forecast horizon.189 SFG, MRP for APTPPL, October 2011, p. 9.190 Specifically, SFG stated that the current dividend yield was 1.02 standard deviations above the
long run average. The AER does not consider this calculation to be correct, and discusses this later in the decision. SFG, Conditional and unconditional MRP for the Vic DNSPs, February 2012, p. 29.
191 Fama and French (1988, 1989) and Keim and Stambaugh (1986); see also Cochrane (2011) cited by McKenzie and Partington.
192 For example, papers by Stambaugh (1999); Fisher and Statman (2000); Goyal and Welch (2003); Armitage (2011), Dimson, Marsh and Staunton (2011); Jun, Gallagher and Partington (2011); and Min (2011). Papers cited in McKenzie and Partington, Equity market risk premium, December 2011, p. 4; and McKenzie and Partington, Supplementary report on the MRP, February 2012, pp. 13–14, 23–25.
193 McKenzie and Partington, Supplementary report on the MRP, February 2012, p. 23.
AER draft decision | Envestra 2013–17 | Draft decision appendices 49

would result in a lower price and a higher dividend yield. That is, a change in expected cashflow (not the discount rate or MRP) explains the result. McKenzie and Partington explained this point.195 The dividend yield calculation does not account for expectations about capital gain or loss. So, a change to expect relatively more of the total return from dividends instead of capital appreciation would also result in a higher dividend yield, even if the MRP did not change.
Finally, as with the other financial market indicators, as assessed higher than average dividend yield is predicated on an accurate estimate of the baseline figure. SFG calculated its long run average using data from 2000 , but did not justify using this time period.196 In this case, the relevant data series is available back to 1973.197 Using the longer data series would result in a higher baseline dividend yield. In turn, this increase would reduce the extent to which the current dividend yield was above the average and thus support a lower MRP.
Updated data using SFG method
Across recent reports, the conditioning variables presented by SFG have been relatively high. The core argument from SFG is that where there is a consistent pattern across these three financial market indicators, the prevailing MRP will be consistent with this pattern. For instance, if all three indicators are above their long run average, the prevailing MRP will be similarly above its long run average.
Table B.1 summarises the SFG results by presenting one key figure for each variable—the standardised difference between the current value and the long run average. 'Standardised' means that the difference is expressed in terms of the standard deviation for that data series. For example, a standardised value of +1.5 means that the current value is above the average value by 1.5 times the standard deviation for that series.
Table B.1 Conditioning variables presented by SFG in recent reports
SFG report date Implied volatility Dividend Yield Relative debt spread
March 2011 +0.80 +0.44 +0.87
October 2011 +2.17 +1.59 +0.77
February 2012 +2.17 +1.02 +1.95
Source: SFG figures provided to the AER, AER analysis
The AER updates the SFG data using a baseline that encompasses the longest available data series. Table B.2 shows the standardised difference between the current value and long run average for the three financial market indicators. However, the AER does not update the relative debt spread figures, because there
194 Other techniques build on the dividend yield approach in an attempt to address these shortcomings. The DGM projects dividend movements beyond the immediate dividend forecast horizon. The SFG 'market based' assessment using dividend yields combines the dividend yield with a forecast for capital gain/loss.
195 McKenzie and Partington, Supplementary report on the MRP, February 2012, pp. 12–13.196 SFG, Conditional and unconditional MRP for the Vic DNSPs, February 2012, p. 12.197 That is, the data series used by SFG and provided by them to the AER commences at this point.
AER draft decision | Envestra 2013–17 | Draft decision appendices 50

is no reasonable data available. The table includes the uncorrected relative debt spread figures for comparative purposes.
Table B.2 Conditioning variables after correction
Data period Corrected implied volatility
Corrected dividend yield
Uncorrected relative debt spread
To 15 March 2011 +0.10 +0.10 +0.87
To 23 September 2011 +2.25 +1.17 +0.77
To 31 January 2012 –0.12 +0.53 +1.95
To 10 August 2012 –0.49 +0.76 NA
Source: SFG figures provided to the AER, Bloomberg, AER analysisNotes: The dates of the first three rows coincide with the data presented in the three SFG reports.
The Datastream data on the relative debt spread (used by SFG) is not available to the AER and so cannot be updated. The Datastream data on dividend yields is not available to the AER, but an alternative series from Bloomberg has been used (correlation of 0.97).
As is evident in Table B.2, based on recent data, there is no consistent pattern across these three indicators. Implied volatility is slightly below its long run average. Dividend yield is slightly above its long run average. It is difficult to speculate on the value of an updated relative debt spread (the most recent SFG figure is now 7 months out of date).198
The AER does not consider SFG’s approach, using three financial market indicators to establish a conditional MRP, is a relevant basis to estimate a forward looking 10 year MRP. However, even if weight were to be given to this approach, it would support an MRP of 6 per cent.
B.2.7VAA implied volatility glide path
VAA previously proposed the use of option implied volatility combined with a 'glide path' to estimate the forward looking MRP.199 The VAA approach has been put forward:200
by the Australian Pipeline Industry Association (the industry group that represents all of the Victorian gas networks) in its January 2009 submission to the AER's WACC review201
198 To prevent misinterpretation, the AER does not consider that this figure is reliable.199 The AER has previously referred to this technique as 'Officer and Bishop's implied volatility glide
path', recognising that the authors of the VAA reports mentioned in this section are Professor Bob Officer and Dr Steven Bishop.
200 In addition to those listed below, the VAA approach has also been put forward by ETSA (SA electricity transmission) in June 2009, Westnet Energy (WA gas distribution) in December 2009 before the ERA, in a published journal article, and by NBN Co (national telecommunications) in December 2011 before the ACCC. VAA, Market risk premium: An estimate for 2010 to 2015: Prepared for ETSA, June 2009; VAA, Market risk premium: Estimate for January 2010 – June 2014: Prepared for WestNet Energy, December 2009; S. Bishop, M. Fitzsimmons, and B. Officer, JASSA The Finsia Journal of Applied Finance, 'Adjusting the market risk premium to reflect the global financial crisis', May 2011 (Issue 1 2011), pp. 8–14 (Bishop, Fitzsimmons and Officer (2011)); and VAA, Report on WACC component of NBN Co's Special Access undertaking, December 2011.
201 VAA, Market risk premium: Further comments: Prepared for Energy Networks Association, Australian Pipeline Industry Association and Grid Australia, January 2009.
AER draft decision | Envestra 2013–17 | Draft decision appendices 51

by the Victorian electricity distribution network service providers (noting the overlap in ownership between these businesses and the Victorian gas networks) in their 2010 regulatory determination,202 as well as the 2011 Advanced Metering Infrastructure determination203
by Envestra in the South Australia and Queensland gas access arrangements in 2011.204
The AER considered this approach, although Envestra did not propose it in this review.
Like the DGM and NERA's regime switching model, the VAA's approach estimates the prevailing MRP. Since the MRP estimate generated from implied volatility will have the same horizon as the underlying options, VAA estimated the MRP based on a ‘glide path’ approach. The basis of this technique is to:
first, estimating the volatility implied by the Black-Scholes option pricing formula for 3 month or 12 month S&P/ASX 200 index options.
second, converting this to a short term (3 month or 12 month) estimate of the MRP by assuming a constant market risk per unit of option implied volatility (in the range of 40–50 basis points per unit of risk)
third, estimating the geometric average MRP over five years assuming the MRP would revert (glide) down from the short term MRP estimate to a long term historical average.
VAA has considered different possible glide paths, such as a quicker return to the long term average, or a sustained elevated period before the decline commences. VAA has also given some consideration to 1 month and 6 month options, overseas implied volatility estimates, and the use of realised volatility (that is, the observed historical volatility using a rolling window containing the previous 30 or 90 days of data) as a proxy for implied volatility.
The AER has already set out above (in the discussion of SFG's approach using financial market indicators) concerns with using implied volatility when estimating the MRP. Further to those general concerns, the AER considers that the VAA implied volatility approach:
inappropriately determines the baseline long run average implied volatility by using a different data series—the realised volatility of a 90 day data window for the S&P/ASX 30 from 1980 onwards.205 Using this (historical) realised volatility series results in a long run average volatility of 14 per cent. The actual long run average of one of the (forward looking) implied volatility series
202 VAA, Market Risk Premium, Estimate for 2011–2015, Draft, October 2009; and VAA, MRP for Vic electricity DNSPs, July 2010. Note that although labelled as 'draft', the October 2009 report was submitted by the service provider as a finalised report.
203 VAA, Market Risk Premium, An update prepared in response to the draft determination by the AER on the Victorian Advanced Metering Infrastructure Review: 2012–15 budget and charges applications, August 2011.
204 VAA, Comments on the Market Risk Premium in Draft Decision by AER for Envestra February 2011, March 2011 (VAA, MRP for Envestra, March 2011).
205 VAA, MRP for Envestra, March 2011, p. 4 (footnote 7). Further, VAA appears to end its baseline period in 2009 even when using implied volatility data up to the end of 2010. See Bishop, Fitzsimmons, and Officer (2011), pp. 9, 14 (endnote 5).
AER draft decision | Envestra 2013–17 | Draft decision appendices 52
used by VAA (3 month VIX) s 18.8 per cent. Adopting the higher baseline would reduce the MRP estimated using the VAA approach in all scenarios.
incorrectly calculates the price per unit of implied volatility using a 'long run historical average MRP' of 7 per cent, when the evidence indicates that this value is 6 per cent.206 Adopting the lower historical average MRP would reduce price per unit of volatility, which in turn reduces the MRP estimated using the VAA approach in all scenarios.
The AER also has concerns with the glide path approach used to extend this (short term) implied volatility estimate. The glide path approach incorporates a variable three or twelve month estimate of implied volatility and then combines it with a long term historical estimate over a five year time horizon.207 The AER has previously noted the realised MRP could be below long term estimates in some years. The glide path approach excludes this possibility by construction. The AER also noted that the VAA approach averages five years of MRP estimates, and that this is inconsistent with the 10 year horizon assumed for the risk free rate. Further, the time period for reversion cannot reasonably be determined. Figure 1.1 demonstrates that from the peak, it took just 15 months for implied volatility to fall back below its long run average. This is considerably shorter than the three year reversion period preferred by VAA in their reports.
As noted above, although implied volatility was high during the worst of the GFC, the current level is below the long run average. Using data updated to 10 August 2012, it measures at 15.2 per cent, slightly below the long run average of 18.8 per cent (measured from the start of the data series in 1997). It is not entirely clear what glide path would be proposed by VAA in these circumstances, since no VAA report has been submitted where implied volatility was below the long run average.
Figure B.1 shows the same implied volatility measure as the previous figure, generated from 3 month options on the S&P/ASX 200 (plotted against the left hand axis). Superimposed on this are a number of MRP estimates submitted by VAA (plotted against the right hand axis), with a diamond marking the date of the report. These are the implied volatility estimates prior to the application of a glide path. Accordingly, the MRP estimates are for either 3 months or 12 months, as per the underlying option—this is shown by a dashed line extending across the relevant time period. This figure has been rescaled such that the long run average volatility (18.8 per cent, plotted against the left hand axis) matches the long run average MRP proposed by VAA (7 per cent, plotted against the right hand axis).
206 The AER sets out earlier in this decision its analysis of the historical excess return series.207 A geometric average of the five years is used.
AER draft decision | Envestra 2013–17 | Draft decision appendices 53

Figure B.1 Implied volatility and VAA MRP estimates
Source: Citibank VIX implied volatility index (3 month put/call options on S&P/ASX 200), sourced via Bloomberg code CITJAVIX; VAA reports; AER analysis
Figure B.1 shows the central relationship of the VAA implied volatility glide path approach—where the implied volatility is above its long run average, VAA considers that the MRP will also be above its long run average. In current circumstances, where implied volatility is below its long run average, the VAA approach to estimating the prevailing MRP would indicate that it is below the long run average.
The AER does not consider that VAA's implied volatility glide path approach is a relevant basis to estimate a forward looking 10 year MRP. However, even if weight were to be given to this approach, it would support an MRP estimate of 6 per cent (or slightly below).
B.2.8Market commentary and economic outlook
General market commentary and economic outlook provided by eminent bodies gives useful insights into the current and future state of the financial market. However, because most commentaries do not specifically refer to returns in equity markets, the link between the market commentary and the MRP is difficult to quantify. Consistent with comments by the Australian Competition Tribunal in a recent decision208 and the views of Multinet209 and SFG210, the AER places limited weight on this evidence.
208 Australian Competition Tribunal, Application by Envestra Limited (No 2) [2012] ACompT 4, 11 January 2012, paragraph 161.
209 Multinet, Access arrangement information, 30 March 2012, Appendix H-1, pp. 5–6. 210 SFG, Response on MRP for the Vic DNSPs, March 2012, pp. 18–19.
AER draft decision | Envestra 2013–17 | Draft decision appendices 54
0.0%
3.5%
7.0%
10.5%
14.0%
17.5%
21.0%
24.5%
0
9
19
28
38
47
56
66
Jan-07 Jul-07 Jan-08 Jul-08 Jan-09 Jul-09 Jan-10 Jul-10 Jan-11 Jul-11 Jan-12 Jul-12
VAAMRP
VolatilityIndex
3-month VIX Index Long run average VIX / VAA MRP
VAA 3-month MRP estimates VAA 12-month MRP estimates

B.2.9Reasons for the AER’s departure from the WACC review
The AER agrees with the view of SFG and McKenzie and Partington that the AER’s decision to increase the MRP to 6.5 per cent in mid 2009 was not well justified.211 It was being conservative at a time of significant uncertainty. In the WACC review at that time, the AER considered a range of evidence to decide on the best estimate of the forward looking 10 year domestic MRP. Acknowledging significant uncertainty in financial markets, it considered one of two scenarios could explain the market conditions: either the prevailing medium term MRP was above the long term MRP, but
would return to the long term MRP over time, or
a structural break had occurred in the MRP, and the forward looking long term MRP (and thus also the prevailing MRP) was above the long term MRP that previously prevailed.212
These reasons led to the AER's departure from the previously adopted value of 6 per cent.The global financial crisis (GFC) was a significant event, and its magnitude should not be understated. However, the impact of the GFC for Australian capital markets was moderate relative to international experience. The alternative scenario contemplated by the AER in the WACC review does not warrant keeping the MRP above the long run average in perpetuity. Information and data available since the release of the WACC review suggests the prevailing medium term MRP has not been above the long term MRP. The AER reached this conclusion based on the following evidence:
Survey measures since the height of the GFC accord with those from before the GFC.213
Implied volatility since the height of the GFC has returned to its long run average.214
Cyclical trends are observed in financial markets over time and typically involve shifts between periods of strong economic growth (boom) and periods of relative stagnation or sharp decline (recession). The fluctuations in financial markets are unpredictable, and cycle duration varies from more than a year to 12 years.215 When an investor considers the likely return across a 10 year horizon, these cyclical fluctuations are a normal experience. The long term expected return takes account of the expected future investment growth and decline. That is, the long term MRP has always been determined in the inevitable presence of these business cycles.
211 SFG, MRP for Envestra, March 2011, p. 5; McKenzie and Partington, Supplementary report on the MRP, February 2012, p. 29.
212 AER, Final decision: WACC review, May 2009, p. 238.213 See Fernandez (2009), Fernandez and Del Campo (2010), Fernandez et al. (2011), Asher (2011).214 For clarity, the AER notes the differing opinions on the implications of implied volatility
measurements for the long run MRP. This statement does not depend on such an assessment. Rather, the return of the implied volatility index to the pre-GFC average indicates this indicator of financial markets conditions did not undergo a structural break.
215 Burns and Mitchell, Measuring business cycles, National Bureau of Economic Research, 1946.
AER draft decision | Envestra 2013–17 | Draft decision appendices 55

McKenzie and Partington noted the AER's decision in the WACC review to increase the MRP to 6.5 per cent was not well justified. In their February 2012 MRP report, they stated:
We further consider that the decision to increase the MRP by 0.5% for a ten year regulatory period was not well justified as we would not expect the crisis conditions and extreme volatility to extend over such a long period. With the benefit of observing what has happened post-GFC it is appropriate for the AER to move back to the relatively safe ground of the unconditional MRP of 6% rather than persist with the conditional MRP of 6.5%. To put it another way the conditions justifying the shift to a conditional MRP have substantially abated so there is good reason to move back to the unconditional MRP.216
The AER has developed its understanding since the WACC review. Now, rather than increasing the MRP due to any short term effects, it considers it is reasonable to determine a long term (10 year) forward looking MRP.
The Energy Users Coalition of Victoria (EUCV)supported this view:
Regulated firms were supportive of the AER increasing the MRP in the depths of the GFC because the outcome increased their WACCs at a time when there was great uncertainty. The result of this move was to over-provide a rate of return for a considerable period and provide an unearned and unnecessary benefit to regulated firms. Quite sensibly the AER reduced the MRP when stability returned to the market as a whole and it was seen that the WACC based on a MRP of 650 bp was then providing a WACC that was excessive. Such an approach reflected the requirement for setting an efficient WACC based on best practice – both aspects that are explicitly required by the Gas Rules.217
B.3 Reasonableness checks on overall rate of return
In attachment 4, the AER evaluates the evidence on each WACC parameter individually. It also takes into account the interdependencies between WACC parameters where relevant. In this section the AER evaluates the overall rate of return derived from the individual WACC parameter values. The AER considers its determined overall rate of return is commensurate with prevailing conditions in the market for funds and the risks involved in providing reference services.218 In turn, the AER considers this overall rate of return provides a reasonable opportunity for Envestra to recover at least its efficient costs.219 In this appendix, the AER examines:
assets sales
trading multiples
broker WACC estimates
recent decisions by other regulators and the AER
recent decisions by overseas regulators 216 McKenzie and Partington, Supplementary report on the MRP, February 2012, pp. 28–30.217 Energy Users Coalition of Victoria, Submission to the AER: APA GasNet access arrangement
proposal, 18 June 2012, p. 46218 NGR, r. 87(1). 219 NGL, s. 24.
AER draft decision | Envestra 2013–17 | Draft decision appendices 56

the relationship between the cost of equity and the cost of debt.
Recent regulated asset sales
For recent transactions of regulated assets, for which relevant data is available, the AER compares the market value (i.e. the sale price) with the book value (i.e. the regulatory asset base).
Over the past few years, regulated assets have generally been sold at a premium to the RAB. If the market value is above the book value, this may imply that the regulatory rate of return is above that required by investors. Conversely, when the market value is below the book value, this may imply that the regulatory rate of return is below that required by investors.
Caution must be exercised before inferring that the difference indicates a disparity in WACCs, particularly where the difference is small. A range of factors may contribute to a difference between market and book values. A RAB multiple greater than one might be the result of the buyer: 220
expecting to achieve greater efficiency gains that result in actual operational and capital expenditure below the amount allowed by the regulator
increasing the service provider’s revenues by encouraging demand for regulated services
benefiting from a more efficient tax structure or higher gearing levels than the benchmark assumptions adopted by the regulator, and growth options
expecting to achieve higher returns if regulation is relaxed.221
Regulated asset sales in the market are also infrequent allowing limited opportunity to conduct this analysis. This is of particular relevance at present as the AER is setting a lower overall rate of return than in previous decisions. While asset sales in the future may reflect changes to the overall rate of return that are occurring at present, sales that have already occurred will not.
Regulated asset sales do, however, provide a useful real-world indication of whether market participants consider the AER's benchmark WACC to be, broadly speaking, reasonable. The consistent positive trend as discussed below provides evidence that the AER's WACC approach is not unreasonable.
The RAB multiples from each of these transactions, together with the transactions discussed above, are summarised in Table B.1 from most recent to least recent.
220 Each of these reasons assumes the purchasing firm is making a rational purchasing decision. Another reason for a RAB multiple greater than one might be that the purchasing firm misjudged the value of the target assets and paid too much for those assets. Each transaction considered by the AER involved sophisticated investors with significant knowledge of the industry. Accordingly, the AER does not consider it likely that the RAB multiples greater than one result from poor valuations of the target assets.
221 Grant Samuel & Associates Pty Limited, Financial Services Guide and Independent Expert Report in relation to the Recapitalisation and Restructure of Babcock and Brown Infrastructure, 9 October 2009, p. 77 (Grant Samuel, Expert report: Babcock and Brown Infrastructure, October 2009).
AER draft decision | Envestra 2013–17 | Draft decision appendices 57
Table B.1 Selected acquisitions – RAB multiples
Date Acquirer Entity/Asset acquiredRAB
multiple (times)
Dec 2011 Marubeni Corp/RREEF Allgas 1.20
Dec 2011 Marubeni Corp/RREEF Allgas 1.02
July 2011 ATCO 25.9% of West Australian Gas Networks 1.20
July 2011 DUET 20% of Multinet Gas 1.13
July 2011 DUET 20% of Dampier to Bunburry Natural Gas Pipeline 0.95222
Dec 2006 APA Directlink 1.45
Oct 2006 APA Allgas 1.64
Aug 2006 APA APA GasNet 2.19
Apr 2006 Alinta AGL Infrastructure assets 1.41-1.52
Mar 2006 APA Murraylink 1.47
Source: DUET223, APA224, Grant Samuel, AER calculations.
In October 2010, Envestra purchased Country Energy’s NSW gas network at a multiple of 1.25 times the 2010 RAB.225 Further details on this transaction can be found in the AER’s draft decision for the QLD/SA gas distribution networks.226
In July 2011, DUET sold its 25.9 per cent stake in West Australian Gas Network (WAGN) to ATCO Ltd in return for a 20 per cent interest in the Dampier to Bunbury pipeline (DBP) and a 20.1 per cent interest in Multinet.227 These transactions were at multiples of 1.20, 0.95 and 1.13 respectively.
222 Dampier to Bunbury Natural Gas Pipeline (DBNGP) presents an unusual case because it is 96% contracted until 2016 under shipper contracts. As the Economic Regulation Authority (ERA) of Western Australia states, these contracts ‘are substantially independent of the access terms and reference tariffs established under the access arrangement for the DBNGP.’ ERA, Final decision: DBNGP access arrangement, October 2011, p. 14. For this reason the DBNGP RAB multiple appears to be not driven by regulatory rates of return and does not provide a useful comparison for RAB multiples analysis.
223 DUET, ASX announcement: Presentation to Macquarie Retail Adviser Network, 19 January 2012, p. 3, viewed 9 February 2012, <http://www.asx.com.au/asxpdf/20120119/pdf/423tx0cd2v7qq3.pdf>.
224 APA Group, ASX announcement: Completion of the sale of 80% of Allgas, 16 December 2011, viewed 10 January 2012, <http://www.asx.com.au/asxpdf/20111216/pdf/423b5mnt9sqvzh.pdf> (APA Group, ASX ASX announcement on sale of Allgas, December 2011).
225 AER, Final decision: Country Energy Gas Pty Ltd: Access arrangement proposal for the Wagga Wagga natural gas distribution network, 2010–2015, March 2010 and Envestra, ASX announcement: Envestra's to acquire NSW gas networks - Market presentation, 26 October 2010, pp. 3, 6–7, viewed 10 January 2012, <http://www.asx.com.au/asxpdf/20101026/pdf/31tcv1nblp4xqc.pdf>.
226 AER, Draft decision: Envestra access arrangement SA, February 2011, p. 63. 227 DUET, ASX announcement: Completion of AET&D sale process, 29 July 2011, viewed 9 February
2012, <http://www.asx.com.au/asxpdf/20110729/pdf/420312nw1jxhdv.pdf>
AER draft decision | Envestra 2013–17 | Draft decision appendices 58

In December 2011, APA divested 80 per cent of its holding of APT Allgas (a gas distributor in South East Queensland) to Marubeni Corporation and RREEF; each acquiring 40 per cent equity stakes.228
APA stated that net funds released from the sale were $477 million after transaction costs and the net enterprise value was $526 million.229 Applying a RAB value, estimated at the sale date, to this enterprise value produces a multiple of 1.20.
This transaction involved the sale of both regulated and unregulated assets. Accordingly the RAB multiple may overstate the premium on the regulated assets as unregulated assets generally require a higher cost of capital.230
APA also stated that the sale price was in line with the book value of the assets. The gross sale price was $500.9 million, with the book value of assets sold at $488.8 million.231 This equates to a multiple of 1.02. These multiples can be considered the upper and lower bound estimates of the RAB multiple for this transaction.
Other historical sales have been at premiums of between 20 and 119 per cent to the regulated asset base.232
As Grant Samuel has previously explained, listed infrastructure entities should theoretically trade at, and be acquired at, 1.0 times the RAB.233 However, nearly all recent asset sales have been transacted at RAB multiples of greater than one.
Acquisition premiums have been substantial and are, as a result, unlikely to be solely explained by the factors noted above. This suggests that the regulated rate of return has been at least as high as the actual cost of capital faced by regulated businesses. Moreover, the consistency of the numbers across many transactions lends support to the conclusion that the regulated rate of return has been at least consistent with the efficient rate of return.
The AER notes that it is not possible to use RAB multiples analysis as an input when assessing individual parameters. The AER does not place any weight on this analysis during that process.
Recent regulated asset sales analysis provides a degree of confidence that the approach used in calculating the rate of return is reasonable. The AER has maintained a largely consistent approach to the calculation of the rate of return since the WACC review and that approach has been maintained for this
228 APA Group, ASX announcement on sale of Allgas, December 2011.229 APA Group, ASX announcement on sale of Allgas, December 2011 .230 Allgas is a holding company that also owns the unregulated Moura pipeline and the Gatton-
Gympie easement. 231 Net proceeds after transaction costs was $478.4 million, with transaction costs of $22.5 million
and a gain on sale of $12.1 million. APA Group, Interim Financial Report for the half year ended 31 December 2011, 22 February 2012, p. 3.
232 Grant Samuel, Expert report: Babcock and Brown Infrastructure, October 2009, p. 78. 233 Grant Samuel, Expert report: Babcock and Brown Infrastructure, October 2009, p. 77.
AER draft decision | Envestra 2013–17 | Draft decision appendices 59

decision.234 This suggests the AER’s approach in this decision will also provide Envestra with a reasonable opportunity to recover efficient costs.
Trading multiples
A comparison of the asset value implied by share prices against the regulatory asset base—often expressed as a ‘trading multiple’—also provides insight into the required rate of return.235
As with regulated asset sales, a trading multiple above one may imply that the market discount rate is below the regulated WACC. The same cautions with interpreting the results of the regulated asset sales approach apply to trading multiples. In addition, this assessment relies on the assumption that share prices reflect the fundamental valuation of the company.
Recent broker reports have identified RAB trading multiples.236 These multiples are consistently greater than one, as shown in Table B.2 to Error: Referencesource not found. None of these multiples are less than or equal to one.
Table B.2 JP Morgan trading multiples
Date of report Company 2010–11 2011–12
10 August 2012 DUET 1.26 1.18
24 August 2012 ENV 1.20 1.25
27 August 2012 SKI 1.26 1.22
29 August 2012 SPN 1.21 1.20
Source: JP Morgan237
Table B.3 Macquarie trading multiples
Date of report Company 2011 2012
1 August 2012 DUET 1.14 1.17
27 August 2012 SKI 1.35
28 June 2012 SPN 1.16 1.17
Source: Macquarie Group238
234 Changes have been made to the value of gamma, the value of the MRP and the estimation approach for the DRP.
235 The AER has not made any calculations of its own in this section. Trading multiples have only been stated where they could be identified in an external report.
236 The AER has reported trading multiples from reports published in August 2012—noting that the brokers do not always provide these figures (one report from June 2012 was included). Where possible, trading multiples for the previous year have also been presented to provide context, but only for those broker reports where a recent (August 2012) update was available.
237 JP Morgan, Envestra Limited: FY12 Result - dividend growth held back by regulatory concerns, 24 August 2012, p. 6; JP Morgan, DUET Group: FY12 Result Preview, 10 August 2012, p. 5; JP Morgan, Spark Infrastructure Group: 1H12 result earnings strength driven by regulatory tariff increases, 27 August 2012, p. 7; and JP Morgan, SP AusNet: AER decision positive, but risk remains, 29 August 2012, p. 9.
238 Macquarie, DUET Group, Curtain call, 1 August 2012, p. 3; Macquarie, Spark Infrastructure Group, ETSA sparkles through reliability, 27 August 2012, p. 1; Macquarie, SP AusNet, Cash
AER draft decision | Envestra 2013–17 | Draft decision appendices 60
Table B.4 Credit Suisse trading multiples
Date of report Company 2012
7 August 2012 DUET 1.14
7 August 2012 ENV 1.32
7 August 2012 SKI 1.36
7 August 2012 SPN 1.14
Source: Credit Suisse239
Table B.5 Bank of America Merrill Lynch trading multiples
Date of report Company 2012
23 August 2012 ENV 1.10
27 August 2012 SKI 1.39
Source: Bank of America Merrill Lynch240
Finally, Spark Infrastructure recently released a Fact Book showing an unadjusted trading multiple of 1.34 as at 24 February 2012. The Fact Book reports that this decreases to 1.10 when adjusted for total revenue excluding customer contributions.241
There are also other listed entities that hold regulated assets, such as APA and Hastings Diversified Utilities Fund. These companies are not conducive to RAB multiples analysis because they have a diverse portfolio of assets, sometimes unregulated, which makes it difficult to isolate the RAB.
Each of these figures cannot be considered definitive without careful consideration of the assumptions and methodologies used. They do, however, provide a useful insight into whether market analysts, and indeed industry analysts, consider the AER’s benchmark WACC is appropriate. Importantly, each multiple is calculated after the GFC and also after the AER’s WACC review.242
Recent comments by Macquarie in a broker report also suggest the AER’s WACC approach does not under-compensate service providers:
The importance of the RAB growth reflects our belief there is a sustainable arbitrage beyond the current regulatory period, that justifies paying a premium above RAB for these assets…This arbitrage reflects WACC calculations in the regulatory setting have a degree of conservatism.243
generation set to improve, 28 June 2012, pp. 1, 8.239 Credit Suisse, Regulated Utilities Monthly, Sector review, 7 August 2012, p. 10. 240 Bank of America Merrill Lynch, Envestra Limited, Earnings review, Flat divi in FY13, 23 August
2012, p. 5; Bank of America Merrill Lynch, Spark Infrastructure Group, Earnings review, Solid underlying cash flows, 27 August 2012, p. 5.
241 Spark Infrastructure, 2012 Fact Book, 27 February 2012, p. 9. 242 While the WACC review has no legal standing under the NGL or NGR, the AER has maintained a
largely consistent approach across gas and electricity decisions since the WACC review final decision was published.
243 Macquarie, DUET Group: Limited RAB growth, At fair value, 8 November 2011, p. 2.
AER draft decision | Envestra 2013–17 | Draft decision appendices 61

Comments made by the AEMC in its recent Directions Paper also lend support to the AER’s interpretation of broker reports and suggest the cost of debt may be a driver of the RAB multiple premiums:
A number of these [broker] reports indicate that the recommended valuations placed on these businesses by the equity analysts assume an ability for the NSPs to raise debt at a rate lower than the cost of debt allowed by the regulator. A number of the reports have indicated that a major reason why they value the NSPs at above their RAB is due to their ability to out-perform their cost of debt allowance. 244
When coupled with the consistently high multiples shown above, these comments suggest the regulatory rate of return has been at least as high as the actual cost of capital, and may have been in excess of it. The conclusion then is that the AER’s approach to setting WACC parameters provides a degree of confidence that the rate of return has been reasonable. It also provides a degree of confidence that the rate of return has allowed service providers a reasonable opportunity to recover at least efficient costs.
As with recent regulated asset sales, the AER notes that it is not possible to use RAB trading multiples analysis as an input when assessing individual parameters. The AER does not place any weight on this analysis during that process.
However, recent regulated asset sales analysis may provide a degree of confidence that the approach used in calculating the rate of return is reasonable. The AER has maintained a largely consistent approach for calculating of the rate of return since the WACC review and that approach has been maintained for this decision.245 This suggests the AER’s approach in this decision will also provide Envestra with a reasonable opportunity to recover efficient costs.
Broker reports
Equity analysts publish broker reports on listed companies operating regulated energy networks in Australia. These reports generally include WACC estimates along with a range of information, including analysis of current financial positions and forecasts of future performance.
In several previous decisions, the AER has used the WACC estimates from those broker reports as a reasonableness check on the rate of return determined by the AER through its detailed assessment of each individual parameter. In the Envestra matter, the Tribunal noted the reasons put forward by Envestra that the use of broker WACC estimates was an unreliable methodology. In response, the Tribunal stated:
It is fair to note that, as to those matters, the AER largely recognised the possible reasons why broker estimates might be unreliable and sought to make adjustments in that light. More importantly. the Tribunal accepts the AER submission that it did not estimate the WACC or the DRP by reference to the broker reports. It used them as a “useful reasonableness check” that its WACC estimate did not produce results which did not broadly accord with a
244 Australian Energy Market Commission, Directions Paper, 2 March 2012, p. 108. 245 Changes have been made to the value of gamma, the value of the MRP and the estimation
approach for the DRP.
AER draft decision | Envestra 2013–17 | Draft decision appendices 62

range of market opinions concerning firms that are a reliable proxy to the benchmark firm. Its use of the broker reports was thus an “output” test of the nominal vanilla WACC rather than an input into its calculation of the WACC. 246
The Tribunal emphasised that its finding that the AER’s use of broker WACC estimates did not fall into reviewable error was in the context of the ‘limited use’ to which the AER applied the broker WACC estimates.247
Consistent with its approach in previous decisions, the AER uses broker WACC estimates as a reasonableness check on the overall rate of return.
The limitations of the use of broker WACC estimates include:
the broker reports generally do not state the full assumptions underlying their analysis, or provide thorough explanations of how they arrive at their forecasts and predictions. As such, caution should be exercised in the interpretation of these broker reports248
the five listed companies considered undertake both regulated and unregulated activities, which are assessed by the brokers in aggregate. However, only the regulated activities are directly relevant to the risk in providing reference services. It is generally considered that the regulated activities of the firms—operation of monopoly energy transmission and distribution networks—tends to be less risky than the unregulated activities they undertake in competitive markets. As the regulated activities tend to be less risky, the return required on these activities could be expected to be less than the return required by these firms as a whole.249 This means that the overall WACC estimate implied by broker reports may overstate the rate of return for the benchmark firm
it is generally not clear what assumptions the brokers have relied upon when developing their WACC estimate. Further, variation in WACC estimates suggests that these assumptions are not consistent across the different brokers
the broker reports do not always provide sufficient information for the AER to calculate a nominal vanilla WACC estimate. Only those brokers who report the WACC in nominal vanilla form or provide sufficient detail to enable conversion to this form were considered. These figures are not necessarily precise estimates of the broker’s nominal vanilla WACC, since the AER has relied on its interpretation of the information provided
246 Australian Competition Tribunal, Application by Envestra Ltd (No 2) [2012] ACompT 3, 11 January 2012, paragraph 166.
247 Australian Competition Tribunal, Application by Envestra Ltd (No 2) [2012] ACompT 3, 11 January 2012, paragraph 167.
248 In particular, the AER considers that the price and dividend forecasts from these reports do not constitute a sufficiently reliable basis for calculation of an overall rate of return. However, the broker reports do often report discount rates, which are equivalent to the broker’s estimate of the WACC for the company.
249 Associate Professor Lally makes this point in relation to dividend growth model (DGM) estimates of the cost of equity which are based on listed regulated energy networks. That is, he states that as the unregulated activities tend to be have higher risk, the estimated cost of equity (based on data which takes into account the entirety of the firm’s activities) will tend to overestimate that for its regulated activities. Lally, Cost of equity and the MRP, July 2012, p. 14.
AER draft decision | Envestra 2013–17 | Draft decision appendices 63

Based on this analysis, Table B.6 sets out the range for the broker WACC estimates (converted to a nominal vanilla WACC) which is 7.76-10.02 per cent.250 The nominal vanilla rate of return determined by the AER for Envestra in this draft decision is 7.16 per cent. This is approximately 60 basis points below the range of the broker WACC estimates.
The AER considers that broker WACC estimates do not demonstrate that the overall rate of return, which is based on analysis of individual parameters, is not commensurate with prevailing conditions in the market for funds and the risk involved in providing reference services. For the reasons outlined in the specific parameter sections above, the AER is satisfied this is the case. The broker WACC technique is subject to known limitations and inherent imprecision. Further, the review of broker WACCs is the only aspect of the overall reasonableness check that has indicated a potential concern.
Table B.6 Broker WACC estimates (per cent)a,b
Measure Minimum Maximum
Broker headline post-tax WACC 6.50 8.60
Calculated nominal vanilla WACC 7.76 10.02
Source: AER calculations.a Issuers of broker reports considered: Credit Suisse, Goldman Sachs, JP Morgan, Deutsche
Bank.b Regulated energy networks evaluated in broker reports: APA , DUET Group, Envestra
Limited, Spark Infrastructure Group, SP AusNet.
Recent decisions by other regulators and the AER
The AER reviews a range of returns it approved for other gas and electricity service providers and also the rates of return in recent decisions by other Australian regulators. This provides a test of the reasonableness of the rate of return in this determination. Recent rate of return values set by the AER since the WACC review are lower than those previously provided. However, recent decisions by other regulators suggest that these values—and 7.16 per cent in this case—are reasonable.
The rate of return range applied by the AER in recent decisions for other gas and electricity service providers is 7.31 to 10.43 per cent.251 This range covers gas and electricity decisions made by the AER since the WACC review was completed in 2009 and includes the Roma to Brisbane final decision.
250 The table presents broker reports from August 2012. 251 AER, Final Decision: APTPPL access arrangement, August 2012; AER, Final Decision: Aurora
distribution determination, April 2012; AER, Final Decision: Powerlink Transmission determination 2012–13 to 2016–17, April 2012; AER Final Decision: Victorian distribution determination, October 2010, p. 519; AER, Final Decision: Queensland electricity distribution network service providers: Distribution determination 2010–11 to 2014–15, May 2010, p. 267; AER, Final decision: N. T. Gas access arrangement proposal for the Amadeus gas pipeline 2011–2016, July 2011, p. 80; Australian Competition Tribunal, Envestra: Annexure A (Part 2), Amended Access Arrangement, February 2012, p. 13; Australian Competition Tribunal, APT Allgas: Annexure A, Amended Access Arrangement, February 2012, p. 17; Australian Competition Tribunal, NSW Gas Networks: Annexure A, Amended Access Arrangement, June 2011, p. 18; Australian Competition Tribunal, ActewAGL Gas Distribution Network: Order, September 2010, p. 2.
AER draft decision | Envestra 2013–17 | Draft decision appendices 64
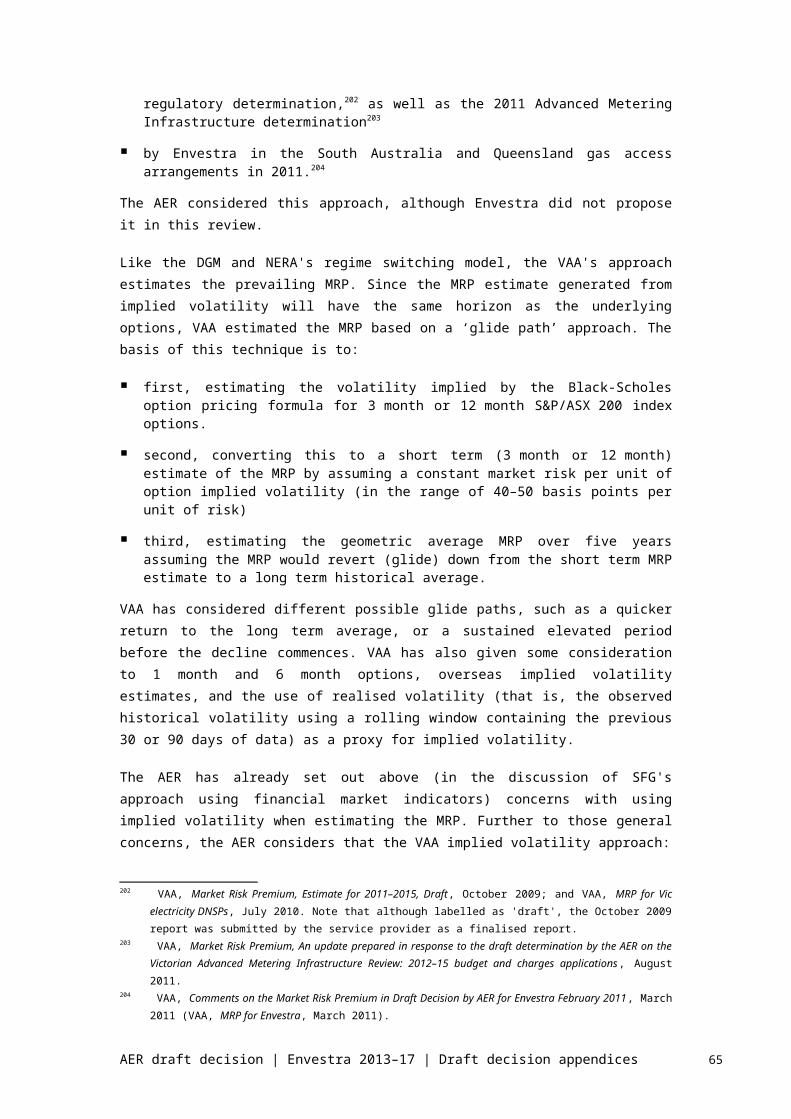
The AER has also considered recent decisions by other regulators giving a rate of return range from 5.70 to 9.08 per cent (converted to nominal vanilla form).252 The decisions reviewed are shown in Table B.7 and have been taken from those made in the last 12 months. The WACC of 7.16 per cent applied for Envestra falls within this range. This suggests that the rate of return for this determination is reasonable and in line with regulatory decisions that have been made in the past year.
Table B.7 Recent decisions by Australian regulators (per cent)
Regulator Decision Date Nominal vanilla WACC
ACCC FAD Fixed line services – Final decision Jul 2011 8.54
ESC Metro Access Arrangement – Final decision Aug 2011 9.08
ACCC Airservices Australia – Final decision Sep 2011 8.60
ERA Dampier to Bunbury Pipeline – Final decision Oct 2011 7.57
QCA SunWater – Final decision Nov 2011 7.55
IPART Sydney Desalination Plant – Final decision Dec 2011 8.16–8.59a
ESCOSA SA Water – Final decision Feb 2012 8.07
ESCV V/Line Access Arrangement – Final decision Jun 2012 8.65
IPART Sydney Catchment Authority – Final decision Jun 2012 8.16–8.38a
IPART Sydney Water Corporation – Final decision Jun 2012 8.16–8.38a
ERA Western Power – Final decision Sep 2012 5.70
Notes: For comparative purposes, all WACCs have been converted to the nominal vanilla WACC formulation consistent with the AER’s reported figure for Envestra (which excludes debt raising costs).
(a) Ranges are presented for recent decisions by the IPART where the point estimate (real post-tax or real pre-tax) was not sufficiently disaggregated to allow precise conversion to the correct formulation (nominal vanilla WACC).
Cost of equity vs. Cost of debt
While not necessarily directly relevant to the overall rate of return, comparing the cost of equity with the cost of debt can provide a useful indication of
252 ACCC, Final report: Inquiry to make final access determinations for the declared fixed line services, July 2011, p. 59; ESC, Final decision: Metro proposed access arrangement, August 2011, p. 87; ACCC, Final decision: Airservices Australia price notification, September 2011, p. 7; ERA, Final decision: Access arrangement information for the Dampier to Bunbury Natural Gas Pipeline, December 2011, p. 159; Queensland Competition Authority, Draft Report: SunWater Irrigation Price Review: 2012–17, Volume 1, November 2011, p. 392; Independent Pricing and Regulatory Tribunal (IPART), Final Report: Review of water prices for Sydney Desalination Plant Pty Limited, December 2011, p. 80; Essential Service Commission of South Australia (ESCOSA), Final Advice: Advice on a Regulatory Rate of Return for SA Water, February 2012, p. 50; IPART, Water – Final report: Review of prices for Sydney Water Corporation’s water, sewerage, drainage and other services: From 1 July 2012 to 30 June 2016, June 2012, pp. 198, 204; IPART, Water – Final report: Review of prices for Sydney Catchment Authority: From 1 July 2012 to 30 June 2016, June 2012, pp. 90, 118, 123; ERA, Final decision on proposed revisions to the access arrangement for the Western Power network submitted by Western Power, 5 September 2012, p. 241.
AER draft decision | Envestra 2013–17 | Draft decision appendices 65

reasonableness. Consistent with previous decisions,253 the AER considers that the expected cost of equity should be greater than the expected cost of debt.254 This relationship holds in this decision.
The AER has prepared a graph showing the cost of equity, cost of debt and WACC over time, using the DRP estimation methodology proposed by Envestra. This graph shows that the cost of equity has been consistently greater than the cost of debt over the last two years, using the AER’s approach in this decision. If the cost of debt had been estimated using the ERA’s approach, then the difference between the cost of equity and cost of debt would have been greater.
It is also worth noting that this graph clearly shows that a large portion of the change in the overall rate of return can be attributed to the decline in the cost of debt. The fact that the overall rate of return in this decision is lower than in previous decisions does not of itself make it unreasonable. The cost of debt in this decision makes up 60 per cent of the overall rate of return. The AER accepts Envestra’s approach in determining the cost of debt. If flows from this that the AER and Envestra would agree that this reduction reflects prevailing conditions in the market for funds and the risk involved in providing reference services. This provides the AER with a degree of confidence that a fall in the overall rate of return, in itself, is not unreasonable.
Envestra's concerns surround the cost of equity and the extent to which the cost of equity determined by the AER in this decision is lower than that determined in previous decisions. The AER has discussed these concerns in detail in attachment 4.
253 AER, Final decision: APTPPL access arrangement, August 2012, p. 102; AER, Draft decision: Envestra Ltd: Access arrangement proposal for the Qld gas network 2011–2016, February 2011, p. 243; AER, Final decision: Envestra access arrangement Qld, June 2011, pp. 148–149.
254 However, the AER does not consider that the expected cost of equity should be greater than the promised cost of debt. This critical distinction is explained below.
AER draft decision | Envestra 2013–17 | Draft decision appendices 66

Figure B.2 Cost of Debt, Cost of Equity and WACC – AAA paired bonds approach
The conceptual relationship set out above holds when the cost of equity and the cost of debt are expressed in consistent terms—as expected returns. However, there is a distinction between the expected cost of debt and the promised cost of debt:
the promised cost of debt is calculated by assuming that the bond issuer does not default, and the promised payments of interest and capital occur (in full and on time)
the expected cost of debt extends this calculation to include consideration of the likelihood of default, where the bond issuer does not make the promised payments of interest and capital255
where there is a non-zero probability of default, the promised cost of debt will exceed the expected cost of debt
there is no conceptual reason why the expected cost of equity should be greater than the promised cost of debt.256
There has been some debate about whether the cost of debt graphed above (and adopted by the AER) reflects the expected or promised cost of debt.257 The point is inconsequential in current conditions, since under either interpretation the 255 The basic method is a probability-weighted value calculation. If (for example) there was a 1 per
cent chance of default, the calculation would assign 99 per cent weight to the promised yield (when all interest and capital is paid) and 1 per cent to the (much lower) yield arising if the default occurred and interest and capital were not repaid (or paid only in part).
256 For instance, consider the situation where the expected return on equity is 4 per cent; the promised return on debt is 5 per cent; but there is a non-zero default probability such that the expected return on debt is 3 per cent. There is no problem with the promised return on debt being above the expected return on equity (5 > 4), as long as the expected return on debt is below (4 > 3).
AER draft decision | Envestra 2013–17 | Draft decision appendices 67
expected cost of debt is below the expected cost of equity.258 If the cost of debt were to rise above the cost of equity, it would be necessary to carefully examine the cost of debt to ensure that it did not reflect promised returns.
Further, recent advice from the Reserve Bank of Australia (RBA) also touches on the relationship between the cost of debt and the cost of equity.259 The RBA noted that there was a general increase in the spread between CGS and other Australian-denominated debt securities (i.e. an increase in the DRP). However, the RBA cautioned against directly equating changes in the cost of debt with changes in the cost of equity:
While it is a reasonably simple matter to infer changes in debt risk premia from market prices, it is less straightforward to do so for equity premia. In making use of a risk free rate to estimate a cost of capital, it is important to be mindful of how the resulting relativity between the cost of debt and that of equity can change over time and whether that is reasonable.260
Consistent with this advice from the RBA, the AER is mindful of the relative positions of the cost of debt and cost of equity set in this decision. The AER considers that, since the cost of equity exceeds the cost of debt, this check indicates that the AER’s estimates are reasonable.
B.4 The Black CAPM
In attachment 4, the AER outlined that it would consider whether the Black CAPM should be used to cross check cost of equity estimates. The AER’s considerations of this are detailed below.
Envestra submitted a report from NERA on the Black CAPM. It used the NERA report to cross check the cost of equity estimates derived from the Sharpe Lintner CAPM.261 The AER has previously outlined some of the limitations of the Black CAPM. The AER still holds the following concerns with the Black CAPM: 262
The Black CAPM is not a well accepted financial model
Zero beta returns previously presented are highly variable and most likely unreliable.
Robust parameter inputs—specifically, the return on the zero beta portfolio—are not available.
The AER has, however, examined the information put forth by Envestra in the NERA report.
257 See Lally, Cost of capital for regulated utilities, February 2004, p. 75 (footnote 74); Lally, Comments on submissions relating to the QCA’s proposed WACC for the SEQ water utilities , 31 March 2011, pp. 2, 17: Lally, Cost of equity and the MRP, July 2012, p. 9.
258 That is, if the cost of debt graphed above (of 7.01 per cent) reflects a promised cost of debt, the expected cost of debt would be even lower.
259 This advice is discussed in appendix B.1.1. Source document is RBA, Letter regarding the CGS market, July 2012.
260 RBA, Letter regarding the CGS market, July 2012, p. 1–2.261 Envestra, Victorian access arrangement information, 30 March 2012, pp. 158–9. Envestra,
Albury access arrangement information, 30 March 2012, p. 142-144.262 AER, Final decision: Envestra Ltd access arrangement Qld, June 2011.
AER draft decision | Envestra 2013–17 | Draft decision appendices 68

B.4.1The NERA report on the Black CAPM
The AER has assessed the NERA report to determine whether the cost of equity estimates of the report can be reliably used to cross check Envestra's of equity estimate.
The AER sought advice from McKenzie and Partington to inform its assessment. The advice outlined flaws and raised significant concerns with the NERA report. Based on this advice, the AER considers that the NERA report does not provide useful information which can be relied upon to check cost of equity estimates. McKenzie and Partington outlined that:
Unlike the yield on a government security used in the Sharpe Lintner CAPM as a proxy for the risk free rate, there is no generally accepted empirical measurement of the zero beta return in the Black CAPM.263 Also, the zero beta return in the Black CAPM is highly sensitive to the input variables and methods of estimation.264 For example, McKenzie and Partington demonstrate that the return on two efficient zero beta portfolios differ significantly—from minus 0.85 per cent to minus 50 per cent—despite only a modest (less than 1 per cent) difference in return and standard deviation.265
Despite some commonality in the experts supplying the estimates of excess zero beta return in the NERA report, these estimates vary and range from 6.985 percent to 10.309 percent.266 The AER considers this to be a significant range in the context of its impact on the cost of equity estimate.
NERA’s preferred estimate of 10.98 percent for the zero beta return is not credible.267 McKenzie and Partington stated ‘The estimated zero beta return looks more like the return to an equity security with a beta of the order of one. The excess zero beta return should be no more than the credit spread, but at 6.99 percent it is more like a high side estimate for the market risk premium.’268
NERA appears to have selectively set aside estimates from the Black CAPM.269 McKenzie and Partington stated ‘the estimate of the zero beta return is accepted in the NERA report, but the absence of a risk premium is not. This implies that the intercept term is measured reliably, but the slope coefficient is not. This is difficult to accept.’ 270
Further, the AER considers:
The model outputs depend on the inputs, and the AER does not agree with the inputs used in the NERA report. The market risk premiums used by NERA are estimated using a regime switching model and the dividend growth model. The AER’s considerations of the estimates derived from these models are in section B.2.5 and B.2.3.
263 M. McKenzie and G. Partington, Review of NERA report on the Black CAPM, 24 August 2012, pp. 7–8 (McKenzie and Partington, Review of NERA Black CAPM, August 2012).
264 McKenzie and Partington, Review of NERA Black CAPM, August 2012, pp. 7–8. 265 McKenzie and Partington, Review of NERA Black CAPM, August 2012, p. 10–14. 266 McKenzie and Partington, Review of NERA Black CAPM, August 2012, p. 8. 267 McKenzie and Partington, Review of NERA Black CAPM, August 2012, p. 22.268 McKenzie and Partington, Review of NERA Black CAPM, August 2012, p. 22.269 McKenzie and Partington, Review of NERA Black CAPM, August 2012, pp. 24, 25. 270 McKenzie and Partington, Review of NERA Black CAPM, August 2012, p. 25.
AER draft decision | Envestra 2013–17 | Draft decision appendices 69
The AER considers that the advice from McKenzie and Partington demonstrates that the NERA report does not provide useful information which can be relied upon in checking the cost of equity estimate.
AER draft decision | Envestra 2013–17 | Draft decision appendices 70

C Real cost escalationReal cost escalation is a method for accounting for expected changes in the costs of key factor inputs. Due to market forces, these costs may not increase at the same rate as inflation.
C.1 Draft decision
The AER's draft decision is not to approve Envestra's proposed labour and materials cost escalators. The AER considers that applying Envestra's proposed escalators will not result in forecast opex and capex arrived at on a reasonable basis.271 Nor do they provide the best possible forecasts of opex and capex in the circumstances.272
The AER instead considers that polyethylene (PE) should be escalated by the consumer price index (CPI) only and that labour should be escalated by the unadjusted Labour Price Index (LPI). The AER considers that applying these escalators to labour costs and material costs would result in the best possible forecasts of opex and capex in the circumstances.273
The AER engaged Deloitte Access Economics (DAE) to develop forecasts of labour cost changes.274 The AER has determined the appropriate labour cost and materials escalators set out in Table C.1.
Table C.1 AER determined real cost escalators (per cent)
2012 2013 2014 2015 2016 2017
Internal labour - specialist 1.7 1.1 1.1 1.2 0.9 1.1
Internal labour - general 1.7 1.1 1.1 1.2 0.9 1.1
Contractors 1.3 0.6 0.8 1.0 0.4 0.9
Polyethylene pipe – – – – – –
Source: AER analysis, Deloitte Access Economics, Forecast growth in labour costs in Victoria: Report prepared for the AER, 28 May 2012, p. 67.
C.2 Envestra's proposal
Envestra proposed that real cost escalations be applied to certain inputs in its opex and capex forecasts in order to forecast real labour and materials costs. Envestra engaged BIS Shrapnel to forecast the change in labour, material, and
271 NGR, r. 74(2)(a).272 NGR, r. 74(2)(b).273 NGR, r. 74(2)(b).274 Deloitte Access Economics, Forecast growth in labour costs in Victoria: Report prepared for the
AER, 28 May 2012.
AER draft decision | Envestra 2013–17 | Draft decision appendices 71

contractor costs for the 2013–17 access arrangement period. BIS Shrapnel recommended the following escalations:
forecast growth in average weekly ordinary time earnings (AWOTE) in the property and business services (PBS) industry for general labour that provide mainly administration and corporate services
forecast growth in AWOTE for the electricity, gas and water (EGW) industry for gas network related labour involving construction, maintenance, design and operation of gas networks
forecast growth in the price of PE pipe for network materials based on forecast movements in international crude oil prices
forecast growth for general materials as CPI.
Envestra proposed the forecast AWOTE growth rates be adjusted for forecast labour productivity changes.
Envestra proposed different real labour cost escalations for Victoria and Albury (Table C.1 and Table C.2).
Table C.1 Envestra Victoria proposed real labour cost escalators (per cent)
2012 2013 2014 2015 2016 2017
Electricity, gas and water labour AWOTE 1.6 3.0 6.6 4.1 1.0 –0.1
General labour AWOTE 1.9 3.0 6.8 3.6 0.7 0.6
Construction labour AWOTE (capex only) 3.9 2.9 2.8 2.2 0.8 1.8
Network materials –2.7 2.7 11.5 4.4 –2.5 4.0
General materials – – – – – –
Source: Envestra, Victoria Access Arrangement Information, 30 March 2012
Table C.2 Envestra Albury proposed real labour cost escalators (per cent)
2012 2013 2014 2015 2016 2017
Electricity, gas and water labour AWOTE –6.3 5.5 6.8 5.6 4.9 6.0
General labour AWOTE –7.2 5.7 7.7 5.4 4.6 6.7
Construction labour AWOTE (capex only) 2.8 3.9 4.9 2.6 1.5 3.5
Network materials –2.7 2.7 11.5 4.4 –2.5 4.0
General materials – – – – – –
AER draft decision | Envestra 2013–17 | Draft decision appendices 72

Source: Envestra, Albury Access Arrangement Information, 30 March 2012
C.3 Assessment approach
The AER assessed Envestra's proposed real cost escalators against the forecasts and estimates requirements in rule 74 of the NGR:275
74 Forecasts and estimates
(1) Information in the nature of a forecast or estimate must be supported by a statement of the basis of the forecast or estimate.
(2) A forecast or estimate:(a) must be arrived at on a reasonable basis; and(b) must represent the best forecast or estimate possible in the
circumstances.The AER has taken into consideration Professor Borland's report and BIS Shrapnel's report both commissioned by Envestra. In forming its views the AER has also considered advice from its commissioned consultant, DAE, on labour cost escalators.
C.4 Reasons for draft decision: labour cost escalations
The AER's draft decision is not to approve Envestra's proposed labour and materials cost escalators. The AER considers that applying Envestra's proposed escalators will not result in forecast opex and capex that are arrived at on a reasonable basis, or provide the best possible forecasts of opex and capex in the circumstances.276 This is because:
Envestra Albury's real labour cost escalators are unlikely to be different to Envestra Victoria's real labour cost escalators
forecast movements in labour costs for the electricity, gas, water and waste services (EGWWS) industry provide the best forecast of movements in all internal labour costs possible in the circumstances, rather than PBS industry for general labour and EGW industry for network labour
the LPI provides a better measure of labour cost changes compared to AWOTE.
real labour cost escalation should not be productivity adjusted due to issues in measuring and forecasting productivity
The following sections discuss these issues in detail.
C.4.1Different forecasts for Victoria and Albury
Envestra proposed different real labour cost escalations for Envestra Albury and Envestra Victoria.
275 NGR, r. 74.276 NGR, r. 74(2).
AER draft decision | Envestra 2013–17 | Draft decision appendices 73

The AER does not approve Envestra's proposed use of different real labour cost escalations for Envestra Victoria and Envestra Albury, as it is not the best possible forecast or estimate in the circumstances.
The AER considers that the labour costs incurred by Envestra Victoria and Envestra Albury are likely to align with the real cost escalations in APA GasNet's collective agreement. This is because Envestra has outsourced the operation and management of both the Victorian and Albury distribution network to the APA Group.277 The APA Group employs staff to operate and manage the two networks under the same collective bargaining agreement.278 Therefore the AER considers that the same real cost escalations should be applied to both Envestra Victoria and Envestra Albury, and that this represents the best forecast or estimate possible in the circumstances.279
Envestra has also confirmed that Albury's labour costs are largely aligned with Victorian costs and accepts that there is merit in applying the same real labour cost escalations for Victoria and Albury.280
C.4.2Use of labour force industries
The AER does not approve Envestra's proposed use of the EGW industry in relation to network related labour, and the PBS industry in relation to general labour, to estimate labour cost escalations. The AER does not consider that they are the best possible forecasts or estimates in the circumstances.281
The AER considers that using forecast growth in the EGWWS industry to escalate both network related labour and general labour better reflects labour costs for all internal Envestra labour during the 2013–17 access arrangement period.
The Australian Bureau of Statistics (ABS) has previously advised:
... regardless of the type of job, if the job was selected from a business classified to the electricity, gas, water and waste services industry, the jobs pay movements contributes to this industry.282
The ABS takes into account the nature of the business, not the nature of the work undertaken, when allocating a job to an industry. The ABS labour price statistics for the EGWWS industry reflects both specialised gas distribution network related labour and general labour.
Since late 2009 the ABS has reported AWOTE and LPI data under the ANZSIC283 2006 industry classification, where waste services have been included with the EGW industries, producing an EGWWS industry data series. This replaces the
277 Envestra, Victorian Access Arrangement Information, 30 March 2012, p. 55.278 APA GasNet, APA Network Agreement (Victoria) 2011, 19 December 2011 p. 4.279 NGR, r. 74(2)(b).280 Envestra, Response to Information request 7, 22 June 2012, p. 10.281 NGR, r. 74(2)(b).282 ABS, Email from Kathryn Parlor to Fleur Gibbons, 8 July 2010.283 The Australian and New Zealand Standard Industrial Classification (ANZSIC) provides a
framework for organising data about businesses - by enabling grouping of business units carrying out similar productive activities.
AER draft decision | Envestra 2013–17 | Draft decision appendices 74

ANZSIC 1993 classification discontinuing the publication of the EGW industry data series.
BIS Shrapnel stated the inclusion of the waste services sub-sector in the classification will lead to lower wage growth outcomes for the combined EGWWS industry, which will no longer accurately reflect the occupations in the EGW industry. Consequently BIS Shrapnel estimated the waste services component and excluded it from both its historical data and forecasts, thus deriving an EGW estimate.284
Envestra's proposed labour cost escalation rates are based on BIS Shrapnel forecasts for the EGW industry rather than the EGWWS industry used by the ABS.
BIS Shrapnel note that between 1998 and 2009 the LPI for the EGW industry grew by 4.3 per cent per annum as compared to 4.2 per cent for the EGWWS industry.285
The AER does not consider that BIS Shrapnel's reasons for excluding the waste service component (that it would result in a lower wage growth) are sufficient to adjust the EGWWS data. In the absence of any compelling evidence of a difference between the EGW and EGWWS industries, the AER considers it is not necessary to remove the forecast waste services component from EGWWS data. The AER considers removing the waste services component from the data introduces a potential source of forecasting error since it is necessary to estimate the waste services components. Further, there is likely to be forecasting error from applying the discontinued EGW industry data series which concluded in June 2009 when the ABS moved to the ANZSIC 2006 classification. This forecasting error will be magnified overtime as the period between the last available EGW data (2009) and the forecast period increases.
For these reasons, the AER considers that BIS Shrapnel's use of EGW and PBS industries to escalate labour costs would not result in the best labour cost forecast or estimate possible in the circumstances.286
DAE has estimated labour costs using the ANZSIC 2006 classification for the EGWWS labour force industry to represent Envestra's internal labour force. The AER is of the view that applying forecasts based on the EGWWS industry rather than the EGW industry will result in the best forecast or estimate possible in the circumstances.
The AER has previously accepted the use of a single ABS labour force industry to represent the total workforce of a network service provider.287
284 BIS Shrapnel, Real cost escalation forecasts to 2017 - Victoria and New South Wales, November 2011, p. A-5.
285 BIS Shrapnel, Real cost escalation forecasts to 2017 - Victoria and New South Wales, November 2011, p. A-5.
286 NGR, r. 74(2)(b).287 See AER, Final decision: Powerlink Transmission determination 2012–13 to 2016–17, April 2012,
p. 60.
AER draft decision | Envestra 2013–17 | Draft decision appendices 75
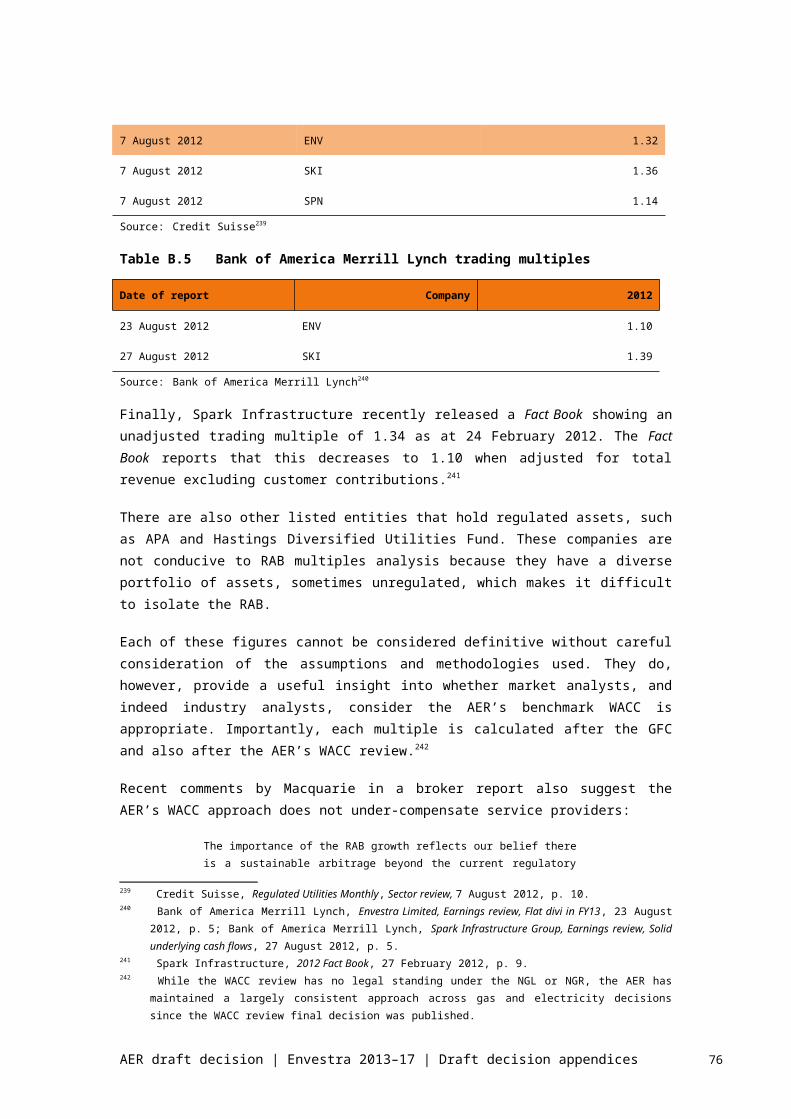
C.4.3The choice of labour price measure and use of productivity adjustments
The AER does not approve Envestra's proposed use of forecast AWOTE growth rates adjusted for forecast labour productivity for the entire regulatory period. The AER does not consider that it permits a forecast to be made on a reasonable basis, and the best possible forecast in the circumstances.
The AER considers that LPI forecasts, unadjusted for productivity effects, permits the best possible forecast of labour cost movements in the circumstances because:
productivity measures for the EGWWS industry exhibit estimation bias for the reasons outlined in recent Productivity Commission (PC) analysis288
although productivity adjusted labour price movements provide the best estimate of labour cost movements, estimated productivity adjustments cannot be relied on due to the estimation bias in productivity measures
the LPI contains less productivity effects than the AWOTE, where the AWOTE includes all productivity effects;
although the AER considers that LPI forecasts, unadjusted for productivity effects, provide the best possible forecast of labour cost movements, the AER recognises that this will over compensate businesses to the extent that worker productivity gains over the forecast period are positive.
Each of these issues is considered in the sections below.
Labour productivity adjustments
Labour price changes are driven by both productivity effects and other effects. Productivity effects drive labour price changes since more productive labour receives higher wages.289 Other effects include CPI increases and any price changes driven by labour market supply/demand imbalances.
It is important to make the distinction between labour prices and labour costs. DAE stated:
... labour costs will rise at a different rate [than labour prices] due to the effects of labour productivity growth. Effectively, labour productivity measures the number of units of output an individual employee can produce in a given time period. The more units of output each worker can produce, the fewer workers are required to create a given level of industry output. If productivity is rising, the total cost of labour (the price of each employee multiplied by the number of employees) will rise less rapidly than the individual employee's price.290
Broadly labour price changes can be described by three effects:
288 Productivity Commission, Productivity in electricity, gas and water: measurement and interpretation, March 2012.
289 Professor Jeff Borland, Labour cost escalation report for Envestra Limited, 2011, p. 2.290 Deloitte Access Economics, Response to Professor Borland: comments prepared for the AER, 15
April 2011, p. 3.
AER draft decision | Envestra 2013–17 | Draft decision appendices 76

1. Composition productivity effects reflect increases in workforce productivity due to changes in the skill composition of the workforce. For example, an increase share of high skill workers will increase average workforce productivity and average wage rates per worker. However, because average workforce productivity has increased, fewer workers are required to produce the same amount of output, and any increase in labour costs will be less than the increase in the average labour price.
2. Worker productivity effects are increases in workforce productivity due to increases in the productivity of individual workers. For example, workers may become more productive from working with better capital equipment. Again, because average workforce productivity has increased fewer workers are required and any increase in labour costs will be less than the increase in the average labour price.
3. Other effects unrelated to productivity. For example, wage increases due to inflation or labour supply or demand imbalances. Because these effects are unrelated to productivity the same amount of labour is required to produce a given amount of output and the change in labour price results in a corresponding change in labour costs.
Conceptually at least, either the AWOTE or LPI labour price measures can quantify the change in labour costs. However, it is important to use matching labour price and productivity measures.291 The ABS publishes a number of productivity measures, including labour, capital and multifactor measures. The labour productivity measures are published annually for the market sector as a whole, as well as at the industry division level (for example, the electricity, gas and water industry). These measures indicate value added per hour worked. This conventional measure of labour productivity includes all productivity effects: composition productivity, worker productivity effects and other effects and as AWOTE includes all of these effects; it is the appropriate labour productivity measure for adjusting AWOTE.
A quality adjusted measure of labour productivity which includes worker productivity effects and other effects is the appropriate measure to adjust the LPI. The ABS recently developed quality adjusted measures of labour input and labour productivity. It released estimates for 1982–83 to 1999–2000 in 2005, and has since published yearly statistics from 1994–95.292 This measure of labour captures the change in the aggregate quality of labour due to compositional changes such as higher education, or longer work experience, so the effect is not ascribed to productivity. Generally, the quality adjusted labour productivity index increases at a slower rate than the conventional labour productivity index, because the conventional index includes compositional productivity effects that may reflect increased skill composition of the workforce. An increase in the skill composition of the workforce, which may manifest itself in an increase in the labour price, does not necessarily suggest a simultaneous increase in the labour cost. This is because an increase in the skill level may mean fewer workers such that labour costs may fall.
291 Deloitte Access Economics, Response to Professor Borland: comments prepared for the AER, 15 April 2011, p. 3.
292 ABS, Quality-adjusted labour inputs, Research paper, Catalogue number 1351.0.55.010, November 2005.
AER draft decision | Envestra 2013–17 | Draft decision appendices 77

The AER considers that Envestra should not be compensated for labour price changes driven by labour productivity effects. This is because labour price changes do not equate to labour cost changes. To the extent labour prices compensate workers for increased productivity, those price increases do not increase labour costs, since fewer workers are required to produce the same output.
Further, the AER has previously stated that to the extent that labour prices are rising due to increased labour productivity (due to either compositional productivity or worker productivity), the increase in labour costs will be less than the increase in the labour price.293 To determine the impact of labour price increases on the total labour cost to produce a constant level of output, the price impacts of labour productivity effects should be removed from the labour price measure used.294 However, the PC has noted four broad issues which impact measurement of marginal factor productivity (MFP) growth in EGW industries:
1. cyclical investment—the lumpy nature of capital in relation to measured output295
2. output measurement—difficulty in measuring output which can lead to unanticipated changes in MFP296
3. shifts to higher cost technologies—investments as a result of climate-related issues increasing the cost per unit of output297
4. unmeasured quality improvements—changes in government regulations mandating improvements in the network that are not directly measured, such as mandatory underground electricity cabling.298
The AER considers that the estimation issues identified by the PC contribute to the uncertainty in forecasting productivity adjustments.
Productivity adjustments may also double-count other effects such as scale adjustments. Further, accurately forecasting labour productivity in the medium to long term is extremely difficult, leading to high risk of forecasting error.299
Envestra has applied a productivity adjusted AWOTE estimated by BIS Shrapnel. BIS Shrapnel forecasts weak productivity growth over the next six years due to constrained demand and output growth.300 The AER considers that BIS Shrapnel's
293 See AER, Draft Decision: Powerlink Transmission determination 2012–13 to 2016–17, November 2011, p. 57.
294 AER, Draft Decision: Powerlink Transmission determination 2012–13 to 2016–17, November 2011, p. 56.
295 Productivity Commission, Productivity in electricity, gas and water: measurement and interpretation, March 2012, p. 122.
296 Productivity Commission, Productivity in electricity, gas and water: measurement and interpretation, March 2012, p. 126.
297 Productivity Commission, Productivity in electricity, gas and water: measurement and interpretation, March 2012, pp. 128–129.
298 Productivity Commission, Productivity in electricity, gas and water: measurement and interpretation, March 2012, pp. 129–130.
299 AER, Draft decision - Access arrangement proposal for the Roma to Brisbane Pipeline 2012–13 to 2016–17, April 2012, p. 200
300 BIS Shrapnel, Real cost escalation forecasts to 2017 - Victoria and New South Wales, November 2011, p. 44.
AER draft decision | Envestra 2013–17 | Draft decision appendices 78

productivity forecasts do not take into account the factors described by the PC listed above.
Envestra also sought advice from Professor Jeff Borland on whether the AWOTE or the LPI should be used for the purposes of real labour cost escalation for the 2013–17 access arrangement period.
Professor Borland stated that the productivity adjusted LPI underestimates changes to labour costs by an amount equal to the change in the skill composition of the workforce.301 The AER agrees with this view if the conventional labour productivity measure is used to adjust the LPI.
In response to Professor Borland, DAE stated their forecasts of LPI and productivity implicitly assumes a zero value for composition productivity. If the compositional productivity adjustment is different from zero, this result would be deducted from both LPI growth and productivity growth resulting in a net effect of zero.302
Professor Borland further notes in his empirical analysis that over the long run changes in labour costs is equal to changes in other productivity effects such as CPI.303
The AER considers that in theory productivity adjustments should be applied to real cost escalations if productivity adjustments are not undertaken elsewhere in opex and capex forecasts.
However, the AER notes the high degree of difficulty in estimating both quality adjusted labour productivity and conventional labour productivity as evidenced by the conflicting productivity estimates from BIS Shrapnel and DAE and the analysis conducted by the PC. Thus, while the AER expects worker productivity to improve over the long run, due to estimation difficulties, it has not sought to address this effect, at this stage, in Envestra's forecasts of labour costs.
Choice of labour price measure
Given the difficulty in measuring and forecasting labour productivity movements, the AER considers that productivity adjustments should not be applied to Envestra's labour cost escalations. The AER notes that currently unadjusted labour forecasts of the AWOTE and LPI are above inflation. This approach will allow Envestra to benefit from changes in labour productivity effects. In light of the difficulties in estimating productivity, the AER considers an unadjusted LPI is the best forecast in the circumstances304 although this figure is upwardly biased by including labour productivity improvements.
301 Professor Jeff Borland, Labour cost escalation: Choosing between AWOTE and LPI - Report for Envestra Limited, March 2012, p. 6.
302 Deloitte Access Economics, Response to issues raised in the Victorian Gas Access Review, 29 May 2012, p. 7.
303 Professor Jeff Borland, Labour cost escalation: Choosing between AWOTE and LPI - Report for Envestra Limited, March 2012, p. 6.
304 NGR, r. 74(2)(b).
AER draft decision | Envestra 2013–17 | Draft decision appendices 79

Envestra proposed the use of forecast movements in productivity adjusted AWOTE, provided by BIS Shrapnel, to escalate its labour costs for anticipated real labour price increases.
AWOTE measures average employee earnings from working the standard number of hours per week. It is not strictly a price index (that measures the pure price effect) because the composition of labour is not held constant. It captures composition productivity effects, worker productivity effects and other effects. In contrast the LPI is a Laspeyres type price index. As a Laspeyres type price index the LPI measures the change in labour costs with the quantity and quality of work performed held constant.305 It measures the pure price effect, showing how much the same quantity of labour costs in the current period, relative to the base period. The weights used are for the base period and are updated annually to represent job distribution.306
Conceptually at least, either labour price measure can quantify the change in labour costs, provided a correctly matched productivity measure is used.307
BIS Shrapnel considers the LPI measures underlying wage inflation but does not measure variations in the quality or quantity of work performed. The AWOTE measures both the change in the cost of labour and skill level changes within an industry. For this reason BIS Shrapnel prefers the use of AWOTE over the LPI.308
DAE noted that there are drawbacks to both the LPI and AWOTE measures. However it considered LPI to be a better measure than AWOTE, because compositional changes such as the pace of recruitment and retirement and the changed relativities in the employment of men and women can distort AWOTE as a proxy for changes in the price of labour.309
DAE further notes the advantages of the LPI over the AWOTE as a measure of labour price changes will increase as the ABS commences publishing the AWOTE on a six monthly basis rather than on a quarterly basis and ceases publishing all AWOTE by state by industry information.310
However, the AER notes that using the LPI has its own difficulties because of the limited availability of quality adjusted labour productivity index data. The ABS publishes unadjusted labour productivity for the EGWWS industry but its quality adjusted labour productivity index is available only at the overall market sector level.
305 To the extent that some quality changes in the work performed are unquantifiable, the price change would incorporate some of the quality change effect. However, the magnitude of this effect is generally negligible.
306 ABS, Labour Price Index: concepts, sources and methods, Catalogue number 6351.0.55.001, 2004, p. 12.
307 Deloitte Access Economics, Response to Professor Borland: comments prepared for the AER, 15 April 2011, p. 3.
308 BIS Shrapnel, Real cost escalation forecasts to 2017 - Victoria and New South Wales, November 2011, p. 25.
309 Deloitte Access Economics, Response to issues raised in the Victorian Gas Access Review, 29 May 2012, p. 2.
310 Deloitte Access Economics, Response to issues raised in the Victorian Gas Access Review, 29 May 2012, p. 2.
AER draft decision | Envestra 2013–17 | Draft decision appendices 80

The ABS also considers the LPI to be their preferred indicator of changes in the price of labour because average weekly earnings (AWE) estimates are affected by changes in both the price of labour and changes in the composition of the labour market.311
The AER considers the problems with using AWOTE are greater than those with using the LPI. This is because the higher volatility of the AWOTE, and the inclusion of the composition productivity effects, makes AWOTE unreliable for forecasting labour costs for the utilities industry in comparison with the more stable LPI time series (see Figure C.1).
The LPI unadjusted for labour productivity, which includes worker productivity effects, will more closely represent the true change in labour costs than the unadjusted AWOTE which includes both worker and composition productivity effects.
The AER considers that any labour cost increases associated with compositional change should be offset by productivity benefits. To estimate the efficient labour cost, it is appropriate to hold the labour force composition stable over the forecast period and allow Envestra to retain any efficiency benefits of workforce compositional change.
Figure C.1 Annual growth in LPI and AWOTE, EGWWS industry, Australia (per cent)
Source: ABS, catalogue 6302.0, table H; ABS, catalogue 6345.0, table 9b; AER analysis
311 ABS, Labour Price Index: concepts, sources and methods, Catalogue number 6351.0.55.001, 2004, p. 43.
AER draft decision | Envestra 2013–17 | Draft decision appendices 81
-2
0
2
4
6
8
10
12
1998 2000 2002 2004 2006 2008 2010
per cent
LPI AWOTE
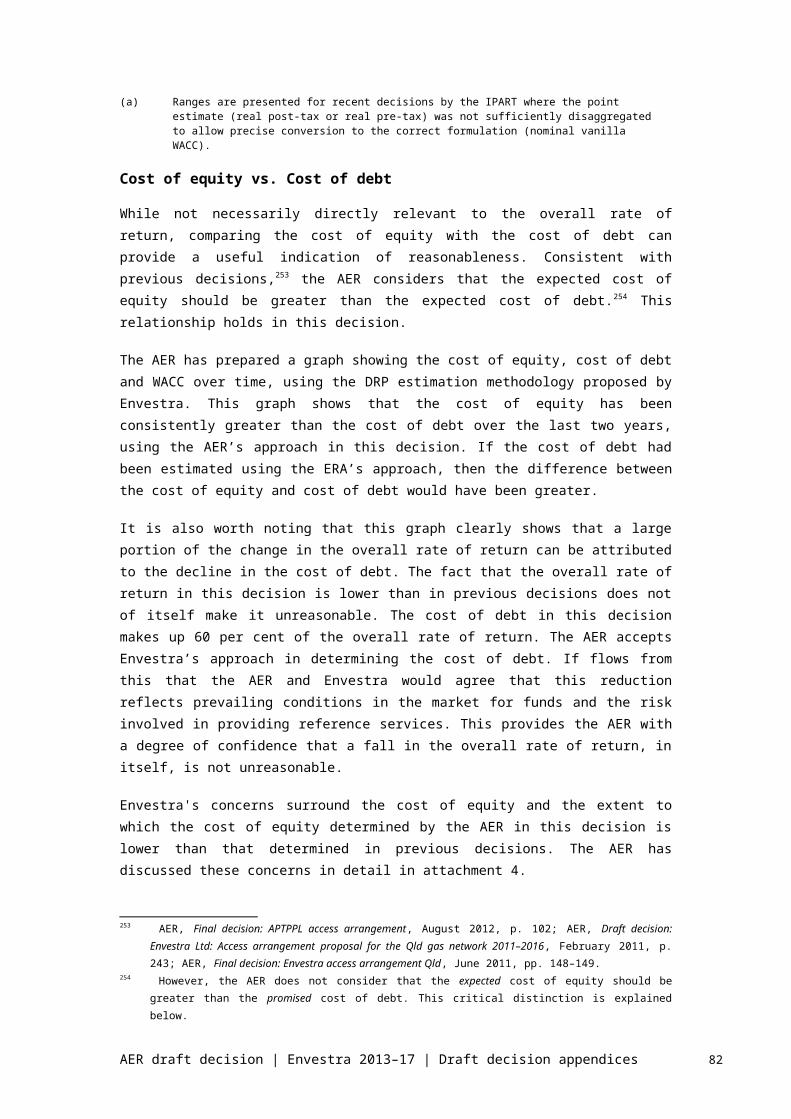
The AER notes that the inclusion of labour productivity effects will provide an upwardly biased forecast of labour cost movements if Envestra has positive labour productivity over the forecast period.
Choice of LPI forecasts
BIS Shrapnel estimated Envestra's forecast movements in both the LPI and AWOTE. DAE analysis has shown BIS Shrapnel's forecasts of LPI have consistently been higher than the actual LPI and DAEs forecasts have been lower.312 BIS Shrapnel's LPI forecasts, unadjusted for productivity, are higher than those forecast by DAE, consistent with this analysis (Figure C.2)
The AER considers the difference between DAEs forecast LPI and actual LPI is less than the magnitude of DAEs forecast of quality adjusted labour productivity. Should DAE's forecast LPI be lower than actual LPI in the 2013–17 access arrangement period, future worker productivity improvements for that period are likely to outweigh any potential difference between forecast and actual LPI. Therefore the AER considers the LPI estimated by DAE represents the best forecast possible in the circumstances.313
Figure C.2 Real LPI forecasts (per cent)
Source: BIS Shrapnel, Real Cost Escalation Forecasts to 2017—Victoria and NSW, November 2011; Deloitte Access Economics, Forecast growth in labour costs in Victoria, 28 May 2012
The AER undertook its own analysis and compared both BIS Shrapnel's and DAEs forecasts of LPI movements for the Australian economy (Table C.1). For the forecast series commencing 2006 to 2011 included in the analysis, the average of 312 Deloitte Access Economics, Responses to issues raised in various submissions to the Victorian
Gas Access Review, 29 May 2012, p. 25.313 NGR, r. 74(2)(b).
AER draft decision | Envestra 2013–17 | Draft decision appendices 82

DAEs and BIS Shrapnel's forecasts had the lowest mean absolute error on three occasions, DAEs forecasts on two and BIS Shrapnel's once. This result is consistent with a significant body of literature concluding forecast accuracy can be improved by combining multiple individual forecasts.314 It is also consistent with DAEs finding that its forecasts were too pessimistic but BIS Shrapnel's were too optimistic. The AER does not have the necessary data to undertake the same analysis for Victoria.
Table C.1 Comparison of past LPI forecast
Forecast 2006–07 2007–08 2008–09 2009–10 2010–11
Mean absolute error
Utilities
Actual 5.0 4.1 4.5 4.3 4.2
BIS Shrapnel (March 2007) 5.8 5.8 5.2 4.5 4.7 0.78
DAE (April 2007) 5.6 5.7 5.1 3.6 3.9 0.76
BIS Shrapnel (April 2009) 4.8 4.7 4.4 0.30
DAE (September 2009) 4.5 3.5 3.4 0.53
BIS Shrapnel (December 2009) 4.3 4.2 0.00
DAE (March 2010) 4.0 3.9 0.30
All industries
Actual 3.9 4.1 4.1 3.1 3.8
BIS Shrapnel (March 2007) 4.2 4.5 3.8 3.7 4.2 0.40
DAE (April 2007) 4.1 4.6 4.4 4.0 4.3 0.48
BIS Shrapnel (April 2009) 4.1 3.3 3.1 0.30
DAE (September 2009) 4.1 3.5 3.9 0.17
BIS Shrapnel (December 2009) 3.1 3.3 0.25
DAE (March 2010) 3.2 3.7 0.10
Source: AER analysis; BIS Shrapnel, Labour cost escalation forecasts to 2016–17—Australia and Queensland, January 2012, table 6.1
The AER notes BIS Shrapnel's forecast real productivity adjusted LPI exhibits a high level of volatility (figure Figure C.3). The AER considers BIS Shrapnel's labour productivity adjusted forecasts will overstate labour cost movements. These forecasts exhibit a strong increase in 2014 which is driven by BIS Shrapnel's forecast steep decline in labour productivity. Given the issues raised by the Productivity Commission regarding measured productivity in the EGWWS industry the AER is not satisfied BIS Shrapnel's forecast real productivity adjusted LPI will
314 Robert T. Clemen, 'Combining forecasts: A review and annotated bibliography', International Journal of Forecasting, volume 5, issue 4, 1989, pp, 559–583.
AER draft decision | Envestra 2013–17 | Draft decision appendices 83

accurately reflect Envestra's labour costs in the 2013–17 access arrangement period.
Figure C.3 Real productivity adjusted LPI forecasts (per cent)
Source: BIS Shrapnel, Real Cost Escalation Forecasts to 2017—Victoria and NSW, November 2011; Deloitte Access Economics, Forecast growth in labour costs in Victoria, 28 May 2012
C.5 Reasons for draft decision: network materials cost escalators
The AER does not approve Envestra's proposed network materials real cost escalators, because it considers the network materials real price increases forecast by Envestra were not arrived at on a reasonable basis and do not represent the best forecast or estimate possible in the circumstances.315 Envestra proposed to escalate its network materials costs by expected real price increases for PE pipes, forecast by BIS Shrapnel. The AER considers that BIS Shrapnel did not demonstrate:
that the total cost basket of network materials purchased by Envestra will increase at a rate greater than CPI
that PE pipe cost are increasing faster than the CPI
how foreign exchange forecasts, used to convert commodity prices from US dollars to Australian dollars, were derived
an empirical relationship between oil prices and PE pipe prices.
315 NGR, r. 74(2).
AER draft decision | Envestra 2013–17 | Draft decision appendices 84

Therefore, the AER considers Envestra's proposed materials real cost escalators were not arrived at on a reasonable basis and do not represent the best forecast or estimate possible in the circumstances.316 The AER considers Envestra's proposed materials real cost escalators were not arrived at on a reasonable basis because Envestra did not provide quantifiable evidence to demonstrate PE pipeline costs will escalate in real terms. The AER also considers Envestra's proposed materials real cost escalators do not represent the best forecast or estimate possible in the circumstances, because expected inflation produces superior forecasts for PE pipeline inflation.
The AER rejected proposed PE and other plastic pipeline real cost increases forecast in a similar manner in its past decisions for Country Energy, ActewAGL, and the Jemena Gas Networks.317 BIS Shrapnel also forecast cost escalators for Envestra's gas networks in South Australia and Queensland, which the AER also rejected.318 In all cases, the AER concluded real cost escalation was not appropriate and PE and other plastic pipe prices should be escalated by CPI only.
The following sections discuss these issues in greater detail.
C.5.1Empirical data on network materials costs
The AER considers BIS Shrapnel's forecast PE pipe price increases were not arrived at on a reasonable basis and do not represent the best forecast or estimate possible in the circumstances.319 It is not reasonable to forecast real price increases when there is no empirical evidence that prices are increasing faster than CPI. The available evidence suggests the recent trend for real PE pipe prices is negative. Envestra provided no contrary empirical evidence.
Envestra provided PE pipe price data in its submission to the 2011–16 access arrangements for its Queensland and South Australian gas distribution networks. These prices represent the nominal weighted average price for four pipe categories used by Envestra for the years 2004 to 2010.320 When adjusted for inflation, real PE pipe prices in 2010 were similar to those in 2004 (Figure C.1).
316 NGR, r. 74(2).317 AER, JGN final decision, June 2010, p. 85; AER, Country Energy draft decision, November 2009,
p. 28; and, AER, ActewAGL final decision, March 2010, p. 26.318 AER, Envestra Ltd: Access arrangement proposal for the Qld gas network, final decision, June
2011, p. 217; and AER, Envestra Ltd: Access arrangement proposal for the SA gas network, final decision, June 2011, p. 230.
319 NGR, r. 74(2).320 BIS Shrapnel, Real Cost Escalation Forecasts to 2015/16, March 2011, p. 59.
AER draft decision | Envestra 2013–17 | Draft decision appendices 85

Figure C.1 Index of real PE pipe prices faced by Envestra 2004–10 (2010 base year)
Source: BIS Shrapnel321
The rigid and semi-rigid polymer product manufacturing output producer price index from the ABS provides further evidence network materials costs are not increasing in real terms. The rigid and semi-rigid polymer product index, although not a direct measure of PE pipe cost escalation, provides some indication of the changes in the price level for products similar to PE pipe. From March 2009 to March 2012 the real value of the index, which includes PE pipe, decreased by 6.2 per cent.322
The AER requested Envestra provide any forward contracts it had for PE pipes. The contracts provided gave no evidence PE pipe prices will increase faster than inflation.323
C.5.2Network materials cost escalation forecast methodology
The AER considers BIS Shrapnel's forecast methodology for PE pipe prices does not produce forecasts arrived at on reasonable basis and does not represent the best forecast or estimate possible in the circumstances.324 The methodology is upwardly biased because it uses a material that it forecasts to increase in real cost as a proxy for all materials. The empirical data available also indicates that CPI based forecasts perform better than the type of methodology utilised by Envestra.
321 BIS Shrapnel, Real Cost Escalation Forecasts to 2015/16, March 2011, p. 59.322 ABS, Australian and New Zealand Standard Industrial Classification (ANZSIC), 2006; catalogue
number 1292.0; Producer Price Indexes, Australia, March 2012, catalogue number 6427.0; and Consumer Price Index, Australia, March 2012, catalogue number 6401.0.
323 Envestra, Response to AER information request 18, 1 July 2012.324 NGR, r. 74(2).
AER draft decision | Envestra 2013–17 | Draft decision appendices 86
0
20
40
60
80
100
120
140
2004 2005 2006 2007 2008 2009 2010
HDPEpipe
indexvalue

Any estimate that uses real cost escalation for only one materials as a proxy for the entire basket of network materials cost escalation, is not arrived at on a reasonable basis and does not represent the best forecast or estimate possible in the circumstances.325
This is because while the real cost of some items will increase, others will decrease. Adjusting only for real cost increases, and not decreases, produces upwardly biased cost forecasts. In order to establish that compensation for network materials real cost escalation is necessary, there must be evidence the entire basket of network costs has been increasing by more than CPI. Consequently, even if there is evidence the price of PE pipe will increase more than CPI this does not necessitate that Envestra's network materials costs will increase by more than CPI.
Envestra proposed the cost of network materials be escalated for forecast real cost increases in the price of PE pipe, as forecast by BIS Shrapnel.326 BIS Shrapnel used an input cost model to forecast the real change in PE pipe prices.327 An input cost model uses the cost of inputs, and the proportions in which they are used, to predict the price of an end product. There is no evidence that the weights assumed in BIS Shrapnel's input cost model produce accurate forecasts of network materials prices. However, an increase in the price of an input does not necessarily mean the price of related outputs will increase. There may be many causal factors that drive output prices. For example, producers may substitute to cheaper inputs or may not increase prices because customers will substitute to cheaper alternative products.
Past performance of input cost models, relative to CPI based forecasts, in predicting the cost of PE pipes has been poor. Envestra claimed real cost escalation, based on expected increases in oil prices, for PE pipes for its South Australian network's 2007–11 Access arrangement.328 The forecast price for PE pipes at the end of the period was more than 40 per cent higher than the realised prices provided by Envestra in support of its 2011–16 Access arrangements for its Queensland and South Australia networks.329 At the end of the same period PE pipe prices forecast based on CPI expectations were 4.7 per cent below realised pipe prices. Furthermore the mean squared prediction error (MSPE) was lower for the CPI based forecast than for Envestra's input cost model. This supports the argument that CPI produces more accurate PE pipe forecasts than input cost models. Therefore, the AER considers that BIS Shrapnel's materials real cost escalators are not arrived at on a reasonable basis and do not represent the best forecast or estimate possible in the circumstances330
C.5.3Foreign Exchange
The AER and BIS Shrapnel forecast movements in materials costs using data denominated in US dollars. These must be converted to Australian dollars for the 325 NGR, r. 74(2).326 Envestra Victoria, Access arrangement information, 30 March 2012, p. 105.327 BIS Shrapnel, Real Cost Escalation Forecasts to 2015/16, March 2011, p. 63.328 Envestra Ltd, Response to ESCOSA Draft Decision, Part A, 5 May 2006, pp. 25–26.329 BIS Shrapnel, Real Cost Escalation Forecasts to 2015/16, March 2011, p. 59.330 NGR, r. 74(2).
AER draft decision | Envestra 2013–17 | Draft decision appendices 87

purpose of estimating real cost escalation. The AER cannot approve forecasts without a statement on the basis of the forecast or estimate.331
The AER considers that exchange rate forecasts based on forward markets are the most realistic expectation of exchange rates during the 2013–17 access arrangement period. BIS Shrapnel converted US dollar denominated input prices to Australian dollars using internal forecasts.332 BIS Shrapnel do not explain how these forecasts were derived.
The timing of the foreign exchange forecasts relative to the commodity forecasts is also unclear in BIS Shrapnel's report. To the extent possible, materials costs forecasts and exchange rate forecasts should be derived at the same time because of the relationship between the two. Demand for the Australian dollar is related to demand for commodities. For example, if exchange rate forecasts were updated, but not the US dollar materials costs forecasts (because long term forecasts had not been updated, for example), then the Australian dollar materials cost forecasts would be biased. If the Australian dollar were to drop after the materials cost forecasts, then the materials cost forecasts would be upwardly biased since commodity prices are also likely to have dropped. Similarly, if the Australian dollar were to rise after the materials cost forecasts, then the materials cost forecasts would be downwardly biased.
C.5.4Commodity price forecasts
The AER considers BIS Shrapnel's oil price forecasts do not represent the best forecast possible in the circumstances.333 BIS Shrapnel used futures prices to forecast oil prices.334 The AER has accepted this method of forecasting in past decisions.335 However, given new evidence, the AER considers that this approach is no longer reasonable nor the best possible in the circumstances.
The AER also considers BIS Shrapnel's PE pipe price forecasts were not arrived at on a reasonable basis, and do not represent the best forecast or estimate possible in the circumstances.336
Oil
Generally the AER has considered prices in futures markets provide a reasonable basis to forecast commodity prices. BIS Shrapnel used Chicago Mercantile Exchange (CME) futures prices to forecast oil prices.
However a recent discussion paper from the Federal Reserve round that:
More commonly used methods of forecasting the nominal price of oil based on the price of oil futures or the spread of the oil futures price relative to the spot price cannot be recommended. There is no reliable evidence that oil futures prices significantly lower the MSPE relative to the no-change forecast at short
331 NGR, r. 74(1).332 BIS Shrapnel, Real Cost Escalation Forecasts to 2017, November 2011, p. 70.333 NGR, r. 74(2)(b).334 BIS Shrapnel, Real Cost Escalation Forecasts to 2017, November 2011, p. 70.335 AER, Final decision. Powerlink Transmission determination 2012–13 to 2016–17, April 2012, p.
50.336 NGR, r. 74(2).
AER draft decision | Envestra 2013–17 | Draft decision appendices 88

horizons, and long-term futures prices often cited by policymakers are distinctly less accurate than the no-change forecast. 337
The no–change forecast is a forecast that predicts future prices will be the same as the current price. The paper also noted that over horizons of several years the no change forecast adjusted for expected inflation was a better predictor of nominal oil prices than futures, expert economic forecasts, and the unadjusted current price of oil.338
It is also noted in the paper that:
This result is consistent with common views among oil experts. For example, Peter Davies, chief economist of British Petroleum, has noted that “we cannot forecast oil prices with any degree of accuracy over any period whether short or long”339
The AER is not satisfied the proposed oil price forecasts represent the best forecast possible in the circumstances.340 Based on this new research, the AER considers the best forecast or estimate possible in the circumstances is the expected change in the CPI.
Polyethylene pipe
The AER considers that BIS Shrapnel's forecast methodology for PE pipe produces forecasts that are not arrived at on a reasonable basis and do not represent the best possible forecast in the circumstances.341
The AER does not consider that BIS Shrapnel's methodology for forecasting PE prices is reasonable.342 BIS Shrapnel did not adequately demonstrate the relationship between PE pipe prices and oil prices. As explained in section C.5.2 an input price increase does not necessarily result in the price of related outputs rising. This problem of estimating causality and proportionality is likely to be compounded because, to determine the relationship between PE pipe prices and oil prices, BIS Shrapnel used thermoplastics as a proxy for PE.
The reasonableness of the model is brought into further question because it conflicts with prior findings. A study by the United States Bureau of Labor Statistics (BLS), the source of BIS Shrapnel's oil and plastics data, also explored the relationship between oil prices and plastic prices. The BLS model indicates an 8.2 per cent increase in US oil prices eventually leads to a 0.6 per cent increase in US plastics prices.343 By contrast, the model used by BIS Shrapnel to forecast PE pipe prices assumes a 1 per cent increase in oil prices leads to a 0.8 per cent increase in thermoplastic prices.344 Consequently the effect reported by 337 Alquist, R., Kilian, L. And Vigfusson, J., Forecasting the Price of Oil, Board of Governors of the
Federal Reserve System, International Finance Discussion Papers, Number 1022, July 2011, p. 69.338 Alquist, R., Kilian, L. And Vigfusson, J., Forecasting the Price of Oil, Board of Governors of the
Federal Reserve System International Finance Discussion Papers, Number 1022, July 2011, p. 2.339 Alquist, R., Kilian, L. And Vigfusson, J., Forecasting the Price of Oil, Board of Governors of the
Federal Reserve System International Finance Discussion Papers, Number 1022, July 2011, p. 26.340 NGR, r. 74(2)(b).341 NGR, r. 74(2).342 NGR, r. 74(2)(a).343 Weinhagen, J. C., Price transmission: from crude petroleum to plastics products, Monthly Labor
Review, December 2006, p. 54.344 BIS Shrapnel, Real Cost Escalation Forecasts to 2017, November 2011, p. 67.
AER draft decision | Envestra 2013–17 | Draft decision appendices 89

BIS Shrapnel is more than 10 times that estimated by the BLS. The AER notes BIS Shrapnel's Australian thermoplastic price forecasts also fail to account for the negative constant in its econometric model and thus overstates the effect of oil prices on thermoplastics prices.
Regression diagnostics also raise further concerns about the reasonableness of the model selected for BIS Shrapnel's PE forecasts. The adjusted R squared for BIS Shrapnel's Australian model was 0.11, indicating movements in oil prices explained only 11 per cent of the variation in thermoplastics prices. Thus, the majority of thermoplastics price movements cannot be explained by oil price movements. Given the low adjusted R squared and high correlation between the variables, some of the correlation between oil and thermoplastics prices may be explained by an omitted explanatory variable.
The AER considers BIS Shrapnel's application of their PE price forecasting methodology is not reasonable.345 This is because by not including the exchange rate as an explanatory variable in its model, BIS Shrapnel have introduced omitted variable bias. BIS Shrapnel used both an Australian model and a US model to estimate the relationship between oil prices and PE prices.346 The models use different data and the data in the Australian model are transformed into Australian dollars before the regression. This leads to an upward bias in the estimated relationship between oil and thermoplastics prices. This is because when the Australian dollar falls in value, all else being equal, the oil and thermoplastics prices in Australian dollars, will move up together. Conversely, when the Australian dollar increases in value, oil and thermoplastics prices will both decrease. As BIS Shrapnel's regression does not control for the exchange rate, the movements in thermoplastics prices caused by the exchange rate are attributed to oil prices. This may explain why BIS Shrapnel estimates a 1 per cent increase in oil prices will lead to a 0.8 per cent increase in thermoplastics prices in Australia but only a 0.3 per cent increase in the US. While it is necessary to adjust for the exchange rate, this should be done in the input cost model and not before the regression.
The AER found that using the US relationship between oil and thermoplastics, and adjusting for the exchange rate in BIS Shrapnel's Australian CME oil futures input cost model, led to an average nominal annual increase in PE pipe prices of 2.9 per cent over the 2013–17 access arrangement period. BIS Shrapnel forecast average annual CPI inflation to be 2.7 per cent.347 To test the sensitivity of the model, the AER ran BIS Shrapnel's input cost model with different inputs. The AER found, when properly adjusted for the exchange rate, using BIS Shrapnel internal oil price forecasts instead of CME oil futures in the input cost model forecast a real decrease in PE pipe prices over the 2013–17 access arrangement period. Using the same model again, but replacing forecast changes in the price of oil with expected CPI movements also produced real declines in the price of PE pipe. Given the range of forecasts produced by the BIS Shrapnel model fluctuate around the CPI, depending on the inputs used, the AER considers the model will not provide an improvement on CPI for forecasting network materials price
345 NGR, r. 74(2)(a).346 BIS Shrapnel, Real Cost Escalation Forecasts to 2017, November 2011, pp. 66–67.347 BIS Shrapnel, Real Cost Escalation Forecasts to 2017, November 2011, p. 70.
AER draft decision | Envestra 2013–17 | Draft decision appendices 90

increases. Therefore, the AER considers using the CPI as an inflator for network materials costs produces forecasts that are arrived at on a reasonable basis, and that represent the best forecasts or estimates possible in the circumstances.348
C.6 Revisions
The AER requires the following revisions to make the Access arrangement proposal acceptable:
Revision C.1: Opex and capex forecasts should be amended to reflect the labour and materials cost forecasts set out in C.1.1Table C.1.
348 NGR, r. 74(2).
AER draft decision | Envestra 2013–17 | Draft decision appendices 91

D Terms and conditions – SubmissionsThe AER has decided to accept a number of Envestra’s terms and conditions that the AER considers are consistent with the NGO. The AER received submissions that do not support the AER’s decision for some of those terms and conditions. The following table addresses those submissions and provides the AER’s reasons for its decision.
Clause Submission AER Consideration
New Customer Relationship
AGL submitted that Envestra has deleted former clause 3, which detailed the relationship between the parties. It is AGL’s preference to insert Multinet’s amended clause 3 on customer relationships.
Envestra was not amenable to the proposed revision.
The AER considers that this is a commercial matter more appropriately negotiated between the parties.
NewProvision of DB and cessation of DB services
AGL submitted that Envestra has deleted clause 4.1. If clause 3 is reinserted, AGL is not concerned if clause 4.1 is not included in the agreement.
The AER considers this a commercial matter more appropriately negotiated between the parties.
2.6 Service Standards
AGL submitted that the network should be operated and managed with 'due care and skill' or 'in accordance with good industry practice'.
Envestra was amenable in principal to the proposed revision.
This clause imposes an absolute obligation on Envestra. The AER considers that AGL’s suggested amendments would impose a lesser standard on Envestra.
The AER considers that an obligation to operate the network in accordance with the access arrangement promotes the efficient operation and use of gas services, an aspect of the NGO. The AER considers that AGL's proposed amendment to this clause is not more consistent with the NGO.
AER draft decision | Envestra 2013–17 | Draft decision appendices 92

3.3Fixed component of Haulage Service Charges
AGL submitted that if there is no shared customer at the Delivery Point (DP) and no consumption, the Network User should not be liable for ongoing service charges. For example, if a customer moves out and no new customer moves in, AGL questions why a Network User should continue to be liable for charges indefinitely. There is no mechanism in place in Victoria to allow Network Users to deregister the DP in these circumstances and cease to be Financially Responsible Operator (FRO) (as AGL understands there is in NSW). Accordingly it is unreasonable for Network Users to be liable for fixed service charges where there is no shared customer.
Envestra was not amenable to the proposed revision.
Under AEMO’s Retail Market Procedures for Victoria, the party registered as the FRO is the party responsible for settling the account relating to the supply point. Accordingly, the AER considers that the proposed sub-clause is appropriate, because it follows the procedures of the market operator. This is consistent with the efficient operation of Envestra’s network, an aspect of the NGO.
4.3 Network Limitations
AGL submitted that it is the responsibility of the Service Provider to maintain the pressure and flow rate. Clause 14 (Delivery Pressures) should be adequate to limit the Service Provider’s liability. Therefore, AGL submitted that the limiting phrase “and the pressure and flow-rate of Gas within the Network” should be deleted.
Envestra was not amenable to the proposed revision.
The AER considers that the qualification proposed by Envestra is consistent with the NGO. Envestra should not be obliged to deliver more gas than the technical limitations of the network provide for. The AER considers that pressure and flow-rate amount to technical limitations. The AER considers that clearly specifying the limits on Envestra’s obligation promotes the efficient operation use of gas services, an aspect of the NGO.
9.1Delivery Point Metering installation
AGL submitted that Envestra’s discretion must be 'reasonable'.
Envestra was not amenable to the proposed revision.
The AER considers that this sub-clause is consistent with the NGO. The sub-clause obliges the Network User to ensure that there is a safe source of electricity available at delivery points to enable Envestra to install and operate meters. The AER considers that the Network User is better placed to manage this through its contract with customers. The AER cannot envisage a situation where Envestra would make an unreasonable request.
The AER considers that the proposed term provides for the efficient operation and use of gas services, aspects of the NGO. The network would not operate efficiently if Envestra was unable to install and operate its meters.
AER draft decision | Envestra 2013–17 | Draft decision appendices 93

10.5 Notice of Results
AGL submitted that meter testing requests are usually due to high meter bill enquiries or billing disputes, and therefore have revenue implications. Accordingly, a specific timeframe (such as 10 business days from the date of request) for Envestra to provide the meter test results (rather than 'as soon as practicable') should be included.
Envestra was not amenable to the proposed revision.
The AER considers that an obligation to act as soon as practicable allows the flexibility to prioritise activities.
The AER considers that a flexible approach to the performance of activities promotes the efficient operation and use of gas services, aspects of the NGO.
10.7 Basis for Corrections
AGL submitted that this clause should only bind the Network User to the extent that the Network User can claim from the Customer as per the proposed undercharging and overcharging provisions of NECF.
Envestra was not amenable to the proposed revision.
The AER considers that this clause is consistent with the NGO. The AER considers that this clause sets out the process for correcting metering errors. The clause is qualified so that corrections will be made in the manner required by law or on a reasonable basis. The AER considers that it is appropriate to provide for the correction of metering errors. If such errors were not corrected, this could lead to distorted price signals and incorrect prices. This would not be in the long term interest of consumers with respect to price, an aspect of the NGO.
If AGL is concerned about exposure to liability, this is a commercial matter more appropriately negotiated between the parties.
11.1 Schedule Meter Reading
AGL submitted that Envestra should also be required to use reasonable endeavours to meet the Network User’s requested timeframes.
Envestra was not amenable to the proposed revision.
The AER considers that the specified frequency of meter readings is consistent with the NGO. It provides for regular meter readings. The AER considers that increasing the frequency of meter reading could lead to increased costs. This would not promote the efficient provision or use of gas services, or be in the long term interests of consumers, which are aspects of the NGO.
AER draft decision | Envestra 2013–17 | Draft decision appendices 94

To the extent that AGL requires Envestra to meet its timetable for meter reading, the AER considers this to be a commercial matter more appropriately negotiated between the parties.
11.5 & 11.6 Final Reading
AGL submitted that Envestra’s meter reading timeframes should be subject to a special read request.
Envestra was not amenable to the proposed revision.
The AER considers that the final reading times set out in the proposed access arrangement are consistent with the NGO. Envestra is required to make a reading at whatever time is required by law. In the absence of a law specifying a timeframe, the AER considers that Envestra’s proposed timeframes provide it with flexibility.
To the extent that AGL requires Envestra to meet its timetable for meter reading, the AER considers this to be a commercial matter more appropriately negotiated between the parties.
13.1 Receipt Pressure
AGL submitted that Envestra should not be able to unilaterally change the Receipt Pressure.
Envestra was not amenable to the proposed revision.
The AER considers that it is important that Envestra’s network is operated in a way that prevents damage to the network. As the owner and operator of the Network, Envestra is best placed to understand its limitations.
Retailers can manage any potential changes in Envestra’s specified pressure through their contracts with upstream suppliers.
The AER considers that this clause is consistent with the NGO because it promotes the efficient operation of the Network.
14.1 Delivery Pressure AGL submitted that Envestra should also be required to exercise all due care and skill.
This clause requires that "Envestra will ensure that gas delivered at each DP is within the range of pressure prescribed by law..." The AER considers that this clause imposes an absolute obligation
AER draft decision | Envestra 2013–17 | Draft decision appendices 95

Envestra was not amenable to the proposed revision.
on Envestra. AGL proposes to make the obligation that "Envestra will ensure that all gas delivered with all due care and skill at each DP..."
The AER considers that the qualification proposed by AGL would lower the standard of Envestra’s obligation. This is because Envstra would only have to ensure that gas was within the range of pressure if the gas was delivered with all due care and skill. The AER considers that the current wording requires Envestra to ensure that gas is within the specified range of pressure regardless of how it is delivered. The AER considers that delivery pressure is solely in the control of Envestra. Envestra should have an unqualified obligation to make sure the pressure is within a range prescribed by law, or agreed to with the Network User. The AER considers that this will promote the efficient operation and use of the gas system, an aspect of the NGO.
15.3Limited Responsibility after Delivery
AGL submitted that the Service Provider should be liable if it causes damage through a breach of clause 12, 13 or 14.
Envestra was not amenable to the proposed revision.
The AER considers that these clauses impose a number of obligations on both Envestra and the Network User. These clauses relate to the specifications and ownership of gas. The AER considers that it is important to clarify these obligations so as to incentivise each party to take steps to avoid damage to the gas network. This is consistent with the promotion of efficient operation and use of gas services, aspects of the NGO.
The AER considers that these clauses impose obligations on Envestra. There are contractual remedies available to a Network User that suffers loss as a result of a breach of these clauses.
AER draft decision | Envestra 2013–17 | Draft decision appendices 96

17.3
Origin submitted that clause 17.3 outlines the order of curtailment Envestra will undertake. Origin is unclear as to why this clause is so specific in its level of detail, since AEMO has powers to direct load shedding based on load curtailment tables. Origin proposes that it be amended to a more general clause similar to 6.1(a) in the SP AusNet Victorian Terms and Conditions, in the interest of consistency across distributors.
Envestra was amenable in principal to the proposed revision.
The AER considers that the clause as proposed is consistent with the NGO. The AER considers that this clause provides a level of detail that enables parties to know in advance what will happen in the event of curtailment. This enables them to take action to mitigate any potential damage. The AER considers that this promotes the efficient operation and use of gas services, aspects of the NGO.
18.1 Grounds for Disconnection
AGL submitted that this clause should clarify that if Envestra does not disconnect a delivery point on request, it will be liable for any energy charges accrued after that date of the request. AGL further submitted that the clause should also provide that in this situation the Network User is not liable for any Distribution charges after the date of the request.Envestra was not amenable to the proposed revision.
The AER considers that it is appropriate to specify that Envestra may disconnect a delivery point where it is permitted by law. This clause avoids uncertainty, which promotes the efficient provision and use of gas services, aspects of the NGO. Under AEMO’s Retail Market Procedures for Victoria, the party registered as the FRO is the party responsible for settling the distribution charges relating to the supply point. Notwithstanding the Network User’s request to disconnect the delivery point, it will continue to be registered as the FRO, and therefore liable under AEMO’s procedures.
To the extent that AGL wishes this clause to cover energy charges accrued after the date of request, the AER considers this to be a commercial matter more appropriately negotiated between the parties.
20 Obligation to Pay Charges
AGL submitted that where the Network User is unable to claim charges from a customer, whether for legal or insolvency reasons, the Network User should not be liable for Distribution Charges. AGL considers that normal commercial allocation of risks, whereby each party is liable for their own losses should apply. For example, the user bears liability for
The AER considers that where a Network User is concerned about the solvency of a customer, it is open to it to manage this risk via its contractual arrangement with the customer. The AER considers that Network User's, as the party with the direct customer relationship, is best placed to manage this risk.
AER draft decision | Envestra 2013–17 | Draft decision appendices 97

energy costs and the Network User bears liability for distribution charges.
Envestra was not amenable to the proposed revision.
As it is framed, the clause provides certainty and promotes the efficient provision and use of gas services, aspects of the NGO.
20.1 Obligation to Pay Charges
AGL submitted that Network Users should only be liable to pay for charges requested or agreed by the Network User. Network Users would not have visibility of customer or Service Provider initiated services and accordingly should not bear the financial risk if a customer refuses to pay for the service.
Envestra was not amenable to the proposed revision.
The AER considers that it is appropriate to place an obligation on Network Users to pay Distribution Service Charges to Envestra. This obligation is qualified by sub-clause 20.3, so that the Network User is not obliged to pay where Envestra has entered into a direct billing arrangement with a shared customer. Such an obligation is consistent with the NGO because it promotes the efficient operation and use of gas services.
AGL appears to be concerned about its obligation to take over distribution charges once a direct relationship between a customer and Envestra comes to an end. The AER considers that this risk can be managed through the contractual relationship between the Network User and the customer.
21.1 Statement of Charges
AGL submitted that for the sake of clarity, and to reflect AGL’s system capabilities and resource constraints, this clause should specify that billing will not occur more frequently than monthly.
Envestra was not amenable to the proposed revision.
The AER considers that including a term specifying the provision of a statement of charges is consistent with the NGO because it increases transparency and assists in avoiding errors. This will promote the efficient operation and use of the gas services and is in the long term interests of consumers, aspects of the NGO.
The AER considers that the date and frequency of providing a statement of charges is a commercial matter more appropriately negotiated between the parties.
21.2 Content of AGL submitted that Envestra’s invoices should be The AER considers that this clause, as proposed,
AER draft decision | Envestra 2013–17 | Draft decision appendices 98

Statement of Charges
required to contain sufficient information as to allow the Network User to verify/reconcile the charges (including how they determine 'non-fixed' charges, service order numbers and dates of requests.
Envestra was not amenable to the proposed revision.
provides sufficient scope for Network Users to verify/reconcile the charges. The clause expressly states that each statement of charges must include the information required by law. The clause also states that a statement of charges may include any other information which Envestra agrees to include. The AER therefore considers that there is scope for Network users to request the inclusion of additional information.
To the extent that a Network User requires different information in a statement of charges, the AER considers this to be a commercial matter more appropriately negotiated between the parties.
21.5 Due Date for Payment
APG submitted that payment of invoices within 10 business days is not consistent with the timeframe under which retailers are able to receive payment from consumers (13 business days under NECF). This timeline should be equalised.
In clause 21.5 Origin proposes the term 'Tax Invoice' instead of “Statement of Charges” since this sits better with the requirements of GST legislation. Further, Origin proposes that the sentence 'the Network User must pay the full amount specified in each statement of charges, without set-off, by the due date for payment', be modified to 'the Network User must pay the full amount specified in each statement of charges by the due date for payment without deduction or set-off unless required by law', recognising that some deductions and set-offs can be required of recipients by law.
Envestra stated that this clause is already subject to clause 23.
The AER considers that the proposed due date for payment of 10 days after the date of issue of the statement of charges is appropriate. This timeframe provides the Network User with reasonable notice of due payments and allows for each party to manage its cash-flow. This promotes the efficient operation and use of gas services, aspects of the NGO.
The parties are free to negotiate any amendments that they seek. However, the AER considers this as a commercial matter best negotiated between the parties.
22.1 Recovery Not Permitted
AGL submitted that the Network User should not be required to pay amounts where it is unable to recover
Clause 22.1 provides that if the Network User is not permitted to recover Distribution Service Charges
AER draft decision | Envestra 2013–17 | Draft decision appendices 99

the amount from the customer for reasons beyond its control—such as customer insolvency. AGL submitted that if Envestra failed to invoice a Network User due to its own negligence and in the meantime the customer cannot be located or is insolvent, Envestra should be responsible for the charges.
The reference to the National Energy Retail Law (NERL) and National Energy Retail Rules (NERR), which form part of NECF, should also be deleted as restrictions on recovery also apply in Victoria.
Envestra was not amenable to the proposed revision.
from a Shared Customer under NECF, then Envestra is not permitted to recover those Distribution Service Charges from the Network User.
The AER has proposed an amendment to this sub-clause to make it clear that it only applies once NECF is adopted in Victoria.
The AER does not consider that AGL’s submission is relevant to this sub-clause.
The AER considers that the concerns raised by AGL can be addressed in its customer contract. Further, the AER considers that these are general risks of doing business. The AER considers that, as the party with the direct customer relationship, the Network User is the most appropriate party to bear this risk.
If this type of risk was borne by Service Providers, they would face greater potential liability than a Network User would. This is because they would have to bear the risk for all customers. Requiring the risk to be borne by Network Users reduces the level of risk that each Network User faces. Breaking the risk up is likely to reduce overall costs, which is in the long term interest of consumers with respect to price, an aspect of the NGO.
AER draft decision | Envestra 2013–17 | Draft decision appendices 100

Necessary amendments due to Victoria’s non adoption of NECF are discussed at 12.1.5.
25.1 Method of Payment
APG requests that Austraclear be allowed as an additional payment method to electronic bank transfer.
Envestra was not amenable to the proposed revision.
The AER considers that the method for making payment is a commercial matter more appropriately negotiated between the parties.
25.2 Business Days
AGL submitted that in accordance with industry, banking and commercial practice payments should be made on the next business rather than the day prior.
APG submitted that it opposes the requirement for payment one business day in advance of the due date for payment when the due date is not a business day, as it effectively shortens the payment due date to nine business days from the date of invoice. Retailers should have until the next business day to make payment.
Envestra was not amenable to the proposed revision.
The AER considers that specifying the due date for payment avoids uncertainty and the potential for disputes. This promotes the efficient use and operation of gas services, aspects of the NGO.
To the extent that the Network Users want to specify a different day, the AER considers this a commercial matter more appropriately negotiated between the parties.
28.5 No Refunds AGL submitted that Envestra should only be able to set off refunds or repayments due to the Network Users upon agreement with the Network User. Particularly, if the refund is pertaining to an error or overcharge of the Service Provider.
Origin submits that clause 28.5 absolves Envestra of any obligation to refund Network Users. Origin submits that this seems too broad, as it also excludes an instance where Envestra has overcharged the Network User. Origin proposes adding the words “except where Envestra has overcharged”.
Envestra was not amenable to the proposed revision.
This clause provides that Envestra will have no obligation to refund any amount paid by the Network User on account of Distribution Service Charges to become payable under the Agreement.
The AER considers that Envestra should not be required to refund payments that have been made on account of Service Charges that are to become payable. If these payments were refunded, once the amount became payable, the Network User would then have to pay. Refunds in this situation would create additional complexity and inefficiency. This is not consistent with the efficient operation of gas services, an aspect of the NGO.
AER draft decision | Envestra 2013–17 | Draft decision appendices 101

28.6 Imbalance on Termination
AGL submitted that for the sake of clarity, clause 28.2 (termination) should be referenced here.
Envestra was not amenable to the proposed revision.
The AER considers that the reference to termination of the Agreement in this sub-clause is sufficiently clear and it is not necessary to expressly reference sub-clause 28.2.
29.5 Limitation Period
AGL queries the necessity of this provision. It states that three months is a short timeframe to gather full particulars and this clause is not included in other Access Arrangements. AGL submits that it recently discovered errors with an invoice for a retrospective period. The errors demonstrated that Envestra charged thousands of dollars for service orders that AGL did not even raise. AGL submitted that because there is a three month limit on Retailers disputing their network charges, Envestra refused to refund those amounts in SA and Qld even though AGL was charged in error.
Origin submitted that clause 29.5 contains a three month limitation period, where statutory limitation periods could apply, or at least a six month period in light of the two month billing cycle.
Envestra was not amenable to the proposed revision.
The AER considers that a limitation period is reasonable and consistent with the NGO. Such a period will encourage Network Users to make a swift decision on whether to commence a claim or not. The AER considers that this removes uncertainty and promotes the efficient operation and use of gas services, aspects of the NGO.
The AER notes that the time limit commences once the claim becomes known or should have become known. The AER considers that this protects the Network User whilst imposing a constraint aimed at ensuring the efficient provision of services.
32.1 Information
AGL submitted that rule 94 of the NERR, covers assistance and cooperation. This subject matter should default to NECF in the same way other provisions have.
Envestra was not amenable to the proposed revision.
The AER notes that NECF does not presently apply in Victoria. Whilst (once it is adopted in Victoria) NECF will govern key aspects of information sharing, it will not cover every aspect. The AER considers that clarifying the parties’ obligations with respect to information sharing and provision is beneficial. This creates clarity and avoids uncertainty. The AER considers this to be consistent with the NGO as it promotes efficiency in the provision of services.
32.3 Consultation AGL submitted that Envestra should be subject to the same 'assistance and or cooperation', and no cost and in a timely manner obligations as are imposed on Network Users in clause 32.2.
The AER does not consider that it is necessary for this clause to be reciprocal. Clause 32.2 provides for the Network User to obtain information or action from third parties. This requires Envestra to provide information to a third party. It is unlikely that Envestra
AER draft decision | Envestra 2013–17 | Draft decision appendices 102

Envestra stated that this clause does not state that it will charge a fee.
will need to obtain information or action from a third party in the way a Network User will. Accordingly, it is not necessary for the clauses to be reciprocal.
The Network User is best placed to ensure that customers and upstream operators provide necessary assistance, cooperation or information in a timely manner. As the Network User has a contractual relationship with these parties, these obligations can be managed through that relationship.
The AER considers that obliging the Network User to provide or obtain assistance or information to assist Envestra to comply with its obligations is consistent with the NGO. Such obligations ensure that Envestra can meet its obligations and operate the network efficiently. The AER considers that this promotes the efficient use of services, aspects of the NGO.
33.6 Indemnity Qualification
AGL submitted that the words “negligent or wrongful” should be deleted as any act or omission of Envestra that contributed to the loss or liability should reduce the Network User’s liability.
Origin submitted that in clause 33.6 the words “negligent or wrongful” should be deleted. Origin submitted that any contribution by Envestra to the loss or liability should reduce the Network User’s liability, not just where the contribution was wrongful or negligent. Alternatively, Origin submitted that the Network User’s liabilities should be limited to exclude acts that are neither wrongful or negligent.
Envestra was not amenable to the proposed revision.
The AER considers that this term is consistent with the NGO because it provides an incentive for Envestra to avoid negligent or wrongful acts or omissions. The AER considers that it is appropriate to qualify indemnities to incentivise the indemnified party to take steps to avoid or mitigate the loss that the indemnity covers. This is likely to reduce costs, which is in the long term interests of consumers with respect to price, an aspect of the NGO.
To the extent that Origin and AGL consider that the indemnities it provides should be further qualified, the AER considers this a commercial matter most appropriately negotiated between the parties.
AER draft decision | Envestra 2013–17 | Draft decision appendices 103
36 Confidentiality
AGL queries why these clauses are not reciprocal.
Origin submitted that the confidentiality requirements in clause 36 should be reciprocal on both parties.
Envestra was not amenable to the proposed revision. Envestra stated that obligations on it are contained in the NGL.
The NGL imposes obligations on Envestra with respect to confidentiality. Accordingly, the AER considers that it is not necessary to repeat them in the Agreement.
37 Dispute Resolution
AGL submitted that the dispute resolution clauses in the Rules are adequate.
Origin submits that clause 37.1 involves an independent expert in a dispute, whereas the Multinet/SP AusNet terms involve the Chief Executive Officers (CEOs) of the two entities. Origin notes that dispute resolution is covered under NECF. Origin propose that in the interim the CEOs be substituted for independent experts in the interests of reducing costs and consistency.
Envestra was not amenable to the proposed revision.
The AER considers that appointing an independent expert for dispute resolution is consistent with the NGO because it provides for the resolution of disputes and avoidance of litigation. This is likely to reduce costs which would be in the long term interest of consumers with respect to price, an aspect of the NGO.
Further, the AER notes that sub-clause 37.3 requires the parties to meet and endeavour to resolve the dispute through negotiation. The parties may only refer a dispute to resolution by an independent expert if they have been unable to resolve it by negotiation within 10 business days. Accordingly, the AER considers that there is scope for the parties to negotiate prior to referring a dispute to resolution by an independent expert.
To the extent that Origin considers this clause should refer to the negotiation being conducted by the respective CEOs, the AER considers this a commercial matter best negotiated between the
AER draft decision | Envestra 2013–17 | Draft decision appendices 104
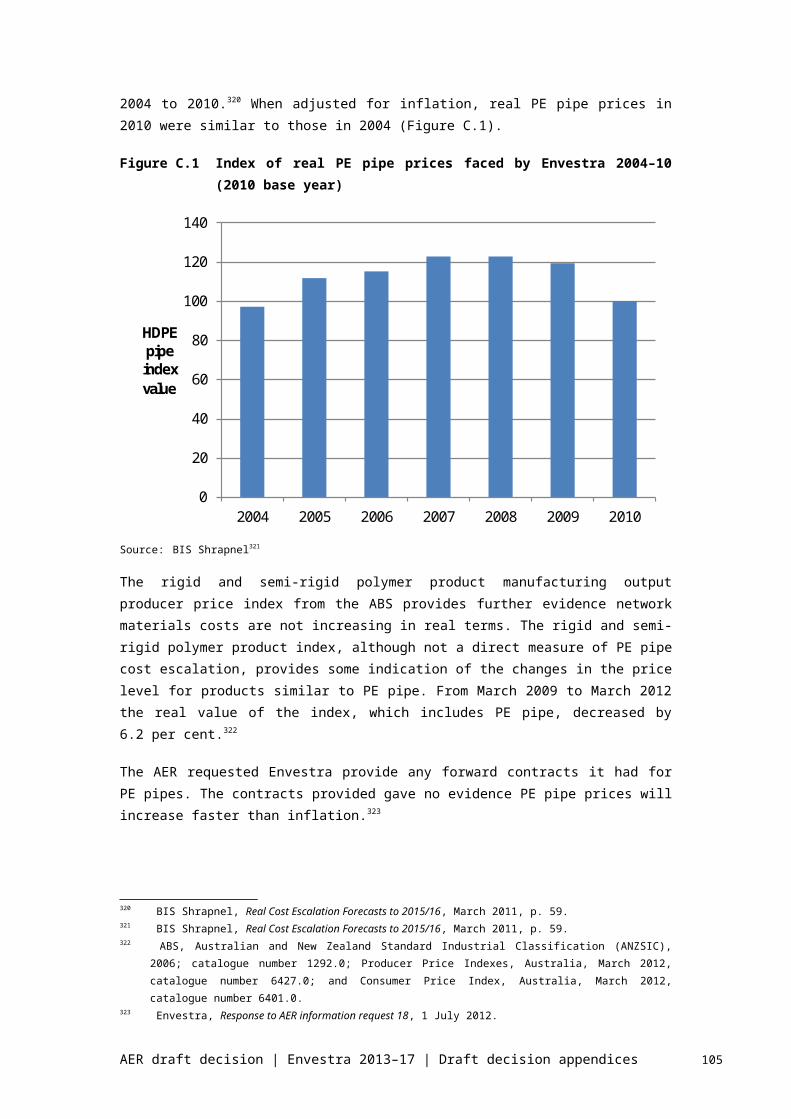
parties.
38.1(b) Notice
AGL submitted that the reference to fax should be deleted. This is an out-dated means of communication and not as reliable as the other suggested methods.
Envestra was amenable to the proposed revision.
The AER considers this a commercial matter most appropriately negotiated between the parties.
43.2(c)
Origin would like to make it explicit in clause 43.2(c) that payment of GST is required on taxable supply subject to the receipt of a valid tax invoice. This aligns with the requirements of relevant GST legislation. The words “Subject to the receipt of a valid tax invoice…” could be added to the beginning of this clause to make this explicit.
Envestra was amenable in principal to the proposed revision.
The AER considers this a commercial matter most appropriately negotiated between the parties
AER draft decision | Envestra 2013–17 | Draft decision appendices 105

E OutsourcingEnvestra outsources its network operating and maintenance activities to the APA Group for both Envestra Victoria and Envestra Albury. As a result, much of Envestra's forecast costs are based on fees paid to the APA Group. These include fees for the actual direct and indirect costs incurred by the APA Group in providing the outsourced services, a margin and incentive payments.
This appendix sets out the AER's assessment of Envestra's proposed expenditure via its outsourcing arrangements with the APA Group.
The AER has considered Envestra's outsourcing arrangement in detail to assess whether the forecast expenditure incurred under the arrangement meets the relevant criteria under the NGR.349
E.1 Network Management Fee
The AER considers there is sufficient evidence to suggest that a forecast of opex inclusive of the Network Management Fee (NMF) under Envestra's operating and management agreement with the APA Group is consistent with the criteria governing operating expenditure under the NGR.350 In particular, that:
Envestra is acting prudently and efficiently by outsourcing the operation and maintenance of Envestra Victoria and Envestra Albury to the APA Group. This is demonstrated by Envestra's reasonable performance against various benchmarks.
industry practice is to outsource the operation of networks to take advantage of economies of scope and scale available to asset management companies. Envestra is acting in accordance with good industry practice by outsourcing the operation and maintenance of Envestra Victoria and Envestra Albury to a large asset management company to access these economies of scale and scope.
the AER considers an indicator of achieving the lowest sustainable cost is efficiency. Envestra's total opex has been relatively efficient in the 2008–12 access arrangement period. Therefore, as Envestra's forecast opex is based on historical opex, the AER considers the forecast opex of Envestra Victoria and Envestra Albury inclusive of the NMF is reflective of the lowest sustainable cost of providing reference services.
E.2 Incentive payments
The AER's draft decision is not to include forecast opex and capex incentive payments in Envestra's total revenue forecasts for Envestra Victoria as it does not consider Envestra's forecast opex and capex inclusive of incentive payments is a forecast that satisfies r. 74 of the NGR.
349 NGR, rr. 74, 91 and 100.350 NGR, r. 91,
AER draft decision | Envestra 2013–17 | Draft decision appendices 106

E.3 Envestra proposal
Envestra outsources its network operating activities to the APA Group under the 2007 operating and management agreement (2007 OMA).351 The 2007 OMA applies to Envestra Victoria and Envestra Albury and is on similar terms to the 2007 OMA for Envestra's South Australian, Queensland and Northern Territory networks and the 2011 OMA for its Wagga Wagga network.352 Under the 2007 OMA for Victoria and Albury, Envestra makes a number of payments to the APA Group, including:353
reimbursement of reasonable costs (direct and indirect) incurred by the APA Group in the performance of its obligations
a NMF equal to 3% of network revenue
incentive payments payable for achieving reductions in costs of new connections and controllable costs per GJ.
Envestra incorporated the NMF and estimated incentive payments in its proposed opex and capex forecasts for the 2013–17 access arrangement period.354
Envestra submitted the costs incurred under the 2007 OMA are consistent with the NGR because:
the relevant consideration under the NGR is whether the expenditure is likely to result in lower overall costs compared to alternative arrangements, that is, in-house service provision. Having regard to r. 91 of the NGR, Envestra submitted that it does not need to show that expenditure is in fact the lowest sustainable cost achievable.
outsourcing via the 2007 OMA enables Envestra to obtain significant scale and scope efficiencies. Were it not to pay the NMF, Envestra submitted it would not be able to access these efficiencies, with the alternative being to undertake all operating activities in-house at greater cost.
Envestra's outsourcing arrangement has been subject to extensive regulatory scrutiny and it has been determined that the costs incurred under the outsourcing arrangements have satisfied the relevant criteria under the NGL and NGR.355
351 Envestra, Victoria Access arrangement information, March 30 2012, p. 55; Envestra, Albury Access arrangement information, March 30 2012, p. 51.
352 Envestra, Victoria Access arrangement information, March 30 2012, pp. 57–58; Envestra Limited, Albury Access arrangement information, March 30 2012, pp. 53–54.
353 Envestra, Victoria Access arrangement information, March 30 2012, pp. 68–39; Envestra Limited, Albury Access arrangement information, March 30 2012, pp. 64–65.
354 Envestra included a NMF equal to 3% of the total revenue of Envestra Victoria and Envestra Albury in its proposal, allocated equally to the proposed opex and capex forecasts. Incentive payments were only included for Envestra Victoria.
355 Envestra, Victoria Access arrangement information, March 30 2012, p. 91; Envestra, Albury Access arrangement information, March 30 2012, p. 86.
AER draft decision | Envestra 2013–17 | Draft decision appendices 107

E.4 Assessment approach
The AER must have regard to whether the proposed expenditure incurred via outsourcing arrangements is consistent with the NGR and NGL. In particular, whether the proposed expenditure is such as would be incurred by a prudent service provider acting efficiently, in accordance with accepted good industry practice to achieve the lowest sustainable costs of delivering pipeline services.356 The proposed expenditure must also be consistent with r. 100 of the NGR which specifies that the provisions of an access arrangement must be consistent with the National Gas Objective (NGO) and the Revenue and Pricing Principles (RPP).357
To assess the consistency of Envestra's proposed NMF and incentive payments with the NGR, the AER has applied a two stage approach that can be summarised as follows:
5. Can the contract be presumed to be efficient and prudent? (presumption threshold)
6. Further assessment of contracts that fail the presumption threshold – is the contractual cost consistent with the NGR (i.e. is it prudent and efficient)?
Where an outsourcing arrangement is obtained through a competitive market process, the AER considers it reasonable to presume that the contract price reflects efficient costs and is consistent with the NGR.358 However, where this is not the case, particularly in situations where services are accessed via non-arms length transactions or are part of a broader transaction, the AER does not consider it reasonable to assume that costs within such agreements are efficient. Such circumstances might influence a service provider to artificially inflate expenditures, particularly via the addition of profits or margins in addition to expenditures for direct and indirect cost recovery.359
Given these concerns with contracts sourced on a non-competitive basis, the AER considers it necessary to investigate outsourcing arrangements that fail the presumption threshold in more detail. When undertaking a further assessment of outsourcing arrangements, the AER considers whether:
the total contractual cost is prudent, efficient and the lowest sustainable cost of providing pipeline services
outsourcing is in accordance with good industry practice
the costs within the contract relate wholly to the provision of the regulated service
there is any double counting of costs within the contract.
356 NGR, r. 91,357 NGR, r. 100.358 The AER's reasons for presuming certain outsourcing arrangements obtained through a
competitive market process are efficient and prudent are discussed in AER, Final decision – Victorian electricity distribution network service providers distribution determination 2011–2015, October 2010, pp. 163–168.
359 AER, Final decision – Victorian electricity distribution network service providers' distribution determination 2011–2015, October 2010, p. 150.
AER draft decision | Envestra 2013–17 | Draft decision appendices 108

The AER considers an indicator of a service provider achieving the lowest sustainable cost of providing pipeline services is when its costs are efficient. Efficient costs are those expected costs that would be based on outcomes in a workably competitive market. The AER has undertaken benchmarking analysis as an indicator of whether the costs are consistent with outcomes expected in a workably competitive market.
E.5 Reasons for decision
The AER's assessment of the APA Group's costs and expenses that form part of Envestra's proposed opex and capex forecasts is in attachment 3 and 6. The analysis in this section focuses on whether the AER can presume the contract is prudent and efficient, and whether the NMF and incentive payments (i.e. payments in addition to direct and indirect costs of the APA Group) are consistent with the NGR.
E.5.1NMF
Presumption threshold
The presumption threshold test involves consideration of whether Envestra had an incentive to agree to non-arm's length terms at the time the contract was negotiated or at the most recent contract re-negotiation. An indicator of potential incentives to agree to non-arms length terms include situations where the contract was entered into (or renegotiated) as part of a broader transaction.
Envestra has outsourced the operation and maintenance of Envestra Albury and Envestra Victoria to the APA Group since 2007. The terms of the agreement are set out in the 2007 OMA for these networks.360 The 2007 OMA is a novation (with minor amendments) of a 1999 OMA between Envestra and Boral Energy Asset Management (BEAM) for Envestra's network operating activities relating to the Victorian and Albury gas distribution networks.
The AER notes that the 1999 OMA obligated Envestra not to unreasonably withhold its consent to a novation. As a result, when APA Group took over the contract in 2007, Envestra appears not to have been at large to renegotiate the contract. Therefore, it appears that the 2007 OMA was not as much a new contract, as it was largely the continuation of a contract originally struck in 1999. As such, it seems appropriate that the AER examine the 1999 OMA to determine compliance with r. 91 of the NGR.
The 1999 OMA was entered into as part of a joint bid between Boral and Envestra for the Stratus gas distribution and retail businesses in Victoria.361 Table E.1 sets out a summary of the history of the outsourcing arrangements between Envestra, Boral and the APA Group.
360 Note this agreement is separate to the 2007 OMA for the South Australian, Queensland and the Northern Territory networks (Envestra, Victoria Access arrangement information March 30 2012, p. 57; Envestra, Albury Access arrangement information March 30 2012, p. 53).
361 Envestra, Victoria Access arrangement information March 2012, p. 59; Envestra, Albury Access arrangement information March 2012, p. 55.
AER draft decision | Envestra 2013–17 | Draft decision appendices 109

Table E.1 History of Envestra's outsourcing arrangements
Date Event
June 1997
Envestra and Boral entered into a series of transactions concerning the sale by Boral to Envestra of the SA gas distribution network. Envestra was a wholly owned subsidiary of Boral.
BEAM (100% subsidiary of Boral) and Envestra entered into agreement (1997 OMA) for the operation and maintenance of the South Australian and Queensland Networks.
August 1997 Envestra was floated on the stock exchange. Boral purchased 19.97% of Envestra in the public offering.
1999
Envestra and BEAM formed a consortium to bid for the Stratus distribution and retail businesses in Victoria. The joint bid consisted of various components, including an amount for the retail component (contributed by Boral) and an amount for the distribution component (contributed by Envestra). As part of this joint bid, Envestra and BEAM entered into the 1999 OMA for BEAM to manage the operation and maintenance of the Stratus distribution network if the bid was successful. The terms of the 1999 OMA were similar to the terms of the 1997 OMA.
February 2000Boral underwent a demerger. The effect of this was that Origin became the owner of Boral’s shares in Envestra and Origin Energy Asset Management (OEAM – 100% owned by Origin) became the renamed operator under the 1997 and 1999 OMAs.
July 2007
Origin Energy decided to sell various assets and operations, including its operating functions under the 1997 and 1999 OMA. The APA Group acquired the assets, which included Origin’s 17% shareholding in Envestra and Origin’s 100% interest in OEAM. The 1997 and 1999 OMAs were novated so that the APA Group replaced OEAM as the operator. The 2007 OMAs are in substantially the same terms as the original agreements.
2011Envestra entered into an OMA with the APA Group for the network operation of its recently acquired Wagga Wagga gas distribution network. The terms of the 2011 OMA are similar to the 2007 OMA for the Victorian and Albury networks.
2012The APA Group now holds an equity interest of around 33% and is the largest shareholder in Envestra. Envestra’s board has eight members: two are appointed by the APA Group, two by CKI (Envestra’s other major shareholder) and four are independently appointed.
Source: Envestra Limited, Victoria Access arrangement information March 2012, pp. 53–60.
Given the 1999 OMA was entered into as part of a broader transaction, and Envestra appears not to have been at large to renegotiate in full the terms of the 2007 OMA at the time of the novation, the AER has concerns that Envestra may have had incentives to agree to non-arms length terms. Therefore the AER cannot presume that the costs incurred under the 2007 OMA are efficient and prudent.
Further assessment of contracts that fail the presumption threshold
The AER considers the forecast costs incurred via the outsourcing arrangement with the APA Group require further assessment for it to be satisfied that Envestra's forecast costs are consistent with the NGR.
AER draft decision | Envestra 2013–17 | Draft decision appendices 110

Is the margin efficient?
One consideration of whether the forecast costs incurred via the outsourcing arrangement with the APA Group are efficient is whether earning the margin above costs is efficient. The AER considers a margin is efficient if it is comparable to margins earned by similar providers in competitive markets.
Envestra provided a consultant report comparing the margins paid by Envestra to the APA Group to margins earned by comparable entities.362 Businesses in the sample included infrastructure contractors and network infrastructure contractors. The margin calculated by NERA was an earnings margin, calculated as Earnings Before Interest and Tax (EBIT) divided by revenue.
The EBIT margin provides a measure of the funds available to the contractor to pay taxes and pay a return on physical and intangible assets. It may also incorporate the allowance paid to the contractor to align its interests with those of the asset owner.363 NERA found that the estimated margin paid by Envestra to the APA Group in the form of the NMF and incentive payments was within the 95% confidence interval for all benchmark comparisons undertaken.
The AER agrees that, based on the report's findings, the estimated margin paid by Envestra is comparable to the estimated margin of the businesses sampled in the report. This would suggest that the margin received by Envestra is not inconsistent with industry practice.
However, while the AER notes that an EBIT margin is a standardised measure that assists with comparisons between different businesses, it also notes that margins are used in business contracts for a number of different purposes, including recovery of the cost of overheads and returns on assets. Given the variances between terms and price structures of individual contracts, the AER considers the comparison of EBIT margins may not be undertaken on a like-for-like basis. The large volatility in the range of margins observed in NERA's sample is an indication that the margins included in the sample may be for different purposes.
Given these limitations, the AER has placed less weight on the results of the NERA benchmarking report in its consideration of whether the costs incurred via the 2007 OMA are consistent with the NGR. Further, the AER considers this evidence cannot be relied on as the sole determinant of whether the outsourcing arrangement is consistent with the NGR.
Performance of Envestra
The AER also considered Envestra's performance by considering benchmarking of Envestra against other gas distribution service providers. The AER considers the results of this analysis provide an indication of whether Envestra's historical costs are efficient and prudent.
Envestra provided two reports from Economic Insights as part of its proposal which consider the relative productivity of the Victorian DBs using total factor
362 NERA, Benchmarking study of contractor profit margins (2002–2011), March 2012.363 NERA, Benchmarking study of contractor profit margins (2002–2011), March 2012, p. 8.
AER draft decision | Envestra 2013–17 | Draft decision appendices 111
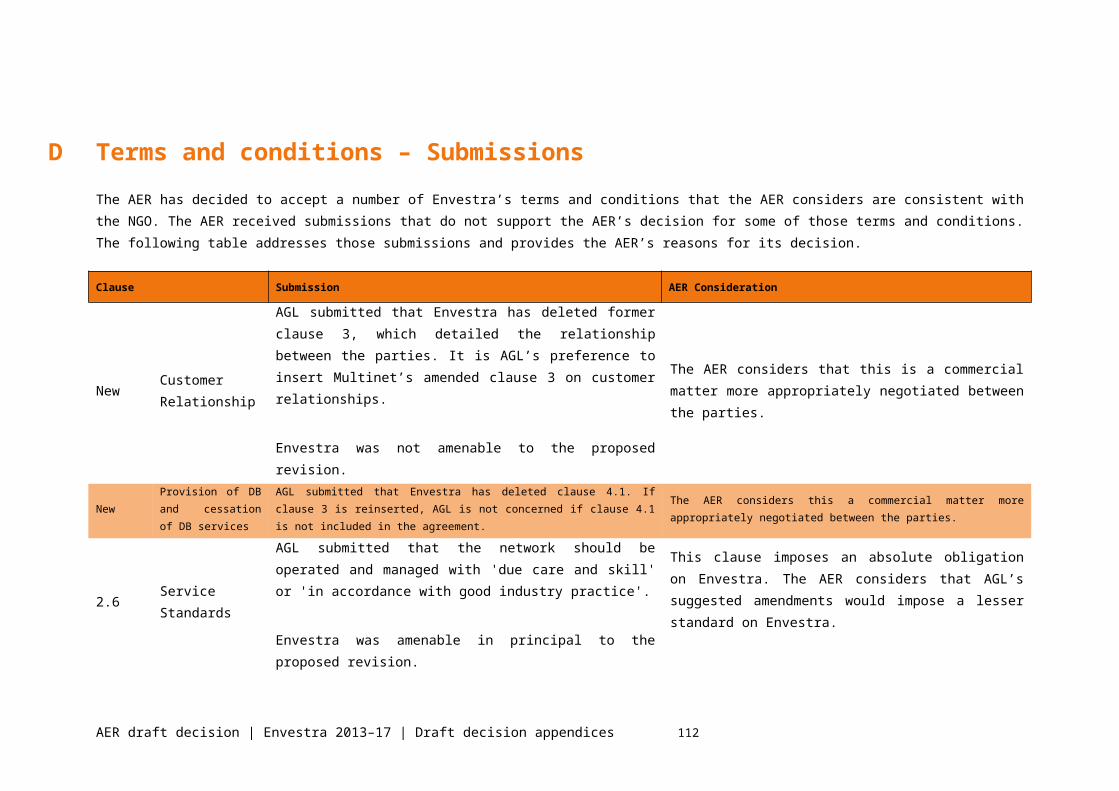
productivity (TFP), partial factor productivity (PFP) and partial productivity indicator (PPI) measures.364 The AER has also calculated PPIs to further assess Envestra's historical performance.
While Envestra's performance appears to have slowed since the mid 2000s the AER considers that, in relation to many different benchmarks, the relative productivity of Envestra Victoria and Envestra Albury is reasonable when compared to other similar providers.
As Envestra's forecast opex for Envestra Victoria and Envestra Albury is based on its actual opex in 2011, based on the benchmarking results the AER considers Envestra's proposed base year opex (inclusive of the NMF) is relatively efficient.
A summary of the benchmarking results for Envestra is provided below.
TFP and PFP benchmarking
Economic Insights' TFP and PFP benchmarking compared the performance of each of the Victorian gas distribution businesses against the New South Wales gas distribution business, Jemena Gas Networks (JGN), Envestra's South Australian network (Envestra SA) and Envestra's Queensland network (Envestra Qld) from 1999 to 2011.
These reports found that Envestra Victoria overall, had experienced a productivity growth 'spurt' since 1999 which had flattened off from 2006 onwards. For instance:
the average annual growth rate of Envestra's TFP index was 2.2 per cent for the last ten years but had slowed to 0.5 per cent for the last five years.365
the average annual growth rate of Envestra's opex partial PFP was 5.3 per cent for the last ten years but had slowed to 0.8 per cent for the last five years.366
Figure E.1 shows the multilateral TFP indexes formulated by Economic Insights. The indexes are presented relative to a value of 1 for Envestra Victoria in 1999 which illustrates its higher productivity performance in 1999 compared to the other businesses in the sample.
Over the period of the study, Envestra's multilateral TFP was the highest of all businesses considered in the sample.
364 Economic Insights, The Total Factor Productivity Performance of Victoria’s Gas Distribution Industry, 26 March 2012; Economic Insights, Benchmarking the Victorian Gas Distribution Businesses’ Operating and Capital Costs Using Partial Productivity Indicators, 26 March 2012.
365 Economic Insights, The Total Factor Productivity Performance of Victoria’s Gas Distribution Industry, 26 March 2012, p. ii.
366 Economic Insights, The Total Factor Productivity Performance of Victoria’s Gas Distribution Industry, 26 March 2012, p. ii.
AER draft decision | Envestra 2013–17 | Draft decision appendices 112

Figure E.1 Australian gas distribution businesses multilateral TFP indexes, 1999–2011
Source: Economic Insights, The Total Factor Productivity Performance of Victoria’s Gas Distribution Industry, 26 March 2012, p. 44.
Figure E.2 shows the multilateral opex PFP indexes formulated by Economic Insights. The indexes are also presented relative to a value of 1 for Envestra Victoria in 1999.
On this measure Envestra Victoria's performance is not as strong compared to SP AusNet and JGN but is higher than Envestra SA and Envestra Qld. From 2005 Envestra Victoria has demonstrated similar performance to Multinet.
Figure E.2 Australian gas distribution businesses multilateral opex PFP indexes, 1999–2011
Source: Economic Insights, The Total Factor Productivity Performance of Victoria’s Gas Distribution Industry, 26 March 2012, p. 45.
AER draft decision | Envestra 2013–17 | Draft decision appendices 113

Economic Insights PPI study
Economic Insights also carried out PPI analysis which included all the Victorian gas distribution businesses in a study assessing the performance of fourteen gas distribution businesses in Australia and New Zealand over 1999–2010 in relation to sixteen operating and performance indicators. The opex PPIs considered by Economic Insights were:
opex per TJ;
opex per customer; and
opex per kilometre; and
opex per unit output;
Economic Insights concluded that all the Victorian gas distribution businesses (including Envestra Victoria and Envestra Albury) had performed strongly compared to the other gas distribution businesses in the sample.367 Envestra Victoria and Envestra Albury's performance against the opex PPIs in 2010 in a sample of fourteen gas distribution businesses is summarised as follows.
Table E.1 Relative performance of Envestra Victoria and Envestra Albury in Economic Insights' PPI study
Partial productivity measure Envestra Victoria rank
Envestra Albury rank
Opex per TJ fourth lowest lowest
Opex per customer fifth lowest second lowest
Opex per km ninth lowest third lowestOpex per unit output
fourth lowest lowest
However, while Envestra Victoria and Envestra Albury have both performed relatively well against the opex PPIs compared to the other gas distribution providers considered in the study—similar to the findings in the TFP study—the AER notes that Envestra's performance against the opex PPIs has also stagnated since 2005.
AER PPI analysis
To further assess the performance of Envestra Victoria and Envestra Albury the AER also undertook PPI analysis of the opex performance of the Victorian distribution service providers over the 2004–10 period. The AER calculated the following PPIs for the Victorian distribution service providers:
opex per customer
opex per TJ
367 Economic Insights, Benchmarking the Victorian Gas Distribution Businesses’ Operating and Capital Costs Using Partial Productivity Indicators, 26 March 2012, pp. 18–22.
AER draft decision | Envestra 2013–17 | Draft decision appendices 114
opex per km
opex per unit output368
The AER's PPIs are similar to the PPIs estimated by Economic Insights over the 2004–10 period. The AER considers that results also show that Envestra's recent performance on opex PPIs is similar to the other Victorian gas distribution businesses but also demonstrates relatively stagnant performance in the period of the sample.
The AER's analysis is presented below in figure 1.3 to figure 1.6.
Figure E.3 Benchmark of Victorian gas distribution service providers by opex per customer (2004–10) ($2011)
Source: AER analysis.
368 Opex per unit output is a comprehensive output measure that combines various output measures (throughput, customer numbers and km of mains) into a multilateral opex index. It provides a more comprehensive efficiency indicator as it takes into account the differences between the network characteristics by balancing the different measures.
AER draft decision | Envestra 2013–17 | Draft decision appendices 115
0
20
40
60
80
100
120
140
Envestra Albury Envestra Victoria SP AusNet Multinet
Opex per customer
2004
2005
2006
2007
2008
2009
2010

Figure E.4 Benchmark of Victorian gas distribution service providers by opex per TJ (2004–10)
Source: AER analysis.
Figure E.5 Benchmark of Victorian gas distribution service providers by opex per km (2004–10)
Source: AER analysis.
AER draft decision | Envestra 2013–17 | Draft decision appendices 116
0
200
400
600
800
1,000
1,200
1,400
Envestra Albury Envestra Victoria SP AusNet Multinet
Opex per TJ
2004
2005
2006
2007
2008
2009
2010

Figure E.6 Benchmark of Victorian gas distribution service providers by opex per unit output (2005–10)
Source: AER analysis.
Conclusion on NMF
Neither the 1999 or 2007 OMAs were entered into as a consequence of a competitive tender process. The AER also has concerns as to whether Envestra had an incentive to agree to non-arms length terms. Therefore, the AER cannot presume the outsourcing arrangement is efficient and prudent.
However, further analysis of the costs incurred via the outsourcing arrangement suggests that, in the present circumstances, the outsourcing arrangement with the APA Group is relatively efficient. This is based on the following observations:
While noting the limitations of the benchmarking study submitted by Envestra about the benchmarking of margins, it suggests the margin is not inconsistent with industry practice.
Benchmarking studies using TFP, PFP and PPI suggests that Envestra's performance, while it has not improved substantially since the mid 2000s, appears reasonable when compared to other gas distribution service providers.
Therefore on the basis of all evidence the AER considers, on balance, there is sufficient evidence to suggest that the contract price (including the NMF) is consistent with the opex criteria.
AER draft decision | Envestra 2013–17 | Draft decision appendices 117
0.000
0.200
0.400
0.600
0.800
1.000
1.200
1.400
Envestra Albury Envestra Victoria SP AusNet Multinet
Opex per Unit Output
2005
2006
2007
2008
2009
2010

E.5.2 Incentive payments
Summary of Envestra’s proposal
Envestra's proposed opex and capex forecasts for Envestra Victoria included incentive payments to the APA Group for achieving reductions in the cost of new connections and controllable opex per GJ. Envestra is required to make incentive payments where the average cost achieved by the APA Group in a financial year is less than the cost in the previous financial year. The payments are equal to:
one third of the reduction in average capital costs for new customer connections, and
one third of the reduction in controllable operating costs per GJ.
If the APA Group does not achieve a reduction in the average capital cost of new customer connections or a reduction in controllable operating costs per GJ, then Envestra would not make incentive payments. In this case the APA Group would only receive the NMF and would be reimbursed for the actual costs it incurs.
Envestra's forecast incentive payments for the 2013–17 access arrangement period are based on the average of the actual incentive payments it made to the APA Group between 2008 and 2011.369
Draft decision on incentive payments
The AER's draft decision is not to include the incentive payments in Envestra's total revenue forecast in its access arrangement proposal for Envestra Victoria. Including forecast incentive payments in the 2013–17 access arrangement period forecast of opex and capex, would not reflect a forecast of total opex or capex that has been arrived at on a reasonable basis or would be the best estimate of opex or capex possible in the circumstances.370
There are two reasons for this conclusion.
First, the AER considers that a forecast of incentive payments based on the average incentive payments Envestra made to the APA Group between 2008 and 2011 is not the best forecasting methodology available. The AER considers a more robust methodology is to forecast incentive payments based on the AER’s forecasts of opex and capex in the 2013–17 access arrangement period. The AER’s best forecast of the controllable opex per GJ and capex for new customer connections over the 2013–17 access arrangement period is that opex or capex incentive payments are not likely to be made.
Second and more fundamentally, Envestra is likely to have sufficient revenue to fund the incentive payments. In the case of opex, the payments will fund themselves. Envestra keeps any savings for five years where it can deliver opex lower than the AER’s forecast. In the case of capex, Envestra retains the benefits of the additional return on capital of any over-forecasting of capex for the balance of the access arrangement period and has an opportunity to recover the cost of 369 Envestra, Victoria Access arrangement information March 30 2012, p. 97.370 NGR, r. 74(2).
AER draft decision | Envestra 2013–17 | Draft decision appendices 118

the capex incentive payments by rolling the capex incentive payments into the capital base at the next reset. The gains to Envestra will be likely to outweigh the cost of any incentive payments agreed to with the APA Group. Again an increase in opex and capex for forecast incentive payments would not be required.
The AER’s draft decision is discussed in further detail below.
Opex incentive payments
Unlike Envestra's payment of the NMF which must be paid to the APA Group each year regardless of performance, incentive payments made to the APA Group are conditional on the actual performance of the APA Group. To forecast whether incentive payments are likely to be paid, the AER considers that a forecast of the incentive payments should be consistent with the forecast performance of the APA Group in the 2013–17 access arrangement period in providing services for Envestra.
Envestra has forecast incentive payments based on the average payments it made to the APA Group between 2008 and 2011. A forecast based on an average of the incentive payments made in the past is unlikely to be consistent with the forecast performance of the APA Group.
Controllable opex incurred by the APA Group makes up the majority of Envestra's historical opex. The AER considers forecast opex incentive payments are best estimated by considering the AER's forecast of Envestra's opex per GJ over the 2013–17 access arrangement period and then forecasting the likely payments that would be made to the APA Group given these forecasts.
Figure E.1 illustrates that the AER forecasts opex per TJ in the 2013–17 access arrangement period to increase. The AER's forecast of opex is based on the AER's draft decision on opex as discussed in attachment 6 and its forecast of Tariff V consumption. The AER’s forecast of opex per TJ is lower than a forecast of opex per TJ based on Envestra’s proposed opex for the 2013–17 access arrangement period.
Envestra only makes incentive payments to the APA Group when actual controllable opex per GJ in a financial year is less than in the previous financial year. As the AER forecasts increasing opex per TJ in each year of the 2013–17 access arrangement period, its best forecast at this time is that no opex incentive payments will be paid to the APA Group in the 2013–17 access arrangement period.
AER draft decision | Envestra 2013–17 | Draft decision appendices 119
Figure E.1 Actual opex per TJ 2008–11, forecast opex per TJ 2012–17
Source: AER analysis.
The AER notes that its draft decision to reject the incentive payments is based on the AER’s best forecast at this time about whether Envestra would be likely to pay incentive payments.
However, if Envestra’s actual performance is better than the AER’s forecast of its performance, and incentive payments need to be paid to the APA Group, Envestra is very likely to have sufficient funding in order to make the incentive payments.
For instance, consider the simple example below that is intended to closely resemble the conditions when Envestra makes opex incentive payments to the APA Group in one year. To simplify the example it is assumed that payments are equivalent to one third of the total reduction in opex from the previous year and the AER's best forecast of opex is equal to opex in the previous year.
Figure E.2 Example illustrating impact of incentive payments on Envestra's total opex
AER draft decision | Envestra 2013–17 | Draft decision appendices 120
Source: AER analysis.
If the APA Group delivers opex at $50m, the difference between regulated opex and actual opex is $6m. As Envestra makes incentive payments equal to one third of the reduction in costs in that year, the incentive payments would be equivalent to $2m.
However, as illustrated in Figure E.2 the total amount Envestra would pay the APA Group ($52m) in this situation would still be less than Envestra's regulatory allowance ($56m). Therefore, Envestra's regulatory allowance, without forecasting an incentive payment, would be sufficient to cover the APA Group's costs, and any incentive payments Envestra is required to make under its contract with the APA Group.
Capex incentive payments
Similarly to the AER's approach to forecasting opex incentive payments, the AER also considers that forecast capex incentive payments would be best estimated at this time by considering the likely payments that would be made given the AER's best forecast of the capital costs of new customer connections.
Envestra would not be forecast to make capex incentive payments in the 2013–17 access arrangement period when this methodology is used.
The AER's has estimated the unit costs of most new customer connections in the 2013–17 access arrangement period using a weighted average of Envestra's actual unit rates in 2008–11 (see attachment 3 and appendix A).371 When this methodology is used, unit rates are forecast to be stable over the 2013–17 access arrangement period. As capex incentive payments to the APA Group are only made when the average capital costs are lower than average capital costs in the previous financial year, the AER considers that, given a forecast of stable unit costs, the best estimate possible in the circumstances is to not assume any capex incentive payments will be made in the 2013–17 access arrangement period.
The AER notes that if Envestra is able to deliver capex at less than the AER’s forecast, Envestra earns a return on the capex that was not forecast accurately prior to the start of the 2013–17 access arrangement period. Envestra will also receive revenue from any capex incentive payments made in the 2013–17 access arrangement period included in the future capital base. These sources of revenue are likely to be sufficient to fund any capex incentive payments Envestra is required to make in the 2013–17 access arrangement period.
E.6 Proposed amendments
E.6.1Envestra Victoria
The AER requires Envestra Victoria make the following revisions to its access arrangement proposal consistent with the NGR and NGL:
371 A weighted average of 2008–10 has been used for connections for multi-user inlets.
AER draft decision | Envestra 2013–17 | Draft decision appendices 121
Revision E.1: Amend the proposed access arrangement and access arrangement information to the extent necessary to remove forecast incentive payments.
AER draft decision | Envestra 2013–17 | Draft decision appendices 122


![The Intercalibration Process [Draft] - CIRCABC - … Research... · Web viewGenerally the higher taxonomic plants (angiosperms) react within years to changes in degradation whereas](https://static.fdocuments.in/doc/165x107/5ac70abd7f8b9a12608e8f1b/the-intercalibration-process-draft-circabc-researchweb-viewgenerally.jpg)

