DraftEIS-List of Tables - Bureau of Land Management 4.2.13.1 Cost Recovery under Current Service...
28
December 2003 T-1 Draft EIS - List of Tables
Transcript of DraftEIS-List of Tables - Bureau of Land Management 4.2.13.1 Cost Recovery under Current Service...

December 2003T-1
Draft EIS - List of Tables


December 2003T-3
Table of Contents
Table 3.4.3.1 Number of Rangeland Improvement Projects By State..................................... T-5 Table 3.4.5.1 Estimated Authorized Use and Non Use ........................................................... T-5 Table 3.5.1 Vegetation classification noting the division, order, and subclass of vegetation . T-6Table 3.5.2 Plant communities depicted within each of the 14 vegetation types Vegetation State ........................................................................................................................ T-7 Table 3.5.2.1 Comparison of Condition of Lotic Riparian Habitat on BLM Lands, 1998 vs. 2001........................................................................................................................................... T-9 Table 3.5.2.2 Comparison of Lentic Riparian–Wetland Habitat on BLM Lands, 1998 vs. 2001........................................................................................................................................... T-9Table 3.10.2.1 U.S. Fish and Wildlife Service Birds of Conservation Concern 2002 ...........T-10Table 3.10.2.2 Species with increasing and decreasing trends during the breeding season on the San Pedro Riparian National Conservation Area, Arizona, before and after removal of cattle in late 1987, sorted by significance level of the trend................................................... T-13Table 3.15.2.1 Bureau of Land Management Cultural Resource Inventory Data ................. T-15Table 3.15.2.2 Bureau of Land Management Significant Cultural Resource Areas.............. T-15Table 3.16.1 Permits, leases, and authorized use, 2002......................................................... T-15Arizona.................................................................................................................................... T-15Table 3.16.2 Number of permits or leases and active or nonuse AUMs since 1996 ............. T-16Table 3.16.3 Percent Dependency of Counties in Eleven Western States on Federal ForageT-16Table 3.16.4. Average Dependency Level for Cattle and Sheep by State for the 11 Western States (includes both BLM and Forest Service rangelands)Arizona.................................................................................................................................... T-17Table 3.17.1 State and regional population change in the West, 1990 to 2000...................... T-18Table 3.17.2 Rural and urban populations in the West, 1990 and 2000 ................................. T-19Table 3.17.3 Metropolitan, nonmetropolitan, and public land county population change in Western States, 1990 to 2000.................................................................................................. T-20Table 3.17.4 Ranch income by source (Gentner and Tanaka 2000)....................................... T-21Table 3.17.5 Goals and objectives for ranching (Gentner and Tanaka 2002) ........................ T-21Table 3.17.6 Months of labor required to run the ranch (Gentner and Tanaka 2000) ............ T-22Table 3.17.7 Example of social organization process in ranching communities.................... T-22Table 3.17.8 Recent population change in Census Subdivisions, Lemhi County, Idaho ....... T-23Table 3.17.9 Attendance, Graduates and Local Taxes per ADA, 1995 to 2002..................... T-23Table 4.2.13.1 Cost Recovery under Current Service Charges .............................................. T-24 Table 4.3.13.1 Cost Recovery under Proposed Service Charges........................................... T-24 Table 4.3.14.1 Social Effects of the Proposed Action ........................................................... T-25Table 4.4.14.1 Social Effects of the Modified Action Alternative Three.............................. T-27

Proposed Revisions to Grazing Regulations Draft EIS Bureau of Land Management List of Tables
T-5 December 2003
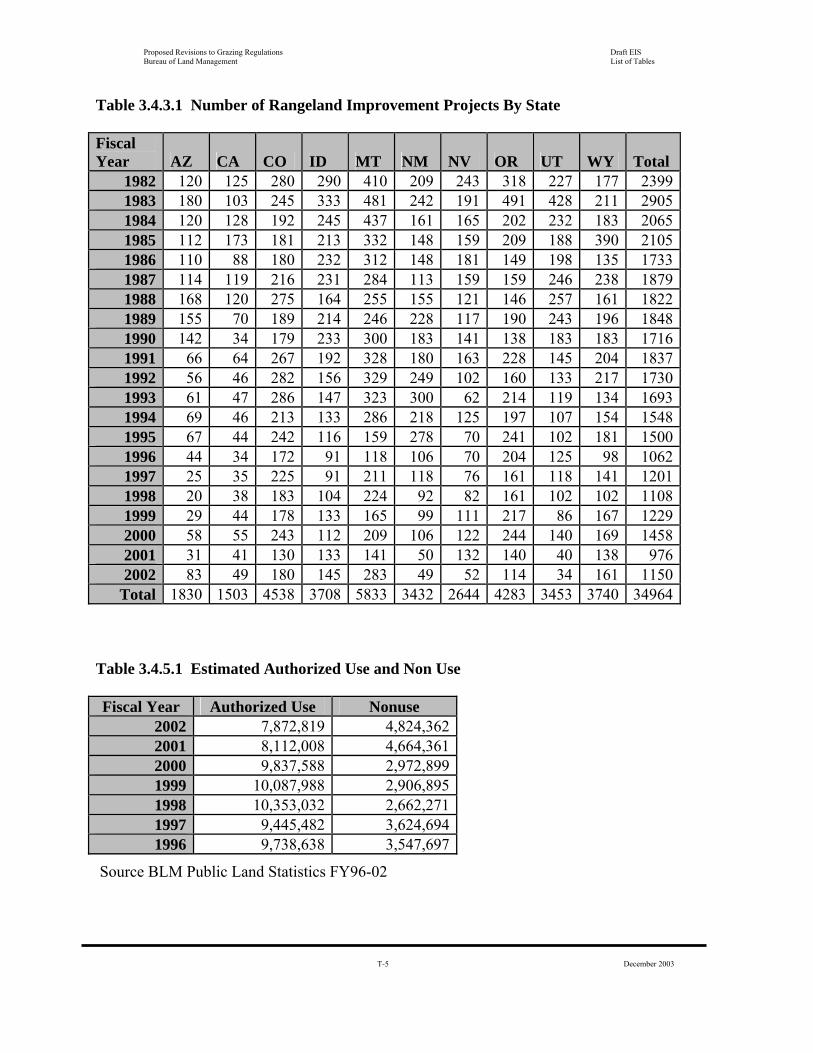
Table 3.4.3.1 Number of Rangeland Improvement Projects By State Fiscal Year AZ CA CO ID MT NM NV OR UT WY Total
1982 120 125 280 290 410 209 243 318 227 177 23991983 180 103 245 333 481 242 191 491 428 211 29051984 120 128 192 245 437 161 165 202 232 183 20651985 112 173 181 213 332 148 159 209 188 390 21051986 110 88 180 232 312 148 181 149 198 135 17331987 114 119 216 231 284 113 159 159 246 238 18791988 168 120 275 164 255 155 121 146 257 161 18221989 155 70 189 214 246 228 117 190 243 196 18481990 142 34 179 233 300 183 141 138 183 183 17161991 66 64 267 192 328 180 163 228 145 204 18371992 56 46 282 156 329 249 102 160 133 217 17301993 61 47 286 147 323 300 62 214 119 134 16931994 69 46 213 133 286 218 125 197 107 154 15481995 67 44 242 116 159 278 70 241 102 181 15001996 44 34 172 91 118 106 70 204 125 98 10621997 25 35 225 91 211 118 76 161 118 141 12011998 20 38 183 104 224 92 82 161 102 102 11081999 29 44 178 133 165 99 111 217 86 167 12292000 58 55 243 112 209 106 122 244 140 169 14582001 31 41 130 133 141 50 132 140 40 138 9762002 83 49 180 145 283 49 52 114 34 161 1150
Total 1830 1503 4538 3708 5833 3432 2644 4283 3453 3740 34964
Table 3.4.5.1 Estimated Authorized Use and Non Use
Source BLM Public Land Statistics FY96-02
Fiscal Year Authorized Use Nonuse 2002 7,872,819 4,824,3622001 8,112,008 4,664,3612000 9,837,588 2,972,8991999 10,087,988 2,906,8951998 10,353,032 2,662,2711997 9,445,482 3,624,6941996 9,738,638 3,547,697

Proposed Revisions to Grazing Regulations Draft EIS Bureau of Land Management List of Tables
T-6 December 2003
Table 3.5.1 Vegetation classification noting the division, order, and subclass of vegetation. Division Order Class Subclass
Evergreen Forest Deciduous Forest
Closed Canopy
Mixed Evergreen–Deciduous Forest Evergreen Woodland Deciduous Woodland
Tree Dominated
Open Tree Canopy
Mixed Evergreen–Deciduous Woodland Evergreen Shrubland Deciduous Shrubland Evergreen Dwarf–Shrubland
Shrub Dominated Shrubland
Deciduous Dwarf–Shrubland Perennial Graminoid Annual Graminoid or Forb
Vegetated
Herb Dominated Herbaceous Vegetation
Perennial Forb Not included in National Vegetation Classification Standard Riparian–Wetland

Proposed Revisions to Grazing Regulations Draft EIS Bureau of Land Management List of Tables
T-7 December 2003
Table 3.5.2 Plant communities depicted within each of the 14 vegetation types.
Vegetation State Plant Communities within Vegetative State Evergreen Forest Subalpine Spruce Fir–Mountain Hemlock, Red Fir, Mixed
Sugar Pine, Ponderosa Pine, Ponderosa Pine/Shrub, Ponderosa Pine/Oak–Juniper–Pinyon, Jeffery Pine, Monterey Pine, Bishop Pine, Lodgepole Pine–Douglas Fir, White Fir–Douglas Fir, White Fir–Douglas Fir/Shrub, Douglas Fir–White Fir–Blue Spruce, Coastal Lodgepole Pine, California Bay, Eucalyptus, Inland Douglas Fir, Inland Douglas Fir–Western Red Cedar, Inland Western Red Cedar–Western Hemlock, Douglas Fir–Tanoak–Pacific Madrone, Douglas Fir–Sugar Pine–Ponderosa Pine, Douglas Fir–Ponderosa Pine–Incense Cedar, Pacific Silver Fir, Sitka Spruce, Ponderosa Pine–Lodgepole Pine, Colorado Mixed Forest, Western Larch–Grand Fir, Western White Pine, Grand Fir–Douglas Fir, Western Larch–Douglas Fir, Westside Western Hemlock–Western Red Cedar, Westside Douglas Fir–Western Hemlock, Westside Douglas Fir, Mountain Shrub/Clearcut, Costal Redwood
Deciduous Forests Aspen, Aspen–Conifer, Bur Oak, Cypress, Ash, Maple, Russian Olive
Mixed Evergreen–Deciduous Forest
Combinations of the Evergreen and Deciduous Forest Types
Evergreen Woodland Subalpine Fir, Knobcone Pine, Limber Pine, Manrean Pine, California Foothill Pine, Juniper, Pinyon Pine, Pinyon–Juniper, Chihuahua–Apache Pine, Madrean Pinyon Juniper
Deciduous Forest Oregon White Oak, California Oak, Mixed Oak, Mesquite Mixed Evergreen–Deciduous Woodland
Oregon White Oak–Conifer, California Oak–Conifer
Evergreen Shrubland Southern Rockies Oak–Mahogany Shrub, Southern Rockies Oak–Manzanita Scrub, Bitterbrush, Interior Chaparral, California Chaparral, Mountain Mohogany, Sagebrush, Sagebrush/Perennial Grass, Rabbitbrush, Salt Desert Shrub, Blackbrush, Creosote–Bursage, Mojave Mixed Scrub, Great Basin Mormon Tea, Joshua Tree, Great Basin Saltbush Scrub, Mojave Creosotebush–Yucca, Shadscale–Mixed Grass–Mixed Scrub, Paloverde–Mixed Cacti–Scrub, Crucifixon Thorn Chihuahuan Creosotebush Scrub, Costal Dune Scrub, Costal Sage, Costal Scrub, Sandsage Shrubland

Proposed Revisions to Grazing Regulations Draft EIS Bureau of Land Management List of Tables
T-8 December 2003
Vegetation State Plant Communities within Vegetative State Deciduous Shrubland Mesic Upland Shrub/Hardwoods, Warm Mesic Shrub,
Greasewood, Hopsage, Catclaw Acacia, Smoketree, Scotch Broom
Evergreen Dwarf Shrubland No examples on BLM Lands Deciduous Dwarf Shrubland Alaska and not within the affected environment of this EIS Perennial Graminoid Introduced Wheatgrass (e.g. Crested Wheatgrass,
Intermediate Wheatgrass), Meadow, Forest Meadow, Alpine/Subalpine Meadows, Great Basin Grassland California Native Perennial Grassland, Foothills Grassland, Shortgrass Prairie Midgrass Prairie, Tallgrass Prairie, Desert Grassland, Semidesert Tobosa Grass–Scrub, Semidesert Mixed Grass, Chihuahuan Grassland
Annual Graminoid or Forb California Disturbed Grassland (the annual plant dominated Central Valley portion of California), Cheatgrass/Mustard, Medusahead, Red Brome, Japanese Brome Ventenata, Diffused Knapweed (annual or perennial), Yellow Starthistle
Perennial Forb Spotted Knapweed, Russian Knapweed, Squarrose Knapweed, Rush Skeletonweed, Canada Thistle, Scotch Thistle (biennial), Whitetop (Cardaria spp.), Leafy Spurge, Mediterranean Sage, Purple Loosestrife, Dalmatian Toadflax
Riparian–Wetland Wet Graminoid, Wet Forb
Proposed Revisions to Grazing Regulations Draft EIS Bureau of Land Management List of Tables
T-9 December 2003
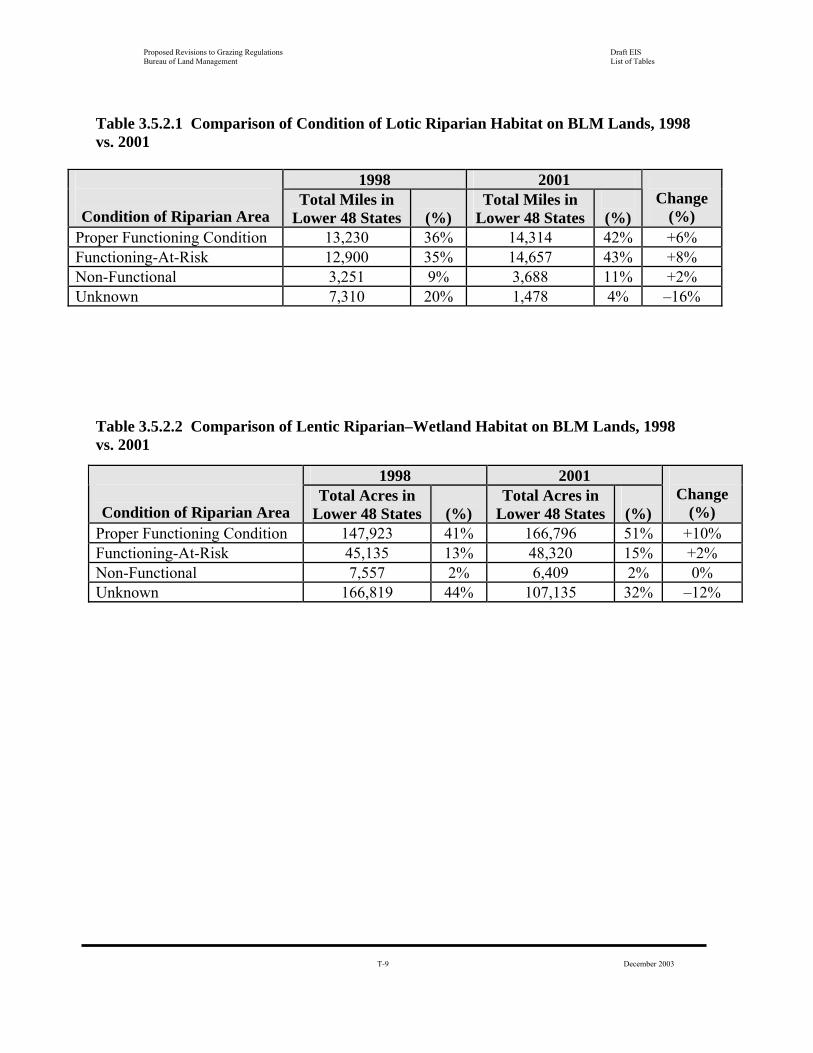
Table 3.5.2.1 Comparison of Condition of Lotic Riparian Habitat on BLM Lands, 1998 vs. 2001
1998 2001
Condition of Riparian Area
Total Miles in Lower 48 States
(%)
Total Miles in Lower 48 States
(%)
Change
(%) Proper Functioning Condition 13,230 36% 14,314 42% +6% Functioning-At-Risk 12,900 35% 14,657 43% +8% Non-Functional 3,251 9% 3,688 11% +2% Unknown 7,310 20% 1,478 4% –16%
Table 3.5.2.2 Comparison of Lentic Riparian–Wetland Habitat on BLM Lands, 1998 vs. 2001
1998 2001
Condition of Riparian Area Total Acres in
Lower 48 States
(%) Total Acres in
Lower 48 States
(%)
Change
(%) Proper Functioning Condition 147,923 41% 166,796 51% +10% Functioning-At-Risk 45,135 13% 48,320 15% +2% Non-Functional 7,557 2% 6,409 2% 0% Unknown 166,819 44% 107,135 32% –12%
Proposed Revisions to Grazing Regulations Draft EIS Bureau of Land Management List of Tables
T-10 December 2003
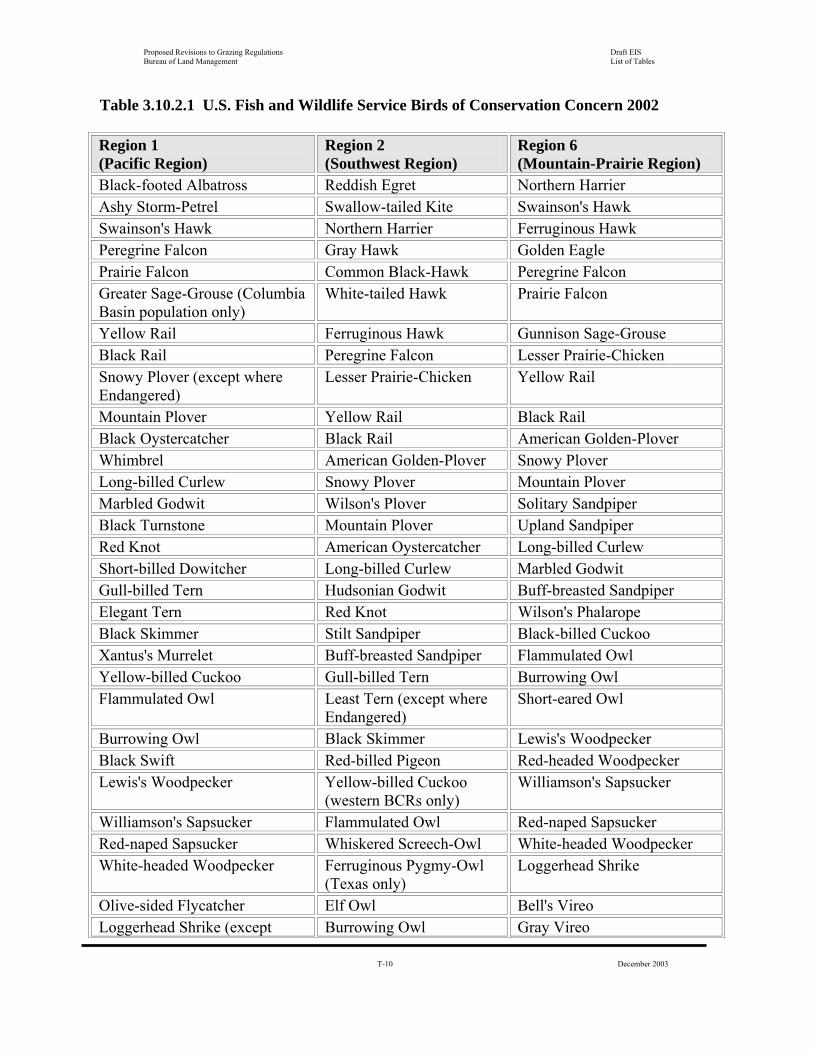
Table 3.10.2.1 U.S. Fish and Wildlife Service Birds of Conservation Concern 2002 Region 1 (Pacific Region)
Region 2 (Southwest Region)
Region 6 (Mountain-Prairie Region)
Black-footed Albatross Reddish Egret Northern Harrier Ashy Storm-Petrel Swallow-tailed Kite Swainson's Hawk Swainson's Hawk Northern Harrier Ferruginous Hawk Peregrine Falcon Gray Hawk Golden Eagle Prairie Falcon Common Black-Hawk Peregrine Falcon Greater Sage-Grouse (Columbia Basin population only)
White-tailed Hawk Prairie Falcon
Yellow Rail Ferruginous Hawk Gunnison Sage-Grouse Black Rail Peregrine Falcon Lesser Prairie-Chicken Snowy Plover (except where Endangered)
Lesser Prairie-Chicken Yellow Rail
Mountain Plover Yellow Rail Black Rail Black Oystercatcher Black Rail American Golden-Plover Whimbrel American Golden-Plover Snowy Plover Long-billed Curlew Snowy Plover Mountain Plover Marbled Godwit Wilson's Plover Solitary Sandpiper Black Turnstone Mountain Plover Upland Sandpiper Red Knot American Oystercatcher Long-billed Curlew Short-billed Dowitcher Long-billed Curlew Marbled Godwit Gull-billed Tern Hudsonian Godwit Buff-breasted Sandpiper Elegant Tern Red Knot Wilson's Phalarope Black Skimmer Stilt Sandpiper Black-billed Cuckoo Xantus's Murrelet Buff-breasted Sandpiper Flammulated Owl Yellow-billed Cuckoo Gull-billed Tern Burrowing Owl Flammulated Owl Least Tern (except where
Endangered) Short-eared Owl
Burrowing Owl Black Skimmer Lewis's Woodpecker Black Swift Red-billed Pigeon Red-headed Woodpecker Lewis's Woodpecker Yellow-billed Cuckoo
(western BCRs only) Williamson's Sapsucker
Williamson's Sapsucker Flammulated Owl Red-naped Sapsucker Red-naped Sapsucker Whiskered Screech-Owl White-headed Woodpecker White-headed Woodpecker Ferruginous Pygmy-Owl
(Texas only) Loggerhead Shrike
Olive-sided Flycatcher Elf Owl Bell's Vireo Loggerhead Shrike (except Burrowing Owl Gray Vireo

Proposed Revisions to Grazing Regulations Draft EIS Bureau of Land Management List of Tables
T-11 December 2003
Region 1 (Pacific Region)
Region 2 (Southwest Region)
Region 6 (Mountain-Prairie Region)
where Endangered) Gray Vireo Broad-billed
Hummingbird Bewick's Wren
Elepaio (except where Endangered)
Buff-bellied Hummingbird Sprague's Pipit
Horned Lark (strigata ssp. only) Lucifer Hummingbird Virginia's Warbler Crissal Thrasher Elegant Trogon Cassin's Sparrow Le Conte's Thrasher Lewis's Woodpecker Brewer's Sparrow Brewer's Sparrow Red-headed Woodpecker Grasshopper Sparrow Tricolored Blackbird Arizona Woodpecker Baird's Sparrow Lawrence's Goldfinch Gilded Flicker Henslow's Sparrow Northern Beardless-
Tyrannulet Le Conte's Sparrow
Greater Pewee Nelson's Sharp-tailed Sparrow Buff-breasted Flycatcher McCown's Longspur Scissor-tailed Flycatcher Chestnut-collared Longspur Rose-throated Becard Dickcissel Loggerhead Shrike Bobolink Bell's Vireo Gray Vireo Brown-headed Nuthatch Sedge Wren Bendire's Thrasher Crissal Thrasher Le Conte's Thrasher Sprague's Pipit Olive Warbler Colima Warbler Tropical Parula Black-throated Gray
Warbler
Grace's Warbler Prairie Warbler Cerulean Warbler

Proposed Revisions to Grazing Regulations Draft EIS Bureau of Land Management List of Tables
T-12 December 2003
Region 1 (Pacific Region)
Region 2 (Southwest Region)
Region 6 (Mountain-Prairie Region)
Prothonotary Warbler Worm-eating Warbler Swainson's Warbler Louisiana Waterthrush Kentucky Warbler Red-faced Warbler Rufous-winged Sparrow Cassin's Sparrow Bachman's Sparrow Botteri's Sparrow Black-chinned Sparrow Sage Sparrow Lark Bunting Baird's Sparrow Henslow's Sparrow Le Conte's Sparrow Nelson's Sharp-tailed
Sparrow
Seaside Sparrow Harris's Sparrow McCown's Longspur Smith's Longspur Chestnut-collared
Longspur
Varied Bunting Painted Bunting Hooded Oriole Altamira Oriole Audubon's Oriole

Proposed Revisions to Grazing Regulations Draft EIS Bureau of Land Management List of Tables
T-13 December 2003
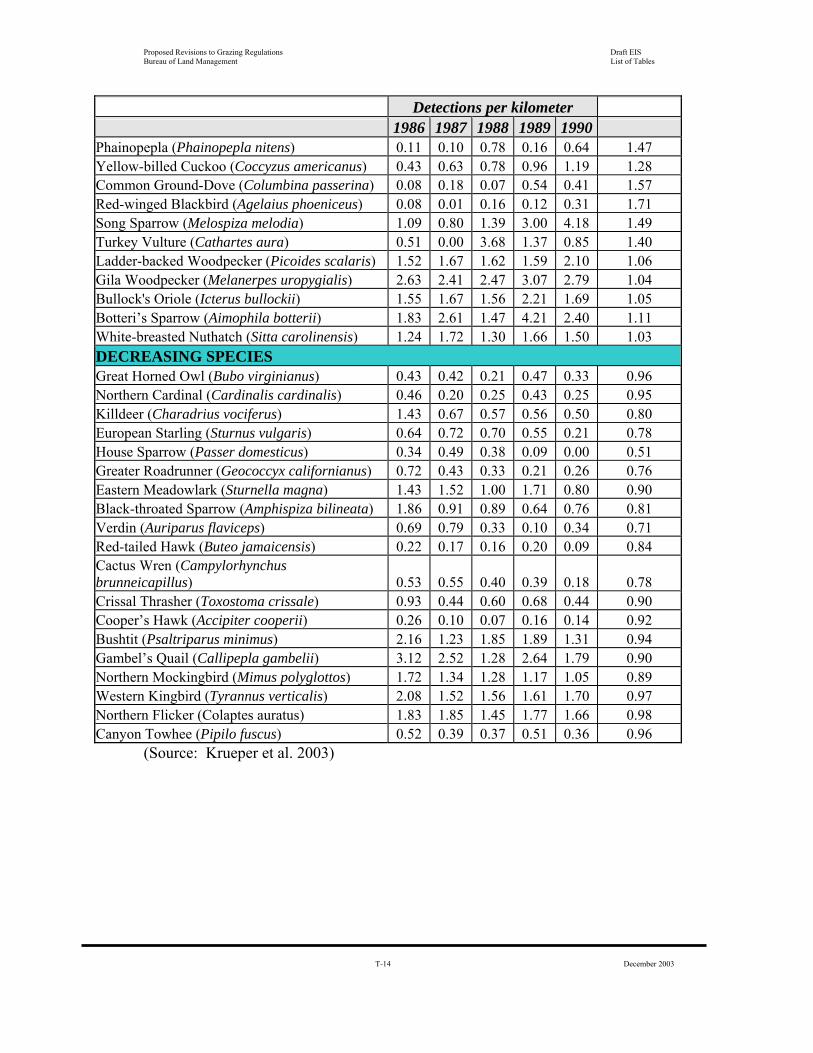
Table 3.10.2.2 Species with increasing and decreasing trends during the breeding season on the San Pedro Riparian National Conservation Area, Arizona, before and after removal of cattle in late 1987, sorted by significance level of the trend.
Detections per kilometer Trend and species 1986 1987 1988 1989 1990
Annual changea
INCREASING SPECIES Cassin’s Sparrow (Aimophila cassinii) 0.06 0.92 5.19 5.15 2.15 2.42 Dusky-capped Flycatcher (Myiarchus tuberculifer) 0.03 0.07 0.09 0.32 0.31 1.93 N. Beardless-Tyrannulet (Camptostoma imberbe) 0.06 0.04 0.17 0.25 0.46 1.82 Yellow Warbler (Dendroica petechia) 3.21 6.05 8.77 17.68 16.71 1.55 Western Wood-Pewee (Contopus sordidulus) 1.51 1.62 2.18 3.23 4.17 1.31 Summer Tanager (Piranga rubra) 3.73 5.91 5.81 10.61 10.13 1.29 Abert’s Towhee (Pipilo aberti) 6.14 7.28 8.63 13.11 15.43 1.28 Great Blue Heron (Ardea herodias) 0.24 0.65 0.42 0.43 0.97 1.27 Mallard (Anas platyrhynchos) 0.80 0.61 1.07 0.92 1.81 1.23 Blue Grosbeak (Guiraca caerulea) 2.92 5.20 4.46 6.19 7.22 1.22 Ash-throated Flycatcher (Myiarchus cinerascens) 1.81 2.36 2.41 3.66 3.74 1.21 Cassin's Kingbird (Tyrannus vociferans) 3.46 3.93 3.06 6.07 5.54 1.15 Common Yellowthroat (Geothlypis trichas) 1.27 3.24 5.36 12.95 14.71 1.87 Brown-headed Cowbird (Molothrus ater) 3.47 5.03 5.58 6.21 8.11 1.21 Vermilion Flycatcher (Pyrocephalus rubinus) 2.35 3.22 3.40 5.40 7.30 1.32 White-winged Dove (Zenaida asiatica) 1.93 2.69 3.37 7.54 10.78 1.56 Bewick’s Wren (Thryomanes bewickii) 10.87 10.85 9.82 14.34 14.97 1.10 Yellow-breasted Chat (Icteria virens) 5.35 6.60 7.94 17.17 20.58 1.44 Lesser Goldfinch (Carduelis psaltria) 5.08 5.17 3.73 7.00 6.13 1.07 Gray Hawk (Asturina nitida) 0.57 0.92 0.54 0.84 1.15 1.14 Hooded Oriole (Icterus cucullatus) 0.00 0.17 0.21 0.20 0.41 1.86 Brown-crested Flycatcher (Myiarchus tyrannulus) 2.07 2.32 2.43 3.34 3.54 1.16 Mourning Dove (Zenaida macroura) 1.05 1.41 1.80 5.30 4.09 1.50 Common Raven (Corvus corax) 0.02 0.01 0.17 0.13 0.24 2.18 House Finch (Carpodacus mexicanus) 2.17 1.39 1.71 2.80 3.12 1.15 N. Rough-winged Swallow (Stelgidopteryx serripennis) 0.08 0.38 0.35 0.64 0.53 1.55 Black Phoebe (Sayornis nigricans) 0.27 0.15 0.10 0.51 0.92 1.44 Black-chinned Hummingbird (Archilochus alexandri) 0.57 0.57 0.50 0.71 1.63 1.26 Indigo Bunting (Passerina cyanea) 0.02 0.02 0.27 0.54 0.58 2.73 Lucy’s Warbler (Vermivora luciae) 13.80 14.68 13.76 16.03 20.81 1.10 Bell’s Vireo (Vireo bellii) 0.91 1.50 1.22 1.89 2.69 1.27
Proposed Revisions to Grazing Regulations Draft EIS Bureau of Land Management List of Tables
T-14 December 2003
Detections per kilometer 1986 1987 1988 1989 1990 Phainopepla (Phainopepla nitens) 0.11 0.10 0.78 0.16 0.64 1.47 Yellow-billed Cuckoo (Coccyzus americanus) 0.43 0.63 0.78 0.96 1.19 1.28 Common Ground-Dove (Columbina passerina) 0.08 0.18 0.07 0.54 0.41 1.57 Red-winged Blackbird (Agelaius phoeniceus) 0.08 0.01 0.16 0.12 0.31 1.71 Song Sparrow (Melospiza melodia) 1.09 0.80 1.39 3.00 4.18 1.49 Turkey Vulture (Cathartes aura) 0.51 0.00 3.68 1.37 0.85 1.40 Ladder-backed Woodpecker (Picoides scalaris) 1.52 1.67 1.62 1.59 2.10 1.06 Gila Woodpecker (Melanerpes uropygialis) 2.63 2.41 2.47 3.07 2.79 1.04 Bullock's Oriole (Icterus bullockii) 1.55 1.67 1.56 2.21 1.69 1.05 Botteri’s Sparrow (Aimophila botterii) 1.83 2.61 1.47 4.21 2.40 1.11 White-breasted Nuthatch (Sitta carolinensis) 1.24 1.72 1.30 1.66 1.50 1.03 DECREASING SPECIES Great Horned Owl (Bubo virginianus) 0.43 0.42 0.21 0.47 0.33 0.96 Northern Cardinal (Cardinalis cardinalis) 0.46 0.20 0.25 0.43 0.25 0.95 Killdeer (Charadrius vociferus) 1.43 0.67 0.57 0.56 0.50 0.80 European Starling (Sturnus vulgaris) 0.64 0.72 0.70 0.55 0.21 0.78 House Sparrow (Passer domesticus) 0.34 0.49 0.38 0.09 0.00 0.51 Greater Roadrunner (Geococcyx californianus) 0.72 0.43 0.33 0.21 0.26 0.76 Eastern Meadowlark (Sturnella magna) 1.43 1.52 1.00 1.71 0.80 0.90 Black-throated Sparrow (Amphispiza bilineata) 1.86 0.91 0.89 0.64 0.76 0.81 Verdin (Auriparus flaviceps) 0.69 0.79 0.33 0.10 0.34 0.71 Red-tailed Hawk (Buteo jamaicensis) 0.22 0.17 0.16 0.20 0.09 0.84 Cactus Wren (Campylorhynchus brunneicapillus) 0.53 0.55 0.40 0.39 0.18 0.78 Crissal Thrasher (Toxostoma crissale) 0.93 0.44 0.60 0.68 0.44 0.90 Cooper’s Hawk (Accipiter cooperii) 0.26 0.10 0.07 0.16 0.14 0.92 Bushtit (Psaltriparus minimus) 2.16 1.23 1.85 1.89 1.31 0.94 Gambel’s Quail (Callipepla gambelii) 3.12 2.52 1.28 2.64 1.79 0.90 Northern Mockingbird (Mimus polyglottos) 1.72 1.34 1.28 1.17 1.05 0.89 Western Kingbird (Tyrannus verticalis) 2.08 1.52 1.56 1.61 1.70 0.97 Northern Flicker (Colaptes auratus) 1.83 1.85 1.45 1.77 1.66 0.98 Canyon Towhee (Pipilo fuscus) 0.52 0.39 0.37 0.51 0.36 0.96
(Source: Krueper et al. 2003)
Proposed Revisions to Grazing Regulations Draft EIS Bureau of Land Management List of Tables
T-15 December 2003
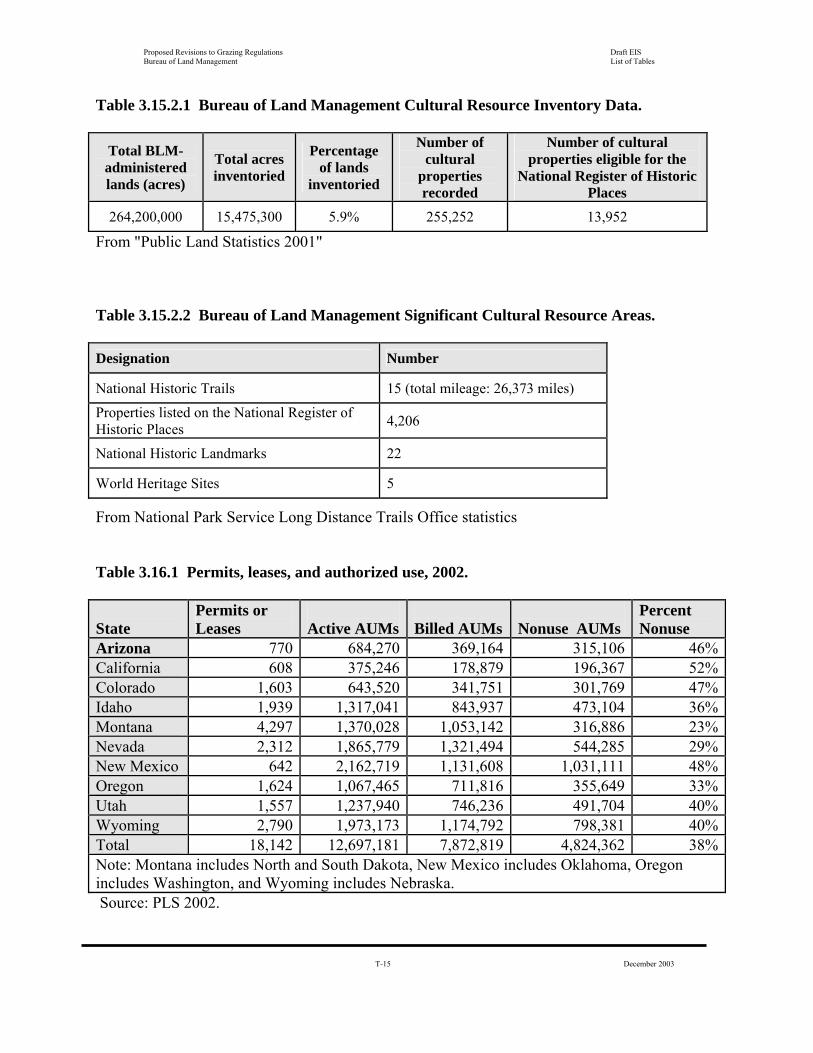
Table 3.15.2.1 Bureau of Land Management Cultural Resource Inventory Data.
Total BLM- administered lands (acres)
Total acres inventoried
Percentage of lands
inventoried
Number of cultural
properties recorded
Number of cultural properties eligible for the
National Register of Historic Places
264,200,000 15,475,300 5.9% 255,252 13,952
From "Public Land Statistics 2001" Table 3.15.2.2 Bureau of Land Management Significant Cultural Resource Areas.
From National Park Service Long Distance Trails Office statistics Table 3.16.1 Permits, leases, and authorized use, 2002. State
Permits or Leases
Active AUMs
Billed AUMs
Nonuse AUMs
Percent Nonuse
Arizona 770 684,270 369,164 315,106 46%California 608 375,246 178,879 196,367 52%Colorado 1,603 643,520 341,751 301,769 47%Idaho 1,939 1,317,041 843,937 473,104 36%Montana 4,297 1,370,028 1,053,142 316,886 23%Nevada 2,312 1,865,779 1,321,494 544,285 29%New Mexico 642 2,162,719 1,131,608 1,031,111 48%Oregon 1,624 1,067,465 711,816 355,649 33%Utah 1,557 1,237,940 746,236 491,704 40%Wyoming 2,790 1,973,173 1,174,792 798,381 40%Total 18,142 12,697,181 7,872,819 4,824,362 38%Note: Montana includes North and South Dakota, New Mexico includes Oklahoma, Oregon includes Washington, and Wyoming includes Nebraska. Source: PLS 2002.
Designation Number
National Historic Trails 15 (total mileage: 26,373 miles)
Properties listed on the National Register of Historic Places
4,206
National Historic Landmarks 22
World Heritage Sites 5
Proposed Revisions to Grazing Regulations Draft EIS Bureau of Land Management List of Tables
T-16 December 2003
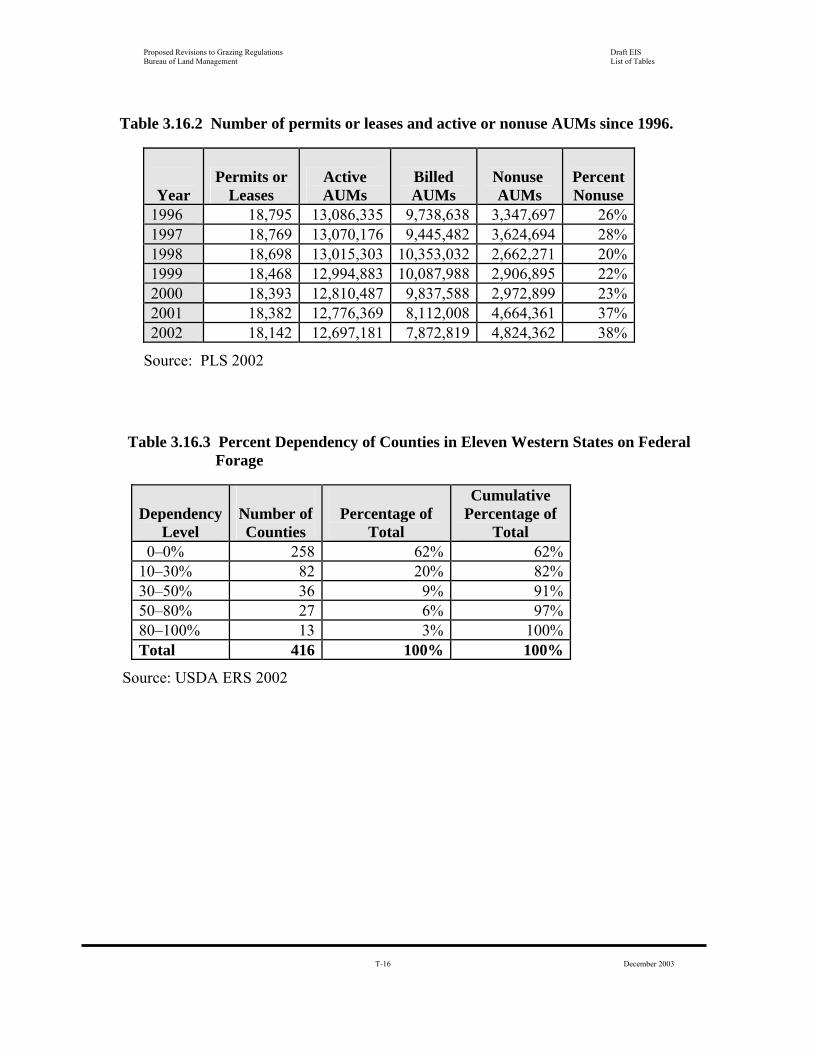
Table 3.16.2 Number of permits or leases and active or nonuse AUMs since 1996.
Year
Permits or Leases
Active AUMs
Billed AUMs
Nonuse AUMs
Percent Nonuse
1996 18,795 13,086,335 9,738,638 3,347,697 26%
1997 18,769 13,070,176 9,445,482 3,624,694 28%
1998 18,698 13,015,303 10,353,032 2,662,271 20%
1999 18,468 12,994,883 10,087,988 2,906,895 22%
2000 18,393 12,810,487 9,837,588 2,972,899 23%
2001 18,382 12,776,369 8,112,008 4,664,361 37%
2002 18,142 12,697,181 7,872,819 4,824,362 38%
Source: PLS 2002
Table 3.16.3 Percent Dependency of Counties in Eleven Western States on Federal
Forage
Dependency
Level
Number of Counties
Percentage of
Total
Cumulative Percentage of
Total 0–0% 258 62% 62%10–30% 82 20% 82%30–50% 36 9% 91%50–80% 27 6% 97%80–100% 13 3% 100%Total 416 100% 100%
Source: USDA ERS 2002
Proposed Revisions to Grazing Regulations Draft EIS Bureau of Land Management List of Tables
T-17 December 2003
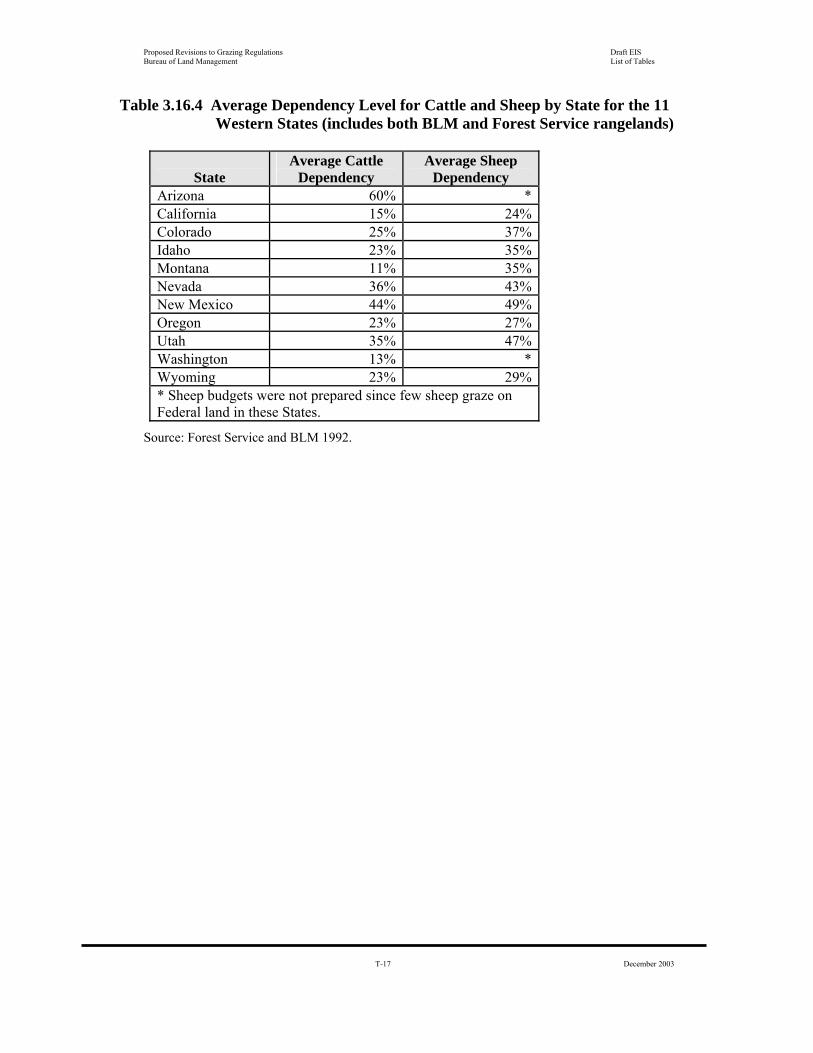
Table 3.16.4 Average Dependency Level for Cattle and Sheep by State for the 11 Western States (includes both BLM and Forest Service rangelands)
State Average Cattle
Dependency Average Sheep
Dependency Arizona 60% *California 15% 24%Colorado 25% 37%Idaho 23% 35%Montana 11% 35%Nevada 36% 43%New Mexico 44% 49%Oregon 23% 27%Utah 35% 47%Washington 13% *Wyoming 23% 29%* Sheep budgets were not prepared since few sheep graze on Federal land in these States.
Source: Forest Service and BLM 1992.

Proposed Revisions to Grazing Regulations Draft EIS Bureau of Land Management List of Tables
T-18 December 2003
Table 3.17.1 State and regional population change in the West, 1990 to 2000
State
Population 1990
Population 2000
Change 1990 to
2000 (%) Nevada 1,201,833 1,998,257 66.3 Arizona 3,665,228 5,130,632 40.0 Colorado 3,294,394 4,301,261 30.6 Utah 1,722,850 2,233,169 29.6 Idaho 1,006,749 1,293,953 28.5 Washington 4,866,692 5,894,121 21.1 Oregon 2,842,321 3,421,399 20.4 New Mexico 1,515,069 1,819,046 20.1 California 29,760,021 33,871,648 13.8 Montana 799,065 902,195 12.9 Wyoming 453,588 493,782 8.9
Regions and Nation
Population 1990
Population 2000
Change 1990 to
2000 (%) West 52,786,082 63,197,932 19.7 South 85,445,930 100,236,820 17.3 Midwest 59,668,632 64,392,776 7.9 Northeast 50,809,229 53,594,378 5.5 Nation 248,709,873 281,421,906 13.2
Source: United States Census Bureau 2003
Proposed Revisions to Grazing Regulations Draft EIS Bureau of Land Management List of Tables
T-19 December 2003
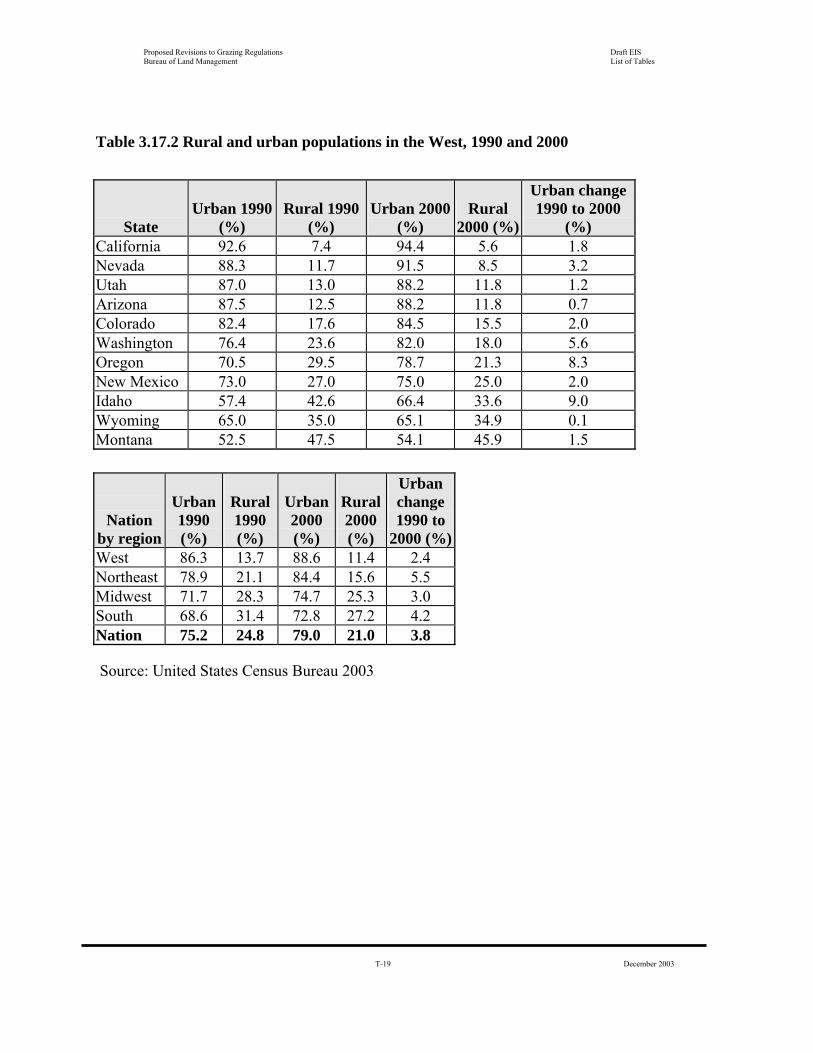
Table 3.17.2 Rural and urban populations in the West, 1990 and 2000
Source: United States Census Bureau 2003
State
Urban 1990 (%)
Rural 1990 (%)
Urban 2000 (%)
Rural 2000 (%)
Urban change 1990 to 2000
(%) California 92.6 7.4 94.4 5.6 1.8 Nevada 88.3 11.7 91.5 8.5 3.2 Utah 87.0 13.0 88.2 11.8 1.2 Arizona 87.5 12.5 88.2 11.8 0.7 Colorado 82.4 17.6 84.5 15.5 2.0 Washington 76.4 23.6 82.0 18.0 5.6 Oregon 70.5 29.5 78.7 21.3 8.3 New Mexico 73.0 27.0 75.0 25.0 2.0 Idaho 57.4 42.6 66.4 33.6 9.0 Wyoming 65.0 35.0 65.1 34.9 0.1 Montana 52.5 47.5 54.1 45.9 1.5
Nation
by region
Urban 1990 (%)
Rural 1990 (%)
Urban 2000 (%)
Rural 2000 (%)
Urban change 1990 to
2000 (%)West 86.3 13.7 88.6 11.4 2.4 Northeast 78.9 21.1 84.4 15.6 5.5 Midwest 71.7 28.3 74.7 25.3 3.0 South 68.6 31.4 72.8 27.2 4.2 Nation 75.2 24.8 79.0 21.0 3.8

Proposed Revisions to Grazing Regulations Draft EIS Bureau of Land Management List of Tables
T-20 December 2003
Table 3.17.3 Metropolitan, nonmetropolitan, and public land county population change
in Western States, 1990 to 2000.a
County type
Population
1990
Population
2000
Proportion of
population 1990 (%)
Proportion of
population 2000 (%)
Population change 1990
to 2000 (%)
Nonmetropolitan, nonpublic land counties
2,728,251 3,139,775 5.3 5.1 15.1
Metropolitan counties 44,476,002 53,251,277 86.9 86.8 19.7 Nonmetropolitan public land counties
3,974,974 4,968,411 7.8 8.1 25.0
aTotals do not include Hawaii and Alaska. Source: United States Census Bureau 2003 (Cook and Miser 1994).

Proposed Revisions to Grazing Regulations Draft EIS Bureau of Land Management List of Tables
T-21 December 2003
Table 3.17.4 Ranch income by source (Gentner and Tanaka 2000).a
a Totals may not sum due to rounding. Table 3.17.5 Goals and objectives for ranching (Gentner and Tanaka 2002).a
Rancher type
Family Tradition
RaiseFamily
Close toFriends
Pass to Children
Profit
Lack Skills
EnvironmentalPurposes
Hobbyists Small Hobbyist 3.7 3.7 2.8 1.5 2.6 1.5 2.4 Retired Hobbyist 4.6 4.6 3.9 4.3 3.7 2.3 2.2 Working Hobbyist 4.5 4.6 3.5 4.2 3.6 1.8 2.3 Trophy Rancher 3.4 3.3 2.1 4.0 2.6 1.3 2.1 Professionals Diversified Family Rancher
4.1 4.2 2.9 2.3 3.7 2.0 1.9
Dependent Family Rancher
4.9 4.9 4.4 4.8 4.2 3.3 2.3
Corporate Rancher 4.5 4.5 3.5 4.1 3.6 2.3 2.0 Sheep Rancher 4.4 4.5 3.2 3.8 3.5 2.3 2.0 P - value ns 0.0001 0.001 ns 0.0001 0.001 0.001 a Average on a scale of 1 = low to 5 = high.
Ranch Income by Source
Rancher type
Ranch
(%)
Other Ag/Forestry
(%)
All Other (%)
Dependent Family Rancher 84.7 6.0 9.2 Sheep Rancher 80.8 2.1 17.0 Diversified Family Rancher 74.9 10.4 14.4 Corporate Rancher 71.9 9.2 18.8 Retired Hobbyist 21.5 21.4 56.3 Trophy Rancher 21.1 7.7 70.6 Working Hobbyist 18.2 2.3 79.5 Small Hobbyist 13 5 84

Proposed Revisions to Grazing Regulations Draft EIS Bureau of Land Management List of Tables
T-22 December 2003
Table 3.17.6 Months of labor required to run the ranch (Gentner and Tanaka 2000)
Table 3.17.7 Example of social organization process in ranching communities
Rancher type
Family laborer
(months)
Hired laborer
(months) Sheep Rancher 27.5 45.3 Corporate Rancher 26.7 32.0 Dependent Family Rancher 24.6 3.6 Diversified Family Rancher 20.7 4.3 Retired Hobbyist 17.2 4.8 Working Hobbyist 14.9 2.3 Trophy Rancher 13.5 28.2 Small Hobbyist 10.5 4.5
Social Organization Process Differentiation Extra-Local Ties Stratification Integration Dilutes local economic and social power of ranchers and their values
Globalization of industry reduces value of local economic ties
Stratification becomes an actionable value, e.g. ranchers criticism of new economy
Highly capable of incorporating community-oriented values into actions
Differentiation goes up, web of affiliation for ranchers can narrow or expand—often has community focus
Extra-local ties can increase value of local social networks
Equitable stratification reduces utility of status or creates social leveling
High integration facilitates community-oriented actions by ranchers
Reduces value of group membership; can extend to rancher unwillingness to see community as locus of support
Extra-local ties include increased conflict between ranchers and nonlocal groups
New dimensions of stratification reduce community as source of mutual support for ranching
Degree of integration affects extent and density of local social networks
Proposed Revisions to Grazing Regulations Draft EIS Bureau of Land Management List of Tables
T-23 December 2003
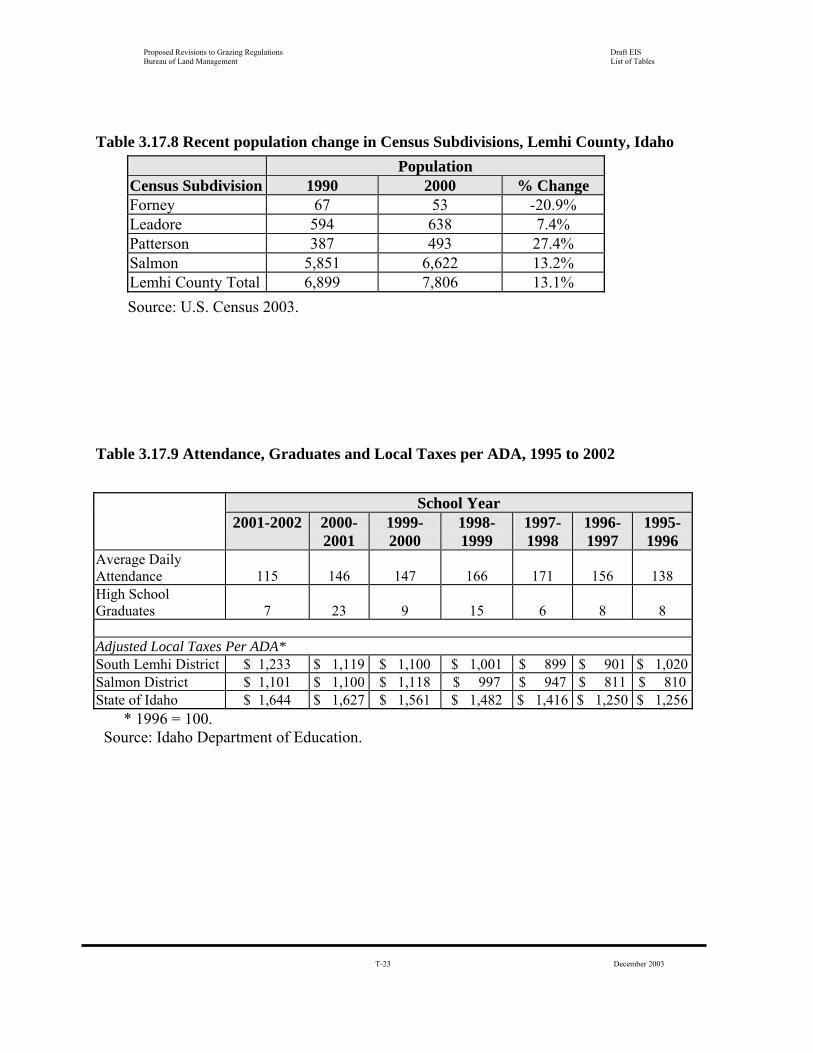
Table 3.17.8 Recent population change in Census Subdivisions, Lemhi County, Idaho
Source: U.S. Census 2003. Table 3.17.9 Attendance, Graduates and Local Taxes per ADA, 1995 to 2002
* 1996 = 100. Source: Idaho Department of Education.
Population Census Subdivision 1990 2000 % Change Forney 67 53 -20.9% Leadore 594 638 7.4% Patterson 387 493 27.4% Salmon 5,851 6,622 13.2% Lemhi County Total 6,899 7,806 13.1%
School Year 2001-2002 2000-
2001 1999-2000
1998-1999
1997-1998
1996-1997
1995-1996
Average Daily Attendance 115 146 147 166 171 156 138 High School Graduates 7 23 9 15 6 8 8 Adjusted Local Taxes Per ADA* South Lemhi District $ 1,233 $ 1,119 $ 1,100 $ 1,001 $ 899 $ 901 $ 1,020Salmon District $ 1,101 $ 1,100 $ 1,118 $ 997 $ 947 $ 811 $ 810State of Idaho $ 1,644 $ 1,627 $ 1,561 $ 1,482 $ 1,416 $ 1,250 $ 1,256
Proposed Revisions to Grazing Regulations Draft EIS Bureau of Land Management List of Tables
T-24 December 2003
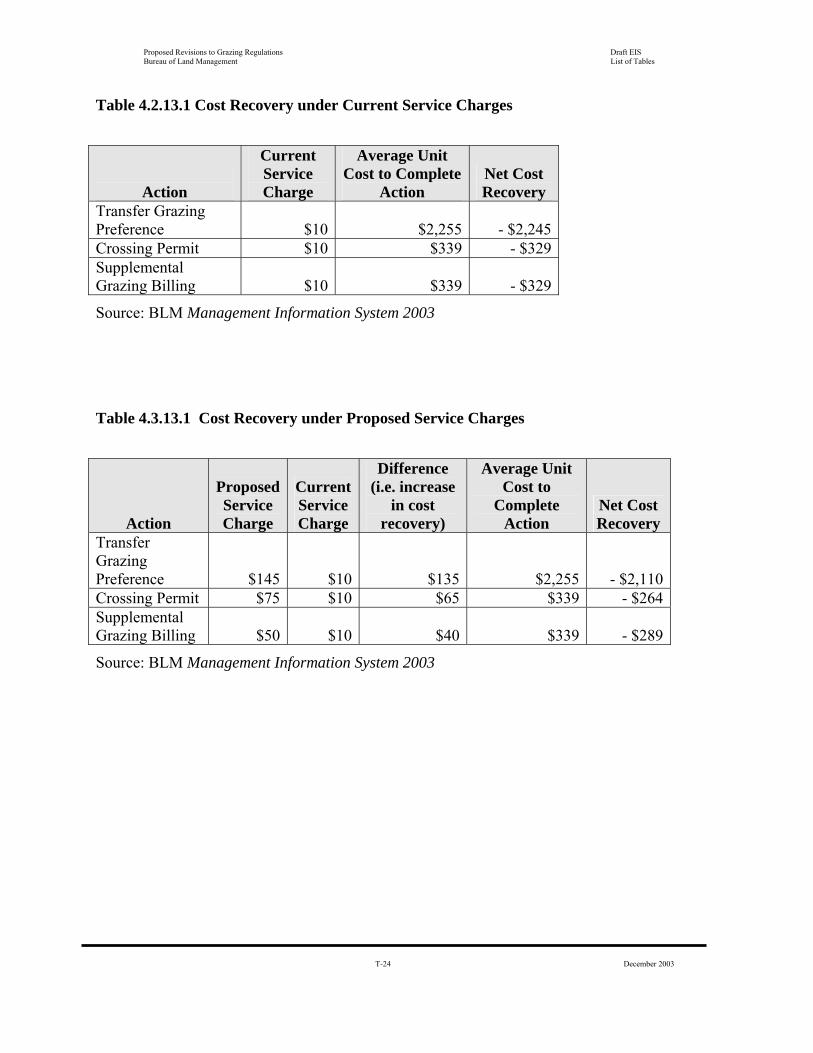
Table 4.2.13.1 Cost Recovery under Current Service Charges
Action
Current Service Charge
Average Unit Cost to Complete
Action Net Cost Recovery
Transfer Grazing Preference $10 $2,255 - $2,245Crossing Permit $10 $339 - $329Supplemental Grazing Billing $10 $339 - $329
Source: BLM Management Information System 2003
Table 4.3.13.1 Cost Recovery under Proposed Service Charges
Action
Proposed Service Charge
Current Service Charge
Difference (i.e. increase
in cost recovery)
Average Unit Cost to
Complete Action
Net Cost Recovery
Transfer Grazing Preference
$145 $10 $135
$2,255 - $2,110Crossing Permit $75 $10 $65 $339 - $264Supplemental Grazing Billing
$50 $10 $40
$339 - $289
Source: BLM Management Information System 2003

Proposed Revisions to Grazing Regulations Draft EIS Bureau of Land Management List of Tables
T-25 December 2003
Table 4.3.14.1 Social Effects of the Proposed Action
Element Group Direct Impact
Indirect Impact
Cumulative Impact
Regional Differences
Likelihood of
OccurrencePermittees Minimal Conservation & Environmental
Minimal
Social, Economic and Cultural Considerations in the Decision-Making Process Recreation Minimal
Permittees Positive None None None Good Conservation & Environmental
Minimal Implementation of Changes in Grazing Use
Recreation Minimal Permittees Minimal Conservation & Environmental
Minimal Range Improvement Ownership
Recreation Minimal
Permittees Minimal
Conservation & Environmental
Minimal
Cooperation with State, Local, and County Established Grazing Boards
Recreation Minimal Permittees Minimal Conservation & Environmental Minimal
Review of Biological Assessments and Evaluations Recreation Minimal
Permittees Negative None Negative None Potential Conservation & Environmental
Minimal Temporary Nonuse
Recreation Minimal
Permittees Minor
Positive None Minor Positive None Potential
Conservation & Environmental
Minor Positive None Minor
Positive None Potential Basis for Rangeland Health Determinations
Recreation Minor
Positive None Minor Positive None Potential
Permittees Minimal
Conservation & Environmental
Minimal
Biological Assessments – Application of Protest and Appeal Provisions Recreation Minimal
Permittees Minor
Positive None None None Potential
Conservation & Environmental
Minor Negative None None None Potential
Timeframe for Meeting Rangeland Health Standards
Recreation Minimal

Proposed Revisions to Grazing Regulations Draft EIS Bureau of Land Management List of Tables
T-26 December 2003
Element Group Direct Impact
Indirect Impact
Cumulative Impact
Regional Differences
Likelihood of
OccurrencePermittees Minimal Conservation & Environmental
Minimal Conservation Use
Recreation Minimal Permittees Minimal Conservation & Environmental
Minimal
Definition of Grazing Preference, Permitted Use, and Active Use Recreation Minimal
Permittees Minimal Conservation & Environmental
Minimal Definition and Role of Interested Public
Recreation Minimal Permittees Positive None Positive Yes Good Conservation & Environmental
Negative None Negative Yes Potential Water Rights
Recreation Minimal Permittees Minimal Conservation & Environmental
Minor Positive None None None Potential
Satisfactory Performance of Permittee or Lessee Recreation Minimal
Permittees Minimal
Conservation & Environmental
Minimal
Changes in Grazing Use Within the Terms and Conditions of the Permit or Lease Recreation Minimal
Permittees Minimal Definition and Role of Interested Public Conservation &
Environmental Minimal
Permittees Minimal Conservation & Environmental
Minimal
Service Charges
Recreation Minimal Permittees Minimal Conservation & Environmental
Negative Negative Potential Prohibited Acts
Recreation Negative Negative Permittees Minimal Conservation & Environmental
Minimal
Grazing Use Pending Resolution of Appeals When Decision Has Been Stayed Recreation
Minimal

Proposed Revisions to Grazing Regulations Draft EIS Bureau of Land Management List of Tables
T-27 December 2003
Element Group Direct Impact
Indirect Impact
Cumulative Impact
Regional Differences
Likelihood of
OccurrencePermittees Minimal Conservation & Environmental
Minimal
Definition of Grazing Preference, Permitted Use, and Active Use Recreation Minimal
Permittees Minimal Conservation & Environmental
Minimal
Treatment of Biological Assessments and Evaluations in the Grazing Decision-Making Process Recreation
Minimal
Table 4.4.14.1 Social Effects of the Modified Action Alternative Three
Element Group Direct Impact
Indirect Impact
Cumulative Impact
Regional Differences
Likelihood of
OccurrencePermittees Minimal Conservation & Environmental
Minimal Implementation of Changes in Grazing Use
Recreation Minimal
Permittees Minimal Conservation & Environmental
Minimal Basis for Rangeland Health Determinations
Recreation Minimal Permittees Minimal Conservation & Environmental
Minimal Temporary Nonuse
Recreation Minimal