Draft - University of Toronto T-Space Field calibration of blowfly-derived DNA against traditional...
43
Draft Field calibration of blowfly-derived DNA against traditional methods for assessing mammal diversity in tropical forests Journal: Genome Manuscript ID gen-2015-0193.R1 Manuscript Type: Article Date Submitted by the Author: 15-Mar-2016 Complete List of Authors: Lee, Ping-Shin; University of Malaya, Faculty of Science Gan, Han Ming; Monash University Malaysia Clements, Gopalasamy-Reuben ; Universiti Malaysia Terengganu Wilson, John; University of Malaya, Keyword: camera traps, cage traps, hair traps, Malaysia, mist nets https://mc06.manuscriptcentral.com/genome-pubs Genome
Transcript of Draft - University of Toronto T-Space Field calibration of blowfly-derived DNA against traditional...
Draft
Field calibration of blowfly-derived DNA against traditional
methods for assessing mammal diversity in tropical forests
Journal: Genome
Manuscript ID gen-2015-0193.R1
Manuscript Type: Article
Date Submitted by the Author: 15-Mar-2016
Complete List of Authors: Lee, Ping-Shin; University of Malaya, Faculty of Science Gan, Han Ming; Monash University Malaysia Clements, Gopalasamy-Reuben ; Universiti Malaysia Terengganu Wilson, John; University of Malaya,
Keyword: camera traps, cage traps, hair traps, Malaysia, mist nets
https://mc06.manuscriptcentral.com/genome-pubs
Genome
Draft
Field calibration of blowfly-derived DNA against traditional methods for assessing
mammal diversity in tropical forests
Ping-Shin Lee1,2, Han Ming Gan3,4, Gopalasamy Reuben Clements3,5,6,7, John-James
Wilson1,2*
1Museum of Zoology, Institute of Biological Sciences, Faculty of Science, University of
Malaya, 50603 Kuala Lumpur, Malaysia. 2Ecology and Biodiversity Program, Institute of Biological Sciences, Faculty of Science,
University of Malaya, 50603 Kuala Lumpur, Malaysia. 3School of Science, Monash University Malaysia, Jalan Lagoon Selatan, Bandar Sunway,
47500 Petaling Jaya, Selangor, Malaysia. 4Monash University Malaysia Genomics Facility, Monash University Malaysia, Jalan Lagoon
Selatan, Bandar Sunway, 47500 Petaling Jaya, Selangor, Malaysia. 5Centre for Tropical Environmental and Sustainability Science, and College of Marine and
Environmental Sciences, James Cook University, 4870 Cairns, Queensland, Australia. 6Kenyir Research Institute, Universiti Malaysia Terengganu, 21030 Kuala Terengganu,
Malaysia. 7Rimba, 4 Jalan1/9D, 43650 Bandar Baru Bangi, Selangor, Malaysia.
*Author for correspondence:
Dr. John James Wilson
Institute of Biological Sciences,
Faculty of Science,
University of Malaya,
50603 Kuala Lumpur, Malaysia.
Fax: 03-79674112
Email: [email protected]
Page 1 of 42
https://mc06.manuscriptcentral.com/genome-pubs
Genome
Draft
Abstract
Mammal diversity assessments based on DNA derived from invertebrates have been
suggested as alternatives to assessments based on traditional methods; however, no study has
field-tested both approaches simultaneously. In Peninsular Malaysia, we calibrated the
performance of mammal DNA derived from blowflies (Diptera: Calliphoridae) against
traditional methods used to detect species. We first compared five methods (cage trapping,
mist netting, hair trapping, scat collection, and blowfly-derived DNA) in a forest reserve with
no recent reports of megafauna. Blowfly-derived DNA and mist netting detected the joint
highest number of species (n=6). Only one species was detected by multiple methods.
Compared to the other methods, blowfly-derived DNA detected both volant and non-volant
species. In another forest reserve, rich in megafauna, we calibrated blowfly-derived DNA
against camera traps. Blowfly-derived DNA detected more species (n=11) than camera traps
(n=9), with only one species detected by both methods. The rarefaction curve indicated that
blowfly-derived DNA would continue to detect more species with greater sampling effort.
With further calibration, blowfly-derived DNA may join the list of traditional field methods.
Areas for further investigation include blowfly feeding and dispersal biology, primer biases,
and the assembly of a comprehensive and taxonomically-consistent DNA barcode reference
library.
Keywords: camera traps, cage traps, hair traps, Malaysia, mist nets
Page 2 of 42
https://mc06.manuscriptcentral.com/genome-pubs
Genome

Draft
Introduction
A wide variety of field methods have been used to assess mammal diversity in tropical forests.
Frequently used methods include: live trapping such as cage traps (Hanif-Ridzuan et al. 2010;
Madinah et al. 2011), mist nets and harp traps (Kingston et al. 2003; Sing et al. 2013), camera
traps (Clements 2013; Hedges et al. 2015a), indirect signs such as tracks or scat (Daim 2002),
interviews with local communities (Sharma et al. 2005), direct observations by researchers
(Syakirah et al. 2000; Jayaraj et al. 2013), and hair traps (Castro-Arellano et al. 2008; Hedges
et al. 2015b). Recent additions to the toolbox are secondary sources of mammal DNA, for
example, mammal DNA detected from owl-pellet bones (Rocha et al. 2015) and invertebrate
gut contents (Calvignac-Spencer et al. 2012; Schnell et al. 2012; Calvignac-Spencer et al.
2013; Lee et al. 2015; Schnell et al. 2015). These methods can provide accurate identification
of mammal species, are not stressful to the mammals themselves, require the least ecological
and taxonomic expertise, and yet have the potential to detect rare and cryptic species
(Calvignac-Spencer et al. 2012; Schnell et al. 2012; Lee et al. 2015).
Blowflies (Diptera: Calliphoridae) have shown promising potential as sources of mammal
DNA due to their presence in all habitats (Norris 1965) and broad host preferences as
saprophagous and coprophagous generalists (Calvignac-Spencer et al. 2012; Azwandi et al.
2013; Calvignac-Spencer et al. 2013; Lee et al. 2015; Schnell et al. 2015). Chrysomya
bezziana has been reported feeding on mammal species from the orders Artiodactyla (7 spp.),
Carnivora (6 spp.), Diprotodontia (2 spp.), Perissodactyla (4 spp.), Proboscidea (1 spp.), and
Primates (1 spp.) at a zoo in Malaysia (Spradbery & Vanniasingham 1980). Lucilia sericata
is found in Asia, North America, and Europe (James 1947; Picard & Wells 2010), and has
been reported to feed on wounds of sheep, cats, a dog, and a horse in Israel (Schnur et al.
2009). Blowflies, such as Chrysomya megacephala, were the first and most abundant insects
arriving at Macaca fascicularis, Oryctolagus cuniculus, and Rattus norvegicus carcasses in a
forest in Peninsular Malaysia (Azwandi et al. 2013). Standardised methods for sampling of
blowflies have been developed which take into account the persistence period of mammal
DNA in blowfly guts (Lee et al. 2015). Despite the increasing interest in invertebrate-derived
mammal DNA for mammal diversity assessments, field calibrations of the performance of
invertebrate-derived mammal DNA against traditional methods have yet to be conducted
(Schnell et al. 2015).
Page 3 of 42
https://mc06.manuscriptcentral.com/genome-pubs
Genome

Draft
Each field method listed above differs in terms of the targeted mammal groups and resource
costs, with advantages and disadvantages for each method (summarised in Table 1). Recently,
a number of studies from the forests of Peninsular Malaysia, home to 222 mammal species
(DWNP 2010), have simultaneously tested the effectiveness of different methods in detecting
mammal species (Syakirah et al. 2000; Jayaraj et al. 2012; Tingga et al. 2012; Jayaraj et al.
2013). In Gunung Stong State Park, Kelantan, a combination of cage traps, mist nets, and
harp traps yielded low capture rates of non-volant small mammals (Jayaraj et al. 2012); cage
traps did not detect treeshrews and squirrels (probably due to bait incompatibility and poor
positioning), while harp traps captured a low diversity of insectivorous bats. In Taman
Negara, Pahang, a combination of cage traps, Sherman traps, mist nets, and harp traps
demonstrated the efficiency of harp traps for mammal sampling (Tingga et al. 2012). The
harp traps accounted for 84% of the bat species reported and 65% of the total mammal
species. In contrast, at Wang Kelian State Park, Perlis, after several years of surveys using a
combination of harp traps, cage traps, and direct observations, the inclusion of mist nets in
the latest sampling period increased the number of species sampled by 33% (from an average
of 24 per survey to 36; Jayaraj et al. 2013).
Here, we evaluate the potential of blowfly-derived DNA for mammal diversity assessments
in tropical forests. We conducted two field studies to calibrate the performance of blowfly-
derived mammal DNA at generating species inventories and richness estimates against
traditional methods in Peninsular Malaysia. We first compared five methods - cage trapping,
mist netting, hair trapping, scat collection, and blowfly-derived DNA - in a tropical forest
reserve with no recent reports of megafauna. Next, we compared blowfly-derived DNA with
the most popular method to assess megafauna diversity - camera traps - in another tropical
forest reserve with megafauna.
Materials and Methods
Study sites
Two field calibrations were conducted in two forest reserves in Peninsular Malaysia: 1) Ulu
Gombak Forest Reserve (UGFR) in Selangor; and 2) Tembat Forest Reserve (TFR) in
Terengganu. UGFR comprises 17,000 ha of logged dipterocarp forest (3°20'N, 101°45'E;
Figure 1). UGFR is considered one of the most species-rich localities for Old World bats
(Sing et al. 2013) and has been intensively studied since the establishment of Ulu Gombak
Page 4 of 42
https://mc06.manuscriptcentral.com/genome-pubs
Genome
Draft
Field Studies Centre (University of Malaya) 50 years ago (Medway 1966). We compiled an
extensive mammal checklist for UGFR based on previous records (including University of
Malaya student theses) of sampled or observed species (Table S1). TFR, comprising logged
dipterocarp forest (5°11'N, 102°41'E), is one of 17 ecological linkages recognised in the
Malaysia Federal Government’s “Central Forest Spine Master Plan for Ecological Linkages”
to restore connectivity between four fragmented forest complexes (DTCP & DOF 2012).
Field methods
Our first field survey was conducted at UGFR between 3rd November 2014 and 25th
December 2014 for two nights each week (16 nights in total). Two transects of 100 m were
established 1500 m apart (Figure 1). The survey incorporated (a) baited cage traps, (b) mist
nets, (c) baited hair traps, (d) scat collection, and (e) baited blowfly traps.
a) Ten wire mesh cage traps (Figure 1) were set per transect at 10 m intervals, monitored and
baited with fresh banana daily. Banana is reported as being among the effective bait for cage
traps used for small mammal diversity assessments in tropical forests of Malaysia (Bernard
2003; Payne & Francis 2005; Madinah et al. 2011) and is resistant to removal by
invertebrates (Bernard 2003). Cage traps were checked daily, and hair samples from any
trapped mammals were collected into a 1.5 mL microcentrifuge tube before release.
b) Ten mist nets (9 m x 4 m x 36 mm mesh size) (Figure 1) were positioned across potential
flight paths of bats (trails or streams). Mist nets were set at a single transect from 1900 and
were monitored continuously until 2300 or until it rained. A small wing punch was collected
from each captured bat into a 1.5 mL ethanol-filled microcentrifuge tube following AMNH
(2013). Scissors and forceps were cleaned with alcohol and sterile tissues between bats to
avoid cross-contamination. Mist nets were only used for four weeks (two nights per week) in
November.
c) Ten hair traps (PVC pipes covered with reversed duct tape on the inside) (Figure 1) were
set per transect at 10 m intervals and monitored daily. Hair traps were baited with banana at
the start of the 2-night cycle and collected at the end of the cycle. Any hair samples from
traps were collected into a 1.5 mL microcentrifuge tube using sterile forceps.
d) Any scat (Figure 1) encountered while walking along transects daily was collected into a
1.5 mL microcentrifuge tube.
Table S1. Checklist of mammal species recorded at Ulu Gombak Forest Reserve.
Page 5 of 42
https://mc06.manuscriptcentral.com/genome-pubs
Genome
Draft
e) Ten blowfly traps baited with rotten fish (see Lee et al. 2015) were set per transect at 10 m
intervals and 2 m above the ground. The traps were emptied every 24 h, and collected
blowflies (Diptera: Calliphoridae) were frozen at -20°C within 5 h of trap emptying. The guts
of all collected blowflies (=315) were then dissected with sterile implements and pooled (five
individual blowfly guts per tube) for DNA extraction (63 extractions in total). The DNA
extracts were further pooled by week and transect of sampling, resulting in (8 x 2) 16 pooled
DNA extracts for bulk PCR.
Our second field survey was conducted at TFR between 11th April 2015 and 27th May 2015
(30 days in total). A 28 km transect was used incorporating (a) baited blowfly traps and (b)
camera traps (Figure 1). A longer transect was used, compared to UGFR, in accordance with
the longer transects generally used for camera trapping surveys (Clements 2013).
a) Twenty baited blowfly traps (Lee et al. 2015) were set along the transect (Figure 1), 2 m
above the ground, 500 m apart. As above, the traps were emptied every 24 h, and collected
blowflies were frozen at -20 °C within 5 h of trap emptying. The guts of all collected
blowflies (=1,345) were then dissected with sterile implements and pooled (five individual
blowfly guts per tube) for DNA extraction (269 extractions in total). The DNA extracts were
further pooled by sampling day, resulting in 30 pooled DNA extracts for bulk PCR.
b) Twenty Panthera V4 camera traps with passive infrared motion sensors were deployed
along the transect (Figure 1), attached to tree trunks approximately 50 cm above ground level.
Camera traps were placed on linear features known to have high detection probabilities for
large mammals (e.g. animal trail, ridge, or old logging road; Harmsen et al. 2010). No
attractants were employed around the cameras. The cameras were triggered by motion, and
only photocaptures that were obtained during the sampling period of the blowfly traps (30
days) were used for analysis and were catalogued using Camera Base version 1.4 software
(Tobler 2012).
Species-level identification of blowfly-derived DNA
Our protocol for minimally-invasive collection of mammal DNA samples (hair, wing
punches) from mammals trapped in cages or nets has been approved by the University of
Malaya Institutional Animal Care and Use Committee (UMIACUC) (Ref.
ISB/02/1212013/JJW (R)) and the Department of Wildlife and National Parks, Peninsular
Malaysia (Ref. JPHL&TN(IP): 80-4/2 Jld16(24)). DNA was extracted from the collected hair
Page 6 of 42
https://mc06.manuscriptcentral.com/genome-pubs
Genome

Draft
and bat tissue samples using an alkaline lysis extraction method (100 µL elution; modified
from Ivanova et al. 2012). The samples collected into 1.5 mL microcentrifuge tubes were first
cut into smaller fragments using sterile scissors. 35 µL of alkaline buffer (0.1 N NaOH, 0.3
mM EDTA, pH 13.0) was then added into the tube, followed by centrifugation for 1 min at
110,000 g and incubation at 95 °C for 20 min. 65 µL of neutralization buffer (0.1 M Tris-HCl,
pH 7.0) was then added to the tubes, followed by vigorous vortexing and centrifugation
(110,000 g, 1 min). DNA was extracted from scat using a QIAamp DNA stool mini kit
(QIAGEN, USA) following the manufacturer’s protocol (200 µL elution). DNA was
extracted from blowfly guts using a NucleoSpin Tissue kit (Macherey-Nagel, Germany) (100
µL elution), following the manufacturer’s instructions.
The extracted DNA samples from hair, bat tissue, and scat samples were used for PCR in
standard protocols following Wilson (2012) and Wilson et al. (2014). Primers VF1d_t1 /
VR1d_t1 (Ivanova et al. 2012) were used for a first pass and RonM / VR1 for a second pass
(Ivanova et al. 2012). PCR was performed using EconoTaq PLUS 2X mastermix (Lucigen,
USA) and COI Fast thermocycling program (see Wilson 2012), with slight modification of
the amount of DNA template added (0.5-2 µL) depending on DNA extraction method. PCR
products were then Sanger-sequenced by a local company (MYTACG-Kuala Lumpur,
Malaysia) using the reverse PCR primer. Each sequence generated from individual specimens
was trimmed of primers and edited using CodonCode Aligner (CondonCode Corp., USA)
(following Wilson 2012).
For blowfly-derived DNA, a 205 bp COI amplicon was generated using a two-step PCR that
utilises universal mammal primers, Uni-Mini-bar F and RonPing R (Lee et al. 2015) with
partial Illumina adaptor sequences, TCGTCGGCAGCGTCAGATGTGTATAAGAGACAG
and GTCTCGTGGGCTCGGAGATGTGTATAAGAGACAG incorporated onto the 5’ end
of the forward and reverse primers, respectively. EconoTaq PLUS 2X Master Mix (Lucigen,
USA) and COI Fast thermocycling program (see Wilson 2012) were used to generate
amplicons from 1 µL of DNA extract (five replicate PCRs were performed for each pooled
DNA extract, together with a negative control). PCR products were visualised on a 2%
agarose gel stained with 1 x GelRed (Biotium, USA), and gels were extracted and purified
using NucleoSpin Gel and PCR Clean-up kit (Macherey-Nagel, Germany), following the
manufacturer’s instructions. Of the 16 pooled DNA extracts from UGFR, seven produced
Page 7 of 42
https://mc06.manuscriptcentral.com/genome-pubs
Genome
Draft
PCR products and were selected for high-throughput (next-generation) DNA sequencing
(HTS). Of the 30 pooled DNA extracts from TFR, 17 produced PCR products and were
selected for HTS. The purified PCR products were used as templates for a second round of
PCR reaction to generate amplicons containing Illumina adaptors and unique dual-index
multiplex identifier (MID) tags. Briefly, 6 uL of the purified PCR product was mixed with 10
µL of NEBNext® High-Fidelity 2X Master Mix (New England Biolabs, USA) and 2 µL of
each Nextera XT N70X and N50Y dual-index primers (Illumina, San Diego, CA) to make up
a total of 20 uL reaction volume. The thermal cycling conditions were 98°C for 30s; followed
by 6 cycles of 98°C for 10 s, 65°C for 30 s, and 72°C for 30 s; and a final extension at 72°C
for 5 min. The PCR products were subsequently purified and size-selected using 0.8x volume
ratio of AMPure XT® beads (Beckman Coulter Inc., USA). The final amplicons from all
samples were quantified using KAPA Library Quantification Kit (KAPA Biosystems,
CapeTown, South Africa), normalized, pooled, and then sequenced on the Illumina MiSeq
Sequencer (model number: M02133; 2 x 250 bp paired-end read setting) located at the
Monash University Malaysia Genomics Facility. The sequencing run produced 5,541,198
paired end reads corresponding to 2,403 megabases data output. The MiSeq outputs (FASTQ)
were submitted to the NCBI Sequence Read Archive under project accession number
SRP064503. The Illumina reads were demultiplexed and trimmed of adapters onboard the
MiSeq using the MiSeq Reporter Software. The ‘raw’ output of paired-end reads was quality
filtered using the online PRINSEQ (Schmieder & Edwards 2011) by sequence length (75-350
bp), minimum mean quality score (>25), and GC content (20-50%). Reads with low
complexity (threshold using Entropy=80) and characters other than A, C, T, or G were
excluded. Redundant reads (exact sequence duplicates, 5’ sequence duplicates, 3’ sequence
duplicates, reverse complement exact sequence duplicates, and reverse complement 5’/3’
sequence duplicates) were dereplicated. Reads with mean scores of less than 5 (sliding
window size =5, step size =5) or minimum tail length of poly-A/T tails of five at 5’end and
five at 3’end were trimmed of low-quality bases at 5’end (1 bp) and 3’end (1 bp). The output
data (in FASTA format) was then further filtered and trimmed of primer sequences with
quality control and filtering steps performed manually in CodonCode Aligner (CondonCode
Corp., USA) following Brandon-Mong et al. (2015). Both consensus and singleton reads
surviving the quality control and filtering steps were retained for taxonomic assignment.
The resulting DNA barcodes obtained from all individual specimens collected from cage
traps, mist nets, and scat collection, and unique DNA metabarcodes from blowfly-derived
Page 8 of 42
https://mc06.manuscriptcentral.com/genome-pubs
Genome
Draft
DNA were uploaded to the Barcode of Life Data Systems (BOLD) (Ratnasingham & Hebert
2007) and are available in the public dataset DS-BDNGS. Linnaean species names were
assigned to our DNA barcodes (individual specimens collected from cage traps, mist nets,
and scat collection) and a representative DNA metabarcode (recovered from blowfly-derived
DNA) when they had sequence similarity matches of >98% to DNA barcodes with Linnaean
species names (submitted by other BOLD users) in the full database of BOLD (see Wilson et
al. 2014). In the case of conflicts, i.e. our DNA (meta)barcodes had sequence similarity
matches of >98% to database DNA barcodes with several different Linnaean species names,
we assigned the Barcode Index Number (BIN) (Ratnasingham & Hebert 2013) of the
matching reference DNA barcodes to our DNA (meta)barcodes without using a species
epithet. When our DNA (meta)barcodes had sequence similarity matches of <98% but >94%
with reference DNA barcodes, we assigned the genus name of the closest matching reference
DNA barcode to our DNA (meta)barcodes (see Zeale et al. 2011). When our DNA
(meta)barcodes had sequence similarity matches of <94% but >90% with reference DNA
barcodes, we assigned the order name of the closest matching reference DNA barcode to our
DNA (meta)barcodes (see Zeale et al. 2011). DNA (meta)barcodes sharing <90% sequence
similarity to the closest matching DNA barcode in BOLD were discarded from further
analyses but are discussed anecdotally below.
Species identification from camera traps
Identification of species from the photocaptures (Figure 2) was carried out by LPS and GRC
based on morphological characters with the aid of Francis (2008). Photocaptures of mammals
that could not be identified with certainty due to poor lighting or blurred images were
excluded.
Field method calibration
For the methods used at UGFR, the percentage of potentially detectable species in the UGFR
checklist (Table S1) detected by each field method was calculated. The expected species
richness (using Chao 1) for each field method was computed in EstimateS Version 9.1.0
(Colwell 2006). Chao 1 is suitable for species richness estimation of our sampling sites as it
corrects for bias due to sampling effort and species rarity (Chao 1984; Iknayan et al. 2014).
Rarefaction curves of expected species richness (using Chao 1) with 95% confidence
intervals were generated based on the cumulative sampling days using EstimateS Version
Page 9 of 42
https://mc06.manuscriptcentral.com/genome-pubs
Genome

Draft
9.1.0 (Colwell 2006; Figure 4). The sampling completeness ratio (observed species
richness/expected species richness; Soberón et al. 2000) was calculated for each method.
Results
At UGFR a total of 14 mammal species from the orders Artiodactyla, Chiroptera, Primates,
and Rodentia (Figure 3) were detected from a total effort of 1,440 trap days (320 from cage
traps; 160 from mist nets; 320 from hair traps; 320 from scat collection; 320 from blowfly
traps). Mist nets and blowfly traps contributed the most species-rich samples with six species
(including BINs without formal names) detected each, followed by cage traps and scat
collection that detected two species each; hair traps detected no species (Figure 3). Blowfly
traps recorded species from four orders - Artiodactyla, Chiroptera, Primates, and Rodentia
(Figure 3). The other field methods (except hair traps that detected no species) detected only
a single order each. Two domesticated mammal species, Bos [under BIN - BOLD:AAA2294]
and Felis [BOLD:AAC2892], and non-mammal taxa including one bird species, Gallus
gallus [BOLD:AAA3630], a midge species, and a fish species, were also detected in blowfly-
derived DNA, but these were excluded from further analyses as our focus was the detection
of wild mammal species. Of 20 potentially detectable species of small-bodied rodents and
treeshrews recorded in the UGFR checklist, both cage traps and blowfly traps detected two
species (10.0%). Of 57 potentially detectable bats recorded in the UGFR checklist, mist nets
detected six species (10.5%), and blowfly traps detected two species (3.5%). Of 45
potentially detectable non-volant mammals recorded in the UGFR checklist, blowfly traps
detected the highest number of species (n=4; 8.9%). Blowfly traps detected one new record of
non-volant mammal for the UGFR checklist - Trachypithecus obscurus [BOLD:AAI0540].
Sampling completeness ratios for blowfly traps, cage traps, and scat collection were 1.00, and
0.86 for mist nets. The HTS data from UGFR included reads from five blowfly species -
Chrysomya [BOLD:AAC4787; BOLD:ACD5557; and BOLD:ACF0516], and Lucilia
[BOLD:AAA6618; and BOLD:ACQ1337].
At TFR a total of 20 mammal species from the orders Artiodactyla, Carnivora,
Cetartiodactyla, Chiroptera, Perissodactyla, Primates, Proboscidea, and Rodentia were
detected from a total effort of 1,200 trap days (600 from camera traps; 600 from blowfly traps;
see Figure 3). Blowfly traps detected a higher number of species (n=11) than camera traps
(n=9), including five orders - Artiodactyla, Carnivora, Chiroptera, Primates, and Rodentia,
Page 10 of 42
https://mc06.manuscriptcentral.com/genome-pubs
Genome
Draft
while camera traps detected six orders - Artiodactyla, Carnivora, Cetartiodactyla,
Perissodactyla, Primates, and Proboscidea. While only one potentially domesticated mammal
species was detected - Bos [BOLD:AAA2294], its identify could also be that of a wild bovid
known from TFR - Bos gaurus. Non-mammal taxa including a bird - Gallus gallus
[BOLD:AAA3630], three fish species, a lizard species, a snake species, another squamate,
and a turtle species, were also detected from blowfly-derived DNA but were excluded from
further analyses. Additional non-mammal taxa detected, but which had sequence similarity
matches of <90% with DNA barcodes in BOLD include an algae (76-80% sequence
similarity) and another snake (89% sequence similarity); these were also excluded from
further analyses. Sampling completeness ratio of blowfly traps was 0.79, and 1.00 for camera
traps (Figure 4). The HTS data from TFR included reads from five blowfly species -
Chrysomya [BOLD:AAA5667; BOLD:AAB3064; BOLD:ACD5557; and BOLD:ACF0516],
and Lucilia [BOLD:ACQ1337].
Discussion
Blowfly traps and mist nets detected the highest number of wild mammal species (6 species
each) at UGFR. These were followed by cage traps and scat collection, which detected two
species each. Our hair traps did not detect any species at UGFR, but the difficulties
associated with obtaining mammal DNA samples from hair traps have already been
documented in Malaysia (see Hedges et al. 2015b). There was no difference in the number of
non-volant small-bodied mammal species detected by blowfly traps and cage traps (2 species
each). Only one species was detected by multiple field methods (cage traps, scat collection,
and blowfly traps) - Rattus [BOLD:AAB2208]. Blowfly traps were less effective than mist
nets in detecting bat species (2 versus 6 of 57 in the checklist). The effectiveness of mist nets
in capturing bat species, and consequently making a significant contribution to overall
mammal species richness estimates, has also been shown in other studies in Peninsular
Malaysia (Jayaraj et al. 2012; Jayaraj et al. 2013). The number of species detected by our
mist nets is similar to another study at UGFR that detected seven species using ten mist nets
and four harp traps over 9 trap days (Sing et al. 2013). There was no species detected by both
mist nets and blowfly traps. All species detected from cage traps and scat collection were
detected at both transects at UGFR except one species - Sundamys [BOLD:AAD5076], only
detected from two cage traps at transect 1. For blowfly traps, all species were detected at both
transects except two species - Sus [BOLD:AAA3445], only detected at transect 1, and
Page 11 of 42
https://mc06.manuscriptcentral.com/genome-pubs
Genome

Draft
Macroglossus sobrinus [BOLD:AAA9952], only detected at transect 2. At TFR, blowfly
traps detected higher species richness than camera traps - 11 species from the blowfly traps
versus 9 species (based on visual identification) from camera traps. Blowfly traps detected
more mammal species that were volant and arboreal in nature than those detected by camera
traps. Only one species was potentially detected by both blowfly traps and camera traps - Sus
[BOLD:AAA3445] which is probably “Sus scrofa” from the camera traps.
The blowfly traps at UGFR detected the highest number of orders (4 orders), in contrast to
the traditional methods that detected species from only a single mammal order each. Cage
traps can potentially detect small non-volant mammals of several orders but in our study only
detected Rodentia, probably due to the placement of cage traps on the ground where they can
be avoided by arboreal mammals (see Fontúrbel 2010). Mist nets are restricted in only being
able to detect Chiroptera. Scat collection should, theoretically, not be restricted to detecting
any specific mammal orders, but detection likely depends on the range size of the individuals
of a given species relative to the length of transect patrolled; in our study only Rodentia were
detected from scat. The number of orders detected by blowfly traps at UGFR increases (to 5
orders) when the two domestic mammal species were included - Bos [BOLD:AAA2294],
from Artiodactyla, and Felis [BOLD:AAC2892], from Carnivora. The blowfly traps at TFR
detected fewer orders compared to the camera traps (5 versus 6 orders). However, the
comparison may be less meaningful given the lack of taxonomic equivalency (Bertrand et al.
2006) between the orders of large charismatic megafauna (specifically targeted by the camera
traps) and other mammal orders. For example, Perissodactyla and Proboscidea are orders
containing only a single extant species in Peninsular Malaysia. Nine vertebrate orders were
detected by blowfly traps at TFR when the bird species - G. gallus [BOLD:AAA3630], three
fish species, a lizard species, a snake species, a squamate, and a turtle species, whose DNA
was also detected in the blowfly guts, were included.
The detection of a broad diversity of mammals and other vertebrate orders from blowfly traps
is consistent with the study by Calvignac-Spencer et al. (2012), who detected six mammal
orders, an avian order, and an amphibian order from blowfly-derived DNA sampled at Taï
National Park, Côte d'Ivoire, and Kirindy Forest, Madagascar. Although these results
demonstrate the broad range of blowfly hosts, biases in PCR primer binding affinity may lead
to sequences of certain species being amplified less efficiently than others (Deagle et al. 2014;
Thomsen & Willerslev 2015). This may limit the detections to species with higher primer
Page 12 of 42
https://mc06.manuscriptcentral.com/genome-pubs
Genome

Draft
binding affinity, resulting in species diversity being underrepresented (Shokralla et al. 2012).
Lee et al. (2015) found the primers used in this study exhibited no strong amplification bias
across mammal species (from Peninsular Malaysia), but the test only included a limited
number of species (41).
One further uncertainty in the use of blowfly-derived DNA for mammal diversity
assessments is potential blowfly feeding biases and dispersal distances. Surprisingly the
blowfly traps did not detect Macaca fascicularis, the long-tailed macaque, at UGFR and TFR
despite our frequent observation of numerous individuals at the site throughout the sampling
period. Nevertheless, the blowfly traps at UGFR did detect a different primate -
Trachypithecus obscurus [BOLD:AAI0540], the dusky leaf monkey, which is a near
threatened species (IUCN 2015). This species is known to occur in the vicinity of UGFR, but
had not been reported from the reserve itself. It is possible, however, that the blowflies fed on
T. obscurus tissue or faeces outside UGFR before moving into our sampling area. The few
studies on blowfly dispersal (from temperate and subtropical regions - Braack & Retief 1986;
Smith & Wall 1998; Tsuda et al. 2009) suggested individuals travel 100-2,400 m per day, but
there is no data available on blowfly travelling distances in the tropics. It is also not known
whether blowflies, as opportunistic feeders (Calvignac-Spencer et al. 2013), are more likely
to have fed on carcasses, wounds, or faeces. All field methods recovered a low percentage of
their potentially detectable species from the UGFR checklist (2-10%), which may be an
artefact of the short sampling period and restricted spatial scale of sampling relative to the
total size of forest reserve, rather than feeding or primer biases. However, UGFR has more
than 20 years of logging history (Nor Hashim & Ramli 2013), and megafauna recorded in
1961 (Medway 1966), such as E. maximus, is highly likely to be extirpated as no records of
activities or populations have been published since.
Another current limitation of the blowfly-derived DNA approach is the reliance on public
DNA databases to assign detected species formal species names (Collins & Cruickshank
2013). Five out of 14 wild mammal species (36%) detected at UGFR and six out of 20
species (30%) detected at TFR could not be assigned traditional species names. For example,
Rattus [under BIN - BOLD:AAB2208] detected from blowfly-derived DNA, cage traps, and
scat collection likely represents Rattus “sp. R3” (Pages et al. 2010), a classic “dark taxon”
(see Wilson et al. 2014) whereby it has not yet been formally described and is likely to be
reported as R. andamanensis, R. argentiventer, or R. tanezumi in studies relying on visual
Page 13 of 42
https://mc06.manuscriptcentral.com/genome-pubs
Genome

Draft
diagnosis (Robins et al. 2007; Pages et al. 2010; Latinne et al. 2013; Li et al. 2015). The BIN
associated with this taxon comprises DNA barcode members under the traditional names
Rattus tanezumi, Rattus tiomanicus, Rattus rattus, Rattus sp., and Rattus sp. abtc47994 in
BOLD. The two DNA barcodes named Rattus rattus (JF459864 and JF459865 in GenBank)
had been flagged earlier as problematic and attributed to misidentification or contamination
(Shen et al. 2013). In addition, Rhinolophus sp. 25Ne showed no species-level match (>98%)
in BOLD despite many bat DNA barcodes from Peninsular Malaysia being present in BOLD
(Lim & Wilson 2015). Sus sp. 4Ba, detected at TFR, also showed no species-level match
(>98%) in BOLD, despite the presence of 218 DNA barcodes of Sus, suggesting a cryptic
species. We could only assign formal genus names to DNA metabarcodes detected from
blowfly-derived DNA, whose closest matches were Callosciurus notatus [under BIN -
BOLD:AAF8467] (93-94% sequence similarity), and Paradoxurus hermaphroditus
(KC894743 in GenBank; only two sequences of ≤421 bp available in BOLD, so there is no
BIN) (95%). The 205 bp DNA mini-barcode region amplified by the primers used in this
study was successful in distinguishing 94% of 113 examined mammal species from
Peninsular Malaysia (mined from GenBank) in a previous study by Lee et al. (2015),
including separating 26 “dark” bat taxa.
The utility of blowfly-derived DNA in identifying threatened mammal species in tropical
forests remains questionable. However, this is also true for other field methods (e.g. cage
traps, mist nets, and scat collection used in our study) that rely on DNA-based identification
for accurate assignment of formal species names (Wilson et al. 2014). As species boundaries
are increasingly being refined and recognised on the basis of molecular data, especially for
species-rich groups (Francis et al. 2010; Pages et al. 2010), but even for charismatic
megafauna (Wilting et al. 2015), field methods that rely solely on visual diagnosis (e.g.
camera traps) will have increasingly limited utility. It also remains to be seen whether
blowfly-derived DNA can yield nuclear DNA of appropriate quality for individual
identification (Calvignac-Spencer et al. 2013). Currently, camera trapping is the most popular
approach to monitor populations of mammal species, but this is restricted to species that have
individuals with unique markings (e.g. spotted and striped felids; Henschel & Ray 2003;
Maffei et al. 2005; Hedges et al. 2015a), or to individuals that can be marked prior to camera
trapping (Trolle & Kery 2003; Rowcliffe et al. 2008).
Page 14 of 42
https://mc06.manuscriptcentral.com/genome-pubs
Genome

Draft
At UGFR the sampling completeness ratio for all field methods exceeded 0.86, while at TFR
the sampling completeness ratio of camera traps was 1 and of blowfly traps was 0.79. This
suggested that with further sampling, blowfly traps may continue to detect a higher number
of species. One reason for the high values for sampling completeness of the traditional field
methods, despite low detection of the known species present, could be the limited distribution
of traps over representative habitats in the study site, as some mammal species may be
restricted to specific habitat types (Geier & Best 1980; Goulart et al. 2009). The dispersal of
blowflies could, in theory, overcome the problem of localised trap placement as blowflies
will disperse across all habitat types (Norris 1965). This could explain the detection of T.
obscurus in blowfly traps as noted above. Alternatively, for all the field methods, except
blowfly traps and potentially hair traps and scat collection, it is relatively safe to conclude
that the species detected was present at the precise location of the trap during a known (short)
time interval.
Deciding on the most cost-effective technique to conduct a mammal diversity assessment in
tropical forests depends on many factors. For example, blowfly traps are more prone to
damage but can be easily replaced at low cost (< $1 each). During our study, six blowfly
traps were lost, as opposed to four cage traps ($3 each) and two camera traps ($250 each).
Camera traps may be more prone to theft than blowfly traps, and can leave a significant
financial dent in the project when that happens (high-end camera traps can cost up to $1000;
Rovero et al. 2013), but are less prone to damage. Nonetheless, there is high initial cost
involved in purchasing reagents and equipment for DNA-based detection (DNA extraction,
PCR, and next generation sequencing), as well as personnel costs for analysing samples.
However, species identification of bats detected from mist nets and harp traps, and rodents
detected from cage traps (as exemplified by the case of Rattus [BOLD:AAB2208]) with an
acceptable degree of accuracy also requires DNA barcoding (Wilson et al. 2014), together
with the associated costs. High-throughput-sequencing can now be outsourced to private
companies and/or research institutes at increasingly competitive rates (see Brandon-Mong et
al. 2015).
Conclusion
We have shown that blowfly-derived DNA is a feasible technique for mammal diversity
assessments, especially when considering that a high number of species and orders were
detected relative to traditional methods. Blowfly-derived DNA can potentially overcome
Page 15 of 42
https://mc06.manuscriptcentral.com/genome-pubs
Genome

Draft
ecological and taxonomical challenges associated with traditional methods when detecting
threatened and rare or previously unrecorded species. While the sampling completeness ratios
obtained from blowfly traps indicates a potential to detect more species with greater sampling
effort, the lack of overlap in species detected by different field methods indicates employing
multiple field methods may be the fastest way to obtain a representative account of species.
Some uncertainties in the use of blowfly-derived DNA remain, such as the impact of blowfly
dispersal, biases in primer binding affinity, and lack of a comprehensive and taxonomically-
consistent DNA barcode reference library. With further calibration to address these
uncertainties, blowfly-derived DNA may join the list of traditional field methods used to
assess mammal diversity in tropical forests.
Acknowledgements
This study was supported by grants from the Nagao Natural Environment Foundation Japan
to LPS and the Ministry of Higher Education Fundamental Research Grant Scheme (FP042-
2014A) to JJW, GRC, and Yong Kien Thai (University of Malaya). GHM is grateful to the
Monash University Malaysia Tropical Medicine and Biology Platform for financial and
infrastructure support. GRC is grateful to permits from the Economic Planning Unit (Permit
no: 3747), Department of Wildlife and National Parks for Project Harimau Selamanya
[Rujukan kami: JHPL&TN(P)/80-4/2 Jld. 18(7)], Department of Forestry [Rujukan kami:
JH/100Jld. 8(16)], and financial support from the Woodland Park Zoo-Panthera Wildcat
Conservation Grant. The collaboration between the University of Malaya and Monash
University Malaysia falls under an MoA. Yong Kien Thai provided advice and suggestions
on an earlier version of this manuscript. Lee Yoon Hin and Tee Ah Jee provided assistance
during fieldwork. Sing Kong Wah, Brandon Mong Guo Jie, and Thary Goh Gazi provided
advice and suggestions during laboratory work. Lam Wai Yee, Foon Junn Kitt, and Sri
Venkateswara Rao from Project Harimau Selamanya provided advice and technical
assistance during camera trapping. This project was presented at the 6th International Barcode
of Life Conference as part of an Institutional Links Program (Queen Mary University of
London-University of Malaya) supported by the Newton-Ungku Omar Fund.
Page 16 of 42
https://mc06.manuscriptcentral.com/genome-pubs
Genome
Draft
References
Abu, N.A.C. 2007. Kajian perbandingan kepelbagaian tikus di 3 kawasan hutan simpan
berbeza (Gombak, Kenaboi, Johor). B.Sc. thesis, Institute of Biological Sciences,
University of Malaya, Kuala Lumpur.
AMNH (American Museum of Natural History). 2013. Wing punch and hair sampling
protocols. Available from http://research.amnh.org/vz/mammalogy/donating-bat-tissue-
and-hair-samples-genomic-and-stableisotope-studies/wing-punch-and-hair-sampling.
[accessed 4 March 2015].
Aziz, A.A. 2010. Ecology and morphology of shrews in PPL, Ulu Gombak. B.Sc. thesis,
Institute of Biological Sciences, University of Malaya, Kuala Lumpur.
Azwandi, A., Nina Keterina, H., Owen, L.C., Nurizzati, M.D., and Omar, B. 2013. Adult
carrion arthropod community in a tropical rainforest of Malaysia: analysis on three
common forensic entomology animal models. Trop. Biomed. 30(Suppl 3): 481-494.
Beja Pereira, A., Oliveira, R., Alves, P.C., Schwartz, M.K., and Luikart, G. 2009. Advancing
ecological understandings through technological transformations in noninvasive
genetics. Mol. Ecol. Resour. 9(5): 1279-1301. doi:10.1111/j.1755-0998.2009.02699.x.
Bernard, H. 2003. Bait preferences of some small mammal species of North Borneo based on
line-trapping with wire-mesh cage traps. Sabah Parks Nat. J. 6: 27-44.
Bernard, H., Ahmad, A.H., Brodie, J., Giordano, A.J., Lakim, M., Amat, R., Koh, S.P.H., Lee,
S.K., Tuuga, A., Malim, P.T., Lim-Hasegawa, D., Yap, S.W., and Sinun, W. 2013.
Camera-trapping survey of mammals in and around Imbak Canyon conservation area in
Sabah, Malaysian Borneo. Raffles. Bull. Zool. 61(2): 861-870.
Bertrand, Y., Pleijel, F., and Rouse, G.W. 2006. Taxonomic surrogacy in biodiversity
assessments, and the meaning of Linnaean ranks. Syst. Biodivers. 4: 149-159.
Braack, L.E.O., and Retief, P.F. 1986. Dispersal, density, and habitat preference of the blow-
flies Chrysomyia albiceps (Wd.) and Chrysomyia marginalis (Wd.) (Diptera:
Calliphoridae). Onderstepoort. J. Vet. Res. 53: 13-18.
Page 17 of 42
https://mc06.manuscriptcentral.com/genome-pubs
Genome
Draft
Brandon-Mong, G.J., Gan, H.M., Sing, K.W., Lee, P.S., and Wilson, J.J. 2015. DNA
metabarcoding of insects and allies: an evaluation of primers and pipelines. Bull. of
Entomol. Res. 7: 1-11. doi:10.1017/S0007485315000681.
Bonvicino, C.R., and Bezerra, A.M.R. 2003. Use of regurgitated pellets of Barn Owl (Tyto
alba) for inventory small mammals in the Cerrado of central Brazil. Stud. Neotrop.
Fauna E. 38: 1-5. doi:10.1076/snfe.38.1.1.14030.
Buś, M.M., Żmihorski, M., Romanowski, J., Balčiauskienė, L., Cichocki, J., and Balčiauskas,
L. 2014. High efficiency protocol of DNA extraction from Micromys minutes mandibles
from owl pellets: a tool for molecular research of cryptic mammal species. Acta Theriol.
59: 99-109. doi:10.1007/s13364-013-0144-y.
Calvignac-Spencer, S., Leendertz, F.H., Gilbert, M.T.P., and Schubert, G. 2013. An
invertebrate stomach’s view on vertebrate ecology. Bioessays 35: 1004-1013.
doi:10.1002/bies.201300060.
Calvignac-Spencer, S., Merkel, K., Kutzner, N., Kühl, H., Boesch, C., Kappeler, P.M.,
Metzger, S., Schubert, G., and Leendertz, F.H. 2012. Carrion fly-derived DNA as a tool
for comprehensive and cost-effective assessment of mammalian biodiversity. Mol. Ecol.
22: 915-924. doi:10.1111/mec.12183.
Castro-Arellano, I., Madrid-Luna, C., Lacher, T.E., and Léon-Paniagua, L. 2008. Hair-trap
efficacy for detecting mammalian carnivores in the tropics. J. Wildl. Managemt., 72:
1405-1412. doi:http://dx.doi.org/10.2193/2007-476.
Catling, P.C., Burt, R.J., and Kooyman, R. 1997. A comparison of techniques used in a
survey of the ground-dwelling and arboreal mammals in forests in North-eastern New
South Wales. Wildl. Res. 24: 417-432.
Chao, A. 1984. Nonparametric estimation of the number of classes in a population. Scand. J.
Stat. 11(4): 265-270.
Clements, G.R. 2013. The environmental and social impacts of roads in Southeast Asia. Ph.D.
thesis, School of Marine and Tropical Biology, James Cook University, Australia.
Available from http://researchonline.jcu.edu.au/31888. [accessed 8 July 2015].
Page 18 of 42
https://mc06.manuscriptcentral.com/genome-pubs
Genome
Draft
Collins, R.A., and Cruickshank, R.H. 2013. The seven deadly sins of DNA barcoding. Mol.
Ecol. Resour., 13(6): 969-975. doi:10.1111/1755-0998.12046
Colwell, R.K. 2006. EstimateS: statistical estimation of species richness and shared species
from samples. Version 9.1.0. Available from http://purl.oclc.org/estimates. [accessed 10
February 2015].
Daim, M.S. 2002. The care and management of domesticated elephants in Malaysia. In
Giants on our hands: proceedings of the international workshop on the domesticated
Asian elephant, 5-10 Feb 2001. Edited by I. Baker and M. Kashio. FAO Regional
Office for Asia and the Pacific (RAPA), Bangkok.
Davison, A., Birks, J.D.S., Brookes, R.C., Braithwaite, T.C., and Messenger, J.E. 2006. On
the origin of faeces: morphological versus molecular methods for surveying rare
carnivores from their scats. J. Zool. 257(2): 141-143.
Deagle, B.E., Jarman, S.N., Coissac, E., Pompanon, F., and Taberlet, P. 2014. DNA
metabarcoding and the cytochrome c oxidase subunit I marker: not a perfect match.
Biol. Letters 10: 20140562. doi:10.1098/rsbl.2014.0562.
DTCP, and DOF (Department of Town and Country Planning & Department of Forestry).
2012. Central Forest Spine: summary of master plan for ecological linkages. DTCP,
Kuala Lumpur.
DWNP. 2010. Red list Of Mammals for Peninsular Malaysia. Department of Wildlife and
National Parks Peninsular Malaysia, Kuala Lumpur. pp. 1-150.
Ebert, C., Huckschlag, D., Schulz, H.K., and Hohmann, U. 2010. Can hair traps sample wild
boar (Sus scrofa) randomly for the purpose of non-invasive population estimation? Eur.
J. Wildl. Res. 56(4): 583-590.
Fontúrbel, F.E. 2010. A methodological approach to assess the small mammal community
diversity in the temperate rainforest of Patagonia. Mamm Biol. 75: 294-301.
Francis, C.M. 2008. A field guide to the mammals of South-East Asia. New Holland
Publishers, United Kingdom.
Francis, C.M., Borisenko, A.V., Ivanova N.V., Eger, J.L., Lim, B.K., Guillen-Servent, A.,
Kruskop, S.V., Mackie, I., and Hebert, P.D.N. 2010. The roles of DNA barcodes in
Page 19 of 42
https://mc06.manuscriptcentral.com/genome-pubs
Genome
Draft
understanding and conservation of mammal diversity in Southeast Asia. PLoS ONE
5(9): e12575. doi:10.1371/journal.pone.0012575.
Garden, J.C., McAlpine, C.A., Possingham, H.P., and Jones, D.N. 2007. Using multiple
survey methods to detect terrestrial reptiles and mammals: what are the most successful
and cost-efficient combinations? Wildl. Res., 34: 218- 227.
Geier, A.R., and Best, L.B. 1980. Habitat selection by small mammals of riparian
communities: evaluating effects of habitat alterations. J. Wildl. Managemt. 44(1): 16-24.
Gese, E.M. 2001. Monitoring of terrestrial carnivore populations. USDA National Wildlife
Research Center - Staff Publications. Paper 576. Available from
http://digitalcommons.unl.edu/icwdm_usdanwrc/576. [accessed 20 August 2015].
Goulart, F.V.B., Cáceres, N.C., Graipel, M.E., Tortato, M.A., Ghizoni, Jr. IR., and Oliveira-
Santos, L.G.R. 2009. Habitat selection by large mammals in a southern Brazilian
Atlantic Forest. Mamm. Biology. 74(3): 182-190.
Hanif-Ridzuan, M.D., Nur-Aida, M.T., Wan-Nurainie, W.I., Zahirunisa, R., Madinah, I., and
Abdullah, M.T. 2010. Species diversity, richness and abundance of small mammals in
Endau Kluang, Johor, Malaysia. In Proceedings of National Biodiversity Seminar 2010.
Harmsen, B.J., Foster, R.J., Silver, S., Ostro, L., and Doncaster, C.P. 2010. Differential use of
trails by forest mammals and the implications for camera-trap studies: a case study from
Belize. Biotropica 42: 126-133. doi:10.1111/j.1744-7429.2009.00544.x.
Hassan, N. 2009. Kepelbagaian order rodentia & scandentia di 3 altitud berbeza. B.Sc. thesis,
Institute of Biological Sciences, University of Malaya, Kuala Lumpur.
Hedges, L., Clements, G.R., Aziz, S.A., Yap, W., Laurance, S., Goosem, M., and Laurance,
W.F. 2013 Small carnivore records from a threatened habitat linkage in Terengganu,
Peninsular Malaysia. Small Carnivores Conservation 49: 9-14.
Hedges, L., Lam, W.Y., Campos-Arceiz, A., Mark Rayan, D., Laurance, W.F., Latham, C.J.,
Saaban, S., and Clements, G.R. 2015a. Melanistic leopards reveal their spots: infrared
cameras provide a population-density estimate of leopards in Malaysia. J. Wildl.
Managemt. 79: 846-853.
Page 20 of 42
https://mc06.manuscriptcentral.com/genome-pubs
Genome

Draft
Hedges, L., Morrant, D.S., Campos-Arceiz, A., and Clements, G.R. 2015b. Feasibility of
using scent-baited hair traps to monitor carnivore populations in Peninsular Malaysia.
Trop. Conserv. Sci. 8(4): 975-982.
Heller, K.G., and Volleth, M. 1989. Fledermäuse aus Malaysia. 1. Beobachtungen zur
Biologie, Morphologie und Taxonomie. Senck. Biol. 69: 243-276.
Heller, K.G., and Volleth, M. 1995. Community structure and evolution of insectivorous bats
in the Paleotropics and Neotropics. J. Trop. Ecol. 11: 429-442.
Henschel, P., and Ray, J. 2003. Leopards in African Rainforests: Survey and Monitoring
Techniques. Wildlife Conservation Society, New York, NY.
Hill, J.E. 1972. New records of Malayan bats, with taxonomic notes and the description of a
new Pipistrellus. Bull. Brit. Mus. Nat. Hist. Zool. 23: 23-42.
Hill, J.E. 1974. New records of bats from South-eastern Asia,with taxonomic notes. Bull. Brit.
Mus. Nat. Hist. Zool. 27: 127-138.
Hoppe-Dominik, B., Kühl, H.S., Radl, G., and Fischer, F. 2011. Long-term monitoring of
large rainforest mammals in the biosphere reserve of Tai National Park, Côte d’Ivoire.
Afr. J. Ecol. 49: 450-458.
Iknayan, K.J., Tingley, M.W., Furnas, B. J., and Beissinger, S.R. 2014. Detecting diversity:
emerging methods to estimate species diversity. Trends Ecol. Evol. 29: 97-106. doi:
10.1016/j.tree.2013.10.012.
IUCN (International Union for Conservation of Nature). 2015. IUCN Red List of Threatened
Species. Available from http://www.iucnredlist.org. [accessed 6 June 2015].
Ivanova, N.V., Clare, E.L., and Borisenko, A.V. 2012. DNA barcoding in mammals.
Methods Mol. Biol. 858: 153-182.
James, M.T. 1947. The flies that cause myiasis in man (No. 631). Department of Agriculture,
United States.
Jayaraj, V.K., Daud, S.H.M., Azhar, M-I., Sah, S.A.M., Mokhtar, S.I., and Abdullah, M.T.
2013. Diversity and conservation status of mammals in Wang Kelian State Park, Perlis,
Malaysia. Check List 9(6): 1439-1448.
Page 21 of 42
https://mc06.manuscriptcentral.com/genome-pubs
Genome

Draft
Jayaraj, V.K., Tahir, N.F.D.A., Udin, N.A., Baharin, N.F.K., Ismail, S.K., and Zakaria, S.N.A.
2012. Species diversity of small mammals at Gunung Stong State Park, Kelantan,
Malaysia. J. Threat. Taxa 4(6): 2617-2628.
Jenkins, P.D., and Hill, J.E. 1981. The status of Hipposideros galeritus Cantor, 1846 and
Hipposideros cervinus (Gould, 1854) (Chiroptera: Hipposideridae). Bull. Brit. Mus. Nat.
Hist. Zool. 27: 127-138.
Kingston, T., Francis, C.M., Zubaid, A., and Kunz, T.H. 2003. Species richness in an
insectivorous bat assemblage from Malaysia. J. Trop. Ecol. 19: 67-79.
Kuenzi, A.J., and Morrison, M.L. 1998. Detection of bats by mist-nets and ultrasonic sensors.
Wildl. Soc. Bull. 26: 307-311.
Latinne, A., Waengsothorn, S., Rojanadilok, P., Eiamampai, K., Sribuarod, K., and Michaux,
J.R. 2013. Diversity and endemism of Murinae rodents in Thai limestone karsts. Syst.
Biodivers. 11: 323-344.
Lee, P.S., Sing, K.W., and Wilson, J.J. 2015. Reading mammal diversity from flies: the
persistence period of amplifiable mammal mtDNA in blowfly guts (Chrysomya
megacephala) and a new DNA mini-barcode target. PLoS ONE 10(4): e0123871.
doi:10.1371/journal.pone.0123871.
Li, J., Zheng, X., Cai, Y., Zhang, X., Yang, M., and Yue, B. 2015. DNA barcoding of
Murinae (Rodentia: Muridae) and Arvicolinae (Rodentia: Cricetidae) distributed in
China. Mol. Ecol. Resour. 15(1): 153-167.
Lim, B.L., Muul, I., and Chai, K.S. 1977. Zoonotic studies of small animals in the canopy
transect at Bukit Lanjan Forest Reserve, Selangor, Malaysia. Malay. Nat. J. 31: 127-140.
Lim, V.C., and Wilson, J.J. 2015. Progress in DNA barcoding the bats of Peninsular Malaysia.
Genome 58: 246.
Madinah, A., Fatimah, A., Mariana, A., and Abdullah, M.T. 2011. Ectoparasites of small
mammals in four localities of wildlife reserves in Peninsular Malaysia. Southeast Asian
J. Trop. Med. 42(4): 803-813.
Page 22 of 42
https://mc06.manuscriptcentral.com/genome-pubs
Genome

Draft
Maffei, L., Noss, A.J., Cuellar, E., and Rumiz, D.I. 2005. Ocelot (Felis pardalis) population
densities, activity and ranging behaviour in the dry forests of eastern Bolivia: data from
camera trapping. J. Appl. Ecol. 45: 1228-1236.
Medway, L. 1965. Mammals of Borneo. Field keys and annotated checklist. Malaysian
Branch of the Royal Asiatic Society, Kuala Lumpur.
Medway, L. 1966. The Ulu Gombak Field Studies Centre. Malay. Scient. 2: 1-16.
Medway, L. 1967. A bat-eating, Megaderma lyra Geoffroy. Malay. Nat. J. 20: 107-110.
Medway, L. 1983. The Wild Mammals of Malaya (Peninsular Malaysia and Singapore). 2nd
edn. Oxford University Press, Kuala Lumpur.
Meijaard, E., Mengersen, K., Buchori, D., Nurcahyo, A., Ancrenaz, M., Wich, S., Suci, S.,
Atmoko, U., Tjiu, A., Prasetyo, D., Nardiyono Hadiprakarsa,Y., Christy, L., Wells, J.,
Albar, G., and Marshall, A.J. 2011. Why don’t we ask ? A complementary method for
assessing the status of great apes. PLoS ONE 6(3): e18008.
doi:10.1371/journal.pone.001808.
Mohd-Azlan , J., Belant, J.L., and Meijaard, E. 2013. Can secondary information inform
about population trends of carnivores in Borneo? Raffles Bull. Zool. S28: 1-8.
Mukherjee, S., Ashalakshmi, C.N., Home, C., and Ramakrishnan, U. 2010. An evaluation of
the PCR-RFLP technique to aid molecular-based monitoring of felids and canids in
India. BMC Res. Notes 3: 159. doi:10.1186/1756-0500-3-159.
Mullins, J., Statham, M., Roche, T., Turner, P., O’Reilly, C. 2009. Remotely plucked hair
genotyping: a reliable and non-invasive method for censusing pine marten (Martes
martes, L. 1758) populations. Eur. J. Wildl. Res. 5(3): 443-453.
Mumma, M.A., Soulliere, C.E., Mahoney, S.P., and Waits, L.P. 2014. Enhanced
understanding of predator-prey relationships using molecular methods to identify
predator species, individual and sex. Mol. Ecol. Resour. 14(1): 100-108.
Nor Hashim, E., and Ramli, R. 2013. Comparative study of understorey birds diversity
inhabiting lowland rainforest virgin jungle reserve and regenerated forest. Sci. World J.
676507. doi:10.1155/2013/676507.
Page 23 of 42
https://mc06.manuscriptcentral.com/genome-pubs
Genome

Draft
Norris, K.R. 1965. The bionomics of blow flies. Ann. Rev. Entomol. 10: 47-48.
Pages, M., Chaval, Y., Herbreteau, V., Waengsothorn, S., Cosson, J.F., Hugot, J.P., Morand,
S., and Michaux, J. 2010. Revisiting the taxonomy of the Rattini tribe: a phylogeny-
based delimitation of species boundaries. BMC Evol. Biol. 10: 184.
Payne, J., and Francis, C.M. 2005. A Field Guide to the Mammals of Borneo. The Sabah
Society, Kota Kinabalu.
Picard, C.J., and Wells, J.D. 2010. The population genetic structure of North American
Lucilia sericata (Diptera: Calliphoridae), and the utility of genetic assignment methods
for reconstruction of postmortem corpse relocation. Forensic Sci. Int. 195(1): 63-67.
Ratnasingham, S., and Hebert, P.D.N. 2007. Bold: The Barcode of Life Data System
(http://www.barcodinglife.org). Mol. Ecol. Notes 7(3): 355-364.
Roberts, N.J. 2011. Investigation into survey techniques of large mammals: Surveyor
competence and camera-trapping vs. transect-sampling. Biosci. Horiz. 4: 40-49.
Robins, J., Hingston, M., Matisoo-Smith, E., and Ross, H. 2007. Identifying Rattus species
using mitochondrial DNA. Mol. Ecol. Notes 7: 717-729.
Rocha, R.G., Justino, J., Leite, Y.L.R., and Costa, L.P. 2015. DNA from owl pellet bones
uncovers hidden biodiversity. Syst. Biodivers. 13(4): 403-412. doi:
10.1080/14772000.2015.1044048.
Rodzuan, S.N. 2006. Diversity of small mammals of Ulu Gombak Forest Reserve and
Kenaboi Forest Reserve. B.Sc. thesis, Institute of Biological Sciences, University of
Malaya, Kuala Lumpur.
Rovero, F., Zimmermann, F., Berzi, D., and Meek, P. 2013. “Which camera trap type and
how many do I need?” A review of camera features and study designs for a range of
wildlife research applications. Hystrix 24: 1-9.
Rowcliffe, J.M., Field, J., Turvey, S.T. and Carbone, C. 2008. Estimating animal density
using camera traps without the need for individual recognition. J. Appl. Ecol. 45: 1228-
1236. doi: 10.1111/j.1365-2664.2008.01473.x.
Sanderson, J.G., and Trolle, M. 2005. Monitoring elusive mammals. Am. Sci. 93: 148-155.
Page 24 of 42
https://mc06.manuscriptcentral.com/genome-pubs
Genome

Draft
Schmieder, R. and Edwards, R. 2011. Quality control and preprocessing of metagenomic
datasets. Bioinformatics 27(6): 863-864.
Schnell, I.B., Sollmann, R., Calvignac-Spencer, S., Siddall, M.E., Yu, D.W., Wilting, A., and
Gilbert, M.T.P. 2015. iDNA from terrestrial haematophagous leeches as a wildlife
surveying and monitoring tool - prospects, pitfalls and avenues to be developed.
Frontiers Zool. 12: 24.
Schnell, I.B., Thomsen, P.F., Wilkinson, N., Rasmussen, M., Jensen, L.R., Willerslev, E.,
Bertelsen, M.F., and Gilbert, M.T. 2012. Screening mammal biodiversity using DNA
from leeches. Curr. Biol. 22: R262-R263.
Schnur, H.J., Zivotofsky, D., and Wilamowski, A. 2009. Myiasis in domestic animals in
Israel. Vet. Parasitol. 161(3): 352-355.
Sharma, D.S.K., Siong, B.L.M., Mohd Azlan, J., and Ahmad Zafir, A.W. 2005. Living in
harmony: resolving conflicts between people and tigers and FELDA Jerangau Barat,
Peninsular Malaysia. WWF-Malaysia, Petaling Jaya, Malaysia.
Shen, Y.Y., Chen, X., and Murphy, R.W. 2013. Assessing DNA barcoding as a tool for
species identification and data quality control. PLoS ONE 8(2): e57125.
Shokralla, S., Spall, J.L., Gibson, J.F., and Hajibabaei, M. 2012. Next-generation sequencing
technologies for environmental DNA research. Mol. Ecol. 21: 1794–1805.
Silveira, L., Jácomo, A.T.A., and Diniz-Filho, J.A.F. 2003. Camera trap, line transect census
and track surveys: a comparative evaluation. Biol. Cons. 114: 351-355.
Sing, K.W., Syaripuddin, K., and Wilson, J.J. 2013. Changing perspectives on the diversity of
bats (Chiroptera) at Ulu Gombak since the establishment of the Field Studies Centre in
1965. Raffles Bull. Zool. S29: 211-217.
Sly, G.R. 1975. Second record of the Bronzed Tube-nosed Bat (Murina aenea) in Penisular
Malaysia. Malay. Nat. J. 28: 217.
Smith, K.E., and Wall, R. (1998) Estimates of population density and dispersal in the blowfly
Lucilia sericata (Diptera: Calliphoridae). Bull. Entomol. Res. 88: 65-73.
doi:10.1017/S0007485300041560.
Page 25 of 42
https://mc06.manuscriptcentral.com/genome-pubs
Genome
Draft
Soberón, J.M., Llorente, J.B., Onate, L., 2000. The use of specimen label databases for
conservation purposes: an example using Mexican Papilionid and Pierid butterflies.
Biodivers. Conserv. 9: 1441-1466.
Souza, D.P., Asfora, P.H., Lira, T.C., and Astúa, D. 2010. Small mammals in Barn Owl (Tyto
alba Aves, Strigiformes) pellets from northeastern Brazil, with new records of
Gracilinanus and Cryptonanus (Didelphimorphia, Didelphidae). Mammal. Biol. 75:
370-374.
Spradbery, J.P., and Vanniasingham, J.A. 1980. Incidence of the screw-worm fly, Chrysomya
bezziana, at the Zoo Negara, Malaysia. Malaya Vet. J. 7: 28-32.
Stanton, M.A., and Anderson, J.A. 1998. A survey of ground-dwelling mammals inhabiting
forests of the southwestern slopes, New South Wales. Aust. Zool. 30(4): 480.
Stoner, K.E., and Timm, R.M. 2004. Tropical dry-forest mammals of Palo Verde: Ecology
and conservation in a changing landscape. In Biodiversity Conservation in Costa Rica:
Learning the lessons in a seasonal dry forest. Edited by G.W. Frankie, A. Mata, and V.S.
Bradleigh. University of California Press, USA.
Syakirah, S., Zubaid, A., Prentice, C., Lopez, A., Azmin, M.R., and Mohd Yusof, A. 2000. A
small mammal survey at Tasek Bera, Pahang, Malaysia’s first Ramsar site. Malay. Nat.
J. 54(1): 31-41.
Syaripuddin, K. 2012. Study of diversity of bat at three different elevations using two
different techniques. B.Sc. thesis, Institute of Biological Sciences, University of Malaya,
Kuala Lumpur.
Syaripuddin, K., Kumar, A., Sing, K.W., Halim, M.R.A., Nursyereen, M.N., and Wilson, J.J.
2014. Mercury accumulation in bats near hydroelectric reservoirs in Peninsular
Malaysia. Ecotoxicology 23(7): 1164-71.
Teta, P., González-Fischer, C.M., Codesido, M., and Bilenca, D.N. 2010. A contribution from
Barn Owl pellets analysis to known micromammalian distributions in Buenos Aires
province, Argentina. Mammalia 74: 97-103.
Thomsen, P.T., and Willerslev, E. 2015. Environmental DNA - an emerging tool in
conservation for monitoring past and present biodiversity. Biol. Conserv. 183: 4-18.
Page 26 of 42
https://mc06.manuscriptcentral.com/genome-pubs
Genome
Draft
Tidemann, C.R., and Woodside, D.P. 1978. A collapsible bat-trap and a comparison of results
obtained with the trap and with mistnets. Aust. Wildl. Res. 5: 355-362.
Tingga, R.C.T., Anwarali, F.A.K., Mohd Ridwan, A.R., Senawi, J., and Abdullah, M.T.
2012. Small mammals from Kuala Atok-Taman Negara, Pahang. Sains Malays. 41(6):
659–669.
Tobler, M. 2012. Camera Base. Available from http://www.atrium-
biodiversity.org/tools/camerabase. [accessed 8 July 2015].
Torre, I., Arrizabalaga, A., and Flaquer, C. 2004. Three methods for assessing richness and
composition of small mammal communities. J. Mammal. 85: 524-530.
Torre, I., Guixe, D., and Sort, F. 2010. Comparing three live trapping methods for small
mammal sampling in cultivated areas of Ne Spain. Hystrix 21(2): 147-155.
Trolle, M. and Kery, M. 2003. Estimation of ocelot density in the Pantanal using capture–
recapture analysis of camera trapping data. J. Mammal. 84: 607-614.
Tsuda, Y., Hayashi, T., Higa, Y., Hoshino, K., Kasai, S., Tomita, T., Kurahashi, H., and
Kobayashi, M. 2009. Dispersal of a blow fly, Celliphore nigribesis, in relation to the
dissemination of highly pathogenic avian influenza virus. Jpn. J. Infect. Dis. 62: 294-
297.
Valderrama, X., Karesh, W.B., Wildman, D.E., and Melnick, D.J. 1999. Noninvasive
methods for collecting fresh hair tissue. Mol. Ecol. 8(10): 1749-1750.
Vynne, C., Baker, M.R., Breuer, Z.K., and Wasse, S.K. 2012. Factors influencing
degradation of DNA and hormones in Maned wolf scat. Anim. Conserv. 15: 184-194.
doi:10.1111/j.1469-1795.2011.00503.x
Wilson, J.J. 2012. DNA barcodes for insects. In DNA Barcodes: Methods and Protocols.
Edited by W.J. Kress and D.L. Erickson. Springer, New York. pp. 17-46.
Wilson, J.J., Rougerie, R., Schonfeld, J., Janzen, D.H., Hallwachs, W., Hajibabaei, M.,
Kitching, I.J., Haxaire, J., and Hebert, P.D.N. 2011. When species matches are
unavailable are DNA barcodes correctly assigned to higher taxa? An assessment using
sphingid moths. BMC Ecol. 11: 18.
Page 27 of 42
https://mc06.manuscriptcentral.com/genome-pubs
Genome
Draft
Wilson, J.J., Sing, K.W., Halim, M.R.A., Ramli, R., Hashim, R., and Sofian-Azirun, M. 2014.
Utility of DNA barcoding for rapid and accurate assessment of bat diversity in Malaysia
in the absence of formally described species. Genet. Mol. Res. 13(1): 920-925.
Wilting, A., Courtiol, A., Christiansen, P., Niedballa, J., Scharf, A.K., Orlando, L., Balkenhol
N, Hofer, H., Kramer-Schadt, S., Fickel, J., and Kitchener, A.C. 2015. Planning tiger
recovery: Understanding intraspecific variation for effective conservation. Sci. Adv.
1(5): e1400175.
Woods, J.G., Paetkau, D., Lewis, D., McLellan, B.N., Proctor, M., and Strobeck, C. 1999.
Genetic tagging of free-ranging black and brown bears. Wildl. Soc. Bull. 27: 616-627.
Xiao, J.H., Wang, N.X., Li, Y.W., Murphy, R.W., Wan, D.G., Niu, L.M. et al. 2010.
Molecular approaches to identify cryptic species and polymorphic species within a
complex community of fig wasps. PLoS ONE 5(11): e15067.
doi:10.1371/journal.pone.0015067
Yenbutra, S., and Felten, H. 1983. A new species of the fruit bat genus Megaerops from SE-
Asia (Mammalia: Chiroptera: Pteropodidae). Senck. Biol. 64(1-3): 1-11.
Yusof, M.D.N.N. 2005. Kajian kepelbagaian mamalia kecil di Hutan Simpan Ulu Gombak.
B.Sc. thesis, Institute of Biological Sciences, University of Malaya, Kuala Lumpur.
Zeale, M.R.K., Butlin, R.K., Barker, G.L.A., Lees, D.C., and Jones, G. 2011. Taxon-specific
PCR for DNA barcoding arthropod prey in bat faeces. Mol. Ecol. Res. 11: 236-244.
Zulkifli, N.M. 2011. Distribution and abundance of rat communities at different elevations.
B.Sc. thesis, Institute of Biological Sciences, University of Malaya, Kuala Lumpur.
Page 28 of 42
https://mc06.manuscriptcentral.com/genome-pubs
Genome

Draft
Table 1. Comparison of different field methods including targeted mammal groups,
advantages, disadvantages and cost.
Field method Targeted mammal
groups
Advantages Disadvantages Cost
Cage traps
Rodents,
insectivores
(Catling et al.
1997)
Operates 24 h
without
supervision
(Catling et al.
1997)
Difficult to
standardise
(varying
dimensions,
baited/un-baited
and deployment
location effects)
(Fontúrbel 2010;
Torre et al. 2010)
Medium (Garden
et al. 2007)
Mist nets
Frugivorous bats
(Stoner & Timm
2004)
Readily portable
(Kuenzi &
Morrison 1998)
Must be
monitored
constantly, as bats
can become
easily entangled
and must be freed
individually
(Kuenzi &
Morrison 1998)
Low (Kuenzi &
Morrison 1998)
Harp traps Insectivorous bats
(Kingston et al.
2003)
Does not require
constant
monitoring
(Tidemann &
Woodside 1978)
Bulky and not
easy to transport
(Tidemann &
Woodside 1978)
High (Tidemann
& Woodside
1978)
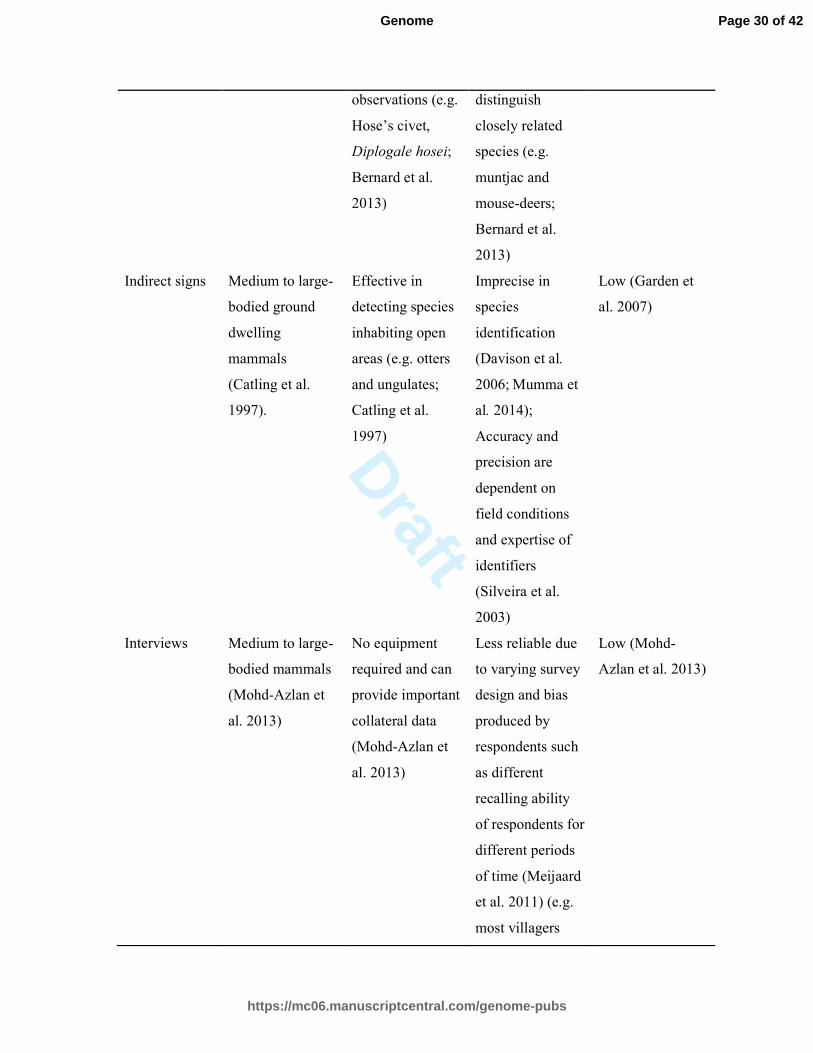
Camera traps Medium to large-
bodied mammals
(Bernard et al.
2013)
Effective in
detecting species
rarely recorded
from live traps or
direct
May under-
represent species
with specific
habitats and
unable to
High (Sanderson
& Trolle 2005)
Page 29 of 42
https://mc06.manuscriptcentral.com/genome-pubs
Genome
Draft
observations (e.g.
Hose’s civet,
Diplogale hosei;
Bernard et al.
2013)
distinguish
closely related
species (e.g.
muntjac and
mouse-deers;
Bernard et al.
2013)
Indirect signs
Medium to large-
bodied ground
dwelling
mammals
(Catling et al.
1997).
Effective in
detecting species
inhabiting open
areas (e.g. otters
and ungulates;
Catling et al.
1997)
Imprecise in
species
identification
(Davison et al.
2006; Mumma et
al. 2014);
Accuracy and
precision are
dependent on
field conditions
and expertise of
identifiers
(Silveira et al.
2003)
Low (Garden et
al. 2007)
Interviews Medium to large-
bodied mammals
(Mohd-Azlan et
al. 2013)
No equipment
required and can
provide important
collateral data
(Mohd-Azlan et
al. 2013)
Less reliable due
to varying survey
design and bias
produced by
respondents such
as different
recalling ability
of respondents for
different periods
of time (Meijaard
et al. 2011) (e.g.
most villagers
Low (Mohd-
Azlan et al. 2013)
Page 30 of 42
https://mc06.manuscriptcentral.com/genome-pubs
Genome

Draft
interviewed could
not recall how
many tigers have
been killed due to
livestock
depredation by
tigers; Sharma et
al. 2005)
Direct
observations
Medium to large-
bodied mammals
that are readily
observable (Gese
et al. 2001)
Can confirm
species presence
directly and
effectively detect
rare and
endangered
species (e.g.
black-footed
ferrets, Mustela
nigripes; Gese et
al. 2001)
The detection
success relies
much on the
protocols used
and expertise of
identifiers
(Hoppe-Dominik
et al. 2011;
Roberts 2011)
Low (Garden et
al. 2007)
Hair traps All ground-
dwelling
mammals
(Stanton &
Anderson 1998;
Castro-Arellano
et al. 2008)
Portable (Castro-
Arellano et al.
2008);
Reliable in
identifying
species through
genetic analysis
(Beja Pereira et
al. 2009; Mullins
et al. 2009)
Different trap
types used could
influence the
detection success
(Castro-Arellano
et al. 2008) such
as the use of hair-
traps with
mechanical
devices like barb
wire or attached
glue-like
substances that
rarely collect high
Low (Castro-
Arellano et al.
2008)
Page 31 of 42
https://mc06.manuscriptcentral.com/genome-pubs
Genome

Draft
proportions of
hairs with roots
(Valderrama et al.
1999; Ebert et al.
2010).
Invertebrate-
derived
mammal DNA
All mammals
(Calvignac-
Spencer et al.
2012; Schnell et
al. 2012;
Calvignac-
Spencer et al.
2013; Lee et al.
2015; Schnell et
al. 2015)
Can accurately
identify rare and
cryptic species
with least
ecological and
taxonomic
expertise
(Calvignac-
Spencer et al.
2012; Schnell et
al. 2012) (e.g.
Annamite striped
rabbit was
recorded from
DNA recovered
from leeches in
Vietnam; Schnell
et al. 2012);
Blowflies in
particular have
good potential as
sources of
mammal DNA
due to their
presence in all
habitats and
broad host
preferences
Blowflies must be
collected every
24 h as mammal
DNA persists at
least 24 h in
blowfly guts (Lee
et al. 2015)
High (Calvignac-
Spencer et al.
2012; Calvignac-
Spencer et al.
2013; Schnell et
al. 2015)
Page 32 of 42
https://mc06.manuscriptcentral.com/genome-pubs
Genome
Draft
(Norris 1965)
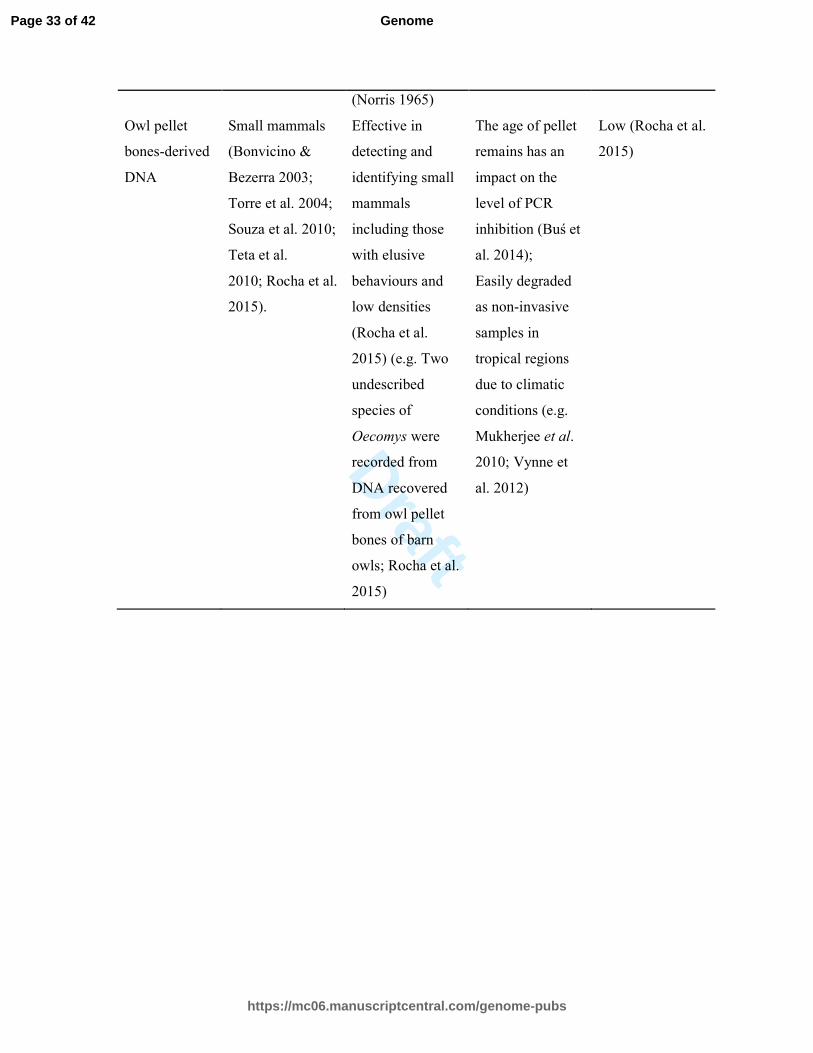
Owl pellet
bones-derived
DNA
Small mammals
(Bonvicino &
Bezerra 2003;
Torre et al. 2004;
Souza et al. 2010;
Teta et al.
2010; Rocha et al.
2015).
Effective in
detecting and
identifying small
mammals
including those
with elusive
behaviours and
low densities
(Rocha et al.
2015) (e.g. Two
undescribed
species of
Oecomys were
recorded from
DNA recovered
from owl pellet
bones of barn
owls; Rocha et al.
2015)
The age of pellet
remains has an
impact on the
level of PCR
inhibition (Buś et
al. 2014);
Easily degraded
as non-invasive
samples in
tropical regions
due to climatic
conditions (e.g.
Mukherjee et al.
2010; Vynne et
al. 2012)
Low (Rocha et al.
2015)
Page 33 of 42
https://mc06.manuscriptcentral.com/genome-pubs
Genome

Draft
Figure captions
Figure 1. The locations of field sites A) Ulu Gombak Forest Reserve showing the location of
two transects and the experimental design for comparing five different field methods. B)
Tembat Forest Reserve showing the locations of twenty trap stations each with a blowfly trap
and a camera trap. Map data: Google.
Figure 2. Photographic evidence of nine mammal species detected by camera traps at Tembat
Forest Reserve, Terengganu. A) Elephas maximus B) Helarctos malayanus C) Macaca
fascicularis D) Muntiacus muntjak E) Panthera pardus F) Prionailurus bengalensis G) Sus
scrofa H) Tapirus indicus I) Viverra zibertha. Camera settings: sample rate of passive
infrared sensor = 70 times per s; flash brightness = normal (Xenon flash system); LED stealth
mode = off; daylight images per trigger = 3 with delay period between images = 1 s; flash
images per trigger during night time = 1 with delay period between images = 20 s; image
resolution: 3 megapixel.
Figure 3. Species detected by different field methods including species unique to each
method and species shared across different methods at A) Ulu Gombak Forest Reserve, and B)
Tembat Forest Reserve. The number [in square parentheses] represents the BIN number
assigned in BOLD to the species detected.
Figure 4. Rarefaction curves showing expected species richness (using Chao 1 with number
of randomisations = 100) and sampling completeness ratios (in brackets) for each field
method at A) Ulu Gombak Forest Reserve, and B) Tembat Forest Reserve. Dashed lines
showed 95% confidence intervals of expected species richness for each field method at A)
Ulu Gombak Forest Reserve: dashed blue lines for cage traps; dashed red lines for mist nets;
dashed green lines for scat collection; dashed purple lines for blowfly traps, and B) Tembat
Forest Reserve: dashed orange lines for camera traps; dashed black lines for blowfly traps.
Page 34 of 42
https://mc06.manuscriptcentral.com/genome-pubs
Genome

Draft
Figure 1. The locations of field sites A) Ulu Gombak Forest Reserve showing the location of two transects and the experimental design for comparing five different field methods. B) Tembat Forest Reserve showing
the locations of twenty trap stations each with a blowfly trap and a camera trap. Map data: Google.
190x254mm (300 x 300 DPI)
Page 35 of 42
https://mc06.manuscriptcentral.com/genome-pubs
Genome
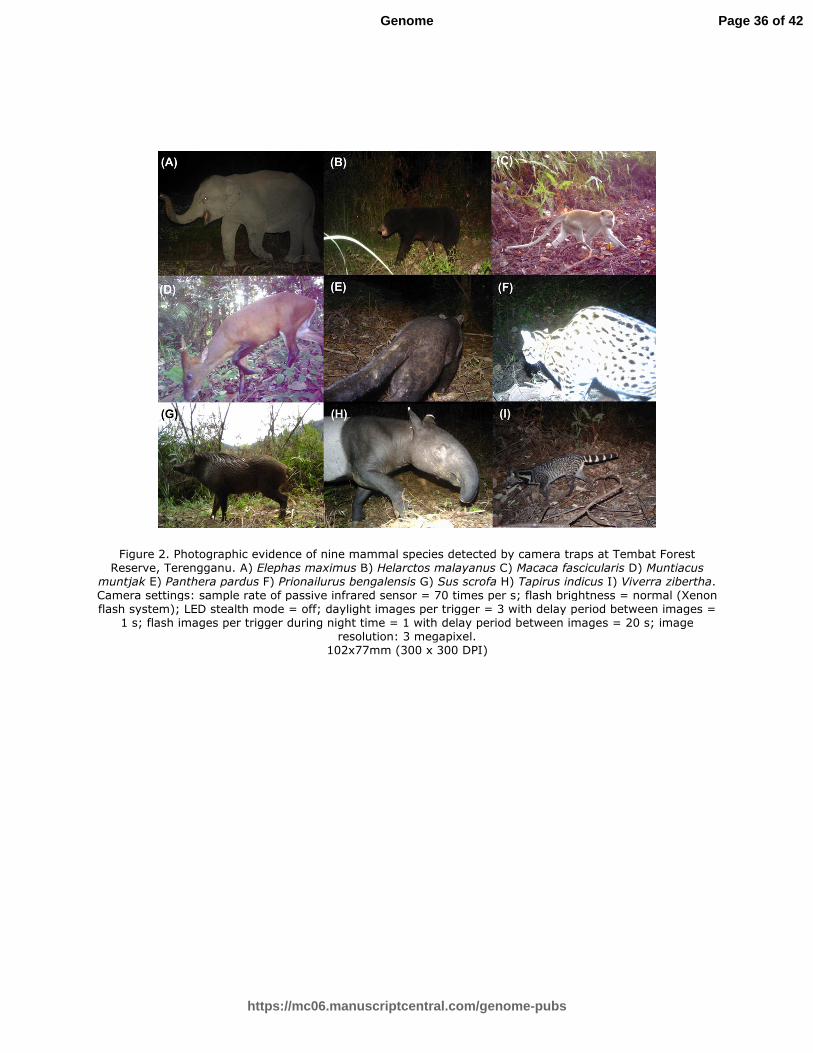
Draft
Figure 2. Photographic evidence of nine mammal species detected by camera traps at Tembat Forest Reserve, Terengganu. A) Elephas maximus B) Helarctos malayanus C) Macaca fascicularis D) Muntiacus
muntjak E) Panthera pardus F) Prionailurus bengalensis G) Sus scrofa H) Tapirus indicus I) Viverra zibertha. Camera settings: sample rate of passive infrared sensor = 70 times per s; flash brightness = normal (Xenon flash system); LED stealth mode = off; daylight images per trigger = 3 with delay period between images =
1 s; flash images per trigger during night time = 1 with delay period between images = 20 s; image resolution: 3 megapixel.
102x77mm (300 x 300 DPI)
Page 36 of 42
https://mc06.manuscriptcentral.com/genome-pubs
Genome
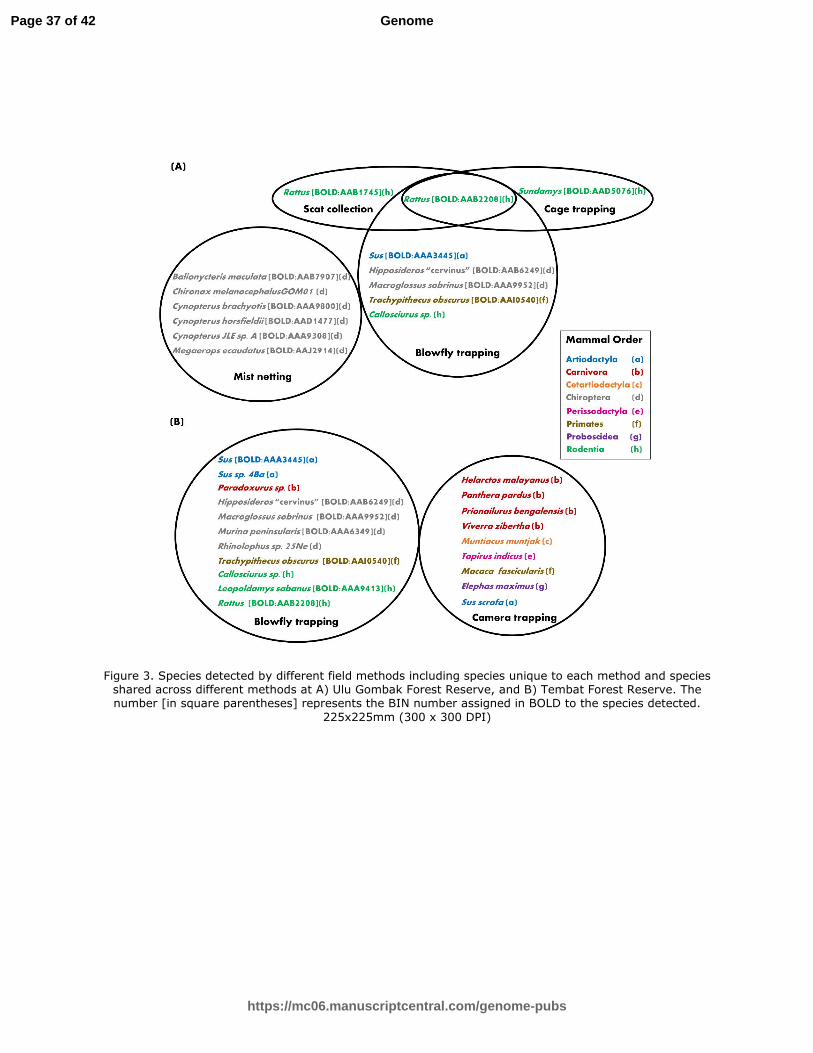
Draft
Figure 3. Species detected by different field methods including species unique to each method and species shared across different methods at A) Ulu Gombak Forest Reserve, and B) Tembat Forest Reserve. The number [in square parentheses] represents the BIN number assigned in BOLD to the species detected.
225x225mm (300 x 300 DPI)
Page 37 of 42
https://mc06.manuscriptcentral.com/genome-pubs
Genome

Draft
Figure 4. Rarefaction curves showing expected species richness (using Chao 1 with number of randomisations = 100) and sampling completeness ratios (in brackets) for each field method at A) Ulu
Gombak Forest Reserve, and B) Tembat Forest Reserve. Dashed lines showed 95% confidence intervals of
expected species richness for each field method at A) Ulu Gombak Forest Reserve: dashed blue lines for cage traps; dashed red lines for mist nets; dashed green lines for scat collection; dashed purple lines for
blowfly traps, and B) Tembat Forest Reserve: dashed orange lines for camera traps; dashed black lines for blowfly traps.
142x107mm (300 x 300 DPI)
Page 38 of 42
https://mc06.manuscriptcentral.com/genome-pubs
Genome

Draft
Table S1. Checklist of mammal species recorded at Ulu Gombak Forest Reserve.
Sources
ORDER: CHIROPTERA
PTEROPODIDAE
Balionycteris seimundi 1,10,11,12,13
Chironax melanocephalusGOM01 1, 10, 11, 14
Cynopterus brachyotis 1,10,11,12,13,14
Cynopterus horsfieldi 1,3,10,11,12,13
Cynopterus JLE sp. A 14
Dyacopterus spadiceus 13
Eonycteris spelaea 1,10,11,13
Macroglossus minimus 1
Megaerops ecaudatus 9,11,13,14
Penthetor lucasi 1,10,11
Pteropus vampyrus 1,11
Rousethus amplexicaudatus 10,11,12
EMBALLONURIDAE
Emballonura monticola 1,3,10,11
Saccolaimus saccolaimus 1,11
Taphozous melanopogon 10,11
NYCTERIDAE
Nycteris javanicaA 10,11
Nycteris tragataa 13
MEGADERMATIDAE
Megaderma lyra 2
Megaderma spasma 1,10,11
RHINOLOPHIDAE
Rhinolophus affinis 3,13
Rhinolophus luctus 1,10,11,13
Rhinolophus refulgens 11
Rhinolophus sedulus 1,3,10,11,13
Rhinolophus stheno 10,11,13
Rhinolophus trifoliatus 3,10,11,13
HIPPOSIDERIDAE
Coelops frithii 5,11
Hipposideros atrox 14
Hipposideros bicolor 14
Hipposideros cervinus 8,10,11,13,14
Hipposideros cineraceus 1,3,11
Hipposideros doriae 10,11
Page 39 of 42
https://mc06.manuscriptcentral.com/genome-pubs
Genome

Draft
Hipposideros galeritus 1
Hipposideros larvatus 1,11,13
Hipposideros masoni 1,3,10,11,13
VESPETILIONIDAE
Arielulus circumdatus 10,11
Glischropus tylopus 10,11,13
Hesperoptenus blanfordi 10,11
Hesperoptenus doriae 4,10,11
Hesperoptenus tomesi 10,11
Kerivoula sp. 1
Miniopterus fuliginosus 10,11
Murina aenea 7,11
Murina peninsularis 11,13
Murina suilla 10,11,13
Myotis federatus 3,10,11
Myotis horsefieldii 11
Myotis muricola 3,10,11
Myotis mystacinus 1
Myotis ridleyi 10,11
Philetor brachypterus 6,10,11,13
Phoniscus atrox 1,3,4,10,11
Pipistrellus stenopterus 1, 11
Scotophilus kuhlii 10,11
Tylonycteris pachypus 1,3,10,11
Tylonycteris robustula 1,10,11,13
MOLOSSIDAE
Chaerephon sp. 1,11
Cheiromeles torquatus 1,11
ORDER: DERMOPTERA
CYNOCEPHALIDAE
Cynocephalus variegatus 1
ORDER: ARTIODACTYLA
SUIDAE
Sus scrofa 1
TRAGULIDAE
Tragulus javanicus 1
BOVIDAE
Capricornis sumatraensis 1
Page 40 of 42
https://mc06.manuscriptcentral.com/genome-pubs
Genome
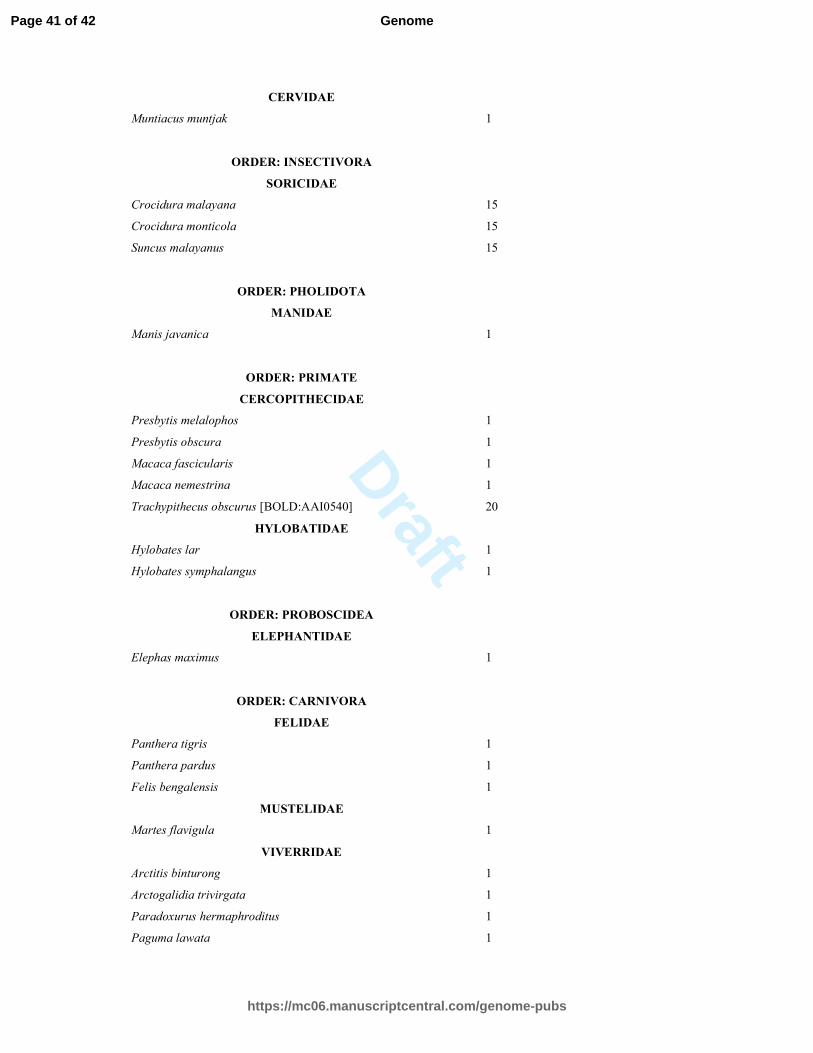
Draft
CERVIDAE
Muntiacus muntjak 1
ORDER: INSECTIVORA
SORICIDAE
Crocidura malayana 15
Crocidura monticola 15
Suncus malayanus 15
ORDER: PHOLIDOTA
MANIDAE
Manis javanica 1
ORDER: PRIMATE
CERCOPITHECIDAE
Presbytis melalophos 1
Presbytis obscura 1
Macaca fascicularis 1
Macaca nemestrina 1
Trachypithecus obscurus [BOLD:AAI0540] 20
HYLOBATIDAE
Hylobates lar 1
Hylobates symphalangus 1
ORDER: PROBOSCIDEA
ELEPHANTIDAE
Elephas maximus 1
ORDER: CARNIVORA
FELIDAE
Panthera tigris 1
Panthera pardus 1
Felis bengalensis 1
MUSTELIDAE
Martes flavigula 1
VIVERRIDAE
Arctitis binturong 1
Arctogalidia trivirgata 1
Paradoxurus hermaphroditus 1
Paguma lawata 1
Page 41 of 42
https://mc06.manuscriptcentral.com/genome-pubs
Genome

Draft
ORDER: SCANDENTIA
TUPAIIDAE
Ptilocercus lowii 1
Tupaia glis 1,16,17
Tupaia minor 1
ORDER: RODENTIA
HYSTRICIDAE
Atherurus macrourus 1
Hystix brachyura 1
MURIDAE
Chiropodomys gliroides 1,16,17
Leopoldamys sabanus 1,16,17,18
Maxomys inas 1,18,19
Maxomys rajah 16,17,18,19
Maxomys surifer 1,18
Maxomys whiteheadi 1,16,17,18
Niviventer rapit 16,17
Rattus bowersi 1,16,17,18,19
Rattus exulans 1,17,18
Rattus norvegicus 18
Rattus rattus 18,19
Rattus tiomanicus 1,16,17,18,19
Sundamys muelleri 1,16,17,18,19
SCIURIDAE
Callosciurus notatus 16,17
SPALACIDAE
Rhizomys sumatrensis 1
Species names with same alphabetical superscript have been considered by some researchers to be the
same species or synonyms, in such cases, the capital letters are used to denote the valid name.
Sources: 1. Medway 1966; 2. Medway 1967; 3. University of Malaya, Kuala Lumpur collection 1963-
1969; 4. Medway 1983; 5. Hill 1972; 6. Hill 1974; 7. Sly 1975; 8. Jenkins & Hill 1981; 9. Yenbutra &
Felten 1983; 10. Heller & Volleth 1989; 11. Heller & Volleth 1995; 12. Yusof 2005; 13. Syaripuddin
2012; 14. Sing et al. 2013; 15. Aziz 2010; 16. Hassan 2009. 17. Rodzuan 2006. 18. Zulkifli 2011. 19.
Abu 2007; 20. In this study
Page 42 of 42
https://mc06.manuscriptcentral.com/genome-pubs
Genome