Draft SEEA Technical Note: Land Accounting natural vegetation and abiotic (non-living) surfaces2....
32
0
Transcript of Draft SEEA Technical Note: Land Accounting natural vegetation and abiotic (non-living) surfaces2....

0
Draft SEEA Technical Note: Land Accounting
1
SEEA Technical Note: Land Accounting
DRAFT: January 21, 2016
Table of Contents I. Introduction to land accounting ............................................................................................... 3
II SEEA-CF accounts – land ....................................................................................................... 4
A. Core Accounts - land ........................................................................................................... 4
B. Other land accounts.............................................................................................................. 9
III Indicators for land .................................................................................................................. 11
IV Compilation ........................................................................................................................... 12
V Extensions and links .............................................................................................................. 18
VI References and links .............................................................................................................. 22
VII Annex ................................................................................................................................. 24
Description of land cover classes .................................................................................................. 24
Land Use Classification ................................................................................................................ 26
Examples of data sources .............................................................................................................. 28
Data on permanent land (accounting unit) features ............................................................... 28
Data on dynamic (asset) land features ................................................................................... 28

Draft SEEA Technical Note: Land Accounting
2
SEEA Technical Notes
This note is a part of a series of Technical Notes prepared to support the development of data based on
the System of Environmental Economic Accounts (SEEA) Central Framework, the first international
standard in environmental economic accounting. Since SEEA is not a single account but a series of
modules, the accounts in each of the various modules can be developed separately in accordance with the
priorities and the resource availability in each country.
The series of Technical Notes is comprised of a) a note addressing general issues that cut across domains
focusing on institutional arrangements and institutional processes that encourage efficient
implementation of the standard and associated data compilation exercises (see Institutional Arrangements
and Statistical Production Processes for the Implementation of the SEEA-Central Framework) and b) a number of
notes on specific modules. It is recommended that those wishing to develop data related to any of these
specific modules should read the cross cutting note in conjunction with the note on the specific modules
to be developed.
The notes on modules summarize the data requirements and other operational considerations in 10-15
pages designed to provide sufficient guidance to initiate the development of the accounts. The notes also
provide reference information for additional publications that will support the full development of the
accounts and provide information on extensions and linkages that can be exploited once the accounts and
tables are in place.

Draft SEEA Technical Note: Land Accounting
3
I. Introduction to land accounting
1. Land is a unique asset that delineates the space in which human activities and
environmental processes take place, and within which environmental assets and economic assets
are located. Land is central to economic and environmental accounting. Beyond an assessment of
the ownership and use of land as part of economic production, some of the issues that can be
considered in the context of land accounts include the impacts of urbanisation, the sustainability
of agriculture and forestry, the use of inland freshwater resources, and biodiversity conservation.
2. This technical note provides an overview of land accounting according to the System of
Environmental Economic Accounting 2012 Central Framework (SEEA CF) which was adopted
by the United Nations Statistical Commission in 2012 as the international statistical standard for
environmental economic accounts.
3. The general purpose of SEEA Technical Notes is to summarize the key features of
accounting for a given topic to support countries in the implementation of the SEEA, and
describe what might be a minimum set of information to guide initial efforts in compilation.
This technical note will describe the main features of the SEEA accounts for land, and
present a set of core accounts which comprise an adapted version of the SEEA Central
Framework accounts to focus and guide initial compilation.
4. The core accounts represent a minimum set of information which countries should aim to
compile and report, explicitly identifying the most important data items for the module at hand.
While the core accounts represent a minimum set, countries may often wish to extend the level
of detail in areas deemed particularly policy relevant. The Technical Notes provide highlights of
such possible extensions in the explanatory text. The level of detail and industry disaggregation
of the core accounts is relatively uniform across the set of module-specific technical notes. For
the modules where industry disaggregation is relevant, five broad industry classes are identified.
5. Land area can be analysed in many different ways and as such land accounts can be
prepared from several points of view. From a spatial point of view, land accounts can be
compiled for the country as a whole or for regions within countries. For example, accounts can
be compiled by administrative boundaries or by land cover characteristics.. From an economic
point of view, land accounts can be constructed by the area of land owned by different
institutional sectors, land used by different industries and land zoned for different activities (e.g.
residential, industrial, conservation).
6. Land also constitutes an important component in the assessment of national and
institutional sector wealth. Land is bought and sold in combination with physical attributes of the
land (e.g. soil) and the produced assets that may be located on the land (e.g. buildings) and, thus,
the composite value will incorporate these values as well as a value of the space itself (the
location).
7. In addition, land accounts also help unlock the power of Geographic Information Systems
(GIS) to locate areas of change and map a wide range of social, economic and environmental
information. While the focus initially is to build environmental-economic information at the

Draft SEEA Technical Note: Land Accounting
4
national level, local environmental conditions can vary widely across a country resulting in the
need for analysis and policy action that differ by local area. GIS can be very important in
integrating data sets organized by administrative regions and others organized by bio-physical or
topographic regions.
8. National assessments of the changing shares of different categories of land use and land
cover within a country can provide useful indicators of change. For example, how changing
shares of land cover and land use relate to income generation over time. Such information can
be used to assess how factors interact in particular regions and help to target policy action
appropriately.
9. The development of core accounts was requested by the UN Statistical Commission at its
44th session in February 2013. The core accounts for land, along with other core accounts such as
those for energy, forests, and others, constitutes the starting point in the development of common
reporting tables in close coordination with international agencies. They will be submitted to the
UNCEEA after extensive consultations with experts, including the London Group on
Environmental Accounting, international organizations and national statistical offices.
10. The information presented in the core accounts for land is data which can be used to
produce a range of indicators identified in international initiatives. For example, the Commission
for Sustainable Development1 has indicators for land use change, land degradation, arable area,
and forest area. Furthermore, land accounts are the central to ecosystem accounting. Land areas
may be used to provide a measurement basis for ecosystem accounting in a similar way to which
statistical units, such as establishments, provide a basis for measurement in economic statistics.
SEEA Experimental Ecosystem Accounting develops these ideas in more detail.
11. Section II briefly describes the SEEA accounting system for land and introduces the core
accounts for land, along with and classifications for land cover and land use. Section III
describes some important indicators that can be derived from the core accounts for land. Section
IV deals with the data sets required to produce the land accounts including the main concepts,
data sources and compilation methods. Section V describes how the land accounts and related
datasets may be extended to address broader issues and linked to other data sets. Section VI
provides references and links to supporting material.
II SEEA-CF accounts – land
A. Core Accounts - land
12. Land accounts can be prepared in both physical (e.g. hectares) and monetary ($, €, ¥, etc.)
terms. There are three core accounts that are most fundamental for land; namely the physical
asset accounts for land, first with land classified by land cover and secondly, classified by land
use, as well as the monetary asset account for land use.
1 See https://sustainabledevelopment.un.org/csd.html for more information on the Commission’s work.

Draft SEEA Technical Note: Land Accounting
5
13. At its most basic level, land cover comprises all of the individual features that cover the
area within a country. For the purposes of land cover statistics the relevant country area includes
land and inland waters. The area of coastal waters is generally excluded from land accounts but
provision is made to extend the coverage to include coastal waters and the Exclusive Economic
Zone (EEZ) if there is a need (e.g. because fish or other marine resources are harvested).
14. The SEEA definition of land cover and the full classification are presented below:
Land cover refers to the observed physical and biological cover of the Earth’s surface and
includes natural vegetation and abiotic (non-living) surfaces2.
15. Current land cover is a function of natural changes in the environment and of previous
and current land use, particularly in agricultural and forestry areas. Thus, a clear and systematic
description of classes of land cover allows the land cover classification to be compared with that
for types of land use, while maintaining pure land cover criteria.
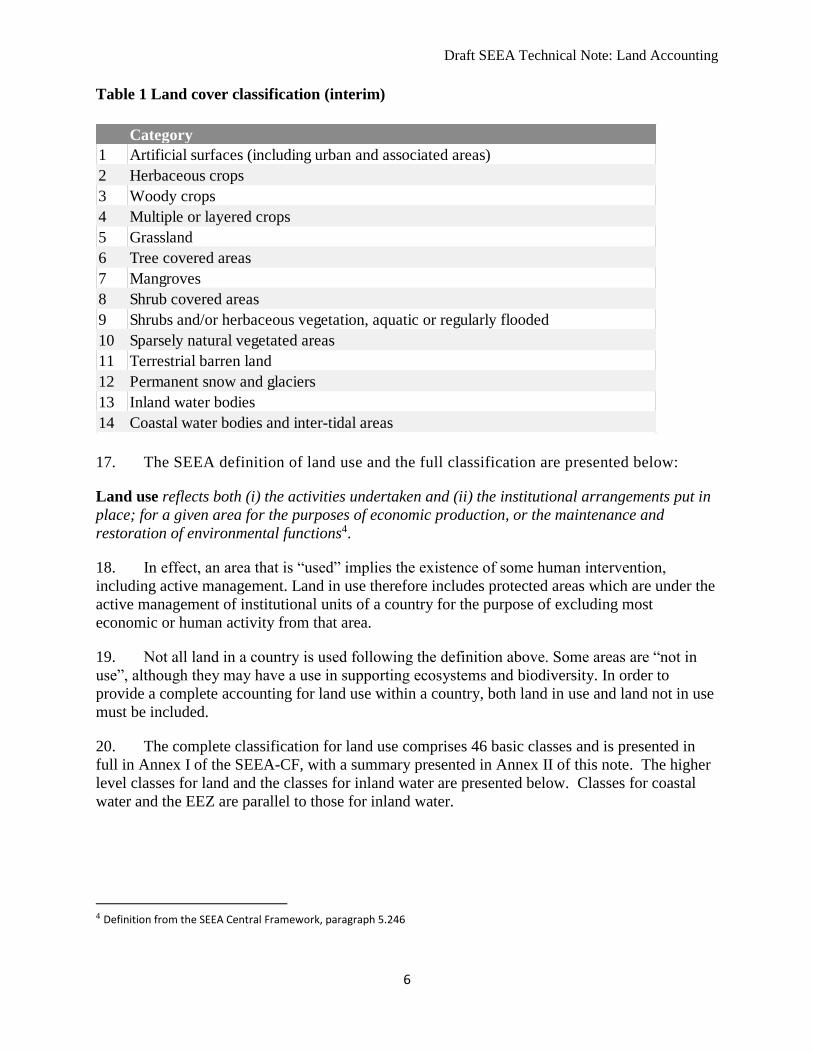
16. The 14 classes in Table 1 constitute a set of land cover types with clear boundaries based
on definitions from the Land Cover Classification System (LCCS) of the FAO. This land cover
classification can be used at all scales, independently of the method of observation, thus allowing
cross-referencing of local and regional maps with continental and global maps without loss of
information. Extended descriptions of the classes are provided in Annex I.3
2 Definition from the SEEA Central Framework, paragraph 5.257
3 As part of the SEEA Central Framework research agenda (see annex II), the interim land cover classification
presented in table 5.12 will be further tested to ensure its suitability for the standardization of statistical data sets at
the international level. Note that wetlands may be part of multiple classes. Work is underway to identify secondary
classes to address this issue. In the meantime, if wetlands are a subject of interest, it may be desirable to separately
identify them within each class.
Draft SEEA Technical Note: Land Accounting
6
Table 1 Land cover classification (interim)
17. The SEEA definition of land use and the full classification are presented below:
Land use reflects both (i) the activities undertaken and (ii) the institutional arrangements put in
place; for a given area for the purposes of economic production, or the maintenance and
restoration of environmental functions4.
18. In effect, an area that is “used” implies the existence of some human intervention,
including active management. Land in use therefore includes protected areas which are under the
active management of institutional units of a country for the purpose of excluding most
economic or human activity from that area.
19. Not all land in a country is used following the definition above. Some areas are “not in
use”, although they may have a use in supporting ecosystems and biodiversity. In order to
provide a complete accounting for land use within a country, both land in use and land not in use
must be included.
20. The complete classification for land use comprises 46 basic classes and is presented in
full in Annex I of the SEEA-CF, with a summary presented in Annex II of this note. The higher
level classes for land and the classes for inland water are presented below. Classes for coastal
water and the EEZ are parallel to those for inland water.
4 Definition from the SEEA Central Framework, paragraph 5.246
Category
1 Artificial surfaces (including urban and associated areas)
2 Herbaceous crops
3 Woody crops
4 Multiple or layered crops
5 Grassland
6 Tree covered areas
7 Mangroves
8 Shrub covered areas
9 Shrubs and/or herbaceous vegetation, aquatic or regularly flooded
10 Sparsely natural vegetated areas
11 Terrestrial barren land
12 Permanent snow and glaciers
13 Inland water bodies
14 Coastal water bodies and inter-tidal areas
Draft SEEA Technical Note: Land Accounting
7
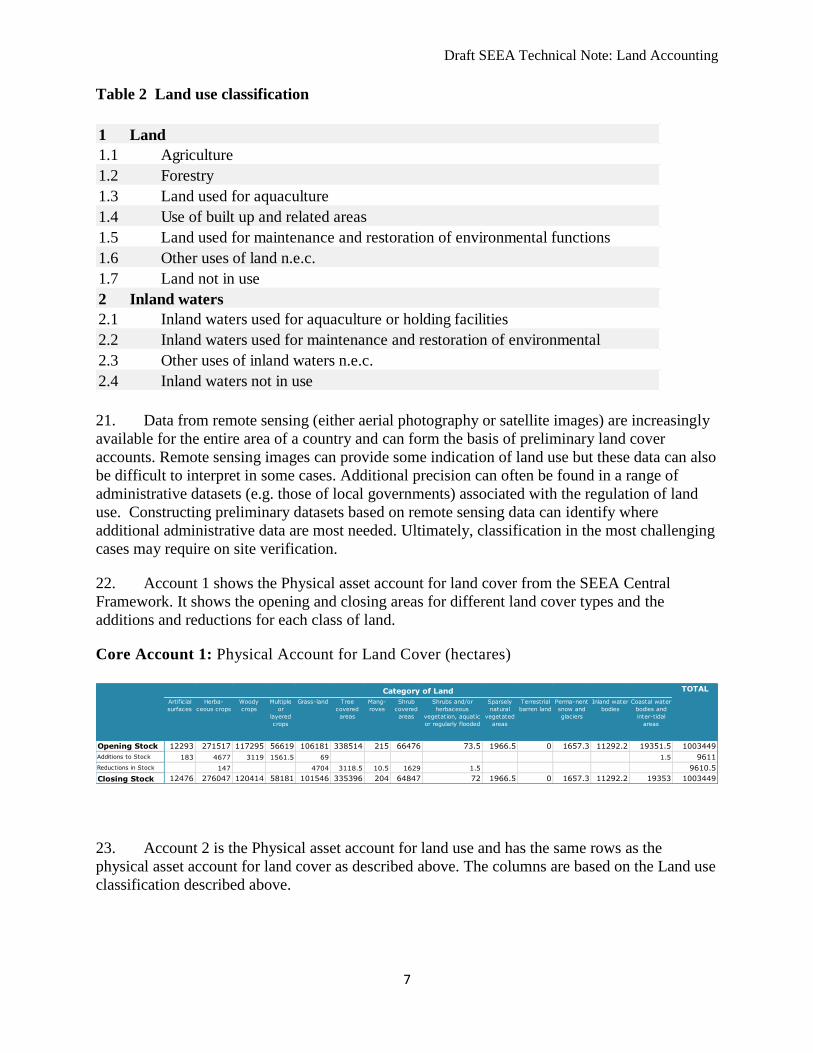
Table 2 Land use classification
21. Data from remote sensing (either aerial photography or satellite images) are increasingly
available for the entire area of a country and can form the basis of preliminary land cover
accounts. Remote sensing images can provide some indication of land use but these data can also
be difficult to interpret in some cases. Additional precision can often be found in a range of
administrative datasets (e.g. those of local governments) associated with the regulation of land
use. Constructing preliminary datasets based on remote sensing data can identify where
additional administrative data are most needed. Ultimately, classification in the most challenging
cases may require on site verification.
22. Account 1 shows the Physical asset account for land cover from the SEEA Central
Framework. It shows the opening and closing areas for different land cover types and the
additions and reductions for each class of land.
Core Account 1: Physical Account for Land Cover (hectares)
23. Account 2 is the Physical asset account for land use and has the same rows as the
physical asset account for land cover as described above. The columns are based on the Land use
classification described above.
1
1.1 Agriculture
1.2 Forestry
1.3 Land used for aquaculture
1.4 Use of built up and related areas
1.5 Land used for maintenance and restoration of environmental functions
1.6 Other uses of land n.e.c.
1.7 Land not in use
2
2.1 Inland waters used for aquaculture or holding facilities
2.2 Inland waters used for maintenance and restoration of environmental
2.3 Other uses of inland waters n.e.c.
2.4 Inland waters not in use
Land
Inland waters
Artificial
surfaces
Herba-
ceous crops
Woody
crops
Multiple
or
layered
crops
Grass-land Tree
covered
areas
Mang-
roves
Shrub
covered
areas
Shrubs and/or
herbaceous
vegetation, aquatic
or regularly flooded
Sparsely
natural
vegetated
areas
Terrestrial
barren land
Perma-nent
snow and
glaciers
Inland water
bodies
Coastal water
bodies and
inter-tidal
areas
Opening Stock 12293 271517 117295 56619 106181 338514 215 66476 73.5 1966.5 0 1657.3 11292.2 19351.5 1003449
Additions to Stock 183 4677 3119 1561.5 69 1.5 9611
Reductions in Stock 147 4704 3118.5 10.5 1629 1.5 9610.5
Closing Stock 12476 276047 120414 58181 101546 335396 204 64847 72 1966.5 0 1657.3 11292.2 19353 1003449
Category of Land TOTAL

Draft SEEA Technical Note: Land Accounting
8
Core Account 2: Physical asset account for land use
24. Land cover and land use are interrelated. For example, land uses associated with
agricultural production are closely aligned to crop area. However, while land use and land cover
can be closely related, this is not always the case. For example, tree covered areas can be used
for forestry, for the maintenance and restoration of environmental functions, or may not be used
at all (i.e. land not in use). Another common example is grazing land which constitutes
agricultural land use but shows up as grasslands or sparse trees when considering land cover.
25. With data structured in an accounting format based on common statistical units, it is
possible to link land cover to land use. This allows for the preparation of accounts showing land
cover by land use as well as matrices showing the changes in both land cover and land use over
an accounting period. In assessing land cover and land use change, it may be useful to determine
the proportion of the opening stock of land whose cover or use has remained unchanged. To
undertake this type of analysis the data must be based on spatially referenced data sources.
26. The basic land accounts are very important for establishing the ability to describe and
analyse data in varying geo-spatial configurations in the long run. This foundational aspect of
these accounts and associated datasets needs to be a primary consideration from the outset of
developing the SEEA based information for land. Before developing a GIS system (or modifying
an existing one) for environmental-economic accounts, one should consider the full breadth of
potential bio-physical and economic datasets that one might want to eventually integrate. It must
also be kept in mind that land accounts are at the core of ecosystem accounting. This link should
be carefully considered when developing land accounts in a country where ecosystem accounting
may be a priority.
27. The third core account for land is the monetary asset account for land use which requires
the separation of the value of land from other attributes that contribute to the market value of the
combined asset – land plus, for example, produced assets that may be located on the land (e.g.,
buildings). As monetary valuation of land is required for the national accounts, it is not
specifically addressed in this note. However, it should be pointed out that the information on
land use contained in the SEEA accounts may be useful in improving the estimates of the value
of land for the national accounts balance sheet.
Agriculture Forestry Use of built up
& related areas
Land used for
maintenance &
restoration of
environmental
functions
Other*
Opening stock 531650 317800 10630 10000 133369 1003449
Additions to stock 8130 340 150 0 0
Reductions in stock 0 7720 0 900 0
Closing stock 539780 310420 10780 9100 133369 1003449
Type of Land Use TOTAL

Draft SEEA Technical Note: Land Accounting
9
Core Account 3: Monetary Asset Account for Land Use
28. Another important characteristic of land is that of ownership, which generally requires
access to administrative records. Ownership information can allow the creation of datasets by
economic activity or economic sector which may be very useful in some policy applications.
29. Land may in some cases support more than one use. While the basic classification should
reflect the dominant use, capturing information on secondary uses may be important in some
environmental contexts, for example land primarily used for agriculture may also support animal
habitats in peripheral areas such as wind breaks and hedge rows.
30. It should be noted that generally the total area of land for a country will remain
unchanged from one period to the next and so the total opening and closing stock of land in
physical terms (hectares) will be unchanged. However, there are situations where the area of land
for a country may change. It may increase, for example due to reclamation of land through the
construction of dykes and other barriers. It may also decrease, for example due to land
subsidence or higher water levels. Changes in the total area of land may also occur due to
political factors. For example, the total area may increase or decrease due to war and associated
events and or possibly resolution of areas of disputed territory5.
B. Other land accounts
31. The accounts described to this point provide opening and closing balances by type of land
classification, based either on cover or use. An extension of this would be to present information
on changes which cross classifies the opening and closing classes for basic observation units and
identifies those that have changed. This allows one to present a change matrix showing how land
units evolved from one classification to another during a given period.
32. The Land cover change matrix shows the area of different land cover types at the
beginning of the reference period (opening stock), the net increases and net decreases according
to the land cover type it was converted from (in the case of increases), or what it was converted
to (in the case of decreases). Summing the rows will give the net overall change for each class of
land cover during the period, which is shown in the second last column. Finally, the area covered
by different land cover types at the end of the reference period (closing stock) is shown on the
right. The table shows, for example, that between opening and closing stocks the area of
5 If total land area changes due to any of these rare circumstances, all data outputs and the associated metadata should
clearly indicate the size and reason for the change.
Agriculture Forestry Use of built up &
related areas
Land used for
maintenance &
restoration of
environmental
functions
Other*
Opening value of stock of land 420000 187500 386000 2000 995500
Additions to stock 3500 200 2500 6200
Reductions in stock 4750 200 4950
Revaluations 18250 15350 65000 98600
Closing value of stock of land 441750 198300 453500 1800 1095350
Type of Land Use TOTAL

Draft SEEA Technical Note: Land Accounting
10
herbaceous crops grew from 271,217 to 276,047 thousand hectares, comprising additions to crop
area from grassland (4,677,000 ha) and a loss of (147,000 ha) to artificial surfaces.
Account 4 - Land Cover Change Matrix (hectares)
33. It is important to understand that the matrix shows net changes, which may mask some
important information. For example, if natural forest is lost in one place but an equal amount of
plantation forest is added elsewhere, then no net change of tree covered area would be shown.
Similarly, when agricultural land is converted into built-up land, but, at the same time,
agricultural land is created through deforestation, total crop or grassland (used for agriculture)
may not change. Where these phenomena are relevant, the format of Table 1 can be extended to
show increases and decreases in separate tables and thus allow more detailed analysis6.
34. A land use change matrix showing physical changes in land use could also be developed
with the same structure as the the land cover change matrix (above). The rows and columns
showing land cover classification in Account 4 would be replaced with the land use
classification presented in core account 2.
35. Countries should look at the full classification structure when determining to what level it
will classify land use in its own systems. It should consider the extent and degree of variation of
specific land covers and uses, along with the analytical and policy requirements. Given there are
only a total of 34 basic classes for land and four each for inland water, coastal water and EEZ, it
is recommended that countries consider coding at the lowest level of the classification.
6 Presenting the data in maps can be very useful in setting out gross changes in land uses.
Artificial
surfaces
Herbaceous
crops
Woody
crops
Multiple or
layered
crops
Grass-
land
Tree
covered
areas
Mangroves Shrub
covered
areas
Shrubs
and/or
herbaceous
vegetation,
aquatic or
regularly
flooded
Sparsely
natural
vegetated
areas
Terrestrial
barren land
Permanent
snow and
glaciers
Inland
water
bodies
Coastal
water
bodies and
inter-tidal
areas
Artificial surfaces12292.5 147 27 9 183 12475.5
Herbaceous crops271517 -147 4677 4530 276047
Woody crops117295 3119 3118.5 120414
Multiple or layered
crops 56619 1560 1.5 1561.5 58180.5
Grass-land106180.5 -27 -4677 69 -4635 101546
Tree covered areas338514 -3118.5 -3118.5 335396
Mangroves214.5 -9 -1.5 -10.5 204
Shrub covered areas66475.5 -1560 -69 -1629 64846.5
Shrubs and/or
herbaceous
vegetation, aquatic
or regularly flooded 73.5 -1.5 -1.5 72Sparsely natural
vegetated areas 1966.5 1966.5
Terrestrial barren
land 0 0
Permanent snow and
glaciers 1657.3 1657.3
Inland water bodies11292.2 11292.2
Coastal water bodies
and inter-tidal areas 19351.5 1.5 1.5 19353
NET
CHANGE
CLOSING
STOCK
OPENING
STOCK
Lan
d C
over
Cla
ssif
icati
on
s
Net Increase (+) and decrease (-) from other land covers (1,000 ha)

Draft SEEA Technical Note: Land Accounting
11
III Indicators for land
36. As observed at the beginning of this note, “Land is a unique asset that delineates the
space in which human activities and environmental processes take place, and within which
environmental assets and economic assets are located.”
37. Thus information on land cover and land use often provide basic information needed for
many of the indicators being developed for monitoring environmental change. In particular land
use has an important role in linking human activity and economic activity to environmental data
such as in ecosystem accounts.
38. The level of classification of land use will determine the extent of indicators that can be
prepared based on the land asset account information. The more detailed the initial classification
the more detailed the indicators that will be potentially available to address policy needs.
39. The land accounts information is important in informing at least four of the proposed
indicators for the Sustainable Development Goals currently under discussion for the post 2015
agenda. The four currently identified as potential indicators are:
i. Proposed Indicator for Target 15.1: Forest area as a percentage of total land area
ii. Proposed Indicator for Target 6.6: Change in wetlands extent over time (% change over
time)
iii. Proposed Indicator for Target 2.4: Emissions of greenhouse gases in agriculture (per
hectare of land and per unit of output, separately for crop and livestock sectors).
iv. Proposed Indicator for Target 15.1: Coverage of protected areas broken down by
ecosystem type, including total area of forests in protected areas (thousands of hectares)
40. While the first indicator comes directly from the Physical Account for Land Cover, the
other three require information from other SEEA accounts or extensions to the accounts.
41. For example, the second indicator requires the separate identification of wetlands which
can be found in more than one of the basic classes of the interim Land Cover Classification. If
this indicator is required, then separate identification of wetlands within these classes should be
undertaken in the initial preparation of the data.
42. The third indicator requires additional information from the Air Emissions Accounts
identified by ISIC classes7. It would also require the identification of land use by industry.
Linked land use to industry would be an extension to the core table information that should be
considered for the development of these sort of indicators.
43. The fourth indicator requires information on ecosystem accounts. Land accounts are the
fundamental link between the accounts in SEEA-CF and the Ecosystem Accounts. In building
7 See the separate Technical Note being prepared on the Air Emissions Account for additional guidance on this subject.

Draft SEEA Technical Note: Land Accounting
12
the land accounts, it will be important to assure that the foundations for this important linkage
are put in place.
44. The land accounts are also specifically linked to two of the OECD’s proposed Green
Growth Indictors (numbers 7, and 10 ) and would be useful in delineating areas for a third
(number 11) :
• Indicator 7. Forest resources (area and volume of forests; stock changes over time);
• Indicator 10. Land resources (land cover types, conversions and cover changes; land use
state and changes);
• Indicator 11. Soil resources (erosion of topsoil, particularly on agricultural land)
45. The generation of indicators of various types for regions within a country will depend on
the level and quality of spatial coding available within the systems used to produce SEEA
accounts. As noted earlier, the Land accounts form the foundation for such efforts and
consideration of the full range of desired indicators should be undertaken at an early stage.
IV Compilation
46. The compilation of SEEA accounts should be founded on the GSBPM as outlined in the
first note in this series “Statistical Production Processes for Implementation of the SEEA-Central
Framework”.
Overarching Management Functions
1 Specify Needs 2 Design 3 Build 4 Collect 5 Process 6 Analyze 7 Disseminate 8 Evaluate
47. It is often the case when building accounts (SEEA or SNA for example) that one of the
goals is to use existing data sources as much as possible. In such a case, the ‘Specify Needs’,
‘Design’ and ‘Build’ phases will often need to be undertaken simultaneously and iteratively, as
one evaluates the capacity of existing data sets to meet needs relative to the potential costs of
initiating new data development.
Specify Needs, Design & Build
48. The initial compilation of a land account will require several steps that may not need to
be undertaken for each data cycle but should be revisited periodically in conjunction with
periodic budget and planning cycles:
Setting out the specific land accounts and the dimensions of each account that would best respond
to the information needs of the country should be done at this stage. This will provide a basis to

Draft SEEA Technical Note: Land Accounting
13
examine the adequacy of the existing data and assess where additional information may be
required. Particular attention should also be given in the initial stages to whether these land
accounts will be linked to the ecosystem accounts and the national accounts. In particular,
compiling the Ecosystem Accounts will likely require the integration of spatial data from many
sources (e.g., land cover, hydrology, land use, ownership, etc.). It is suggested that important
national data holders are engaged in the initial process of compiling the land accounts.
49. Data on land use and ownership is desirable. Integrating these data would support a better
linkage with the other physical and monetary accounts. For example, a given forest area may
appear homogenous from a land cover map and yet it may be partly owned by government (as a
park) and partly owned by a forestry concession. The forest area will have two different owners
and at least two different uses. These differences will result in different conditions and
ecosystem services.
50. Land accounts will be important in constructing a number of the indicators being
proposed to support the SDGs. These indicators may require additional detail beyond that in the
core tables such as the separate identification of wetlands within classes 6 and 9 of Land Cover.
51. The integration and arrangement of this information requires skills and knowledge of GIS
in addition to statistical skills and knowledge of accounts and information about land. A
prerequisite to the successful ongoing production of land accounts is GIS information
technology.
52. At this point if sufficient basic data are not available to produce one or more of the
accounts, it may be necessary to initiate a project to generate the missing data. This may well
mean that account development splits into two paths one for the accounts that can be initiated
with existing data and one where development will have to await the availability of basic data.
53. In some cases where partial data exist but there are some important data gaps it may be a
good idea to construct a preliminary account filling in missing data with the best available
estimates. While such an exercise may not produce a viable account, it may well reveal more
about the extent and importance of data gaps thus providing a better foundation for the
development of these missing basic data.
54. In the case where basic data must be developed, it is recommended that a separate project
be initiated to develop the necessary data. This project should follow the GSBPM steps and
generic principle as set out in the first note in this Technical Note series. Depending on the
organization of responsibilities within the statistical infrastructure of the country this step may
involve additional agencies or sectors of the NSO.
55. In cases where the existing data is in another agency the establishment of institutional and
operational arrangements governing the shared use of these data may need to be put in place
before the data can be secured. Again this may require that development of different accounts
proceed along different time paths.
56. EEA compilers will at an early stage need to assure access to these data if it does not
already exist. A key consideration is the terms of access under current institutional
Draft SEEA Technical Note: Land Accounting
14
arrangements. These should support cooperative working arrangements and the release of the
land accounts with sufficient detail to address the policy issues which are important for the
country.
In cases where institutional arrangements are not yet established, it should be noted that this step
can take considerable effort and time as it will be important for all agencies involved to clearly
appreciate the mandate of the other agencies and associated constraints. Establishing and
maintaining good working relations with the agencies that are the source for basic data can pay
dividends later in the production process when estimation challenges can benefit from expertise
in all concerned agencies.
57. While data sources for particular countries will vary, data are typically available from
government agencies concerned with: agriculture; forestry; fishing; environment; geological
survey; urban planning and land administration. Statistical offices may also have data on
agricultural, and/or natural resource management practices more generally, based on surveys.
The operators of satellites, such as the European Space Agency (ESA) and National Aeronautics
Space Administration (NASA), international agencies such as the Food and Agricultural
Organisation (FAO) as well as conservation organisations (such as Artificial Intelligence for
Ecosystem Services ARIES) also provide information on land cover, land use and other data
related to land.
58. In developing land accounts a particular need is to understand the means by which the
underlying data on land cover and land use are collected and the original purpose of the
collection when using administrative data. Working closely with the originating agencies and
fully considering the associated metadata will be important to insure the appropriate integration
of such alternate data sets.
59. Data on land values and land ownership are often to be found in administrative data sets.
These characteristics often require particular attention to confidentiality constraints. Also, as
mentioned earlier, separating the value of land from other attributes such as structures is a
complex task. Attention should be paid to what attribute information is available from any
datasets that are to be used. The most up to date guidance on estimating land value can be found
in a land Compilation Guide published by Eurostat and the OECD8.
60. When considering the key data to be used for land accounting, scale, resolution and
accuracy are important. However it is essential that data sets that are well established and likely
to be produced and updated on an ongoing basis are used. This will enable repeated reporting of
change over time. In some instances it may be necessary to consider trading-off quality and
continuity.
Collect
61. One of the major constraints in constructing land accounts is the lack of data from a single
source. Accessing relevant information on land requires data collection from a large number of

Draft SEEA Technical Note: Land Accounting
15
administrative entities or agencies and thus require considerable initial effort. Actual data sources
will be different in each country. It is suggested that important national data holders are engaged
in the process of compiling the accounts. They will be able to advise on data availability and
quality. They will also benefit from having their data assessed and used.
62. Broadly, three sources are used; – administrative sources , collection sources and
satellite images sources. . Increasingly, data based on combinations of administrative sources,
collection sources and satellite images sources are being compiled.
• Administrative sources – cadastre maintained by a land registry office, tax
authorities, or land information centre
• Collection sources – population and housing census, Agriculture survey and census,
business survey, other type of survey and census data, and other governmental
organizations information on land
• Satellite images sources – Images of Earth collected by satellites
63. Administrative data (cadastre, land registry, tax data) usually provide detailed
physical data including type of land, location, and owner and can provide more precise
information for some land areas. A cadastre is a comprehensive register of the property within
a country. It is commonly maintained to record the physical status and legal ownership of
land. It includes very detailed maps showing the location of the parcels of land and
dimensions of land, and typically includes the use of the land, ownership and value of the
individual parcels of land. Many times the ownership of the land is maintained through the
use of land title registry that records the change in ownership and could be combined with
cadastral information. Cadastral data sets that bring together administratively based information
on all or significant portion of a countries land are available for many countries. These may
provide sufficient information for the initial classification of various land uses with the reference
to a single dataset.
64. Additional types of administrative data that may be useful in combination with cadastral
data are land registers. Typically a register will include a list of addresses of buildings and
dwellings, type of use and sector ownership, size of land area, and other transaction prices
65. On collection sources, various land surveys, conducted either by national statistics office
or by other government agencies, can be used to capture various characteristics of land such as
how the land is used and the size and provide data on undeveloped areas life forest and other
resources. A survey and census of agriculture is a common source of information for various types
of land used for agricultural purpose. Population census or housing surveys are common sources
for counts of the number of dwellings, and can be used to derived the combined value of the
dwelling and the land. Data sources from survey and census are important as they can provide a high level of specificity regarding the land cover and, in particular, the land use in a given area
66. There is often national or international information available on land cover, typically
derived from satellite imagery sources. Satellite images are important as they enable a broader
assessment of all areas in a country, and as higher resolution images become available permit more

Draft SEEA Technical Note: Land Accounting
16
detailed analyses. While sources such as satellite imagery can provide data on the entire country,
it should be pointed out that challenges in classification will need to be carefully considered. As
with many classification processes one must consider dominance in coverage of a particularly area
and that may be difficult to ascertain depending on the resolution of images available. Also, in
some instances images may hide coverage aspects, for example a tree covered wetland will often
from a satellite image simply look like any tree covered area. Assessing the accuracy and
uncertainty in the use of remote sensing data for land account will normally require use of ground-
truthing (point) data.
67. The following list suggests some generic government departments and the data they may
hold:
• Departments of Environment or Parks: Protected areas, habitat types, ecological
classifications
• Departments of Natural Resources: Hydrology, remote sensing data (land cover)
• Departments of Agriculture: Agricultural land use, soil type, farm locations
• Departments of Forestry: Forest land use, forest land cover, forest concessions
• Departments of Fisheries: Coastal and marine characteristics (habitat types)
• Departments of Public Works and Transportation: Road networks, power
transmission lines, pipelines
• National Statistical Offices: Population and housing census, agriculture survey and
census, business survey, settlement areas
• Land registries: Ownership
Process
68. Import data and process data including applying concordances that may be required
between the classifications used in the imported data and the classifications to be used in the
estimates.
69. As always with administrative data, adjustments may be needed to align administrative
sources with the SNA and SEEA concepts.
70. A challenge in geospatial analysis is combining information from various sources
according to a common geographical classification.9 For this purpose it is necessary to delineate
(or mark out) a set of relatively small spatial areas (essentially building blocks). Information can
then be attributed to these spatial areas, different types of data may not be easily attributed to the
same spatial scale so different methods/techniques may need to be employed in attributing the
data to these areas such as area weighting. Each technique will have to be considered relative to
increases in uncertainty that it may introduce.

Draft SEEA Technical Note: Land Accounting
17
71. Prepare estimates, including the estimation of data for any data gaps. Given the use of
proxies to estimate some data and the varying quality and coverage of these, it is likely that
different methods will need to be considered for each industry/sector of the economy.
Analyse
72. Analyse tables and graphic representations including undertaking an analysis of time
series where possible and recognising the likely need for multiple iterations of this and the
previous step. Data quality should be assessed and documented at this stage.
73. The above three steps are the core activities in building the accounts and will be repeated
in cycle during each production period. This allows the strength of the accounting approach to
be used to confront the various data sources and check for consistency and reasonableness in
comparison to other datasets.
74. The first time accounts are estimated for a new program, particular attention needs to be
made with regard to adjustments required to the source data to ensure the methods used are
appropriate and sound.
75. It is recommended that in cases where significant basic data come from other agencies
that staff of those agencies be asked to participate in the analysis of the estimates.10 These
experts often have in depth knowledge that can allow the identification and resolution of
inconstancies.
Disseminate
76. The dissemination of data should always be accompanied by sufficient documentation
and metadata to allow users to fully understand the information being disseminated. This is
particularly important for the initial dissemination of a new program of data where one might
want to identify the initial data as ‘experimental’ or ‘preliminary’ and make it clear that user
input is being sought in order to improve future releases.
Evaluate
80. Archive data and related methodological and other documentation. Review estimates,
data sources, methods and systems, including actively seeking user feedback.
81. These last two steps are very important for all statistical programs but when initiating a
new program of data, seeking user feedback is crucial. This in turn depends on the existence of
good documentation on the methods and systems so as to properly inform users and assess their
feedback.
10 In particular, it may be important to assure that confidentiality masks are consistent across agencies such that
residual disclosure does not occur.
Draft SEEA Technical Note: Land Accounting
18
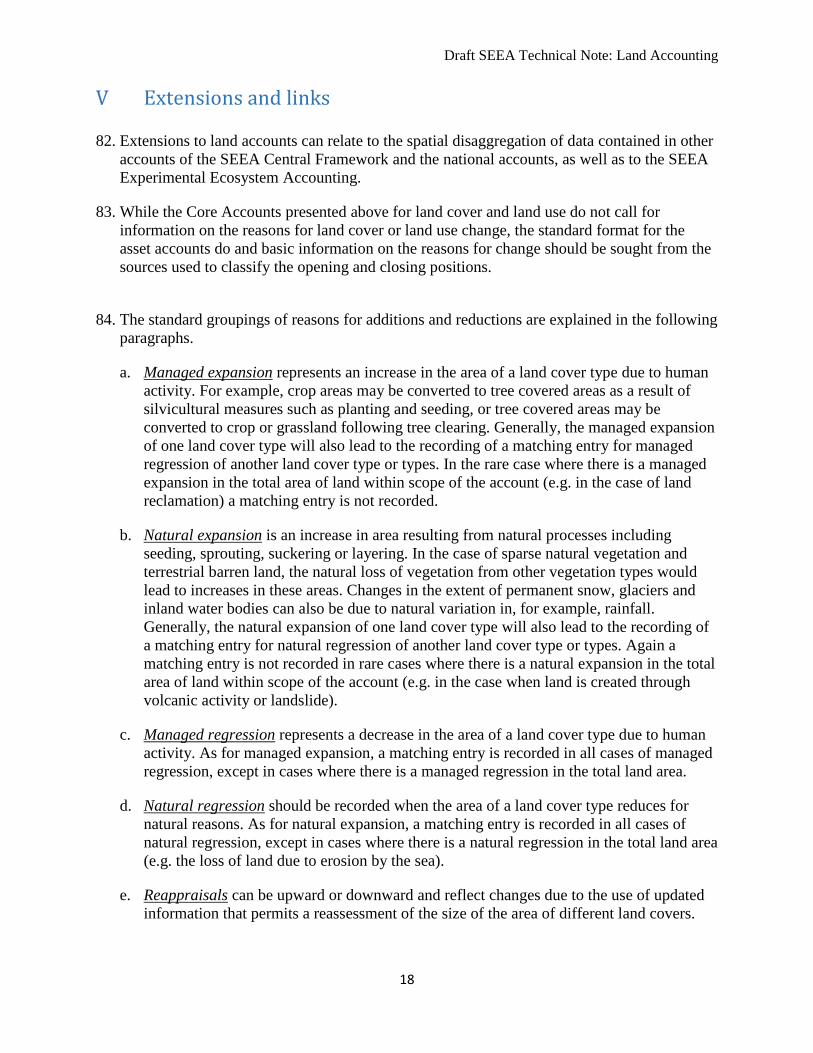
V Extensions and links
82. Extensions to land accounts can relate to the spatial disaggregation of data contained in other
accounts of the SEEA Central Framework and the national accounts, as well as to the SEEA
Experimental Ecosystem Accounting.
83. While the Core Accounts presented above for land cover and land use do not call for
information on the reasons for land cover or land use change, the standard format for the
asset accounts do and basic information on the reasons for change should be sought from the
sources used to classify the opening and closing positions.
84. The standard groupings of reasons for additions and reductions are explained in the following
paragraphs.
a. Managed expansion represents an increase in the area of a land cover type due to human
activity. For example, crop areas may be converted to tree covered areas as a result of
silvicultural measures such as planting and seeding, or tree covered areas may be
converted to crop or grassland following tree clearing. Generally, the managed expansion
of one land cover type will also lead to the recording of a matching entry for managed
regression of another land cover type or types. In the rare case where there is a managed
expansion in the total area of land within scope of the account (e.g. in the case of land
reclamation) a matching entry is not recorded.
b. Natural expansion is an increase in area resulting from natural processes including
seeding, sprouting, suckering or layering. In the case of sparse natural vegetation and
terrestrial barren land, the natural loss of vegetation from other vegetation types would
lead to increases in these areas. Changes in the extent of permanent snow, glaciers and
inland water bodies can also be due to natural variation in, for example, rainfall.
Generally, the natural expansion of one land cover type will also lead to the recording of
a matching entry for natural regression of another land cover type or types. Again a
matching entry is not recorded in rare cases where there is a natural expansion in the total
area of land within scope of the account (e.g. in the case when land is created through
volcanic activity or landslide).
c. Managed regression represents a decrease in the area of a land cover type due to human
activity. As for managed expansion, a matching entry is recorded in all cases of managed
regression, except in cases where there is a managed regression in the total land area.
d. Natural regression should be recorded when the area of a land cover type reduces for
natural reasons. As for natural expansion, a matching entry is recorded in all cases of
natural regression, except in cases where there is a natural regression in the total land area
(e.g. the loss of land due to erosion by the sea).
e. Reappraisals can be upward or downward and reflect changes due to the use of updated
information that permits a reassessment of the size of the area of different land covers.

Draft SEEA Technical Note: Land Accounting
19
For example, new satellite imagery or updated interpretation of satellite imagery or new
administrative data sources. The use of updated information may require the revision of
previous estimates to ensure a continuity of time series.
85. Information on reasons for change is more difficult to acquire. Satellite images will not
provide such information but it might be possible to infer it in some cases, although
confirmation from alternate sources would be encouraged. Administrative or survey sources
are more likely to provide such information but again the original purposes of the datasets
will need to be considered in interpreting these sources.
86. A starting point for the general approach is the land cover change matrix, (account 4 depicted
above). For example, managed expansion can be derived from the changes in land cover
related to urban growth and development of infrastructure (through conversion of crops or
tree covered area), intensification and industrialisation of agriculture (through conversion of
family farming and mosaic landscapes), extension of agriculture in general (through
conversion of tree covered land), drainage of regularly flooded areas (wetlands) for crops or
artificial surfaces (urban land), and deforestation (of tree covered areas for timber production
or agriculture development). Relating land cover and land use is particularly important. The
relationship of land cover to land use can be highlighted by preparing accounts showing land
cover by land use. If this is done for several points in time, then changes between two points
in time can be highlighted. Such change accounts would, for example, show the extent to
which forest areas (a land cover) are changing from, for example, maintenance and
restoration of environmental functions (a land use) to forestry (another use.).
87. The accounts described in the SEEA-CF generally relate to specific stocks and flows
recorded for a country as a whole. However, all materials, substances and resources are
found in particular locations and, from a policy perspective, knowledge of the location of
various stocks and flows may be of particular relevance. Indeed, national averages usually
hide important local variations and spatially disaggregating data can help to better identify
environmental spatial patterns.
88. The quality of spatial coding must be assessed carefully as additional datasets are linked and
integrated with the land accounts. The original purpose and sources may not provide precise
locational information in all cases. For example, data for many economic data programs are
gathered by enterprise, usually though the head office, but head offices are often not located
where the majority of material flows occur, particularly in large scale manufacturing or
mining operations. It may be necessary to pursue more precise locations for some economic
activities to fully exploit such data integration.
89. Both land use and land cover accounts can also be presented in monetary terms. That is,
while the table structure remains the same, the units of measurement are in monetary units ($,
€, ¥, etc.). Data sources for valuation are generally more aligned with land use and therefore
monetary accounts by land use are easier to construct. Land use accounts also generally
relate more directly to the existing monetary information on land as an asset in the national
accounts.

Draft SEEA Technical Note: Land Accounting
20
90. Many sources of information on the value of properties have the value for the combined
characteristics of the property. This will include the characteristics of the land such as soil,
the value of structures such as production plants or buildings and the location. Estimating the
value of only the land is a complex and challenging task.
91. A joint Eurostat/OECD Task Force, is developing a compilation manual that provides
guidance on this complex issue and it is recommended that countries use this as a basic
source for undertaking this task11.
92. The potential of combining geospatial analysis with the data contained in SEEA style
accounts is demonstrated by the following example. This example works within the general
framework provided and shows measures of land use. The accounts may also be structured to
consider land in terms of ownership by economic units, for example by industry or
institutional sector. It should be recognised that the completion of geospatial analysis
requires strong underlying information systems. A description of the systems, methodologies
and best practices in GIS is beyond the scope of the SEEA Central Framework and this note,
but this type of information can be found elsewhere12.
93. A relatively simple example of spatially attributed information is presented in Figure 1. A
focus on the use of specific spatial areas enables a stronger, joint consideration of social,
economic and environmental implications of various policy choices and options. The
expansion in the use of land for housing, for example, requires in turn infrastructure such as
roads, sewers, and water supply lines and at the same time can lead to encroachment into
high quality agricultural land. Potential environmental impacts include loss of wildlife
habitat, increased air pollution and greenhouse gas emissions, and the contamination of
rivers, lakes and aquifers. The type or form of expansion may also be significant. For
example, is the expansion relatively high or low density in terms of changes in human
population?
94. Figure 1 shows a simple presentation of human settlements and agricultural land (Statistics
Canada 2010). In this, settlements were defined as tracts of land where humans have altered
the physical environment, while dependable agricultural land is land free of severe
constraints to crop production. The methodology used to create this map also provides a
more detailed, harmonised and comparable suite of data that enables a more complete
analysis of settlements and formed the basis for the development of indicators that can be
used to track land cover and land use change (Filoso 2011).
11 Specific reference for Eurostat-OECD Task Force document.
12 For example, see the text books of de Smith et al (2013) or Tomlinson (2005) and a range of on-line information. For example the websites of ESRI, ESA, Geoscience Australia, NASA, and USGS

Draft SEEA Technical Note: Land Accounting
21
95. Another example from Australia can be found at Experimental Land Account for the Great Barrier
Reef, 2014.
Figure 1. Map of settlements and dependable agricultural land

Draft SEEA Technical Note: Land Accounting
22
VI References and links
ARIES (Artificial Intelligence for Ecosystem Services). http://www.ariesonline.org
ABS (Australian Bureau of Statistics) 2011. Land Accounts, Great Barrier Reef Region.
Experimental Estimates. http://www.abs.gov.au/ausstats/[email protected]/mf/4609.0.55.001
ABS (Australian Bureau of Statistics) 2012. Land Accounts, Victoria. Experimental Estimates.
http://www.abs.gov.au/ausstats/[email protected]/mf/4609.0.55.002
ABS (Australian Bureau of Statistics) 2013. Towards the Australian Environmental-Economic
Accounts. Chapter 6. Land and Ecosystem Accounting.
http://www.abs.gov.au/ausstats/[email protected]/mf/4655.0.55.002
de Smith, M, Longley, P, and Goodchild, M (2013) Geospatial Analysis: A Comprehensive
Guide to Principles, Techniques, and Software Tools. 4th Edition
http://www.spatialanalysisonline.com/
DSE (Department of Sustainability and Environment, Victoria). 2012. Experimental Ecosystem
Accounts for Victoria.
https://ensym.dse.vic.gov.au/cms/index.php?option=com_content&view=article&id=60&Itemid
=71
EEA (European Environment Agency). 2011 An experimental framework for ecosystem capital
accounting in Europe. http://www.eea.europa.eu/publications/an-experimental-framework-for-
ecosystem
EEA (European Environment Agency). 2012. Land and Ecosystem Accounting.
http://www.eea.europa.eu/themes/landuse/interactive/land-and-ecosystem-accounting-leac
ESA (European Space Agency). Observing the Earth.
http://www.esa.int/Our_Activities/Observing_the_Earth/How_does_Earth_Observation_work
Filoso, G. (2011). Settlements in Canada. Statistics Canada. http://www.statcan.gc.ca/pub/16-
002-x/16-002-x2011002-eng.pdf
Geoscience Australia. Data and applications. http://www.ga.gov.au/products-services/data-
applications.html
NASA (National Aeronautics Space Administration). Langley Research Center. Geographic
Information Systems (GIS) Team. http://gis.larc.nasa.gov/ and The Landsat Program
http://landsat.gsfc.nasa.gov/
Statistics Canada (2010). A new research project on Canadian settlements: initial geographic
results. http://www.statcan.gc.ca/pub/16-002-x/2010001/article/11134-eng.htm
Tomlinson, R.F., (2005) Thinking About GIS: Geographic Information System Planning for
Managers. ESRI Press. www.esri.com/products
UN (United Nations) et al. (2012). System of Environmental Economic Accounting – Central
Framework. http://unstats.un.org/unsd/envaccounting/White_cover.pdf

Draft SEEA Technical Note: Land Accounting
23
USGS (United States Geological Survey). Maps, Imagery and Publications.
http://www.usgs.gov/pubprod/
Vardon, Michael and Tom Walter, (2013). Technical Note: Land Accounting, Version 1.1,
Australian Bureau of Statistics

Draft SEEA Technical Note: Land Accounting
24
VII Annex
Description of land cover classes The following descriptions of different land cover types are based on the FAO Land Cover
Classification System (LCCS).
01 Artificial surfaces (including urban and associated areas)
The class is composed of any type of areas with a predominant artificial surface. Any urban or
related feature is included in this class, for example, urban parks (parks, parkland and laws). The
class also includes industrial areas, and waste dump deposit and extraction sites.
02 Herbaceous crops
The class is composed of a main layer of cultivated herbaceous plants (graminoids or forbs). It
includes herbaceous crops used for hay. All the non-perennial crops that do not last for more
than two growing seasons and crops like sugar cane, where the upper part of the plant is
regularly harvested while the root system can remain for more than one year in the field, are
included in this class.
03 Woody crops
The class is composed of a main layer of permanent crops (trees or shrub crops) and includes all
types of orchards and plantations (fruit trees, coffee and tea plantation, oil palms, rubber
plantation, Christmas trees, etc.).
04 Multiple or layered crops
This class combine two different land cover situations:
Two layers of different crops. A common case is the presence of one layer of woody crops (trees
or shrubs) and another layer of herbaceous crop, e.g., wheat fields with olive trees in the
Mediterranean area and intense horticulture, or oasis or typical coastal agriculture in Africa,
where herbaceous fields are covered by palm trees.
Presence of one important layer of natural vegetation (mainly trees) that covers one layer of
cultivated crops. Coffee plantations shadowed by natural trees in the equatorial area of Africa are
a typical example.
05 Grassland
This class includes any geographical area dominated by natural herbaceous plants (grasslands,
prairies, steppes and savannahs) with a cover of 10 per cent or more, irrespective of different
human and/or animal activities, such as grazing or selective fire management. Woody plants
(trees and/or shrubs) can be present, assuming their cover is less that 10 per cent.
06 Tree-covered areas

Draft SEEA Technical Note: Land Accounting
25
This class includes any geographical area dominated by natural tree plants with a cover of 10 per
cent or more. Other types of plants (shrubs and/or herbs) can be present, even with a density
higher than that of trees. Areas planted with trees for afforestation purposes and forest
plantations are included in this class. This class includes areas seasonally or permanently flooded
with freshwater. It excludes coastal mangroves (→07).
07 Mangroves
This class includes any geographical area dominated by woody vegetation (trees and/or shrubs)
with a cover of 10 per cent or more that is permanently or regularly flooded by salt and/or
brackish water located in the coastal areas or in the deltas of rivers.
08 Shrub-covered areas
This class includes any geographical area dominated by natural shrubs having a cover of 10 per
cent or more. Trees can be present in scattered form if their cover is less than 10 per cent.
Herbaceous plants can also be present at any density. The class includes shrub-covered areas
permanently or regularly flooded by inland fresh water. It excludes shrubs flooded by salt or
brackish water in coastal areas (→07).
09 Shrubs and/or herbaceous vegetation, aquatic or regularly flooded
This class includes any geographical area dominated by natural herbaceous vegetation (cover of
10 per cent or more) that is permanently or regularly flooded by fresh or brackish water
(swamps, marsh areas, etc.). Flooding must persist for at least two months per year to be
considered regular. Woody vegetation (trees and/or shrubs) can be present if their cover is less
than 10 per cent.
10 Sparsely natural vegetated areas
This class includes any geographical areas were the cover of natural vegetation is between 2 per
cent and 10 per cent. This includes permanently or regularly flooded areas.
11 Terrestrial barren land
This class includes any geographical area dominated by natural abiotic surfaces (bare soil, sand,
rocks, etc.) where the natural vegetation is absent or almost absent (covers less than 2 per cent).
The class includes areas regularly flooded by inland water (lake shores, river banks, salt flats,
etc.). It excludes coastal areas affected by the tidal movement of saltwater (→14).
12 Permanent snow and glaciers
This class includes any geographical area covered by snow or glaciers persistently for 10 months
or more.
13 Inland water bodies
This class includes any geographical area covered for most of the year by inland water bodies. In
some cases, the water can be frozen for part of the year (less than 10 months). Because the
Draft SEEA Technical Note: Land Accounting
26
geographical extent of water bodies can change, boundaries must be set consistently with those
set by class 11, according to the dominant situation during the year and/or across multiple years.
14 Coastal water bodies and intertidal areas The class is defined on the basis of geographical
features of the land in relation to the sea (coastal water bodies, i.e., lagoons and estuaries) and
abiotic surfaces subject to water persistence (intertidal areas, i.e., coastal flats and coral reefs).
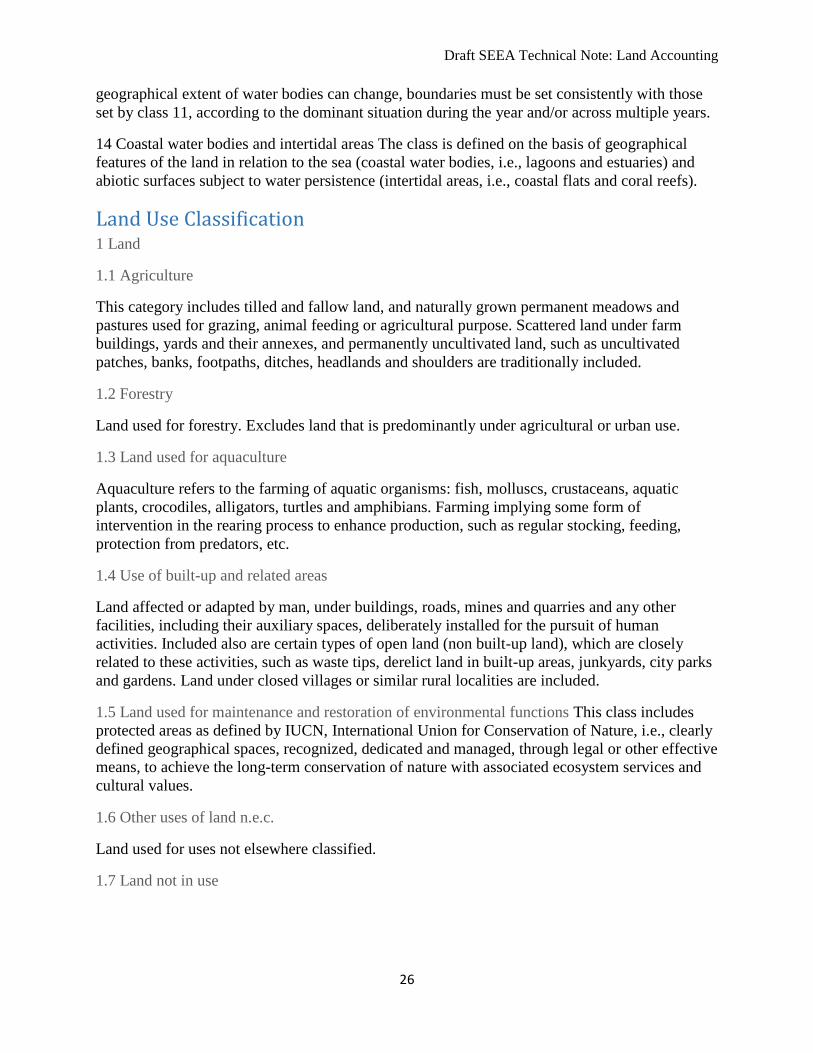
Land Use Classification 1 Land
1.1 Agriculture
This category includes tilled and fallow land, and naturally grown permanent meadows and
pastures used for grazing, animal feeding or agricultural purpose. Scattered land under farm
buildings, yards and their annexes, and permanently uncultivated land, such as uncultivated
patches, banks, footpaths, ditches, headlands and shoulders are traditionally included.
1.2 Forestry
Land used for forestry. Excludes land that is predominantly under agricultural or urban use.
1.3 Land used for aquaculture
Aquaculture refers to the farming of aquatic organisms: fish, molluscs, crustaceans, aquatic
plants, crocodiles, alligators, turtles and amphibians. Farming implying some form of
intervention in the rearing process to enhance production, such as regular stocking, feeding,
protection from predators, etc.
1.4 Use of built-up and related areas
Land affected or adapted by man, under buildings, roads, mines and quarries and any other
facilities, including their auxiliary spaces, deliberately installed for the pursuit of human
activities. Included also are certain types of open land (non built-up land), which are closely
related to these activities, such as waste tips, derelict land in built-up areas, junkyards, city parks
and gardens. Land under closed villages or similar rural localities are included.
1.5 Land used for maintenance and restoration of environmental functions This class includes
protected areas as defined by IUCN, International Union for Conservation of Nature, i.e., clearly
defined geographical spaces, recognized, dedicated and managed, through legal or other effective
means, to achieve the long-term conservation of nature with associated ecosystem services and
cultural values.
1.6 Other uses of land n.e.c.
Land used for uses not elsewhere classified.
1.7 Land not in use

Draft SEEA Technical Note: Land Accounting
27
Areas where there are no clearly visible indications of human activities or institutional
arrangements put in place for the purpose of economic production or the maintenance and
restoration of environmental functions and where ecological processes are not significantly
disturbed.
2 Inland waters
Inland waters are areas corresponding to natural or artificial water courses, serving to drain
natural or artificial bodies of water, including lakes, reservoirs, rivers, brooks, streams, ponds,
inland canals, dams, and other land-locked (usually freshwater) waters. The banks constitute
limits whether the water is present or not.
2.1 Inland waters used for aquaculture or holding facilities Inland water areas that are used for
aquaculture facilities including supporting facilities. Aquaculture refers to the farming of aquatic
organisms: fish, molluscs, crustaceans, aquatic plants, crocodiles, alligators, turtles and
amphibians.
2.2 Inland waters used for maintenance and restoration of environmental functions
Protected inland water areas as defined in 1.5. This class includes enhanced areas (areas with
enhancement including stocking, fertilization, engineering, predator control, habitat
modifications and/or access limits.)
The class excludes protected wetlands (→1.5) and protected coastal waters (→3.2).
2.3 Other uses of inland waters n.e.c.
Inland water areas used for uses not elsewhere classified.
Draft SEEA Technical Note: Land Accounting
28
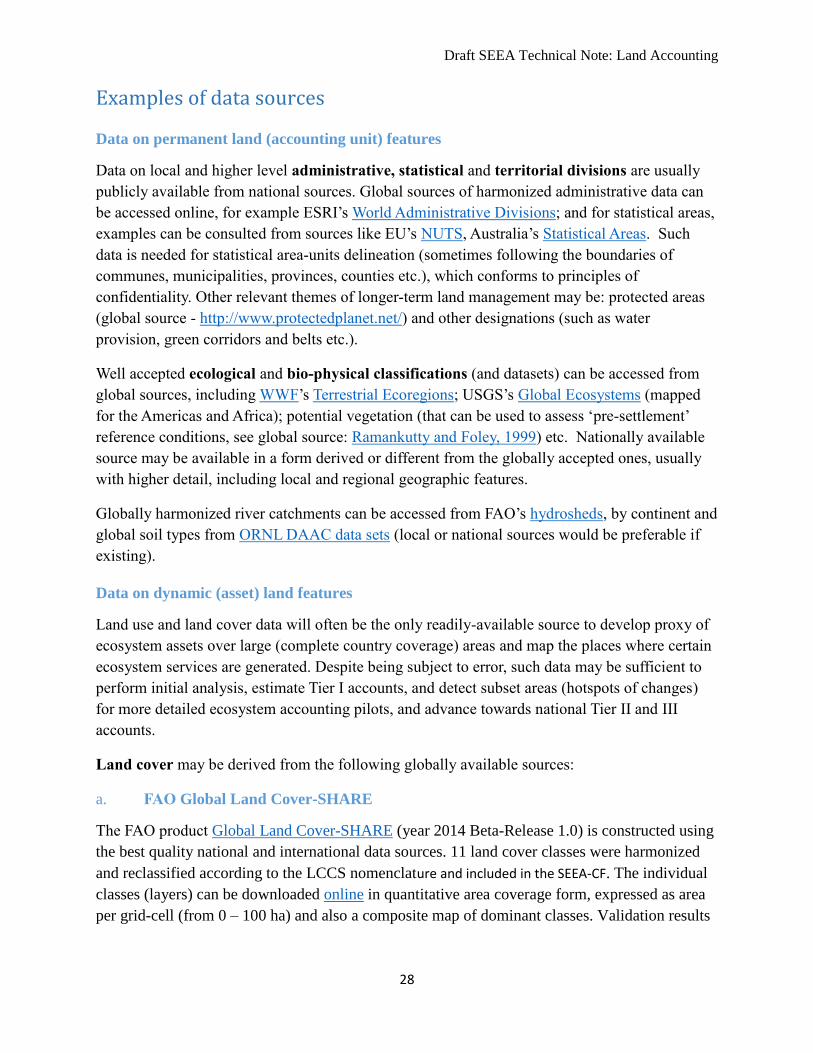
Examples of data sources
Data on permanent land (accounting unit) features
Data on local and higher level administrative, statistical and territorial divisions are usually
publicly available from national sources. Global sources of harmonized administrative data can
be accessed online, for example ESRI’s World Administrative Divisions; and for statistical areas,
examples can be consulted from sources like EU’s NUTS, Australia’s Statistical Areas. Such
data is needed for statistical area-units delineation (sometimes following the boundaries of
communes, municipalities, provinces, counties etc.), which conforms to principles of
confidentiality. Other relevant themes of longer-term land management may be: protected areas
(global source - http://www.protectedplanet.net/) and other designations (such as water
provision, green corridors and belts etc.).
Well accepted ecological and bio-physical classifications (and datasets) can be accessed from
global sources, including WWF’s Terrestrial Ecoregions; USGS’s Global Ecosystems (mapped
for the Americas and Africa); potential vegetation (that can be used to assess ‘pre-settlement’
reference conditions, see global source: Ramankutty and Foley, 1999) etc. Nationally available
source may be available in a form derived or different from the globally accepted ones, usually
with higher detail, including local and regional geographic features.
Globally harmonized river catchments can be accessed from FAO’s hydrosheds, by continent and
global soil types from ORNL DAAC data sets (local or national sources would be preferable if
existing).
Data on dynamic (asset) land features
Land use and land cover data will often be the only readily-available source to develop proxy of
ecosystem assets over large (complete country coverage) areas and map the places where certain
ecosystem services are generated. Despite being subject to error, such data may be sufficient to
perform initial analysis, estimate Tier I accounts, and detect subset areas (hotspots of changes)
for more detailed ecosystem accounting pilots, and advance towards national Tier II and III
accounts.
Land cover may be derived from the following globally available sources:
a. FAO Global Land Cover-SHARE
The FAO product Global Land Cover-SHARE (year 2014 Beta-Release 1.0) is constructed using
the best quality national and international data sources. 11 land cover classes were harmonized
and reclassified according to the LCCS nomenclature and included in the SEEA-CF. The individual
classes (layers) can be downloaded online in quantitative area coverage form, expressed as area
per grid-cell (from 0 – 100 ha) and also a composite map of dominant classes. Validation results

Draft SEEA Technical Note: Land Accounting
29
indicate overall Producer’s accuracy of 80% (variable between 50 and 100% for the individual
classes). The available product has to be tested if possible to apply for multi-temporal analysis
(e.g. for countries where the original data source contains more than one year maps).
The 1km grid-maps may be too coarse for spatial analysis, yet the available data may be applied
to enhance its quality and spatial detail, as well to reproduce annual time-series using remote
sensing imagery.
b. MODIS Land Cover
Modis Land Cover is a set of annual products based on NASA’s MODIS imagery, and available
at 500m x 500m spatial resolution. The product name is ‘Land Cover Type Yearly L3’ (version
51 is the latest), metadata can be reviewed, and spatial data downloaded from
http://reverb.echo.nasa.gov/. The data is distributed as ‘granules’, which need to be identified by
the user (online) prior to downloading. If the study area is large (e.g. a continent) considerable
pre-processing will be needed to ensemble (‘mosaic’) and harmonize the datasets. MODIS land
cover products13 are summarised below. See nomenclatures for the five products in Annex 1.
The MODIS Land Cover Type product contains five classification schemes, which describe land
cover properties derived from observations spanning a year’s input of Terra- and Aqua-MODIS
data. The primary land cover scheme identifies 17 land cover classes defined by the
International Geosphere Biosphere Programme (IGBP), which includes 11 natural vegetation
classes, 3 developed and mosaicked land classes, and three non-vegetated land classes.
The MODIS Terra + Aqua Land Cover Type Yearly L3 Global 500 m SIN Grid product
incorporates five different land cover classification schemes, derived through a supervised
decision-tree classification method:
• Land Cover Type 1: IGBP global vegetation classification scheme
• Land Cover Type 2: University of Maryland (UMD) scheme
• Land Cover Type 3: MODIS-derived LAI/fPAR scheme
• Land Cover Type 4: MODIS-derived Net Primary Production (NPP) scheme
• Land Cover Type 5: Plant Functional Type (PFT) scheme
V051 Land Cover Type products are produced with revised training data and certain algorithm
refinements. For further details, please consult the following paper:
Friedl, M. A., Sulla-Menashe, D., Tan, B., Schneider, A., Ramankutty, N., Sibley, A., andHuang,
X. (2010). MODIS Collection 5 global land cover: Algorithm refinements and characterization
of new datasets. Remote Sensing of Environment, 114, 168–182.
Temporal analysis of land cover change may be obstructed by the data quality and course
resolution, however it may be feasible to improve the available data for accounts estimation.
13 https://lpdaac.usgs.gov/products/modis_products_table/mcd12q1
Draft SEEA Technical Note: Land Accounting
30
c. ESA’s GlobCover
The European Space Agency has produced the GlobCover maps at 300 m spatial resolution for
year 2005-6 and 2009 using MERIS imagery. The two temporal maps are not compatible for
land use change analysis however. GlobCover applies a hierarchical classification scheme.
Global and regional nomenclatures can be consulted online (see Annex II in ESA’s report
“GLOBCOVER Products Description and Validation Report” 14).
d. GlobeLand30
Very high resolution global land cover maps were produced by China, known as GlobeLand30,
for years 2000 and 2010, with 10 classes and 30 m resolution, based on the freely available
imagery from NASA’s Landsat satellite instruments. The data is available online after
registration, and was also donated to the UN.
GlobLand30 classification nomenclature15
1. Water bodies
2. Wetland
3. Artificial Surfaces
4. Tundra
5. Permanent snow and ice
6. Grass lands
7. Barren lands
8. Cultivated land
9. Shrub lands
10. Forests
GlobLand30 may be the most appropriate dataset for ecosystem accounting, because of its
highest spatial detail and the possibility to analyze land cover change; however its quality needs
to be well evaluated, since it is the newest source, among other reasons.
Land use data is usually not readily and uniformly available and therefore needs to be assembled
from a number of sources, most commonly applicable would be sought from agriculture,
forestry, mining, transport, industry and urban planning and administration (including parks and
recreation). Protected areas administration and management (including zoning), hunting and
fishing areas etc. may provide very relevant land use information too. The subject generally
needs much further efforts for developing harmonized inputs (including spatial data) in land and
ecosystem accounting. The European CORINE product introduced land use categories in its
combine land cover and use nomenclature (see details in Section 3). Examples of mapping
14 http://due.esrin.esa.int/files/GLOBCOVER_Products_Description_Validation_Report_I2.1.pdf
15 http://www.globallandcover.com/GLC30Download/index.aspx

Draft SEEA Technical Note: Land Accounting
31
ecosystem services with land use include Bateman et al. (2013) and specific tools for the
purpose: LUSI, Polyscape (see Jackson et al. 2013) etc.
Administrative data (including maps) on land ownership are likely to be available from national
sources such as Official land cadasters or similar land administration registers, for example
UK’s Ordinance survey. Classification of Land ownerships should be developed, including
private and public domains, which may overlap or differ from land use. For example, abandoned
cropland may still belong to a farmer, but actually be used for nature restoration.
Land cover, land use and land ownership can change in a very dynamic way independently from
each other. Therefore these three properties of land may need to be classified and mapped
separately for a complete accounting application at Tier III.
Note that a number of other themes and sources of spatial data related to ecosystem functions
or components will be very relevant for the accounting purposes (to map condition for example):
• Forest cover and deforestation - University of Maryland product “Global Forest Change
• Vegetation types, physiognomy, productivity, habitats etc.