analysis of forced draft cooling tower performance using ansys fluent ...

This document is intended for the sole use of the party to whom it is addressed and may contain information that is privileged and/or confidential. If you have received this in error, please notify us immediately.
® RWDI name and logo are registered trademarks in Canada and the United States of America
Reputation Resources Results Canada | USA | UK | India | China www.rwdi.com
Tel: +44 (0)1582 470250 Fax: +44 (0)1582 470259 RWDI Anemos Ltd Unit 4 Lawrence Industrial Estate Lawrence Way Dunstable, Bedfordshire LU6 1BD United Kingdom
Agaoglu Maslak 1453 Project Istanbul, Turkey
Draft Report – Tower C
Cladding Pressures RWDI # 1300132
June 14, 2013
SUBMITTED TO
Murat Akbas [email protected]
Yapi Teknik Ins.San. Proje Ve Taah Ltd.Sti
Kisikli Cad. No.4 Sarkuysan Ak Plaza Altunizade-Uskudar
Istanbul t +90 216 651 85 80
SUBMITTED BY Samantha Fowler Project Engineer
Matteo Pavarini Project Engineer
Gary Clarke Project Manager
Anton Davies Project Director

Reputation Resources Results Canada | USA | UK | India | China www.rwdi.com
Agaoglu Maslak EGYO Project – Istanbul, Turkey Cladding Pressures RWDI#1300132 June 14, 2013.
TABLE OF CONTENTS
1. INTRODUCTION ................................................................................................................................... 1
2. WIND TUNNEL TESTS ........................................................................................................................ 2
2.1 Study Model and Surroundings ..................................................................................................... 2
2.2 Upwind Profiles ............................................................................................................................. 2
3. WIND CLIMATE .................................................................................................................................... 2
4. DETERMINING CLADDING WIND LOADS FROM WIND TUNNEL TEST RESULTS ...................... 3
5. RECOMMENDED CLADDING DESIGN WIND LOADS ...................................................................... 3
6. APPLICABILITY OF RESULTS ........................................................................................................... 4
6.1 The Proximity Model ..................................................................................................................... 4
6.2 Study Model .................................................................................................................................. 4
Tables
Table 1: Drawing List for Model Construction
Figures
Figure 1: Wind Tunnel Study Model Figure 2: Site Plan Figure 3: Directional Distribution of Local Wind Speeds Figure 4: Recommended Wind Loads for Cladding Design, Peak Negative Pressures, C14
Convex Block Wall Figure 5: Recommended Wind Loads for Cladding Design, Peak Negative Pressures, C14 –
Right Side and C14 – Left Side Figure 6: Recommended Wind Loads for Cladding Design, Peak Negative Pressures, C14
Concave Block Wall Figure 7: Recommended Wind Loads for Cladding Design, Peak Negative Pressures, Roof
Plans and Soffit Plan Figure 8: Recommended Wind Loads for Cladding Design, Peak Positive Pressures, C14
Convex Block Wall Figure 9: Recommended Wind Loads for Cladding Design, Peak Positive Pressures, C14 –
Right Side and C14 – Left Side Figure 10: Recommended Wind Loads for Cladding Design, Peak Positive Pressures, C14
Concave Block Wall Figure 11: Recommended Wind Loads for Cladding Design, Peak Negative Pressures, Roof
Plans and Soffit Plan
Appendices Appendix A: Wind Tunnel Procedures

Reputation Resources Results Canada | USA | UK | India | China www.rwdi.com
Agaoglu Maslak 1453 Project – Istanbul, Turkey Cladding Pressures RWDI#1300132 June 14, 2013.
Page 1
1. INTRODUCTION
Rowan Williams Davies & Irwin Inc. (RWDI) was retained by Yapi Teknik to study the wind loading on the
proposed Agaoglu Maslak 1453 Project in Istanbul, Turkey. The Agaoglu Maslak 1453 Project is a multi-
tower development comprised of four phases, with hotel, residential, office, retail and conference
facilities. The objective of this study was to determine the wind loads for design of the exterior envelope of
the tower C design.
The following table summarizes relevant information about the design team, results of the study and the
governing parameters:
Project Details:
Architect Leach Rhodes Walker Architects
Key Results and Recommendations:
Recommended Cladding Design Wind Loads
Negative Pressures
Positive Pressures
Figures 4 to 7
Figures 8 to 11
Range of Negative Pressures
Range of Positive Pressures
-1.0 kPa to -2.5 kPa
+1.0 kPa to +2.0 kPa
Selected Analysis Parameters:
Internal Pressures 0.14 kPa
Basic Wind Speed 36m/s 3-second Gust Speed at 10m in open terrain
Importance Factor on Wind Speed 1.0
The wind tunnel test procedures met or exceeded the requirements set out in Section 6.6 of the ASCE 7-
10 Standard. The following sections outline the test methodology for the current study, and discuss the
results and recommendations. Appendix A provides additional background information on the testing and
analysis procedures for this type of study. For detailed explanations of the procedures and underlying
theory, refer to RWDI’s Technical Reference Document - Wind Tunnel Studies for Buildings (RD2-
2000.1), which is available upon request.

Reputation Resources Results Canada | USA | UK | India | China www.rwdi.com
Agaoglu Maslak 1453 Project – Istanbul, Turkey Cladding Pressures RWDI#1300132 June 14, 2013.
Page 2
2. WIND TUNNEL TESTS
2.1 Study Model and Surroundings
A 1:400 scale model of the proposed development was constructed using the architectural drawings listed
in Table 1. The model was instrumented with 408 pressure taps and was tested in the presence of all
surroundings within a full-scale radius of 460 m, in RWDI’s 2.4 m 2.0 m boundary layer wind tunnel
facility in Dunstable, Bedfordshire for the following test configurations:
Configuration 1 – Proposed Agaoglu Maslak 1453 development in isolation;
Configuration 2 – Proposed Agaoglu Maslak 1453 development with existing surroundings.
The cladding wind loads presented in this report are a result of combining the data from the two test
configurations into one consolidated set of cladding design wind loads.
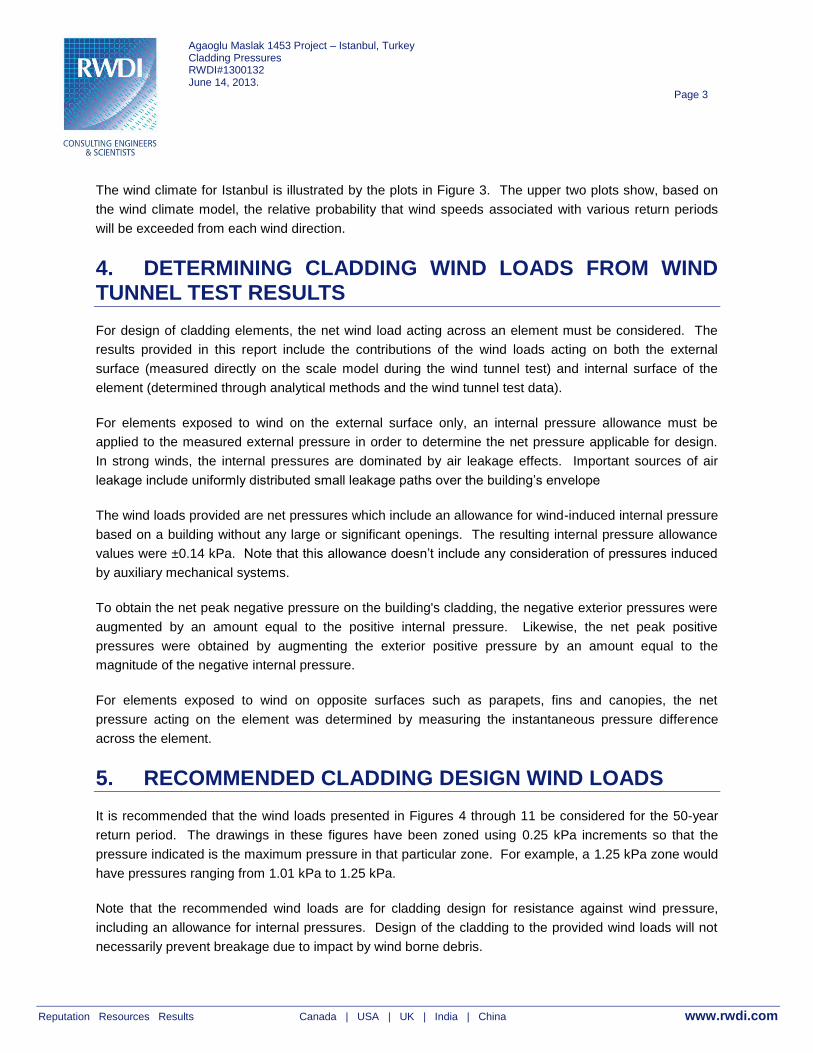
Photographs of the scale model in the boundary layer wind tunnel are shown in Figures 1a and 1b,
corresponding to test configurations 1 and 2, respectively. An orientation plan showing the location of the
study site is given in Figure 2.
2.2 Upwind Profiles
Beyond the modeled area, the influence of the upwind terrain on the planetary boundary layer was
simulated in the testing by appropriate roughness on the wind tunnel floor and flow conditioning spires at
the upwind end of the working section for each wind direction. This simulation, and subsequent analysis
of the data from the model, was targeted to represent the following upwind terrain conditions. Wind
direction is defined as the direction from which the wind blows, measured clockwise from true north.
Upwind Terrain Wind Directions (Inclusive)
Urban/Suburban terrain – varying lengths of suburban and urban fetch immediately upwind of the surrounding model, with open terrain or water beyond.
10° to 360°
3. WIND CLIMATE
In order to predict the full-scale wind pressures acting on the building as a function of return period, the
wind tunnel data were combined with a statistical model of the local wind climate. The wind climate model
was based on local surface wind measurements taken at Ataturk International Airport, Istanbul.
The magnitude of the wind velocity for the 50 year return period corresponded to a 3-second gust wind
speed of 36m/s at a height of 10 m in open terrain. This value is consistent with that identified for Istanbul
in the TS498 Turkish Standard.
Reputation Resources Results Canada | USA | UK | India | China www.rwdi.com
Agaoglu Maslak 1453 Project – Istanbul, Turkey Cladding Pressures RWDI#1300132 June 14, 2013.
Page 3
The wind climate for Istanbul is illustrated by the plots in Figure 3. The upper two plots show, based on
the wind climate model, the relative probability that wind speeds associated with various return periods
will be exceeded from each wind direction.
4. DETERMINING CLADDING WIND LOADS FROM WIND TUNNEL TEST RESULTS
For design of cladding elements, the net wind load acting across an element must be considered. The
results provided in this report include the contributions of the wind loads acting on both the external
surface (measured directly on the scale model during the wind tunnel test) and internal surface of the
element (determined through analytical methods and the wind tunnel test data).
For elements exposed to wind on the external surface only, an internal pressure allowance must be
applied to the measured external pressure in order to determine the net pressure applicable for design.
In strong winds, the internal pressures are dominated by air leakage effects. Important sources of air
leakage include uniformly distributed small leakage paths over the building’s envelope
The wind loads provided are net pressures which include an allowance for wind-induced internal pressure
based on a building without any large or significant openings. The resulting internal pressure allowance
values were ±0.14 kPa. Note that this allowance doesn’t include any consideration of pressures induced
by auxiliary mechanical systems.
To obtain the net peak negative pressure on the building's cladding, the negative exterior pressures were
augmented by an amount equal to the positive internal pressure. Likewise, the net peak positive
pressures were obtained by augmenting the exterior positive pressure by an amount equal to the
magnitude of the negative internal pressure.
For elements exposed to wind on opposite surfaces such as parapets, fins and canopies, the net
pressure acting on the element was determined by measuring the instantaneous pressure difference
across the element.
5. RECOMMENDED CLADDING DESIGN WIND LOADS
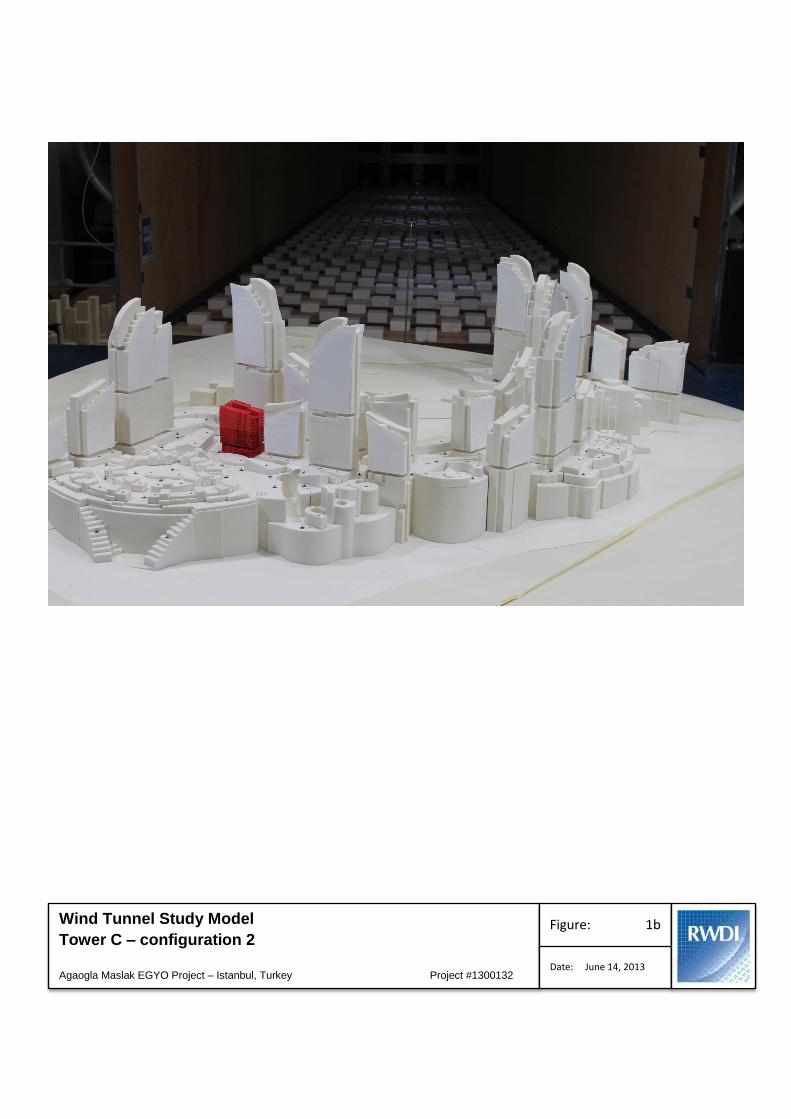
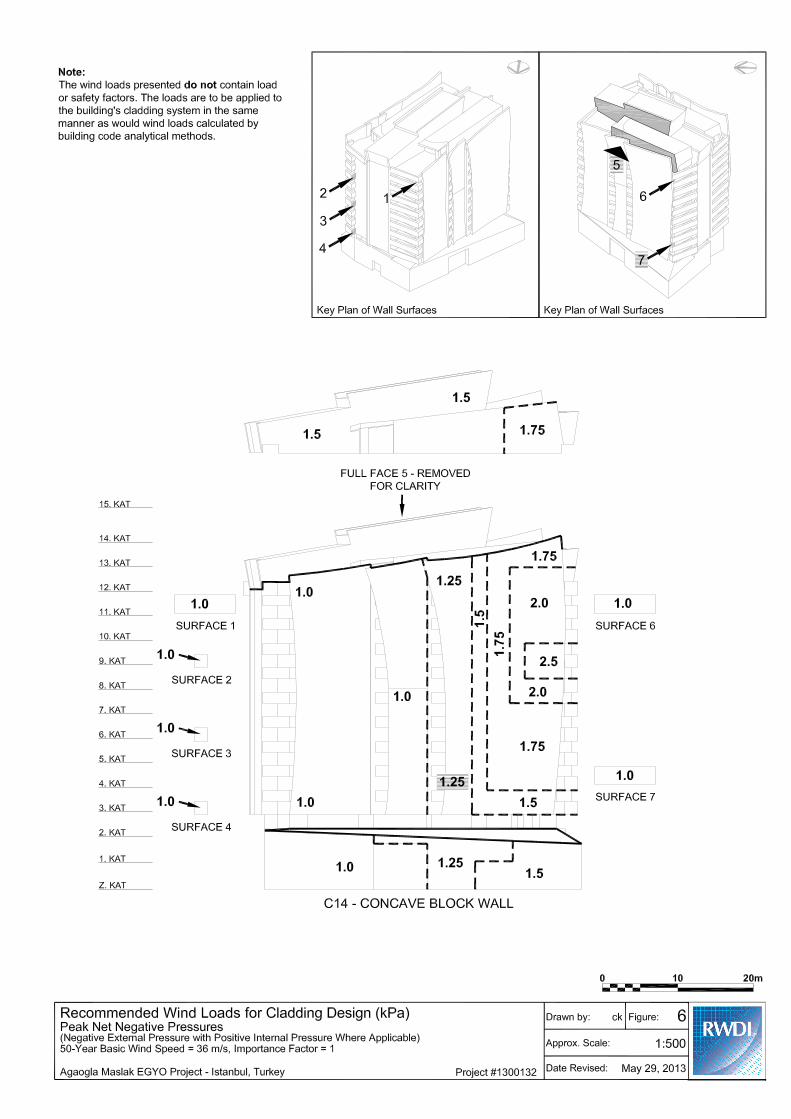
It is recommended that the wind loads presented in Figures 4 through 11 be considered for the 50-year
return period. The drawings in these figures have been zoned using 0.25 kPa increments so that the
pressure indicated is the maximum pressure in that particular zone. For example, a 1.25 kPa zone would
have pressures ranging from 1.01 kPa to 1.25 kPa.
Note that the recommended wind loads are for cladding design for resistance against wind pressure,
including an allowance for internal pressures. Design of the cladding to the provided wind loads will not
necessarily prevent breakage due to impact by wind borne debris.

Reputation Resources Results Canada | USA | UK | India | China www.rwdi.com
Agaoglu Maslak 1453 Project – Istanbul, Turkey Cladding Pressures RWDI#1300132 June 14, 2013.
Page 4
Note that the wind loads provided in this report include the effects of the directionality in the local
wind climate. These loads do not contain safety or load factors and are to be applied to the
building's cladding system in the same manner as would wind loads calculated by code analytical
methods.
"Negative pressure" or suction is defined to act outward normal to the building's exterior surface and
"positive pressure" acts inward. The largest recommended negative cladding wind load was -2.5 kPa,
which occurred on the C14 Concave Block Wall (Figure 6). The majority of the negative wind loads were
in the range of – 1.0 kPa to -1.25 kPa. The largest recommended positive cladding wind load was +2.0
kPa, which occurred on the C14 Convex Block Wall (Figure 8). The majority of the positive wind loads
were in the range of +1.0 kPa to +1.25 kPa.
6. APPLICABILITY OF RESULTS
6.1 The Proximity Model
The cladding design wind loads determined by the wind tunnel tests and aforementioned analytical
procedures are applicable to the particular configurations of surroundings modeled. The surroundings
model used for the wind tunnel tests reflected the current state of development at the time of testing and
include, where appropriate, known off-site structures expected to be completed in the near future. If, at a
later date, additional buildings besides those considered in the tested configurations are constructed or
demolished near the project site, then some load changes could occur. To make some allowance for
possible future changes in surroundings, our final recommended cladding design wind loads do not go
below a minimum of ±1.0 kPa.
6.2 Study Model
The results presented in this report pertain to the scale model of the proposed development, constructed
using the architectural information listed in Table 1. Should there be any design changes that deviate
substantially from the above information; the results for the revised design may differ from those
presented in this report. Therefore, if the design changes, RWDI should be contacted and requested to
review the impact on the wind loads.

Employee Job Title
TABLESTABLES

Reputation Resources Results Canada | USA | UK | India | China www.rwdi.com
Page 1 of 1
TABLE 1: DRAWING LIST FOR MODEL CONSTRUCTION
The drawings and information listed below were received from Leach Rhodes Walker Architects and were
used to construct the scale model of the proposed Agaogla Maslak EGYO Project. Should there be any
design changes that deviate from this list of drawings, the results may change. Therefore, if changes in
the design area made, it is recommended that RWDI be contacted and requested to review their potential
effects on wind conditions.
File Name File Type Date Received
AgaogluAyazaga-10 .dwg 13/01/03
AgaogluAyazaga-10 .skp 13/01/03

Employee Job Title
FIGURESFIGURES

Wind Tunnel Study Model
Tower C – configuration 1
Agaogla Maslak EGYO Project – Istanbul, Turkey Project #1300132
Figure: 1a
Date: June 14, 2013
Wind Tunnel Study Model
Tower C – configuration 2
Agaogla Maslak EGYO Project – Istanbul, Turkey Project #1300132
Figure: 1b
Date: June 14, 2013


Note: Wind Speeds shown are 3-second Gust Wind Speeds (m/s) at 10 m height in Open Terrain
Directional Distribution of Local Wind Speeds Figure No. 3
Agaogla Maslak EYGO Project - Istanbul, Turkey Project # Date: June 14, 20131300132
0.0
10.0
20.0
30.0
40.0
50.0
60.0
1 10 100 1000 10000
Win
d Sp
eed
Mean Recurrence Interval (years)
Extra-Tropical ASCE-10 Code Wind Speed
0
5
10
15
20
25
30
35
40
45N
1020
30
40
50
60
70
80
E
100
110
120
130
140
150160
170S
190200
210
220
230
240
250
260
W
280
290
300
310
320
330340
350
Extreme Winds
0
2
4
6
8
10
12
14
16
18
20N
1020
30
40
50
60
70
80
E
100
110
120
130
140
150160
170S
190200
210
220
230
240
250
260
W
280
290
300
310
320
330340
350
Common Winds


Employee Job Title
APPENDICES

page A1 of A4
APPENDIX A: WIND TUNNEL PROCEDURES
OVERVIEW OF WIND TUNNEL PROCEDURES FOR THE PREDICTION OF
CLADDING WIND LOADS
A.1 WIND TUNNEL TEST AND ANALYSIS METHODS
A.1.1 Wind Tunnel Tests
RWDI's boundary layer wind tunnel facility simulates the mean speed profile and turbulence of
the natural wind approaching the modeled area by having a long working section with a
roughened floor and specially designed turbulence generators, or spires, at the upwind end.
Floor roughness and spires have been selected to simulate four basic terrain conditions, ranging
from open terrain, or water, to built-up urban terrain. During the tests, the upwind profile in the
wind tunnel is set to represent the most appropriate of these four basic profiles, for directions
with similar upwind terrain. Scaling factors are also introduced at the analysis stage to account
for remaining minor differences between the expected wind speed and turbulence properties, and
the basic upwind flow conditions simulated in the wind tunnel. The full-scale properties are
derived using the ESDU methodology1, 2 for predicting the effect of changes in the earth’s
surface roughness on the planetary boundary layer. For example, this procedure distinguishes
between the flows generated by a uniform open water fetch upwind of the site, versus a short
fetch of suburban terrain immediately upwind of the site with open water in the distance.
Wind direction is defined as the direction from which the wind blows in degrees measured
clockwise from true north. The test model (study model and surroundings) is mounted on a
turntable, allowing any wind direction to be simulated by rotating the model to the appropriate
angle in the wind tunnel. The wind tunnel test is typically conducted for 36 wind directions at
10° intervals.
A.1.2 Measurement Techniques
This study addresses the local wind pressures that act on the exterior envelope of the building.
Predictions of these loads are required in order that the cladding system can be designed to safely
1 Wind speed profiles over terrain with roughness changes for flat or hilly sites. Item No. 84011, ESDUInternational London, 1984 with amendments to 1993.2 Longitudinal turbulence intensities over terrain with roughness changes for flat or hilly sites. Item No.84030, ESDU International London, 1984 with amendments to 1993.
Page A2 of A4
resist the wind loads. The technique that is used to make these predictions consists of
conducting a wind pressure study. The basis of the approach is to instrument a rigid wind tunnel
model of the building with pressure taps that adequately cover the exterior areas exposed to
wind. The mean pressure, the root-mean-square of pressure fluctuations and the peak negative
and peak positive pressures are measured at each tap using a system capable of responding to
pressure fluctuations as short as 0.5 to 1 second at full scale. The measured data are converted
into pressure coefficients based on the measured upper level mean dynamic pressure in the wind
tunnel. Time series of the simultaneous pressures are also recorded for post-test processing if
required. A typical example of an instrumented wind tunnel study model is provided in Figure 1.
A.1.3 Consideration of The Local Wind Climate
Carrying out the procedures described in the previous sections determines the peak local external
pressure coefficients expected for a given wind direction. However, in order to account for the
varying likelihood of different wind directions and the varying strengths of winds that may be
expected from different directions, the measured pressure coefficients are integrated with
statistical records of the local wind climate to produce predicted peak pressures as a function of
return period. In the case of cladding loads, it is appropriate to consider peak loads associated
with return periods comparable to the design life of the structure. The choice of return period
will be governed by local code requirements, that consider the intended use of the building, but
50 years is often used for cladding design, to which appropriate load or safety factors are applied.
Wind records taken from one or more locations near to the study site are generally used to derive
the wind climate model. In areas affected by hurricanes or typhoons, Monte Carlo simulations
are typically used to generate a better database since full scale measurements, if available for a
given location, typically provide an inadequate sample for statistical purposes. The data in either
case are analysed to determine the probabilities of exceeding various hourly mean wind speeds
from within each of 36 wind sectors at an upper level reference height, typically taken to be 600
m (2000 ft) above open terrain. This coincides with the height used to measure the reference
dynamic pressure in the wind tunnel.
In order to predict the cladding wind loads for a given return period, the wind tunnel results are
integrated with the wind climate model. There are two methods typically used by RWDI to
perform this integration. In one method, the historical (or simulated as is the case with
hurricanes or typhoons) wind record is used to determine the full-scale cladding wind pressures
for each hour, given the recorded wind speed and direction and the wind tunnel predictions for
that direction. By stepping through the wind speed and direction data on an hour-by-hour basis,
page A3 of A4
a time history of the resulting peak pressure is generated. Then, through the use of extreme
value fitting techniques, statistically valid peak responses for any desired return period are
determined.
The second method is the Upcrossing Method as described by Irwin3 and Irwin and Sifton4. In
simple terms, this can be thought of as an analytical representation of the first method, in which a
fitted mathematical model of the wind statistics is used in place of the detailed wind records
themselves. The time history method (first method described above) is typically used by RWDI
for cladding wind load studies where the extent and quality of the wind records permit it. In
areas of shorter records and lower quality records RWDI typically reverts to the Upcrossing
Method since it enables a smoothing of erratic behaviour of the wind statistics to be more readily
implemented and is thus more robust.
A.1.4 Internal Pressure Allowances Considering Localized Breaches in theBuilding Façade
In strong winds, air leakage effects dominate the internal pressures. Other factors that influence
them, but are usually of less significance, are the operation of mechanical ventilation systems
and the stack effect. Important sources of air leakage include uniformly distributed small
leakage paths over the building’s envelope and larger leakage paths. These larger leakage paths
include window breakage due to airborne debris in a windstorm and open doors or windows, in
cases where they are operable. The internal pressure allowances can be influenced by many
factors including the size and location of potential glass breakage, the internal
compartmentalization of the building and the internal volumes. During a major storm event,
glass breakage can be different sizes and occur at various locations. There are many types of
projectiles that typically cause glass breakage, ranging in size from small rocks to tree branches.
Larger projectiles impacting the building would be rare events.
To evaluate the internal pressures resulting from dominant openings in the building envelope,
simultaneous measurements are taken during the wind tunnel test between pairs of pressure taps
located on building walls that share the same internal volume. Of particular interest are
measurements taken in areas where large pressure differences can occur such as those that are
generated at the corners of the floor plate. A single opening (worst case) scenario is typically
3 Irwin, P.A., “Pressure Model Techniques for Cladding Loads”, Journal of Wind Engineering and IndustrialAerodynamics 29 (1988), pg. 69-78.4 Irwin, P.A. and Sifton, V. L., “Risk Considerations for Internal Pressures”, Journal of Wind Engineering andIndustrial Aerodynamics, 77 & 78 (1998), pg. 715-723.
Page A4 of A4
considered since multiple leakage sources tend to reduce the magnitude of the internal pressure.
Using an in-house approach, these data are analyzed to determine the range of internal pressures
that may occur at selected opening locations and for a range of probabilities of these openings
occurring. The probability of an opening typically used in the analysis ranges from
approximately 15% to 50% where probabilities closer to the lower end of the range are used in
lower wind speed areas (i.e. – non-hurricane/non-typhoon areas) and probabilities closer to the
upper end of the range are used in higher wind speed areas (i.e. – hurricane/typhoon areas) or for
buildings that have a large number of operable windows or doors. Using these dominant opening
probabilities, internal pressures are determined for the same level of risk as that assumed for the
external pressures.
The internal pressure allowances are applied to help reduce the possibility of subsequent facade
failures due to pressure increases caused by localized breaches in the facade. Design of the
cladding to the provided wind loads will not necessarily prevent breakage due to impact by wind
borne debris.

Date:
Figure:Measurement Techniques for the Prediction ofCladding Wind Loads
1
Appendix A - Wind Tunnel ProceduresOctober 1, 2007
(a) Typical Cladding Wind Load Study model
(b) Data Acquisition