Draft Report Powering Autos to 2020 - autonews
24
Draft Report – For Media Use Only Draft Report Powering Autos to 2020: The Era of the Electric Car? Mythili Devineni, Andreas Dinger, Marco Gerrits, Tobias Mezger, Xavier Mosquet, Massimo Russo, Georg Sticher and Hadi Zablit July 2011
Transcript of Draft Report Powering Autos to 2020 - autonews
Draft Report – For Media Use Only
Draft Report Powering Autos to 2020: The Era of the Electric Car?
Mythili Devineni, Andreas Dinger, Marco Gerrits, Tobias Mezger, Xavier
Mosquet, Massimo Russo, Georg Sticher and Hadi Zablit
July 2011
Draft Report – For Media Use Only 1
THE BOSTON CONSULTING GROUP July 2011
he Boston Consulting Group (BCG) is a global management consulting firm and the world's leading
advisor on business strategy. We partner with clients in all sectors and regions to identify their
highest-value opportunities, address their most critical challenges, and transform their businesses.
Our customized approach combines deep insight into the dynamics of companies and markets with close
collaboration at all levels of the client organization. This ensures that our clients achieve sustainable
competitive advantage, build more capable organizations, and secure lasting results. Founded in 1963, BCG is
a private company with 74 offices in 42 countries. For more information, please visit www.bcg.com.
T
Draft Report – For Media Use Only 2
THE BOSTON CONSULTING GROUP July 2011
Contents
Executive Summary
Key Recent Changes in the Vehicle Propulsion Landscape
ICE-Propelled Vehicles and Emissions Targets
Sidebar: Compressed Natural Gas: A Potential Bridge Technology?
The Role of the Consumer
Sidebar: Consumer Research
The Potential for EVs and HEVs
Sidebar: The China Wildcard
Go-to-Market Challenges for EVs
Implications for OEMs, Suppliers, and Regulators.
Draft Report – For Media Use Only 3
THE BOSTON CONSULTING GROUP July 2011
Executive Summary
The automotive propulsion landscape is evolving rapidly—and the questions facing OEMs as they look out to
2020 are becoming increasingly complex. Which technologies will prevail? How will consumers react to an
expanding range of choices? How is the battle for market share between conventional and electric vehicles
likely to shake out? What are the specific go-to-market challenges facing electric vehicles?
This report, our latest in a series on automotive propulsion, addresses these and other questions stakeholders
will face by providing an integrated perspective on the technologies that will populate the vehicle landscape
through the rest of the decade. Specifically, the report focuses on
• internal combustion engine vehicles (ICEs), including those fueled by gasoline, diesel, compressed
natural gas, and biofuels. This includes micro-hybrids.
• hybrid electric vehicles (HEVs), which have both an internal combustion engine and an electric
motor but no external charging. This category includes mild and full hybrids.
• electric vehicles (EVs), which have an electric motor and can be charged externally. We include
pure battery, range-extended, and plug-in hybrid electric vehicles in this category.
Drawing on interviews with industry experts, BCG consumer research, and total cost of ownership (TCO)
economics, the report identifies different scenarios and their implication for OEMs, suppliers, and regulators.
Our high-level findings include the following:
• Conventional technologies have significant emission-reduction potential—but OEMs will need to
pull multiple levers simultaneously to meet likely 2020 emissions targets. Modifications to
combustion technologies, transmissions, vehicle mass, aerodynamics, and power management
will all be necessary.
o Advanced combustion technologies alone could reduce CO2 tailpipe emissions by 40
percent from current average levels for new-vehicle fleets of 250 to 270 grams per
kilometer (g/km) in the United States, 150 to 170 g/km in Europe, 130 to 140 g/km in
Japan, and 200 to 215g/km in China. The cost to the consumer would be about $50 to
$60 per percent reduction—roughly half the cost of what was expected three years ago.
o Within advanced ICE technologies, engine downsizing, turbocharging, optimized cooling,
low friction, start-stop systems, electric power steering, direct injection, and variable
valve timing will likely lead the charge. We expect these to be mainstream across most
passenger-car segments in all major markets.
Draft Report – For Media Use Only 4
THE BOSTON CONSULTING GROUP July 2011
• The electric car faces stiff competition from ICEs and, based solely on total cost of ownership
(TCO) economics, will not be the preferred option for most consumers.
o Battery costs will fall sharply (approximately 64 percent from 2009 levels) to $400 per
usable kilowatt hour at the pack level. However, this still represents a cost of $9,600 per
vehicle to the consumer for the typical 20-kilowatt-hour battery necessary for a pure
battery EV.
o TCO economics for electric cars will also be significantly influenced by government
incentives and fuel and electricity prices.
o High costs notwithstanding, EVs will see relatively strong uptake from specific
consumers. In particular, there is evidence of a "green" consumer cohort (approximately
6 percent of consumers in the United States and 9 percent of those in Europe) that is
willing to pay more for an EV even if the TCO economics are not compelling.
o In addition to their relatively high total cost of ownership, EVs face substantial go-to-
market challenges—including questions about battery durability and establishment of
the required charging infrastructure—that will impact their rate of adoption.
• China and Europe—not the United States, as many may have thought—will be the largest
markets for EVs in 2020, driven by strong government support.
o China is a major wildcard. To date, significant public messaging from the government on
EVs has led to neither promised breakthroughs in battery technology nor significant sales
outside of public fleets. The government's efforts have, however, increased consumers'
awareness. Assuming the government remains committed to EVs, we expect that these
vehicles will represent 7 percent of new vehicle sales in 2020, supported by car buyers'
enthusiasm for the technology and the country's high gasoline taxes.
o EVs will likely account for approximately 8 percent of new car sales in Europe by 2020,
supported by consumers' higher willingness to pay for green technologies, the region's
high emissions standards, and high gasoline and diesel fuel taxes.
• Combined, EVs and HEVs could reach 15 percent of aggregate new-car sales in the four major
markets—Europe, North America, China, and Japan—in 2020. As OEMs ramp up capacity to
meet this demand, they will have to simultaneously invest in advanced ICE technologies. This
will pose a significant production and supply-chain challenge and likely force OEMs to
increasingly globalize powertrain production.
• Market participants should closely monitor governments' choice of metric for gauging vehicles'
environmental impact. Governments are currently focused predominantly on tailpipe emissions;
Draft Report – For Media Use Only 5
THE BOSTON CONSULTING GROUP July 2011
if that focus shifts to the broader "well-to-wheel" metric, the environmental argument for EVs
becomes less compelling. Based on our current projections, the well-to-wheel emissions
advantage of EVs over ICE-propelled vehicles, currently estimated at 40 to 60 percent, will fall to
30 to 50 percent in 2020 as advances in ICE technologies narrow the gap and power generation
from clean non-fossil fuels continues to grow slowly in most regions.
Key Recent Changes in the Vehicle Propulsion Landscape
BCG's first report in this series, The Comeback of the Electric Car? How Real, How Soon, and What Must
Happen Next, published in January 2009, took a broad look at the prospects both for electric cars and for
competing alternative propulsion technologies. Our second report, Batteries for Electric Cars: Challenges,
Opportunities, and the Outlook to 2020, published in January 2010, focused on the technical attributes and
costs of lithium-ion batteries and battery packs for EVs and highlighted the EV market's challenges and
opportunities to 2020.
Since the publication of our first report, there have been several key developments in the regulatory
environment, within technology, and in consumer behavior and sentiment that stand to have a material
impact on the propulsion landscape to 2020—in particular the adoption prospects for EVs.
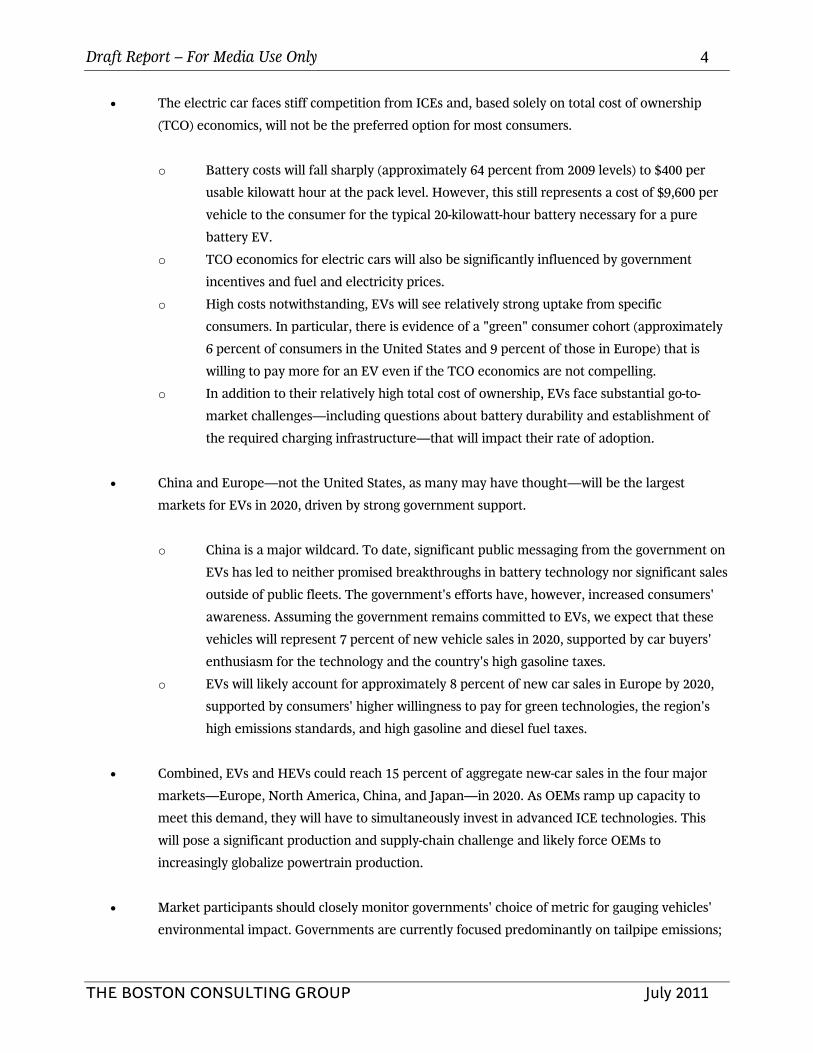
On the regulatory front, tailpipe-emissions and fuel-efficiency standards are becoming more stringent.
1301
(45 MPG)
United States
EU
Japan
Exhibit 1. Emissions and Fuel-Efficiency Standards Are Becoming More Stringent
1. From motor vehicle technology only. The EU plans to call for a further 10 g/km reduction in CO2 emissions via other improvements (for example, air conditioning technology) and use of biofuels.2. California has agreed to conform to the U.S. government's targets for 2012-2016. Previously, the state had enacted stricter legislation.3. Based on the government's released scenarios of a 47-62 MPG target for 2025. 47 MPG is expected to be the most likely target.Note: All targets are expected to be phased in. CO2 emissions targets are in grams per kilometer and are based on the New European Driving Cycle (NEDC). Mileage targets are in miles per gallon and are based on Corporate Average Fuel Economy (CAFE) standards.Sources: International Council on Clean Transportation; U.S. Environmental Protection Agency; Japan Automobile Manufacturers Association, The Motor Industry of Japan 2010; Asahi Shimbun.
154(39 MPG)
95(61 MPG)
2010 2011 2012 2013 2014 2015 2016 2017 2018 2019 2020 ...
240(26 MPG)
2052 191 228 198172
(34 MPG) 181
141 (42 MPG)
125(47 MPG)
109(53 MPG)
CO2 (g/km)—NEDC Cycle (MPG--CAFE)
Enacted (through legislation) Proposed Estimates based on current trend
185(33 MPG)
China145
(41 MPG)
167(36 MPG)
1523
(39 MPG)
Draft Report – For Media Use Only 6
THE BOSTON CONSULTING GROUP July 2011
The targets vary by country and region and for different types of emissions—the European Union's target for
CO2 emissions in 2020 (95 grams per kilometer for the new-vehicle fleet average), for example, is far more
aggressive than the likely targets of the United States, Japan, and China.1 The United States, meanwhile, has
set the toughest standard for nitrogen oxide (NOx) emissions. Regardless, the trend line is clear: standards
are rising.
In parallel, energy independence is becoming a priority in many countries, in particular the United States
and China. This has been intensified by the recent geopolitical instability in the Middle East.
The combination of rising concerns over greenhouse gas emissions and a growing desire to reduce
dependence on oil has underscored the need in many governments' minds to promote EVs. Many
governments already have in place significant incentives to stimulate early sales. The U.S. government, for
example, offers a maximum tax credit of $7,500 on the purchase of an EV (and some state governments, such
as California's, offer up to $5,000 in additional incentives), and the governments of more than half of
European Union countries offer tax reductions or exemptions. But it is unclear whether those incentives will
be sustainable as EVs approach mass adoption. Simultaneously, many of the incentives that governments
instituted in the last decade (including tax breaks, free parking, and access to high-occupancy vehicle lanes
for single-occupant cars) to promote hybrid vehicles have been or are being phased out.
Taken together, the above factors suggest a supportive backdrop for accelerating EV adoption as the march
to 2020 proceeds. Another early plus for these vehicles is the fact that the first EVs are now on the road and
customers are becoming more familiar with the concept. So far, the results seem encouraging. In the United
States, the Volt and Leaf have each drawn more than 20,000 advance reservations, suggesting that there is
demand and that both companies are on track to meet their respective sales targets of 10,000 units in 2011.
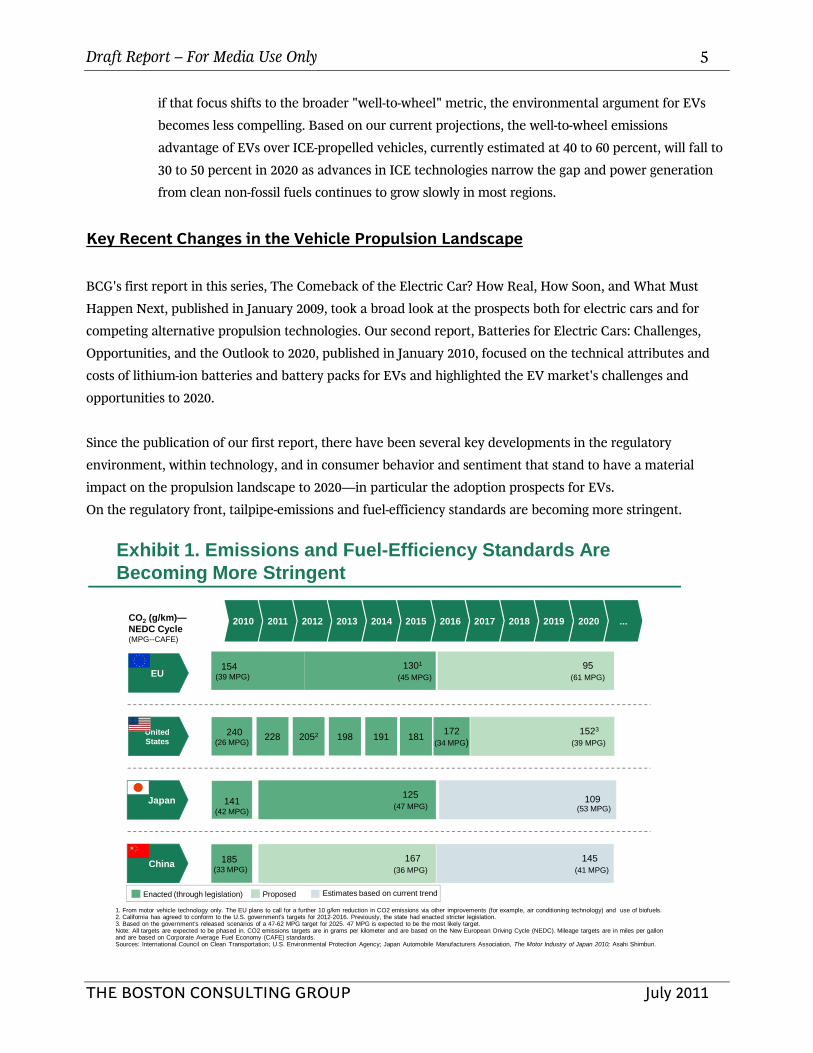
Yet there are significant challenges on the technology front that will exert a major drag on EV adoption. The
first is the high cost of batteries, which represents a large percentage of an EV's total purchase price. EV
battery technologies will continue to improve and battery costs will continue to fall. But there is currently no
technological breakthrough in sight that would lower prices enough to significantly alter the economics in
favor of electric vehicles by 2020. As our 2010 report on batteries found and as we have recently confirmed,
battery pack costs to OEMs will likely fall sharply—to $400 per usable kilowatt hour at the pack level, or
roughly 64 percent lower than in 2009—by 2020. But that level is still too high to make EVs attractive from a
TCO perspective for the majority of vehicle buyers.
Falling costs for emissions reduction in ICE vehicles is the second technological hurdle for strong EV adoption
to 2020. We estimate that advanced ICE technologies—the most potent lever for reducing tailpipe 1 In the United States, the Environmental Protection Agency and the National Highway Traffic Safety Administration have proposed a reduction in greenhouse gas emissions of 3 to 6 percent per annum from 2017 to 2025, resulting in a 47 to 62 MPG fuel-economy mandate for the new-vehicle fleet average by 2025.
Draft Report – For Media Use Only 7
THE BOSTON CONSULTING GROUP July 2011
emissions—will allow OEMs to reduce CO2 emissions at a relatively low cost of $50 to $60 for the consumer
per percent emissions reduction. This gives OEMs less incentive to aggressively push EVs to meet 2020
emissions regulations.
How these forces play out in concert remains to be seen. But on balance, recent developments suggest that
EVs' path to adoption to 2020 will have more than a few bumps.
ICE-Propelled Vehicles and Emissions Targets
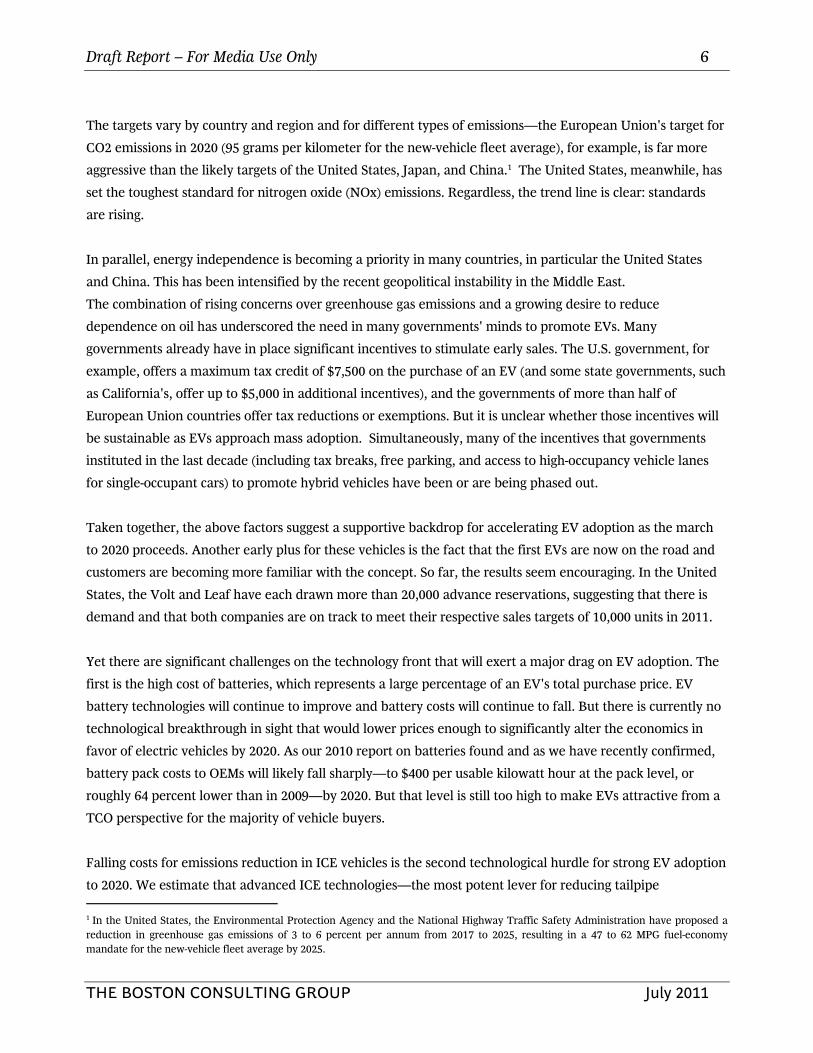
Tightening emissions standards are a key challenge facing OEMs to 2020 and one that will undoubtedly
influence how quickly and aggressively they move (or are forced to move) down the path of electrification.
Ultimately, we believe that most OEMs should be able to meet 2020 emissions targets via a combination of
modifications to ICE engine technologies and other levers (for example, reductions to vehicle mass) and do so
in a cost-effective manner.
6
Exhibit 2. Conventional Technologies Have Significant CO2
Emission-Reduction Potential
Levers Optimized design (drag coefficient and frontal area) Optimized tires
Lightweight material New manufacturing
technologies Content optimization Downsizing
Vaporization and combustion optimization Energy losses
reduction (pumping, friction, heat) Weight reduction
Improved automatic transmissions control Continuously variable
transmissions Dual clutch
Switch from mechanical to electric accessories Optimization of
accessories' electric consumption
Impact on CO2
emissions
1% CO2 reduction for ~0.01 drag coefficient reduction
3-4% CO2 reduction for 10% mass reduction
From 1% to 20% CO2
reduction per technology
From 1 to 7% CO2
reduction per technology
From 1 to 2% CO2
reduction per technology
2020 max potential %CO2 red
~5% ~5-6% ~40%4 ~5-10% ~3-5%
Cost to consumer/car1
~$100/veh
or ~$20/%CO22
~$500/veh2
or ~$100/%CO23
~$2,000-2,500/veh
or ~$50-60/%CO25
~$100-200/veh
or ~$20-40/%CO26
~$150-250/vehor ~$50/%CO2
Vehicle mass ICE technologyAerodynamics Transmissions
1. Vehicle price increase before VAT 2. Cost for avg. weight reduction of 250 lbs 3. New materials show potential for weight reduction up to 37% at cost of $2,100, i.e. ~$160/%CO2 4. 30-35% for Diesel 5. Average for Gasoline and Diesel: individual technologies vary from $20 to $100+ per %CO2 6. Replacement of 5-speed automatic gearbox with dual clutch transmission on compact car Source: Expert interviews, BCG Analysis
Power management
Our current projections are that, via these measures, OEMs will be able to reduce gasoline-fueled vehicles'
CO2 emissions by 15 to 49 percent, with an impact on the cost to the consumer of 2 to 16 percent per

Draft Report – For Media Use Only 8
THE BOSTON CONSULTING GROUP July 2011
vehicle,2 and reduce diesel-fueled vehicles' CO2 emissions by 3 to 36 percent, with a cost impact for the
consumer of 4 to 12 percent per vehicle. Hence the need for OEMs to pursue EVs from a 2020 emissions
standpoint is minimal, even though EVs will undoubtedly play a major role in meeting 2035 and 2050
ambitions.
Among the levers at OEMs' disposal for reducing emissions, ICE technology improvements are the most
effective, offering the potential to lower emissions by as much as 40 percent.
These levers are also the most expensive, however, adding approximately $2,000 to the cost to the consumer
per vehicle. There are a range of such levers for gasoline-fueled ICEs across air intake and exhaust, engine
architecture, control, injection, and ignition. Some of these, such as optimized cooling, low friction, start-stop
systems, and engine downsizing combined with mild turbocharging, stand to see widespread adoption across
many vehicle segments due to their relatively low cost. Larger, more expensive vehicles will feature strong
turbochargers to maintain superior performance.
Fewer levers are available for diesel-fueled ICEs, which are already optimized. The most promising levers are
turbocharging, which is already well developed, and the still-nascent homogeneous charge combustion
ignition (HCCI). These could reduce CO2 emissions by 5 to 10 percent and 10 to 15 percent, respectively. The
2 Versus 2010 prices.
Average incrementalcost per % reduction in
CO2
0-10% 10-20% 20-30% 30-40%
$23 $44 $58 $70
0
0
Cumulative CO2 reduction (%)
40302010
GDIEGRVVT/LEngine downsizingplus turbocharging
EPSStart-stopsystems
Low friction
Optimized cooling
Estimated 2020 costs to consumer per % of CO21 ($)
80
60
40
20
Cumulative cost increase per vehicle ($)
2000
1500
1000
500
0
1957
1,732
1,522
1,222
397297
9733
1. Estimated 2020 price to customer before VAT. Assumes a 1% decrease in manufacturing costs from 2010 to 2020 and OEM mark-up ranging from 50% to 100%. Estimates are for North American D-segment vehicles. Other segments and vehicies would likely show minor variances. Note: EPS = electric power steering; VVT/L = variable valve timing/lift; EGR = exhaust gas recirculation; GDI = gasoline direct injection.Source: BCG analysis.
Exhibit 3. ICE Technologies Alone Can Reduce Emissions by 40 Percent

Draft Report – For Media Use Only 9
THE BOSTON CONSULTING GROUP July 2011
high cost of post treatment for meeting NOx emissions standards poses a significant hurdle for the growth of
diesel-fueled vehicles. In Europe, a traditional stronghold for diesel, we expect sales of these vehicles to
decline from a current 46 percent of new-vehicle sales to approximately 30 percent by 2020. (We include
diesel hybrids in our HEV projections.) Without pro-diesel incentives from governments in the other big
markets (the United States, China, and Japan), there is little likelihood of a commensurate pickup in demand
in those markets. Diesel could, however, continue to play a significant role in India and other emerging
markets, where the TCO economics are more favorable.
Meeting emissions targets for both gasoline- and diesel-fueled vehicles will force OEMs to use a range of other
levers beyond those focused on engines. The available choices have a smaller impact on CO2 emissions but
also cost less. They include improved aerodynamics and drag reduction, which could reduce emissions by up
to 5 percent at an added cost of $100 per vehicle; transmission levers (for example, improved automatic-
transmission control), which could reduce emissions by 5 to 10 percent at an added cost of $100 to $200 per
vehicle; and power-management levers (for example, switching from mechanical to electric accessories),
which could reduce emissions by 3 to 5 percent at a cost of $150 to $250 per vehicle. Another potentially
overlooked lever is reductions in vehicle weight via use of lightweight materials and optimization of content.
Weight-reducing measures could reduce CO2 emissions by 5 to 6 percent at an approximate cost of $500 per
vehicle. How automakers balance the use of these levers to meet emissions targets will vary.
Although OEMs in aggregate should comfortably meet 2020 emissions standards, the effort and expense
necessary for individual companies to hit those targets will vary based on the companies' starting points.
German OEMs, including BMW, Daimler, and VW, are leading the industry in innovations in diesel and
gasoline-fueled ICEs. France's PSA Peugeot Citroen has a similarly strong position in diesel. But U.S. and
Japanese OEMs are catching up, reflected in their higher patent activity from 2000 to 2010. And a range of
OEMs and suppliers have been pushing the envelope in building intellectual property in key emissions-
reduction technologies such as turbocharging and supercharging (for diesel and gas), exhaust-gas
recirculation, valves, and weight reduction.
Alternative fuels are another potentially promising emissions-reduction lever, one that could be particularly
useful in helping advanced-ICE passenger cars meet lower well-to-wheel emissions targets. Advances in the
development of second-generation biofuels, in particular, hold promise, though it will take some time before
plants can produce at the necessary scale—the approximately 46 billion gallons of second-generation biofuels
expected to be available in 2020 will cover only a small portion of the world's passenger cars. Compressed
natural gas (CNG) has similarly attractive emissions-reduction potential, especially in certain regions (notably
the United States, given its recent discoveries of natural gas) and for specific vehicle segments, particularly
certain fleets. (See the sidebar, "Compressed Natural Gas: A Potential Bridge Technology?")
Draft Report – For Media Use Only 10
THE BOSTON CONSULTING GROUP July 2011
SIDEBAR: COMPRESSED NATURAL GAS: A POTENTIAL BRIDGE TECHNOLOGY?
As OEMs wrestle with advanced ICEs and EVs, they will have to stay cognizant of the opportunities and
challenges presented by a compelling alternate fuel source—compressed natural gas (CNG).
CNG has several key advantages. One is its large reserves, which give CNG a cost advantage at the pump over
gasoline and make it appealing from an energy-independence perspective. A second major advantage for
CNG is its favorable emissions profile. Well-to-wheel CO2 emissions for CNG-fueled vehicles are 15 to 25
percent less than those for gasoline-fueled vehicles.
But CNG also poses challenges for OEMs that are similar to the challenges associated with EVs. One is high
upfront vehicle costs. A CNG passenger car costs $4,000 more than a gasoline equivalent, even when
manufactured at scale. The biggest hurdle to widespread CNG adoption, however, will be the required
fueling infrastructure. Despite a tax credit of $0.50 per gasoline gallon equivalent (GGE) in the United States,
the business case for investments in CNG fueling stations is not clear for utilities and infrastructure providers.
Overall, CNG offers similar emissions-reduction potential as hybrids at similar cost. Hybrids face less of an
uphill battle, however, as they are more accepted by consumers and do not require additional infrastructure.
But while CNG may struggle to reach widespread adoption among individual consumers, it is ideal for certain
vehicle fleets. For investors, there can be significant scale advantage in CNG fueling stations—a high-
throughput station (that is, one with more than 30,000 GGE per month) requires a $1.5 million investment
but has an attractive ROI. And for fleet owners, CNG becomes increasingly attractive compared to hybrids as
mileage rises due to the fuel's low cost. For these reasons, CNG could expand beyond its current strongholds
with transit buses and airport shuttles and see growing adoption by delivery vehicles, government fleets, and
taxis—all vehicles that have high mileage, take frequent but short trips, and employ centralized refueling,
making them ideal for CNG deployment. By targeting selected fleet segments, CNG could reach 0.5 to 1.0
percent of passenger car and light truck sales in the United States and China, with potentially higher
penetration for buses and medium trucks. In Europe, where CNG could have an appeal beyond the fleet
segment, penetration could reach 2 percent of passenger car sales. Italy already has a significant fleet of
CNG-powered vehicles and a good fueling infrastructure in place due to a concerted effort by the government,
FIAT, and ENI (the national oil company) since 1999.
Governments can spur CNG adoption by mandating adoption among fleet vehicles and by establishing inner-
city emissions targets. The governments of India and Pakistan, for instance, have been able to effectively
mandate such adoption for public transportation, including buses and taxis, in major metropolitan areas.
Similar legislation in the United States could drive CNG adoption there, leading to emissions reduction at a
lower cost to consumers and the government than that associated with EVs.
Draft Report – For Media Use Only 11
THE BOSTON CONSULTING GROUP July 2011
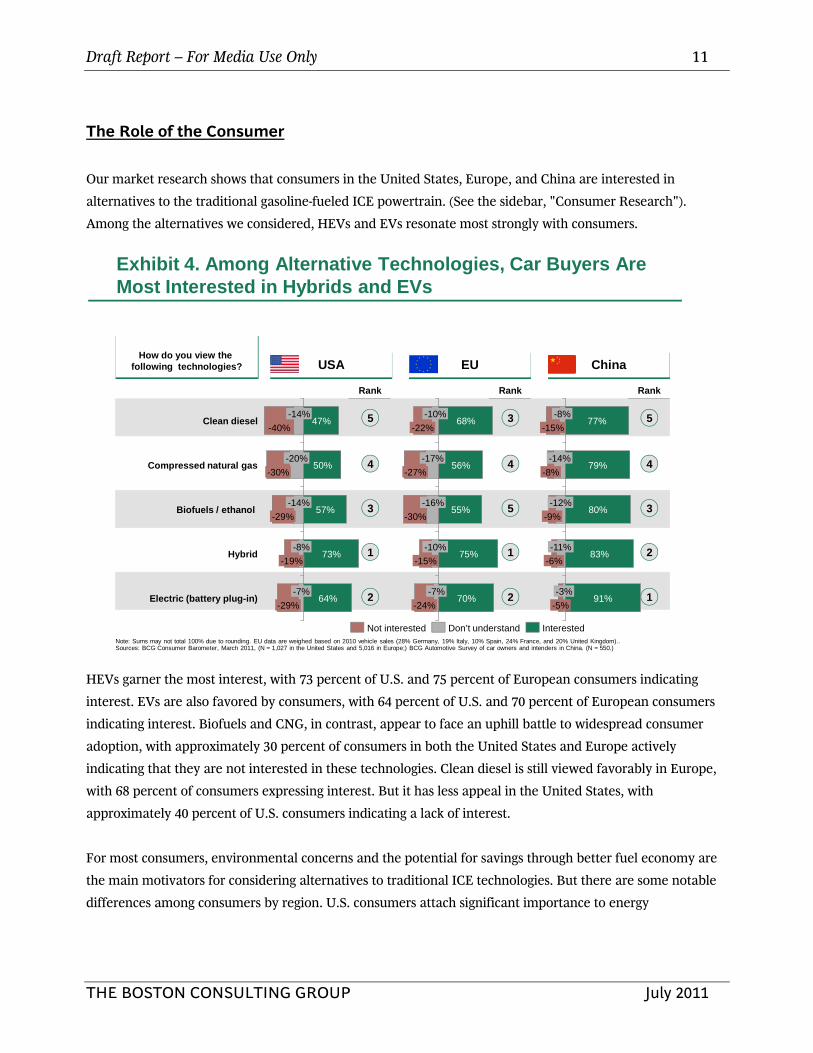
The Role of the Consumer
Our market research shows that consumers in the United States, Europe, and China are interested in
alternatives to the traditional gasoline-fueled ICE powertrain. (See the sidebar, "Consumer Research").
Among the alternatives we considered, HEVs and EVs resonate most strongly with consumers.
HEVs garner the most interest, with 73 percent of U.S. and 75 percent of European consumers indicating
interest. EVs are also favored by consumers, with 64 percent of U.S. and 70 percent of European consumers
indicating interest. Biofuels and CNG, in contrast, appear to face an uphill battle to widespread consumer
adoption, with approximately 30 percent of consumers in both the United States and Europe actively
indicating that they are not interested in these technologies. Clean diesel is still viewed favorably in Europe,
with 68 percent of consumers expressing interest. But it has less appeal in the United States, with
approximately 40 percent of U.S. consumers indicating a lack of interest.
For most consumers, environmental concerns and the potential for savings through better fuel economy are
the main motivators for considering alternatives to traditional ICE technologies. But there are some notable
differences among consumers by region. U.S. consumers attach significant importance to energy
Exhibit 4. Among Alternative Technologies, Car Buyers Are Most Interested in Hybrids and EVs
Electric (battery plug-in)-29%
-7%64%
Hybrid-19%
-8%73%
Biofuels / ethanol -29%
-14%57%
Compressed natural gas-30%
-20%50%
Clean diesel-40%
-14%47%
How do you view the following technologies? USA EU China
Not interested Don’t understand Interested
-7%70%
-15%
-10%75%
-30%
-16%55%
-27%
-17%56%
-22%
-10%68%
-24%
83%
-9%
-12%80%
-8%
-14%79%
-15%
-8%77%
-5%
-3%91%
-6%
-11%
2
Rank
1
3
4
5
2
Rank
1
5
4
3
1
Rank
2
3
4
5
Note: Sums may not total 100% due to rounding. EU data are weighed based on 2010 vehicle sales (28% Germany, 19% Italy, 10% Spain, 24% France, and 20% United Kingdom)..Sources: BCG Consumer Barometer, March 2011, (N = 1,027 in the United States and 5,016 in Europe;) BCG Automotive Survey of car owners and intenders in China. (N = 550.)
Draft Report – For Media Use Only 12
THE BOSTON CONSULTING GROUP July 2011
independence. Chinese consumers are more interested in EVs than in any other technology, motivated
primarily by the vehicles' cutting-edge appeal.3
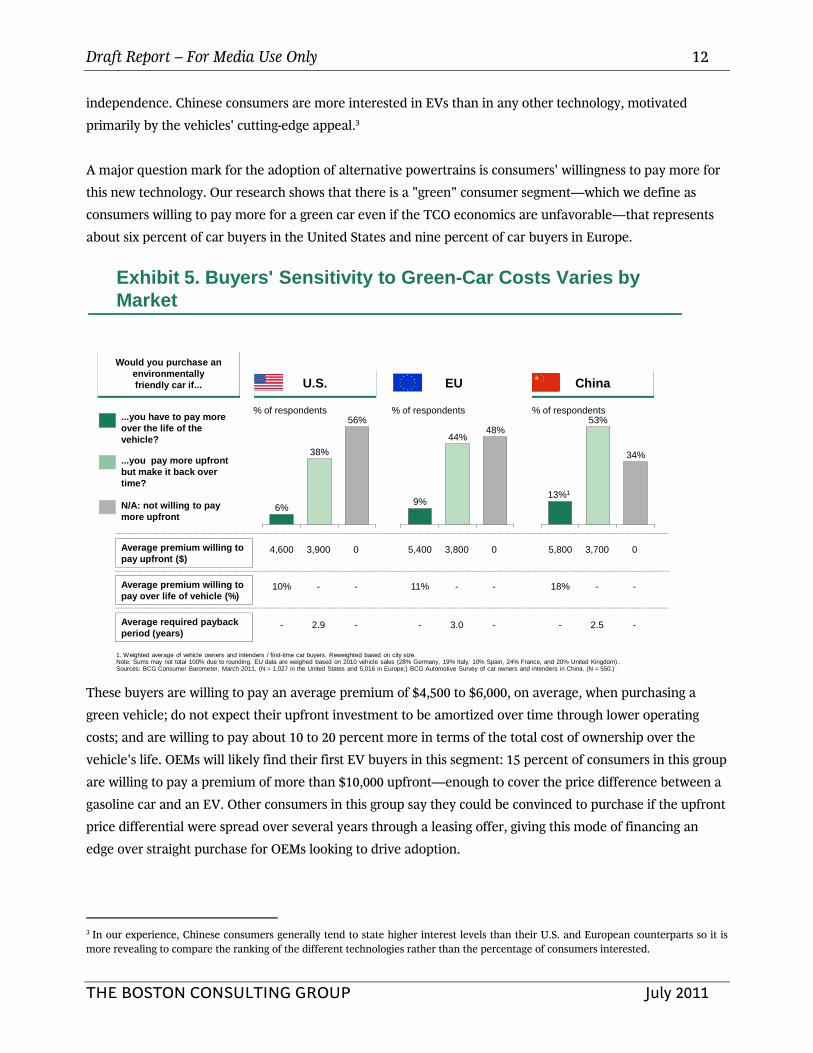
A major question mark for the adoption of alternative powertrains is consumers' willingness to pay more for
this new technology. Our research shows that there is a "green" consumer segment—which we define as
consumers willing to pay more for a green car even if the TCO economics are unfavorable—that represents
about six percent of car buyers in the United States and nine percent of car buyers in Europe.
These buyers are willing to pay an average premium of $4,500 to $6,000, on average, when purchasing a
green vehicle; do not expect their upfront investment to be amortized over time through lower operating
costs; and are willing to pay about 10 to 20 percent more in terms of the total cost of ownership over the
vehicle's life. OEMs will likely find their first EV buyers in this segment: 15 percent of consumers in this group
are willing to pay a premium of more than $10,000 upfront—enough to cover the price difference between a
gasoline car and an EV. Other consumers in this group say they could be convinced to purchase if the upfront
price differential were spread over several years through a leasing offer, giving this mode of financing an
edge over straight purchase for OEMs looking to drive adoption.
3 In our experience, Chinese consumers generally tend to state higher interest levels than their U.S. and European counterparts so it is more revealing to compare the ranking of the different technologies rather than the percentage of consumers interested.
Exhibit 5. Buyers' Sensitivity to Green-Car Costs Varies by Market
56%
38%
6%
% of respondents
Would you purchase an environmentally friendly car if...
...you have to pay more over the life of the vehicle?
...you pay more upfront but make it back over time?
N/A: not willing to pay more upfront
Average premium willing to pay upfront ($)
4,600 3,900 0
Average required payback period (years)
- 2.9 -
Average premium willing to pay over life of vehicle (%)
10% - -
U.S. EU China
9%
44%48%
% of respondents
5,400 3,800 0
- 3.0 -
11% - -
13%1
53%
34%
% of respondents
5,800 3,700 0
- 2.5 -
18% - -
1. Weighted average of vehicle owners and intenders / first-time car buyers. Reweighted based on city size.Note: Sums may not total 100% due to rounding. EU data are weighed based on 2010 vehicle sales (28% Germany, 19% Italy, 10% Spain, 24% France, and 20% United Kingdom)..Sources: BCG Consumer Barometer, March 2011, (N = 1,027 in the United States and 5,016 in Europe;) BCG Automotive Survey of car owners and intenders in China. (N = 550.)
Draft Report – For Media Use Only 13
THE BOSTON CONSULTING GROUP July 2011
China stands out for the size of its "green" segment, which represented fully 13 percent of the car owners and
first-time buyers we surveyed. This cohort is a blend of two very different groups. The first is current vehicle
owners, who tend to be younger and more affluent than the country's overall population and to live in
cities—characteristics of "green" customers everywhere. Many of these consumers are attracted by the
"buzz" being created around EVs in China and the cutting-edge status that ownership conveys. The second
group is first-time buyers focused on basic functionality. These consumers are not willing to pay more for an
alternative powertrain unless the vehicle has a payback period of three years or less. Approximately 35-40
percent of cars sold in China, it should be noted, cost less than CNY 70,000 ($11,000); the buyers of these
vehicles are unlikely to be able to afford an EV or HEV without significant government incentives.
About 40 percent of car buyers in the United States and Europe, and 50 percent in China, are willing to pay
more upfront (approximately $4,000 more on average) for a green car if this investment is paid back through
lower operating costs. Most consumers in this group expect a payback within three years. A significant
minority (15 to 20 percent), however, is willing to accept payback of five years or longer, which is close to the
estimated payback horizon for hybrids in 2020. Swaying this group toward EVs will take either lower-than-
expected battery costs or government incentives, such as purchase incentives or fuel taxes, to shorten
payback periods. Governments could also sweeten the deal by offering significant non-financial incentives,
such as preferred parking or the use of high-occupancy-vehicle lanes in urban areas.
Finally, 56 percent car buyers in the United States, 48 percent of car buyers in Europe, and 34 percent of car
buyers in China say they are not willing to pay more upfront for alternative powertrain technologies. For the
time being, this segment will likely stay with conventional gasoline ICEs.
SIDEBAR: CONSUMER RESEARCH
In the Spring of 2011, BCG conducted online surveys of consumers in the United States, Europe, and China to
understand their views on specific alternative powertrain technologies—clean diesel, biofuel, compressed
natural gas, hybrids and EVs—as well as their willingness to pay for those technologies. We surveyed 5,016
European consumers drawn from the region's five largest markets by 2010 sales (Germany, France, the
United Kingdom, Italy, and Spain); 1,027 U.S. consumers; and 550 Chinese vehicle owners and intenders
drawn from the country's 20 largest cities by population.
We asked two sets of questions. The first sought to gauge interest in and knowledge of the different
technologies. The second dealt with consumers' willingness to pay for those technologies. The questions were
designed to minimize consumers' inherent tendency to overstate their willingness to pay. We calibrated the
results via comparisons with observed HEV penetration in the U.S. market.
Draft Report – For Media Use Only 14
THE BOSTON CONSULTING GROUP July 2011
The Potential for EVs and HEVs
Electrification offers greater potential for emissions reduction than conventional ICE-based technologies do
and will undoubtedly play a significant and growing role in many countries' energy and environmental
efforts in the coming decades. But the potential for EVs to capture share of the global vehicle market to 2020
will remain capped by the relatively high cost of batteries.
Our estimate of a $400 cost per usable kilowatt hour to OEMs in 2020 translates to approximately a $9,600
cost for a 20-kilowatt-hour battery pack for consumers (assuming a 20 percent OEM markup). This cost will
keep the economics of EV ownership unattractive for the majority of the world's car buyers. Governments
are currently offering generous purchases incentives (up to $12,500 in California, for example) to spur initial
demand. But this degree of support is unlikely to be financially sustainable over the long term, leaving EVs to
compete increasingly on their own pure economics. (Our base-case scenario assumes that purchase incentives
will expire before 2020.)
EVs will also be held back by technological limitations. Even in 2020, despite ongoing improvements in the
underlying technology, electrification will unlikely be feasible for the largest SUVs and pickups—the vehicles'
mass is simply too great. EVs will also likely have less appeal for drivers who take regular long-distance trips
due to the batteries' ongoing range limitations.
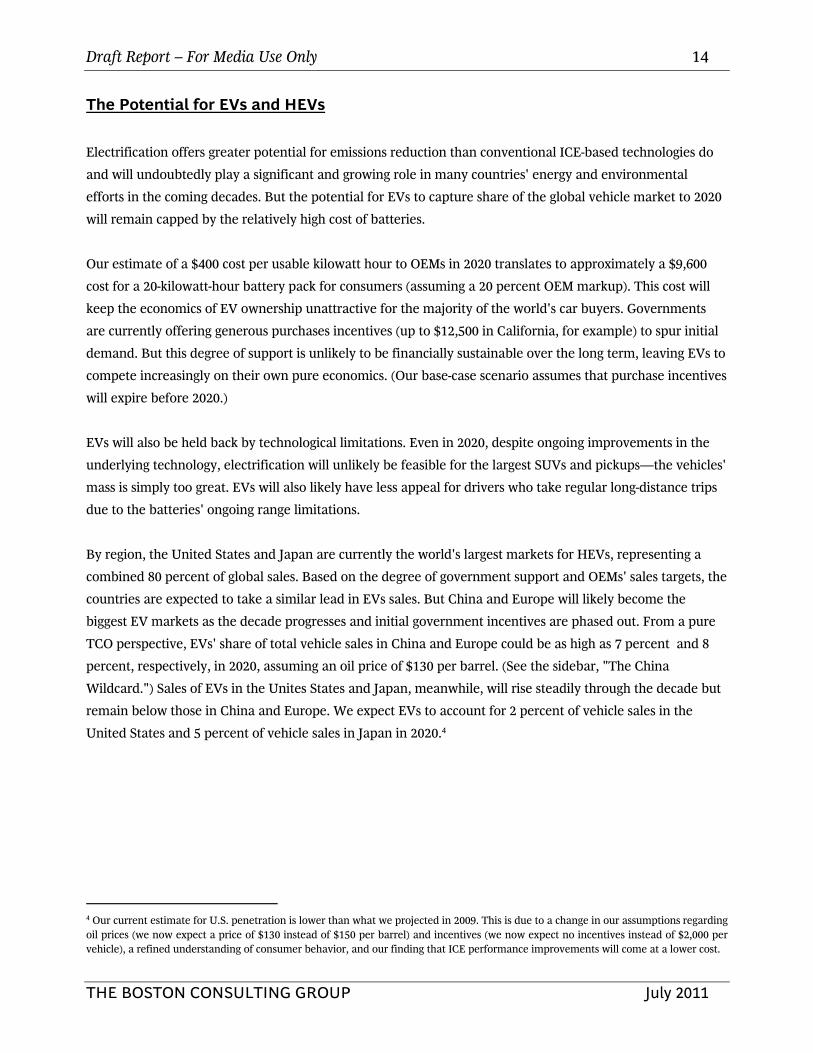
By region, the United States and Japan are currently the world's largest markets for HEVs, representing a
combined 80 percent of global sales. Based on the degree of government support and OEMs' sales targets, the
countries are expected to take a similar lead in EVs sales. But China and Europe will likely become the
biggest EV markets as the decade progresses and initial government incentives are phased out. From a pure
TCO perspective, EVs' share of total vehicle sales in China and Europe could be as high as 7 percent and 8
percent, respectively, in 2020, assuming an oil price of $130 per barrel. (See the sidebar, "The China
Wildcard.") Sales of EVs in the Unites States and Japan, meanwhile, will rise steadily through the decade but
remain below those in China and Europe. We expect EVs to account for 2 percent of vehicle sales in the
United States and 5 percent of vehicle sales in Japan in 2020.4
4 Our current estimate for U.S. penetration is lower than what we projected in 2009. This is due to a change in our assumptions regarding oil prices (we now expect a price of $130 instead of $150 per barrel) and incentives (we now expect no incentives instead of $2,000 per vehicle), a refined understanding of consumer behavior, and our finding that ICE performance improvements will come at a lower cost.
Draft Report – For Media Use Only 15
THE BOSTON CONSULTING GROUP July 2011
Exhibit 6. ICEs Will Continue to Dominate the Market Through the Decade...Percent of 2010 passenger car sales
UnitedStates
Note: we use the U.S. as a proxy for North America. Sources: BCG analysis; Edmunds; European Automobile Manufacturers' Association (ACEA); utonews; The Daily Yomuiri.
United States
95
2 3
Europe Japan China
0
46
54
100
90
01
99
GasolineDieselHEV
Europe Japan China
0
Exhibit 7. ...But EVs Will Make Inroads
$180
85
217
5
$130
88
217
2
Note: EV=PHEV (plug-in HEV), RE (range extender), EV (electric vehicle); HEV=Hybrid (mild and full, incl. diesel HEVs); CNG=compressed natural gas; gasoline includes micro hybrids and flex fuelSource: BCG analysis
Gasoline
Diesel
CNG
HEV
EV
$180
42
28
2
17
12
$130
44
29
2
18
8
Japan
$180
81
11
8
$130
82
14
5
China
$180
84
116
9
$130
88
11 47
North America Europe
Projected Percentage of 2020 Passenger Car Sales
Oil price
Total
$180
73
8
1 9
8
$130
76
8 1
9
6
Draft Report – For Media Use Only 16
THE BOSTON CONSULTING GROUP July 2011
It is too early to tell which technology—pure battery EVs, range extenders, or plug-in hybrids—will prevail
within the EV space. Currently, plug-in hybrids and range extenders —which have both a battery and an
internal-combustion engine and can therefore accommodate both short- and long-distance driving—look
most promising, given consumers' concerns over range limitations. Most consumers are indifferent to the
distinction between the two, but OEMs face difficult technology and cost tradeoffs in developing a plug-in
hybrid or range extender as their long-range EV offering: a conventional powertrain architecture can be
leveraged for a plug-in hybrid, whereas a new architecture has to be developed for a range extender. Toyota
is introducing a plug-in hybrid, building on its leadership in hybrids. And European OEMs are considering
creating a "range-extender" add-on that consumers can purchase for their pure battery EVs.
One thing is for certain: competition among OEMs and their respective favorite EV technologies will be fierce,
especially in the C-segment. For OEMs, there may also be a sizable premium attached to getting to market
early, as lessons from the growth of the HEV market suggest a significant first-mover advantage, evidenced
by the performance of Toyota, Honda, and Ford. This could support the early-market-entry strategies of
Nissan and GM.
Sales of HEVs, meanwhile, will be significant across all markets to 2020. Growth will be fastest in Europe,
where we expect HEVs' share of overall vehicles sales to rise to 18 percent in 2020. Japan will remain a strong
market for HEVs, with the vehicles rising to 14 percent of total vehicle sales in 2020 from their 10 percent
share in 2010. In the Unites States, HEVs' share of the market will rise to 7 percent from their current 3
percent; in China, HEVs will climb to 4 percent from their current near-zero share. By vehicle segment,
hybrids will remain the most attractive green option for buyers of larger vehicles (D-segment cars, large SUVs,
and pickups), as the necessary increase in battery size (and cost) with vehicle weight makes EVs less
attractive in these segments.
Hydrogen fuel cell powered electric vehicle technology is expected to remain nascent though 2020. The
technology's costs are not expected to fall below three times the cost of comparable ICE powertrains, and
developing the required fueling infrastructure within that time frame poses significant challenges.
The forecast EV and hybrid penetration rates are very sensitive to a few key factors. The price of oil is the
most prominent: in a scenario with an oil price of $180 per barrel (instead of the $130 we assume in our base
case), EV penetration would increase to 5 percent in the United States, 12 percent in Europe, 8 percent in
Japan, and 9 percent in China. Battery-pack costs are another key driver, as noted. A reduction in usable
battery pack costs (to the OEM) to $300 per kWh or sustained incentives of $2,000 per EV would increase EV
penetration by an average of 2 percent in each of the four major markets. Much of this increase would be at
the expense of HEVs, which are targeting a similar consumer segment.

Draft Report – For Media Use Only 17
THE BOSTON CONSULTING GROUP July 2011
SIDEBAR: THE CHINA WILDCARD
China is the biggest wildcard in any global EV growth projection. The government, driven by the desire to
leapfrog traditional OEMs in this new technology, reduce dependency on foreign oil, and cut pollution, has
ambitious plans to drive adoption of EVs. In its draft plan the government has targeted having 500,000 EVs,
trucks and buses on the road by 2015 and 5 million by 2020. It is supporting that goal by setting up an EV
alliance of companies across the full value chain with a war chest of CNY 100 billion and by providing
incentives to customers and industry. In parallel, the government has tasked State Grid Corporation of China
with developing the supporting infrastructure for EVs. State Grid is making large investments, with plans to
build 2,300 charging stations and 220,000 charging poles between 2011 and 2015.
But local OEMs who introduced EVs early have so far met a cold reception from Chinese consumers. Only
around 2,000 electric passenger cars were sold in 2010 (primarily to public-sector fleets) despite central
government incentives of up to CNY 60,000 (approximately US$9,000). Simultaneously, global OEMs are
stepping up their efforts to penetrate the Chinese market.
Ultimately, we see three key market opportunities for EVs in China: fleets; wealthy, green-oriented customers;
and mass-market urban vehicles. EVs penetration of fleets could increase rapidly depending on the direction
given by the national and local governments. In the high-end market, there is already a trend to hybrids,
which are considered en vogue; EVs could have similar success. But both segments are too small to create a
breakthrough for EVs. To achieve that breakthrough, three things must happen: OEMs must offer attractive
mass-market vehicles; the vehicles' potential downsides (including their relatively high price and smaller
driving range) must be addressed; and the advantages of EVs must be better understood by consumers.
At the moment, there are challenges to all three. First, mass-market customers, especially first-time car
buyers, are still motivated primarily by vehicle size, brand, and price. Even a small price premium for an EV
will prompt most would-be buyers to choose an alternative. Second, in the near term, there may not be a
sufficient choice of vehicles offered to satisfy consumers. Currently, most planned EV launches are niche
models (so far only four of the country's 20 best-selling are expected to have an EV derivative by 2012). In
addition, government support so far has focused on state-owned enterprises (SOEs), which have limited
presence in the vehicle segments that best fit EVs. Third, initial global trials have shown that consumers
prefer to charge their vehicles overnight. This will be a challenge for the large number of urban vehicle
owners in China who do not have dedicated parking.
The government's stated commitment to EVs, coupled with its willingness to think long term (20-30 years),
should not be discounted, as evidenced by the government's success in nurturing other nascent industries
and technologies. To secure a higher adoption of EVs, the government may resort to measures beyond the
current incentives (for example, driving restrictions). This makes the Chinese market a wildcard. EV
stakeholders should therefore prepare for multiple volume and penetration scenarios. At the same time,
Draft Report – For Media Use Only 18
THE BOSTON CONSULTING GROUP July 2011
stakeholders should identify new business opportunities that could emerge if the aforementioned barriers are
addressed.
Go-To-Market Challenges for EVs
OEMs face a basic dilemma as they bring electric vehicles to market: should we target high volumes in order
to move further down the experience curve for batteries while incurring substantial upfront losses, or should
we sell small volumes at a price closer to breakeven? Under both models, the most immediate upside to
OEMs will come from the PR halo effect of the new technology, which will help build a green brand image
and drive showroom traffic.
Geographic sequencing—deciding which markets to focus on first—is another important question facing
OEMs. The key consideration here is the strength of local-government support for EVs, which will strongly
impact both the price OEMs offer and the degree and speed of customer adoption.
Next, OEMs will have to define attractive financial terms for customers. Currently a variety of sales models
are being discussed: the Volt and the Leaf are sold under a traditional sales or leasing model, while for other
vehicles, such as the Renault Fluence, OEMs are experimenting with new models, such as battery rental or
pay per use. Leasing or rental models could help mitigate the initial sticker-price shock that comes with an
EV's 60 to 80 percent price premium versus a similar vehicle with an ICE powertrain.
In addition to consumers' price concerns, OEMs will also need to address consumers' anxiety about battery
life. Consumers have no experience with handling this new technology and thus need to be educated (as do
many OEMs and their sales forces) on how driving and charging behavior can affect driving range and
battery life. Consumers need to know, for instance, that fast charging can have a negative effect on battery
life. In addition, concerns around impact of low winter temperatures and recharging after short driving
distances on the battery still need to be addressed. OEMs will also have to design warranty and service
contracts to assure consumers that they will get support if the battery fails. Some OEMs are already
addressing this: both the Leaf and the Volt come with an eight-year/100,000 mile warranty and additional
service offerings, such as roadside assistance and courtesy vehicles. Battery warranties, however, pose a
substantial risk to OEMs, who will have to decide how to handle failed and end-of life batteries. OEMs may
need to find effective ways to repair or remanufacture failed batteries.
Charging is another concern. For most consumers, home charging will initially be the preferred way of
charging their vehicle. A home charging station, however, will add an additional cost of roughly $1,500 for
the consumer, and the installation can be complex. At a minimum, OEMs will have to guide consumers
through this process and may even want to consider offering an integrated solution. OEMs also face a
paradox. The best candidates for EV adoption are urban drivers who commute short distances. But these
Draft Report – For Media Use Only 19
THE BOSTON CONSULTING GROUP July 2011
same consumers tend to live in multi-residential housing, which poses a challenge to the installation of
personal home charging stations.
To further woo customers, OEMs should also think about additional services that would increase the
convenience of using an EV. Services such as remote battery-status monitoring, remote pre-conditioning (pre-
heating or cooling the vehicle while it is still connected to a charging point), and remote diagnostics could
help address consumers' concerns about reach, vehicle availability, and technology reliability. Finally, OEMs
will have to define the boundaries of their business model and decide if and to what extent they want to get
involved in public charging infrastructure and electricity contracts for their customers.
Implications for OEMs, Suppliers, and Regulators
The evolving automotive landscape poses some significant challenges to key stakeholders. It also creates
opportunities for new business models to emerge; EV specialist dealers, EV fleet operators, EV specific
applications are a few such examples. OEMs will be forced to manage a larger, more complex technology
portfolio and have to strike a balance between optimizing for today's requirements and positioning
themselves for tomorrow's opportunities. Given the high costs associated with a wider technology portfolio,
companies' key tasks will include reducing the variance in mature technologies (for example, reducing the
number of engine architectures) and developing a partnering strategy, as Renault-Nissan and Daimler have
started to do. OEMs will have to decide when and where to invest in manufacturing capacity—should they,
for instance, move into making electric motors or batteries? OEMs will also have to decide where to locate
new powertrain plants, whether it be in Europe, one of the largest market for green vehicles in 2020 but one
characterized by slow overall growth, or elsewhere. In any case, the complexity of powertrain supply chains
will increase and OEMs will have to adjust. OEM downstream operations such as sales force and after sales
also have to be prepared to meet demand for EVs. For example, dealers need to be upgraded with tooling
and mechanics that can handle EVs, even in low density areas. New financing products will have to be
developed for EVs.
Suppliers, for their part, will need to position themselves for new growth areas within both advanced ICE
technologies and the EV space. This will require suppliers to conduct a thorough review of their technology
portfolios, assessing how big the demand for components in the different realms is likely to be and what their
internal capabilities are. Suppliers (as well as OEMs) will also need to closely monitor changes in technology
and regulation as the trajectory of technological development becomes more uncertain. Further, suppliers
will have to redefine their unique value proposition in a field that includes new players, such as chemical
companies and startups.
Regulators have a host of challenges, both strategic and tactical. They must weigh the goals of climate
preservation, energy independence, supporting local manufacturers and positioning their country as a center
Draft Report – For Media Use Only 20
THE BOSTON CONSULTING GROUP July 2011
for new technologies. They must continue to pursue the reduction of tailpipe emissions but at the same time
work on the greening of energy generation. And they must determine the most efficient method of
regulating—for example, purchase incentives versus fuel taxes, and technology-neutral versus tied to specific
technologies.
Regulators must also take the necessary steps to support fledgling markets. They should set and support
market volumes for new technologies such as EVs until market forces allow those technologies to become
economically viable on their own. In parallel, regulators should foster necessary infrastructure development
for charging stations (and potentially CNG and hydrogen fuel-cell fueling stations). They should also try to
convey a consistent long-term regulatory perspective, one that will encourage investment among OEMs and
suppliers.
* * *
Significant uncertainty remains around the four key factors—regulation, oil prices, technology, and consumer
preferences—that will determine the developmental path of vehicle propulsion to 2020 and beyond. We can
imagine at least three very different scenarios:
• The pragmatist path. Governments focus on energy independence and oil conservation. They also
place growing emphasis on well-to-wheel emissions. In this environment, small, efficient ICEs
and hybrids are increasingly viewed as an optimal solution. The focus on well-to-wheel emissions
and energy independence also benefits advanced biofuels. CNG plays a more important role if
oil prices soar, given its abundant supply. EVs maintain a relatively modest share of the overall
market and are viewed primarily as a hedge against spiking oil prices.
• The technology breakthrough path. New technology drives battery costs below $250 per KWh,
making EVs an attractive option for more consumers. EVs ultimately take a significant share of
the market (from 10 to 30 percent by 2020) barring unexpectedly low gasoline prices.
• The green path. Oil prices surge beyond $250 per barrel and governments invest in clean sources
of electricity. Investing to support the development of EVs becomes a win-win economic and
environmental solution for all players—consumers, OEMs, and governments. A mix of small-
model EVs and larger-model HEVs could capture up to a third of the market by 2020.
The challenge for OEMs and suppliers as the decade unfolds will be to prepare for and retain the flexibility to
switch between the different paths the industry could take. The challenge for governments will be to define
policies that accommodate all three paths until there is greater clarity on energy prices, environmental
considerations, and technological capabilities.
Draft Report – For Media Use Only 21
THE BOSTON CONSULTING GROUP July 2011
For Further Reading
The Boston Consulting Group has other reports on automotive propulsion:
Batteries for Electric Cars: Challenges, Opportunities, and the Outlook to 2020
A Focus by The Boston Consulting Group, January 2010
The Comeback of the Electric Car? How Real, How Soon, and What Must Happen Next
A Focus by The Boston Consulting Group, January 2009

Draft Report – For Media Use Only 22
THE BOSTON CONSULTING GROUP July 2011
Note to the Reader
About the Authors
Mythili Devineni is a principal in the Chicago office of The Boston Consulting Group. Andreas Dinger is a
partner and managing director in the firm’s Munich office. Marco Gerrits is a partner and managing director
in BCG’s Beijing office. Tobias Mezger is a project leader in the firm’s Detroit office. Xavier Mosquet is a
senior partner and managing director in BCG’s Detroit office and coleader of the firm’s global Automotive
practice. Massimo Russo is a senior partner and managing director in BCG’s Boston office. Georg Sticher is
a senior partner and managing director in the firm’s Munich office and coleader of BCG’s global Automotive
practice. Hadi Zablit is a partner and managing director in the firm’s Paris office.
Acknowledgments
The authors would like to thank our BCG colleagues who contributed to this report, especially Fernando
Apaez, Rolf Kilian, Tejus Kothari, Justin Rose, Laurent Rossi, and Alexander Wachtmeister. They would also
like to thank Gary Callahan, Angela DiBattista, Elyse Friedman, Kim Friedman, Gerry Hill, and Kirsten
Leshko for their contributions to the writing, editing, design, and production of this report.
For Further Contact
If you would like to discuss our findings in greater detail, please contact one of the authors:
Mythili Devineni
Principal
BCG Chicago
+1 312 993 3300
Andreas Dinger
Partner and Managing Director
BCG Munich
+49 89 23 17 40
Draft Report – For Media Use Only 23
THE BOSTON CONSULTING GROUP July 2011
Marco Gerrits
Partner and Managing Director
BCG Beijing
+86 10 8527 9000
Tobias Mezger
Project Leader
BCG Detroit
+1 248 688 3500
Xavier Mosquet
Senior Partner and Managing Director
BCG Detroit
+1 248 688 3500
Massimo Russo
Senior Partner and Managing Director
BCG Boston
+1 617 973 1200
Georg Sticher
Senior Partner and Managing Director
BCG Munich
+49 89 231 7 40
Hadi Zablit
Partner and Managing Director
BCG Paris
+33 1 40 17 10 10


![05W Jacoby.ppt [Read-Only] - autonews](https://static.fdocuments.in/doc/165x107/6215a485b92650233c3a13f8/05w-read-only-autonews.jpg)