GCAS ® OPERATION. FOOTPRINT Footprint Access from View – Footprint menu.

EUROPEAN COMMISSION JOINT RESEARCH CENTRE Institute for Environment and Sustainability H08 Sustainability Assessment Unit
DRAFT Product
Environmental Footprint -
General Guide Deliverable 2 to the Administrative Arrangement between DG Environment and Joint Research Centre No. N 070307/2009/552517, including Amendment No 1 from December 2010.
European Commission (EC)
Joint Research Centre(JRC)
Institute for Environment and Sustainability (IES)
Sustainability Assessment Unit (H08)
Authors: Kirana Chomkhamsri, Nathan Pelletier
Project Leader and main reviewer: Rana Pant
Action Leader: David Pennington
Approved: Constantin Ciupagea (HoU) June 29, 2011
Ref. Ares(2011)731977 - 06/07/2011

Product Environmental Footprint – General Guide; DRAFT ONLY FOR THE USE IN CASE STUDIES – DO NOT USE FOR ANY OTHER PURPOSE, OR CITE OR DISTRIBUTE
2
This page is left intentionally blank.
Product Environmental Footprint – General Guide; DRAFT ONLY FOR THE USE IN CASE STUDIES – DO NOT USE FOR ANY OTHER PURPOSE, OR CITE OR DISTRIBUTE
3
DRAFT –ONLY FOR USE IN CASE STUDIES - DO NOT USE FOR ANY OTHER PURPOSE, CITE, OR DISTRIBUTE

Product Environmental Footprint – General Guide; DRAFT ONLY FOR THE USE IN CASE STUDIES – DO NOT USE FOR ANY OTHER PURPOSE, OR CITE OR DISTRIBUTE
4
This page is left intentionally blank.
Product Environmental Footprint – General Guide; DRAFT ONLY FOR THE USE IN CASE STUDIES – DO NOT USE FOR ANY OTHER PURPOSE, OR CITE OR DISTRIBUTE
5
Contents Executive Summary ........................................................................................................................................... 7
Context ........................................................................................................ Error! Bookmark not defined.
Objectives .................................................................................................... Error! Bookmark not defined.
1. General Considerations for Product Environmental Footprint Studies ........................................................ 9 1.1 Principles for Product Environmental Footprint Studies .................................................................................9 1.2 Summary of Product Environmental Footprint Requirements ................................................................... 12
2. Defining the Goal(s) of the Product Environmental Footprint Study.......................................................... 17 2.1 General ................................................................................................................................................................................ 17
3. Defining the Scope of the Product Environmental Footprint Study............................................................ 18 3.1 General ................................................................................................................................................................................ 18 3.2 Unit of analysis (functional unit) and reference flow ...................................................................................... 18 3.3 System boundaries for Product Environmental Footprint studies ............................................................ 19 3.4 Cut-off criteria .................................................................................................................................................................. 21 3.5 Selecting Environmental Footprint Impact Categories and Assessment Methods.............................. 21
4. Compiling and Recording the Resource Use and Emissions Profile ............................................................ 26 4.1 General ................................................................................................................................................................................ 26 4.2 Sources of Resource Use and Emissions Profile data....................................................................................... 26 4.3 Temporary carbon storage and delayed emissions..............................Error! Bookmark not defined. 4.4 Identifying relevant processes within the product system boundary ...................................................... 29 4.5 Data management plan................................................................................................................................................. 30 4.6 Data quality requirements .......................................................................................................................................... 31 4.7 Data collection.................................................................................................................................................................. 34 4.8 Generic (secondary) data............................................................................................................................................. 35 4.9 Dealing with remaining unit process data gaps / missing data................................................................... 36
General .................................................................................................................................................... 36
How to deal with remaining missing inventory data / information........................................................ 36 4.10 Handling multi-functional processes ................................................................................................................... 37 4.11 Data collection template............................................................................................................................................ 41
5. Environmental Footprint Impact Assessment ............................................................................................. 46 5.1 Mandatory Steps: Classification and Characterisation.................................................................................... 46
5.1.1 Classification of Product Environmental Footprint data ................................................................ 46
5.1.2 Characterisation of Product Environmental Footprint results ....................................................... 47

Product Environmental Footprint – General Guide; DRAFT ONLY FOR THE USE IN CASE STUDIES – DO NOT USE FOR ANY OTHER PURPOSE, OR CITE OR DISTRIBUTE
6
5.2 Optional Steps: Normalization and Weighting ................................................................................................... 48
5.2.1 Normalisation of Product Environmental Footprint results........................................................... 48
5.2.2 Weighting of Product Environmental Footprint results ................................................................. 48
6. Interpretation of Product Environmental Footprint Results ....................................................................... 49 6.1 General ................................................................................................................................................................................ 49 6.2 Identification of significant issues ........................................................................................................................... 49 6.3 Calculating uncertainty................................................................................................................................................. 50 6.4 Conclusions, recommendations and limitations ................................................................................................ 51
7. Product Environmental Footprint Reports .................................................................................................. 53 7.1 General ................................................................................................................................................................................ 53 7.2 Reporting elements........................................................................................................................................................ 53
First element: Executive Summary.......................................................................................................... 53
Second element: Technical Summary ..................................................................................................... 53
Third element: Main Report .................................................................................................................... 54
Fourth element: Annex............................................................................................................................ 55
Fifth element: Confidential report .......................................................................................................... 55
8. Product Environmental Footprint Review................................................................................................... 55 8.1 General ................................................................................................................................................................................ 55 8.2 Review type ....................................................................................................................................................................... 56 8.3 Reviewer qualifications................................................................................................................................................ 56
9. Role of Product Environmental Footprint Category Rules .......................................................................... 58 9.1 General ................................................................................................................................................................................ 58 9.2 Role of PFCRs.................................................................................................................................................................... 58 9.3 Developing PFCRs - how to get started.................................................................................................................. 58
10. Example (to be inserted for final version) ................................................................................................. 60
11. Acronyms and Abbreviations..................................................................................................................... 61
12. Glossary ..................................................................................................................................................... 62
13. References ................................................................................................................................................. 66
Annex I: Calculation of CO2 emissions from land transformation .................................................................. 67
Annex II Allocation method for recycling (where economic allocation is necessary)..................................... 74
Annex III. Data Management Plan (adapted from GHG protocol initiative) ................................................. 101
Annex IV. Example Product Environmental Footprint Report Template ...................................................... 102
Product Environmental Footprint – General Guide; DRAFT ONLY FOR THE USE IN CASE STUDIES – DO NOT USE FOR ANY OTHER PURPOSE, OR CITE OR DISTRIBUTE
7
Executive Summary
Context In the context of increasing global awareness of anthropogenic climate change, the carbon footprint concept is now widely used both as a marketing tool and to mobilize public sentiment. In its conclusions on the Sustainable Consumption and Production Action Plan the Council invited the Commission "taking into account Member States' experience, to start working as soon as possible on common voluntary methodologies facilitating the future establishment of carbon audits for organizations and the calculation of the carbon footprint of products" (Council of the European Union 2008).
As a follow-up to the Council conclusions, the European Commission conducted a study on product and corporate Carbon Footprint methods that involved analyzing existing methodologies and initiatives and how they might relate to future policies. One of the main outcomes of this study was that it is important to take into consideration all relevant environmental impacts of products in a balanced way in place of a sole focus on greenhouse gas emissions (European Commission 2010).
Recently, in its conclusion to "Sustainable materials management and sustainable production and consumption" (Council of the European Union 2010), the European Council invited the Commission to "develop a common methodology on the quantitative assessment of environmental impacts of products, throughout their life-cycle, in order to support the assessment and labeling of products".
The European Commission, therefore, decided to extend the work on carbon footprints to include other environmental aspects. Thus, the Product and Corporate Environmental Footprint project was initiated with the aim of developing a harmonized European methodology for environmental footprint studies that can accommodate a broader suite of relevant environmental performance criteria using a life cycle approach.
The life cycle approach to environmental management, and life cycle thinking in general, takes into consideration all relevant environmental interactions associated with a good, service, activity, or entity from a supply chain perspective. In other words, as opposed to simply focusing on the direct and obvious impacts that manifest at a given point in a supply chain, the life cycle approach requires attention to impacts that occur along the entire life cycle, i.e. from the level of primary resource extraction through processing, distribution, use, and eventual disposal or reuse phases. Such an approach is essential to effective management because, often, many of the most important environmental effects may occur “upstream” or “downstream”, and hence may not be immediately evident. This approach is also essential to making transparent any potential tradeoffs between different types of environmental impacts associated with specific management decisions.
The work also relates to one of the building blocks of the Flagship initiative of the Europe 2020 Strategy - A resource-efficient Europe. The upcoming European Commission's Roadmap for a resource-efficient Europe will propose ways to increase resource productivity and decouple economic growth from resource use and its environmental impact and key resources will be analysed from a life-cycle or value-chain perspective.
Product Environmental Footprint – General Guide; DRAFT ONLY FOR THE USE IN CASE STUDIES – DO NOT USE FOR ANY OTHER PURPOSE, OR CITE OR DISTRIBUTE
8
Objectives The Product Environmental Footprint is a multi-criteria measure of the environmental performance of a good or service throughout its life cycle. Product Environmental Footprint information is produced for the overarching purpose of seeking to reduce the environmental impacts of goods and services. This document aims at providing detailed technical guidance on how to conduct a Product Environmental Footprint study. Product Environmental Footprint studies may be used for a variety of purposes, including in-house management and participation in either voluntary or mandatory programs.
Process and Results Each requirement for Product Environmental Footprint studies specified in this methods guide has been chosen taking into consideration the recommendations of similar, internationally recognized product environmental accounting methods and guidance documents. Specifically, the methodology guides considered were:
• ISO 14044: Environmental management -- Life cycle assessment -- Requirements and guidelines
• ISO 14067: Carbon footprint of products
• ILCD: International Reference Life Cycle Data System
• Ecological Footprint
• Product and supply chain standards, Greenhouse Gas Protocol (WRI/ WBCSD)
• Méthodologie d'affichage environnemental (BPX 30-323)
• Specification for the assessment of the life cycle greenhouse gas emissions of goods and services (PAS 2050)
Although such documents align closely on much of the methodological guidance they provide, it is noteworthy that discrepancies and/or lack of clarity remains on a number of important decision points, which reduces the consistency and comparability of analytical outcomes. Whereas existing methods may provide several alternatives for a given methodological decision point, the intention of this Product Environmental Footprint guidance is (wherever feasible) to identify a single requirement for each decision point to support more consistent, robust and reproducible Product Environmental Footprint studies. Thus, comparability is given priority over flexibility.
This document is therefore intended as a detailed, stand-alone guide to implementing the requirements for Product Environmental Footprint studies across sectors. However, additional Product Environmental Footprint Category Rules (PFCRs) should be developed as a complement to this general guide in order to further increase methodological harmonization, specificity, relevance and reproducibility for a given product category.
Product Environmental Footprint – General Guide; DRAFT ONLY FOR THE USE IN CASE STUDIES – DO NOT USE FOR ANY OTHER PURPOSE, OR CITE OR DISTRIBUTE
9
1. General Considerations for Product Environmental Footprint Studies An important guiding principle in identifying the preferred methodological options for Product Environmental Footprint studies, and hence narrowing the choices available to users of this methodology guide, has been to maximize the physical representativeness of the analytical outcomes. The rationale behind this guiding principle is simply that the Product Environmental Footprint is a method for modeling the quantitative, physical environmental impacts of the flows of material/energy and resulting emissions and waste streams associated with the life cycle of goods and services.
Achieving a model that provides for such physical realism requires that modeling parameters are defined, as far as possible, in concrete, physical terms that reflect these physical relationships. The Product Environmental Footprint is not a financial accounting model, hence efforts have been made to minimize the need for using financial information (for example, in defining organizational boundaries), which may be poorly representative of the physical relationships pertinent to the systems modeled.
REQUIREMENT: A Product Environmental Footprint study shall be based on a life cycle approach in contrast to focusing on a single phase in the life cycle (e.g. only manufacturing) or a single environmental impact in order to reduce the possibility of unintended burden-shifting.
1.1 Principles for Product Environmental Footprint Studies Consistent, robust and reproducible Product Environmental Footprint studies require strict adherence to a core suite of analytical principles. These principles are intended to provide overarching guidance in the application of the Product Environmental Footprint method. They should be considered with respect to each phase of Product Environmental Footprint studies, from the articulation of study goals and definition of the scope of the research, through data collection, impact assessment, reporting and verification of study outcomes.
Accordingly, users of this guide shall observe the following principles in Product Environmental Footprint studies:
(1) Relevance/Materiality
All methods and data collected and used for the purpose of quantifying the Product Environmental Footprint shall be as relevant/material to the study as possible.
(2) Completeness
Quantification of the Product Environmental Footprint shall include attention to all relevant material/energy flows and other environmental interventions as required for adherence to the defined system boundaries, the data requirements, and the impact assessment methods employed.
Product Environmental Footprint – General Guide; DRAFT ONLY FOR THE USE IN CASE STUDIES – DO NOT USE FOR ANY OTHER PURPOSE, OR CITE OR DISTRIBUTE
10
(3) Consistency
Strict conformity with this guide shall be observed in all steps of the Product Environmental Footprint study so as to ensure internal consistency as well as comparability with similar analyses.
(4) Accuracy
All reasonable efforts shall be taken to reduce uncertainties both in product system modeling and reporting of results.
(5) Transparency
Product Environmental Footprint information shall be disclosed in such a way so as to provide intended users with the necessary basis for decision making, and for stakeholders to assess its robustness and reliability.

Product Environmental Footprint – General Guide; DRAFT ONLY FOR THE USE IN CASE STUDIES – DO NOT USE FOR ANY OTHER PURPOSE, OR CITE OR DISTRIBUTE
11
Fig 1 simplified diagram for Product Environmental Footprint studies
Note:

Product Environmental Footprint – General Guide; DRAFT ONLY FOR THE USE IN CASE STUDIES – DO NOT USE FOR ANY OTHER PURPOSE, OR CITE OR DISTRIBUTE
12
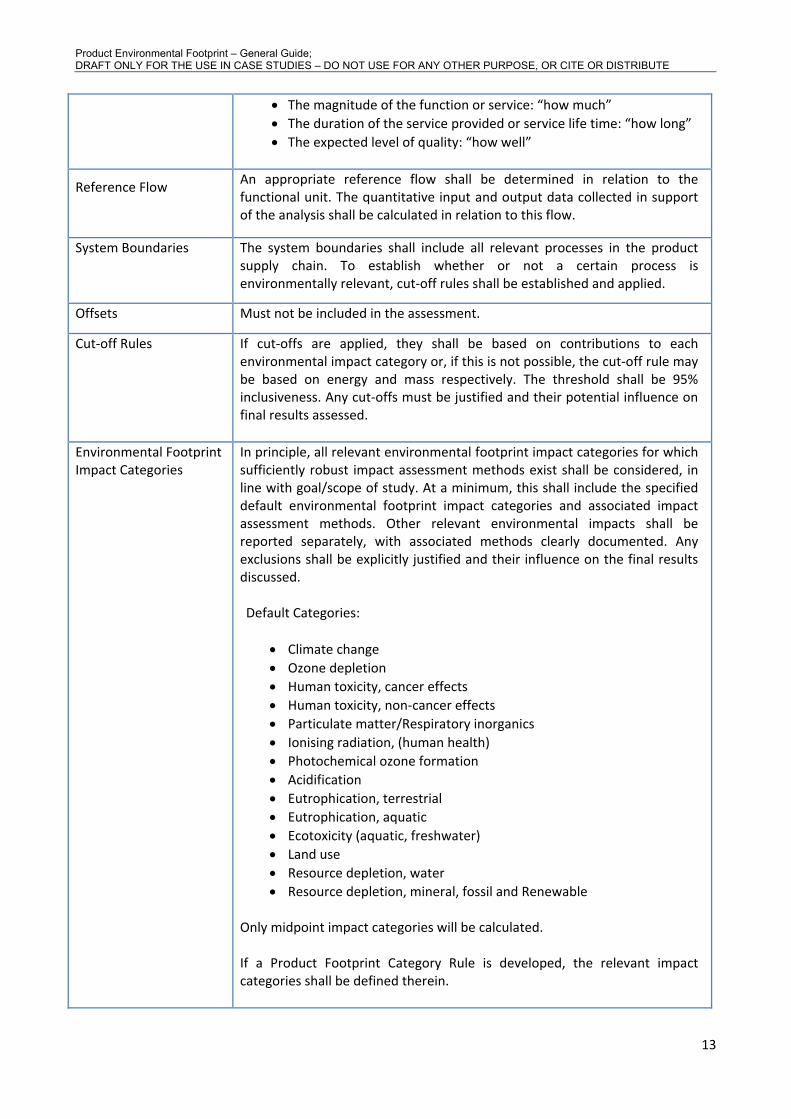
1.2 Summary of Product Environmental Footprint Requirements Table 1 summarizes the key requirements for conducting a Product Environmental Footprint study in conformity with this guidance document. In the event a specification/ requirement is not provided, users should refer to and conform with the requirements of the ILCD Handbook.
Table 1: Summary of Product Environmental Footprint Requirements
Items Requirement
Life Cycle Approach Use Life Cycle Approach in contrast to focusing on a single phase in the life cycle (e.g. only manufacturing) or a single environmental impact (e.g. climate change) in order to reduce the possibility of burden-shifting.
Principles Users of this guide shall observe the following principles in conducting a Product Environmental Footprint study:
• Relevance/Materiality • Completeness • Consistency • Accuracy • Transparency
Goal Definition Goal definition for a Product Environmental Footprint study shall include:
• Intended application(s) • Reasons for carrying out the study and decision context • Target audience • Limitations due to assumptions, data, and impact coverage • Whether for the purpose of comparative assertions1 to be disclosed
to the public • Commissioner of the study • Review procedure (if applicable)
Scope Definition Scope definition shall include:
• Unit of analysis (functional unit) and reference flow • System boundaries • Cut-off criteria • Environmental footprint impact categories
Unit of Analysis/ Functional Unit
The functional unit shall be defined according to the following aspects:
• The function(s)/service(s) provided: “what” 1 E.g. claims of overall environmental superiority or equivalence of one product over another product fulfilling the same function disclosed to the public.
Product Environmental Footprint – General Guide; DRAFT ONLY FOR THE USE IN CASE STUDIES – DO NOT USE FOR ANY OTHER PURPOSE, OR CITE OR DISTRIBUTE
13
• The magnitude of the function or service: “how much” • The duration of the service provided or service life time: “how long” • The expected level of quality: “how well”
Reference Flow An appropriate reference flow shall be determined in relation to the functional unit. The quantitative input and output data collected in support of the analysis shall be calculated in relation to this flow.
System Boundaries The system boundaries shall include all relevant processes in the product supply chain. To establish whether or not a certain process is environmentally relevant, cut-off rules shall be established and applied.
Offsets Must not be included in the assessment.
Cut-off Rules If cut-offs are applied, they shall be based on contributions to each environmental impact category or, if this is not possible, the cut-off rule may be based on energy and mass respectively. The threshold shall be 95% inclusiveness. Any cut-offs must be justified and their potential influence on final results assessed.
Environmental Footprint Impact Categories
In principle, all relevant environmental footprint impact categories for which sufficiently robust impact assessment methods exist shall be considered, in line with goal/scope of study. At a minimum, this shall include the specified default environmental footprint impact categories and associated impact assessment methods. Other relevant environmental impacts shall be reported separately, with associated methods clearly documented. Any exclusions shall be explicitly justified and their influence on the final results discussed. Default Categories:
• Climate change • Ozone depletion • Human toxicity, cancer effects • Human toxicity, non-cancer effects • Particulate matter/Respiratory inorganics • Ionising radiation, (human health) • Photochemical ozone formation • Acidification • Eutrophication, terrestrial • Eutrophication, aquatic • Ecotoxicity (aquatic, freshwater) • Land use • Resource depletion, water • Resource depletion, mineral, fossil and Renewable
Only midpoint impact categories will be calculated. If a Product Footprint Category Rule is developed, the relevant impact categories shall be defined therein.
Product Environmental Footprint – General Guide; DRAFT ONLY FOR THE USE IN CASE STUDIES – DO NOT USE FOR ANY OTHER PURPOSE, OR CITE OR DISTRIBUTE
14
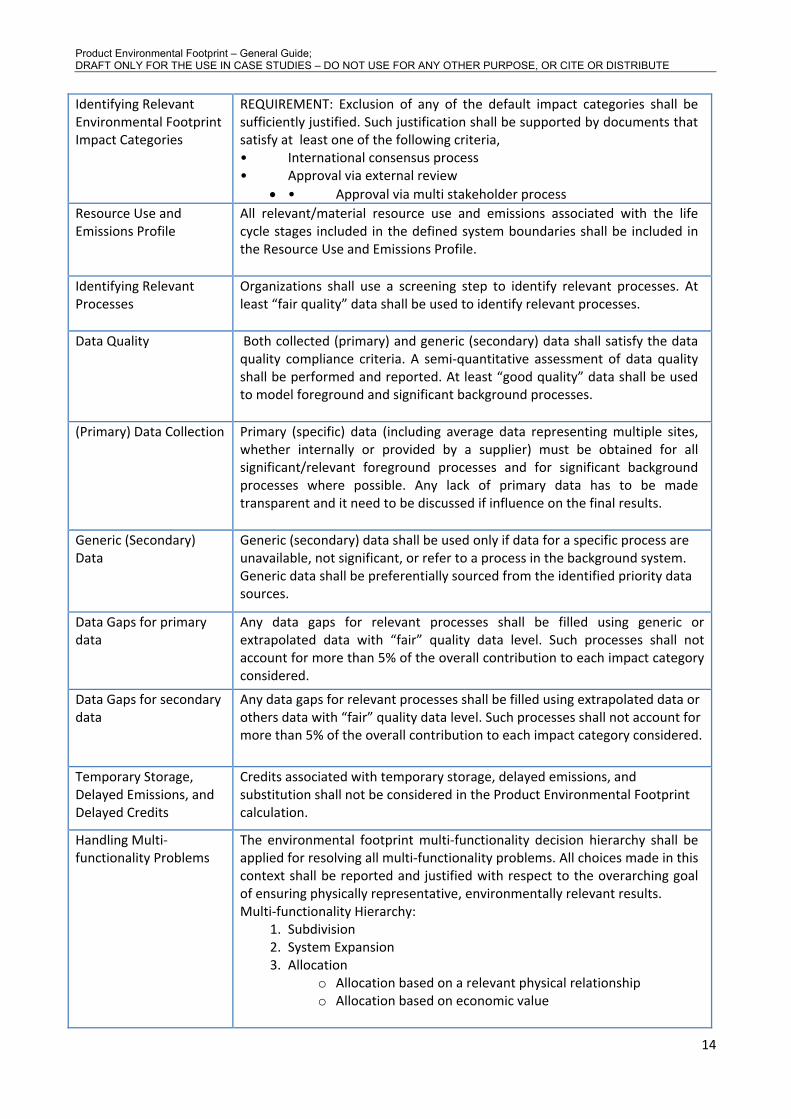
Identifying Relevant Environmental Footprint Impact Categories
REQUIREMENT: Exclusion of any of the default impact categories shall be sufficiently justified. Such justification shall be supported by documents that satisfy at least one of the following criteria, • International consensus process • Approval via external review
• • Approval via multi stakeholder process Resource Use and Emissions Profile
All relevant/material resource use and emissions associated with the life cycle stages included in the defined system boundaries shall be included in the Resource Use and Emissions Profile.
Identifying Relevant Processes
Organizations shall use a screening step to identify relevant processes. At least “fair quality” data shall be used to identify relevant processes.
Data Quality Both collected (primary) and generic (secondary) data shall satisfy the data quality compliance criteria. A semi-quantitative assessment of data quality shall be performed and reported. At least “good quality” data shall be used to model foreground and significant background processes.
(Primary) Data Collection Primary (specific) data (including average data representing multiple sites, whether internally or provided by a supplier) must be obtained for all significant/relevant foreground processes and for significant background processes where possible. Any lack of primary data has to be made transparent and it need to be discussed if influence on the final results.
Generic (Secondary) Data
Generic (secondary) data shall be used only if data for a specific process are unavailable, not significant, or refer to a process in the background system. Generic data shall be preferentially sourced from the identified priority data sources.
Data Gaps for primary data
Any data gaps for relevant processes shall be filled using generic or extrapolated data with “fair” quality data level. Such processes shall not account for more than 5% of the overall contribution to each impact category considered.
Data Gaps for secondary data
Any data gaps for relevant processes shall be filled using extrapolated data or others data with “fair” quality data level. Such processes shall not account for more than 5% of the overall contribution to each impact category considered.
Temporary Storage, Delayed Emissions, and Delayed Credits
Credits associated with temporary storage, delayed emissions, and substitution shall not be considered in the Product Environmental Footprint calculation.
Handling Multi-functionality Problems
The environmental footprint multi-functionality decision hierarchy shall be applied for resolving all multi-functionality problems. All choices made in this context shall be reported and justified with respect to the overarching goal of ensuring physically representative, environmentally relevant results. Multi-functionality Hierarchy:
1. Subdivision 2. System Expansion 3. Allocation
o Allocation based on a relevant physical relationship o Allocation based on economic value

Product Environmental Footprint – General Guide; DRAFT ONLY FOR THE USE IN CASE STUDIES – DO NOT USE FOR ANY OTHER PURPOSE, OR CITE OR DISTRIBUTE
15
When the multi-functionality decision hierarchy is in EoL of recycling situations, the equation described in Annex II shall be applied for system expansion.
Environmental Footprint Impact Assessment
Environmental footprint impact assessment shall include: • Characterization • Classification
Classification All inputs/outputs tabulated during the compilation of the Resource Use and
Emissions Profile shall be assigned to the environmental footprint impact categories to which they contribute
Characterization All classified inputs/outputs in each environmental footprint impact category shall be assigned characterization factors representing the contribution per unit input/output to the category. Environmental footprint results shall subsequently be calculated for each category by multiplying the amount of each input/output by its characterization factor and summing contributions of all inputs/outputs within each category to a single measure expressed in the appropriate reference unit.
Normalization (if required for intended application)
If normalization is applied, the normalized environmental footprint results shall be calculated using peer-reviewed normalization factors appropriate for the reference unit.
Weighting (if required for intended application)
Weighting is not a required step for Product Environmental Footprint. If weighting is applied, the environmental footprint results shall be multiplied by weighting factors which represent the perceived relevance of the impact categories considered. The basis for the weighting factors shall be explicitly justified and communicated. Result of the environmental footprint impact assessment prior to weighting have to be reported alongside weighted results.
Interpretation Interpretation of the Product Environmental Footprint study shall include:
• Identification of significant issues • Calculation of uncertainty • Conclusions, recommendations including improvement potential,
and limitations
Identification of Significant Issues
Significant methodological issues shall be evaluated using a combination of completeness, sensitivity and consistency checks as appropriate. Environmental footprint results shall subsequently be evaluated to assess supply chain hotspots/weak points on inputs and emissions, processes, and supply chain bases and to assess improvement potentials.
Calculating Uncertainty Quantitative uncertainty assessments shall be calculated for variance associated with significant processes and characterization factors using Monte Carlo simulations. The influence of choice-related uncertainties shall be estimated at the upper and lower bounds using scenario model assessments. These shall be clearly documented and reported. Where quantitative assessments are not possible, qualitative descriptions of any remaining uncertainties shall be provided.

Product Environmental Footprint – General Guide; DRAFT ONLY FOR THE USE IN CASE STUDIES – DO NOT USE FOR ANY OTHER PURPOSE, OR CITE OR DISTRIBUTE
16
Conclusions, Recommendations, and Limitations
Conclusions, recommendations and limitations shall be described in accordance with the defined goals and scope of the Product Environmental Footprint study.
Product Environmental Footprint Reports
The study report shall include, at a minimum, an executive summary, technical summary, environmental footprint impact assessment, and any necessary supporting information.
Review type The study shall be reviewed by an independent and qualified external reviewer (or review team.) The comparative assertion study shall be reviewed by independent external reviewer together with stakeholder panel.
Qualification of reviewer A review of the Product Environmental Footprint study shall be conducted as per the requirements of the intended application. Unless otherwise specified, the minimum necessary score to qualify as a reviewer is 6 points, including satisfaction of the mandatory criteria of scoring at least one point for each of the three i.e. verification and audit practice, LCA methodology and practice and technologies or other activities represented by environmental footprint. Reviewers or panel of reviewers have to add a self-declaration on their qualification, stating how many points they achieved in each topic in the review report.
Product Environmental Footprint – General Guide; DRAFT ONLY FOR THE USE IN CASE STUDIES – DO NOT USE FOR ANY OTHER PURPOSE, OR CITE OR DISTRIBUTE
17
2. Defining the Goal(s) of the Product Environmental Footprint Study
2.1 General Goal definition is the first step of a Product Environmental Footprint study, and sets the overall context for the study. The purpose of clearly articulating goals is to ensure that the analytical aims, methods, results and intended applications are optimally aligned, and that a shared vision is in place to guide participants in the study. The choice to use the Product Environmental Footprint guidance implies that some aspects of goal definition will be, a priori, decided. Nonetheless, taking the time to carefully consider and articulate goals will be an important step towards the success of the Product Environmental Footprint.
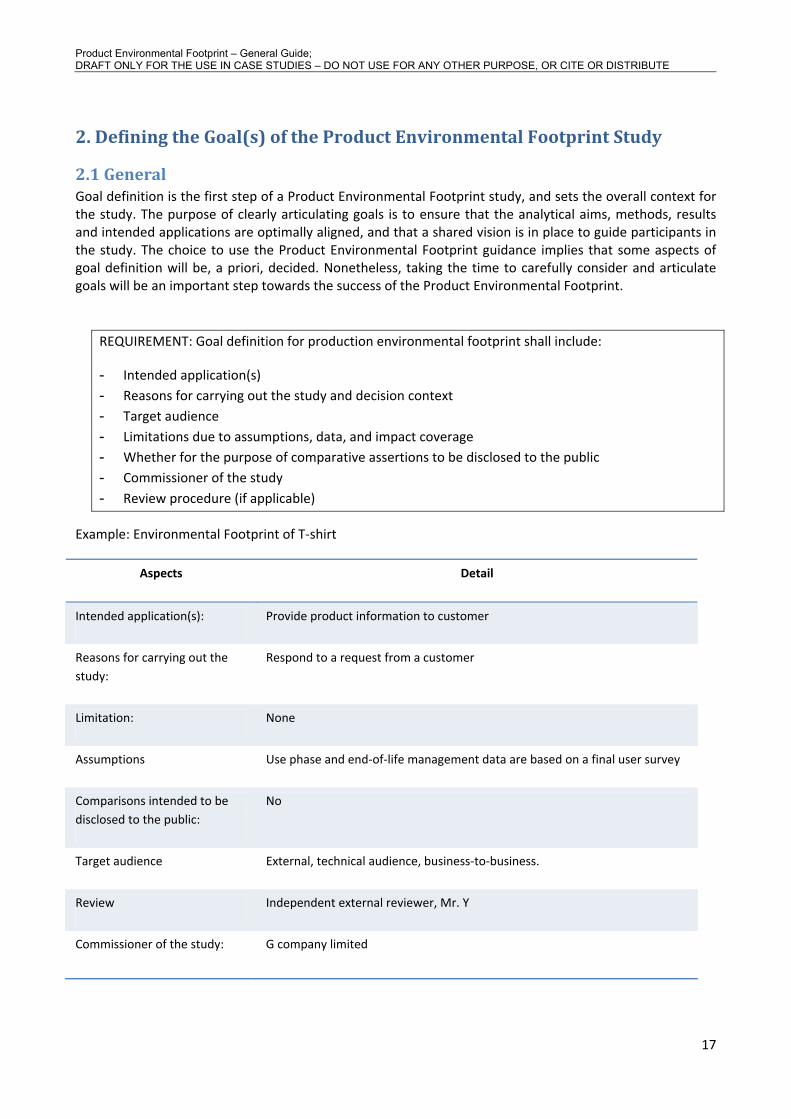
REQUIREMENT: Goal definition for production environmental footprint shall include:
- Intended application(s) - Reasons for carrying out the study and decision context - Target audience - Limitations due to assumptions, data, and impact coverage - Whether for the purpose of comparative assertions to be disclosed to the public - Commissioner of the study - Review procedure (if applicable)
Example: Environmental Footprint of T-shirt
Aspects Detail
Intended application(s): Provide product information to customer
Reasons for carrying out the study:
Respond to a request from a customer
Limitation: None
Assumptions Use phase and end-of-life management data are based on a final user survey
Comparisons intended to be disclosed to the public:
No
Target audience External, technical audience, business-to-business.
Review Independent external reviewer, Mr. Y
Commissioner of the study: G company limited
Product Environmental Footprint – General Guide; DRAFT ONLY FOR THE USE IN CASE STUDIES – DO NOT USE FOR ANY OTHER PURPOSE, OR CITE OR DISTRIBUTE
18
3. Defining the Scope of the Product Environmental Footprint Study
3.1 General Defining the scope of the Product Environmental Footprint study refers to describing in detail the system to be evaluated along with the associated analytical specifications. Scope definition must be in alignment with the defined study goals and the requirements of the Product Environmental Footprint guidance. The unit of analysis (functional unit), reference flow, system boundaries, cut-off rules and environmental footprint impact categories for Product Environmental Footprint shall be identified and clearly described.
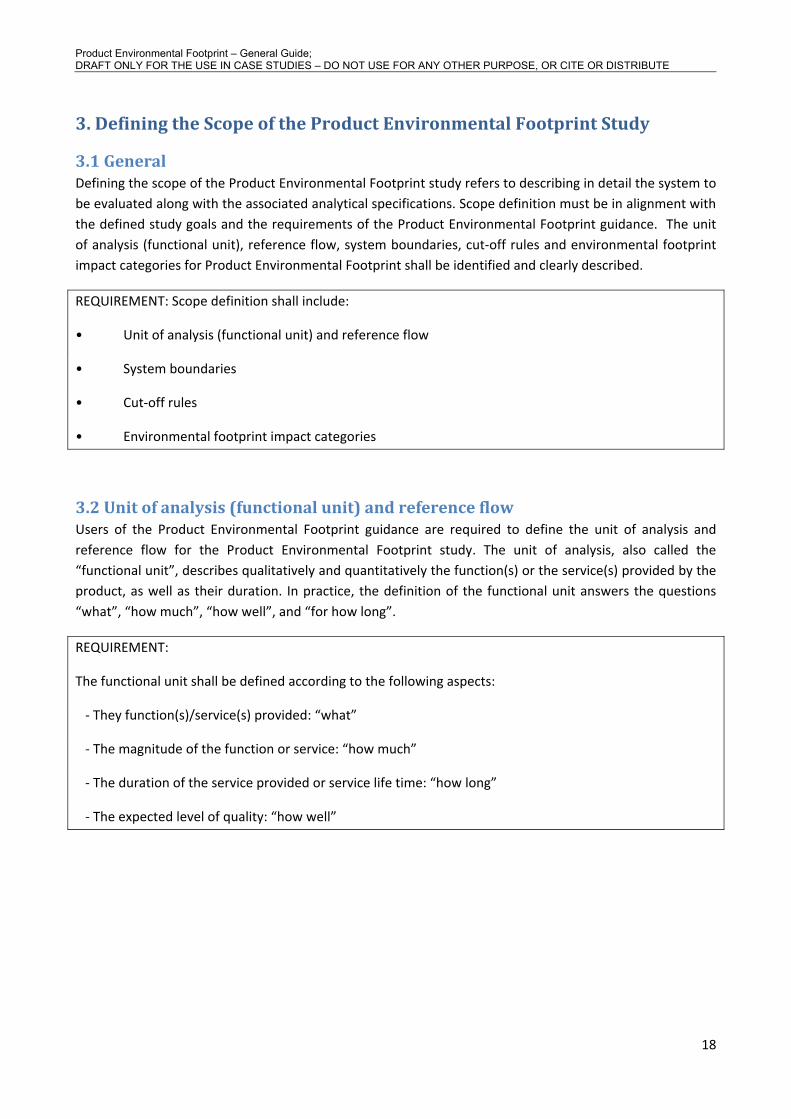
REQUIREMENT: Scope definition shall include:
• Unit of analysis (functional unit) and reference flow
• System boundaries
• Cut-off rules
• Environmental footprint impact categories
3.2 Unit of analysis (functional unit) and reference flow Users of the Product Environmental Footprint guidance are required to define the unit of analysis and reference flow for the Product Environmental Footprint study. The unit of analysis, also called the “functional unit”, describes qualitatively and quantitatively the function(s) or the service(s) provided by the product, as well as their duration. In practice, the definition of the functional unit answers the questions “what”, “how much”, “how well”, and “for how long”.
REQUIREMENT:
The functional unit shall be defined according to the following aspects:
- They function(s)/service(s) provided: “what”
- The magnitude of the function or service: “how much”
- The duration of the service provided or service life time: “how long”
- The expected level of quality: “how well”

Product Environmental Footprint – General Guide; DRAFT ONLY FOR THE USE IN CASE STUDIES – DO NOT USE FOR ANY OTHER PURPOSE, OR CITE OR DISTRIBUTE
19
Example:
Note:
Some interim products may have more than one function. It may be necessary to identify and choose among these functions.
The reference flow is the amount of product necessary to provide the defined function. It constitutes the flow(s) to which all other input and output flows in the analysis quantitatively relate. The reference flow can be expressed in direct relation to the functional unit or in a more product-oriented way.
REQUIREMENT: An appropriate reference flow shall be determined in relation to the functional unit. The quantitative input and output data collected in support of the analysis shall be calculated in relation to this flow. Example:
3.3 System boundaries for Product Environmental Footprint Studies The system boundaries define which parts of the product life cycle and which associated processes belong to the analysed system (i.e. are required for providing its function as defined by the functional unit). Therefore, the system boundary must be clearly defined for the product system to be evaluated.
The system boundary should be defined following general supply-chain logic, including all phases from raw material extraction through processing, distribution, the use phase and end-of-life treatment of the product, as appropriate to the intended application of the study. If a Product Footprint Category Rules (PFCR) is developed, the relevant processes will be further specified in the sector or product specific requirements, including temporal, geographical, and technological specifications.
Off-set emissions (e.g. due to carbon off-setting by the Clean Development Mechanism, carbon credits, and other system-external off-sets) are not to be included in the system boundaries and the related (reduced) emissions are not to be integrated into the inventory.
Reference flow: 160 gram of T-shirt
Product Environmental Footprint – General Guide; DRAFT ONLY FOR THE USE IN CASE STUDIES – DO NOT USE FOR ANY OTHER PURPOSE, OR CITE OR DISTRIBUTE
20
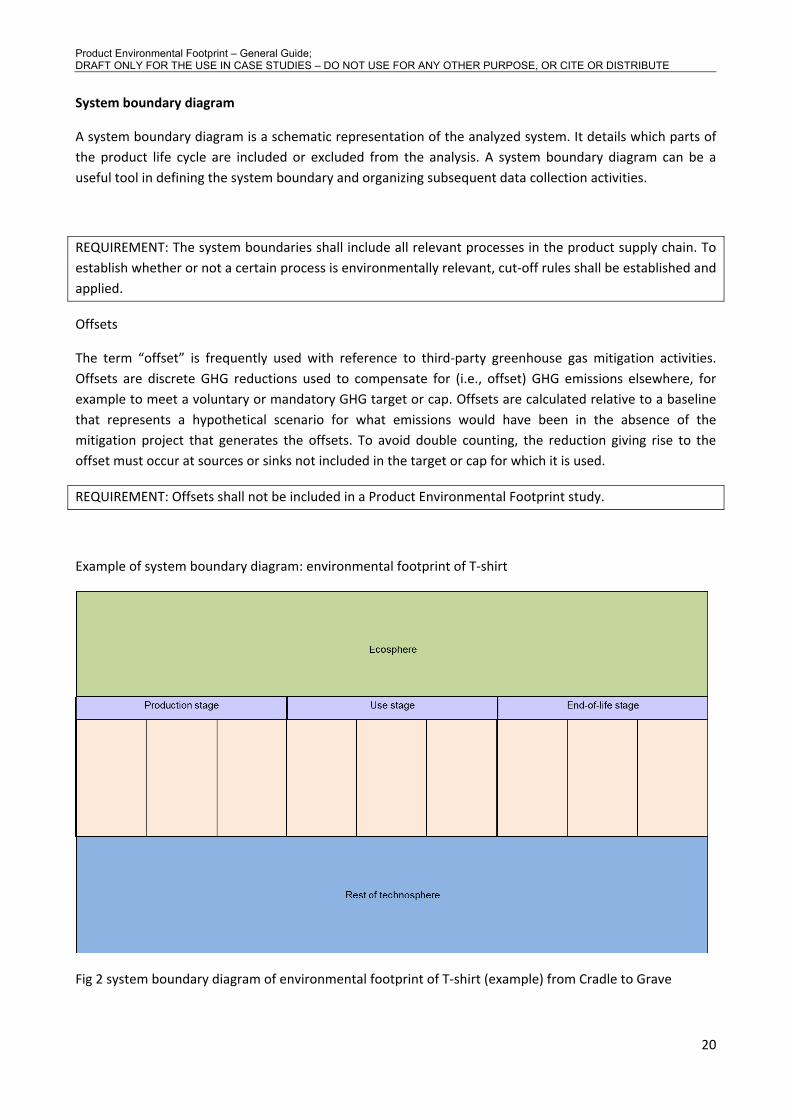
System boundary diagram
A system boundary diagram is a schematic representation of the analyzed system. It details which parts of the product life cycle are included or excluded from the analysis. A system boundary diagram can be a useful tool in defining the system boundary and organizing subsequent data collection activities.
REQUIREMENT: The system boundaries shall include all relevant processes in the product supply chain. To establish whether or not a certain process is environmentally relevant, cut-off rules shall be established and applied.
Offsets
The term “offset” is frequently used with reference to third-party greenhouse gas mitigation activities. Offsets are discrete GHG reductions used to compensate for (i.e., offset) GHG emissions elsewhere, for example to meet a voluntary or mandatory GHG target or cap. Offsets are calculated relative to a baseline that represents a hypothetical scenario for what emissions would have been in the absence of the mitigation project that generates the offsets. To avoid double counting, the reduction giving rise to the offset must occur at sources or sinks not included in the target or cap for which it is used.
REQUIREMENT: Offsets shall not be included in a Product Environmental Footprint study.
Example of system boundary diagram: environmental footprint of T-shirt
Fig 2 system boundary diagram of environmental footprint of T-shirt (example) from Cradle to Grave

Product Environmental Footprint – General Guide; DRAFT ONLY FOR THE USE IN CASE STUDIES – DO NOT USE FOR ANY OTHER PURPOSE, OR CITE OR DISTRIBUTE
21
3.4 Cut-off Criteria In principle, all processes and flows that are attributable to the analysed system are to be included in the system boundaries. However, not all these processes and elementary flows may be quantitatively relevant. The cut-off criterion to be applied is that modeled flows must account for at least 95% of each of the environmental impact categories considered. If cutoffs cannot be identified on the basis of environmental impact categories, then energy and/or mass-based cut-offs may be applied respectively.
REQUIREMENT: If cut-offs are applied, they should be based on contributions to each environmental impact category or, if this is not possible, the cut-off rule may be based on energy and mass respectively. The threshold shall be 95% inclusiveness. Any cut-offs must be justified and their potential influence on final results assessed.
TIP: identify the 95 % cut-off level by using generic (secondary) data to estimate the overall environmental impact of the product system for each impact category. See more details on identifying relevant processes in chapter 4.3.
Example: Cut of rules for T-shirt assessment
3.5 Selecting Environmental Footprint Impact Categories and Assessment Methods Environmental footprint impact categories refer to specific categories of environmental impacts considered in a Product Environmental Footprint study. These are generally related to resource use or emissions of environmentally problematic substances, such as greenhouse gases or toxic chemicals. Environmental footprint impact assessment methods use models for quantifying the causal relationships between the material/energy inputs and emissions associated with the product life cycle (tabulated in the Resource Use and Emissions Profile) and each environmental footprint impact category considered. Each impact category hence has an associated, stand-alone environmental footprint impact assessment method.
The purpose of environmental footprint impact assessment is to group and aggregate the collected inventory data (Resource Use and Emissions Profile) according to the respective contributions to each

Product Environmental Footprint – General Guide; DRAFT ONLY FOR THE USE IN CASE STUDIES – DO NOT USE FOR ANY OTHER PURPOSE, OR CITE OR DISTRIBUTE
22
impact category. This subsequently provides the necessary basis for interpretation of the environmental footprint results relative to the goals of the footprint study (for example, identification of supply chain “hot spots” and option s for improvement). The selection of environmental footprint impact categories should therefore be comprehensive in the sense that they cover all relevant environmental issues related to the product supply chain of interest.
In general, environmental footprint impact categories and assessment methods suitable for use in Product Environmental Footprint are internationally accepted, peer-reviewed protocols for quantifying environmental impacts from a supply chain perspective. While a variety of impact assessment methods covering a range of environmental impacts are available, it must be recognized that coverage is limited and, in some areas, methodological development is not yet sufficiently advanced for the purpose of use in Product Environmental Footprint. Even where standardized life cycle-based environmental impact assessment methods do not exist, however, it is important to consider as many relevant environmental impacts as is feasible – for example, biodiversity impacts that may occur at only one stage of the product life cycle and in association with a specific site or activity. This may require the application of additional environmental impact assessment methods beyond the default list provided in this guidance document, or even additional qualitative descriptions where impacts cannot be linked to the functional unit in a quantitative manner. Such additional methods should be viewed as complementary to the default suite used for Product Environmental Footprint. Any such additions must be supported by adequate documentation and review.
It is useful to further distinguish between “mid-point” and “end-point” environmental footprint impact assessment methods. Mid-point assessment methods express potential impacts (for example, global warming potential), whereas end-point assessment methods express impacts as actual damage levels (for example, biodiversity loss). Both mid-point and end-point impact assessment methods are available for a variety of environmental impacts. Mid-point methods are more commonly used. They are usually more robust and have lower uncertainty. They are hence preferred for Product Environmental Footprint. For example, impacts on biodiversity (end-point) are not calculated as such for Product Environmental Footprint, but are represented by those mid-points that negatively affect biodiversity, predominantly eco-toxicity, eutrophication, acidification, land use, climate change, and ozone depletion. Many pressures on biodiversity are hence well represented in the environmental footprint.
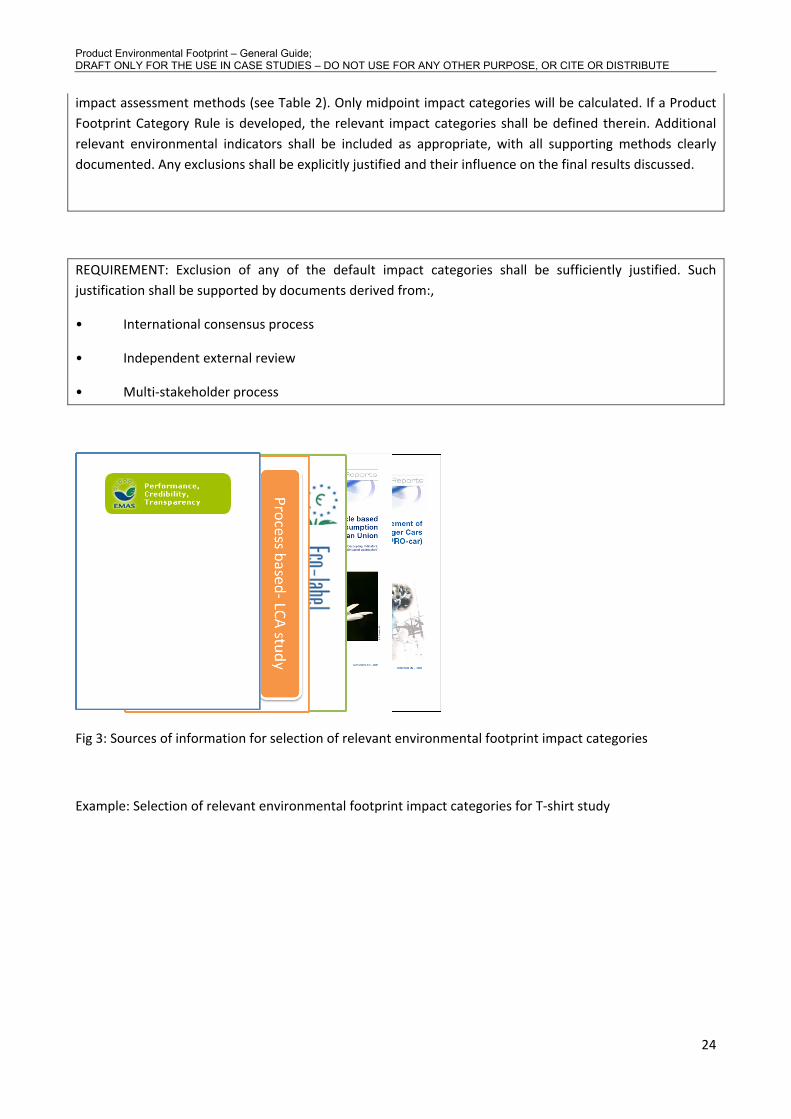
Depending on the product system and intended application, users of this methodology guide may elect to narrow the suite of environmental impacts considered in the study. However, exclusion of any of the default impact categories must be sufficiently justified. Such justification may be supported by documents derived from the following processes:
• International consensus process
• Independent external review
• Multi stakeholder process
for example:
• previous, detailed studies of similar systems
• existing Ecolabel type I criteria for similar products
• criteria employed in EMAS for the product of concern
• Life cycle based macro level monitoring indicators on resources, products and wastes for the EU-27
Product Environmental Footprint – General Guide; DRAFT ONLY FOR THE USE IN CASE STUDIES – DO NOT USE FOR ANY OTHER PURPOSE, OR CITE OR DISTRIBUTE
23
• Product Categories Rule from other initiatives/ schemes
• Environmental Impact of Products (EIPRO) and Environmental Improvement of Products (IMPRO) studies
• normalization of Product Environmental Footprint results (see section 5.2.1), optionally including weighting (see section 5.2.2)
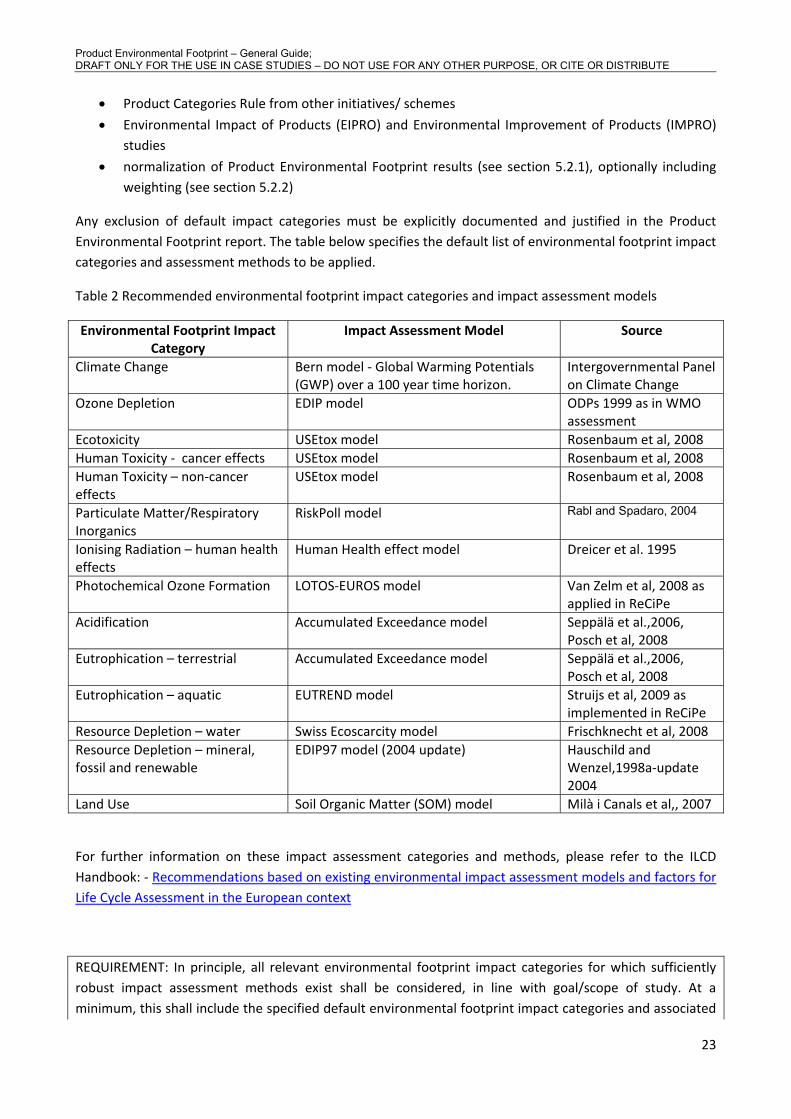
Any exclusion of default impact categories must be explicitly documented and justified in the Product Environmental Footprint report. The table below specifies the default list of environmental footprint impact categories and assessment methods to be applied.
Table 2 Recommended environmental footprint impact categories and impact assessment models
Environmental Footprint Impact Category
Impact Assessment Model Source
Climate Change Bern model - Global Warming Potentials (GWP) over a 100 year time horizon.
Intergovernmental Panel on Climate Change
Ozone Depletion EDIP model ODPs 1999 as in WMO assessment
Ecotoxicity USEtox model Rosenbaum et al, 2008 Human Toxicity - cancer effects USEtox model Rosenbaum et al, 2008 Human Toxicity – non-cancer effects
USEtox model Rosenbaum et al, 2008
Particulate Matter/Respiratory Inorganics
RiskPoll model Rabl and Spadaro, 2004
Ionising Radiation – human health effects
Human Health effect model Dreicer et al. 1995
Photochemical Ozone Formation LOTOS-EUROS model Van Zelm et al, 2008 as applied in ReCiPe
Acidification Accumulated Exceedance model Seppälä et al.,2006, Posch et al, 2008
Eutrophication – terrestrial Accumulated Exceedance model Seppälä et al.,2006, Posch et al, 2008
Eutrophication – aquatic EUTREND model Struijs et al, 2009 as implemented in ReCiPe
Resource Depletion – water Swiss Ecoscarcity model Frischknecht et al, 2008 Resource Depletion – mineral, fossil and renewable
EDIP97 model (2004 update) Hauschild and Wenzel,1998a-update 2004
Land Use Soil Organic Matter (SOM) model Milà i Canals et al,, 2007
For further information on these impact assessment categories and methods, please refer to the ILCD Handbook: - Recommendations based on existing environmental impact assessment models and factors for Life Cycle Assessment in the European context
REQUIREMENT: In principle, all relevant environmental footprint impact categories for which sufficiently robust impact assessment methods exist shall be considered, in line with goal/scope of study. At a minimum, this shall include the specified default environmental footprint impact categories and associated
Product Environmental Footprint – General Guide; DRAFT ONLY FOR THE USE IN CASE STUDIES – DO NOT USE FOR ANY OTHER PURPOSE, OR CITE OR DISTRIBUTE
24
impact assessment methods (see Table 2). Only midpoint impact categories will be calculated. If a Product Footprint Category Rule is developed, the relevant impact categories shall be defined therein. Additional relevant environmental indicators shall be included as appropriate, with all supporting methods clearly documented. Any exclusions shall be explicitly justified and their influence on the final results discussed.
REQUIREMENT: Exclusion of any of the default impact categories shall be sufficiently justified. Such justification shall be supported by documents derived from:,
• International consensus process
• Independent external review
• Multi-stakeholder process
Fig 3: Sources of information for selection of relevant environmental footprint impact categories
Example: Selection of relevant environmental footprint impact categories for T-shirt study

Product Environmental Footprint – General Guide; DRAFT ONLY FOR THE USE IN CASE STUDIES – DO NOT USE FOR ANY OTHER PURPOSE, OR CITE OR DISTRIBUTE
25

Product Environmental Footprint – General Guide; DRAFT ONLY FOR THE USE IN CASE STUDIES – DO NOT USE FOR ANY OTHER PURPOSE, OR CITE OR DISTRIBUTE
26
4. Compiling and Recording the Resource Use and Emissions Profile
4.1 General An inventory (profile) of all relevant material/energy resource inputs/outputs and emissions shall be compiled as a basis for modeling the product system.
Ideally, the model of the life cycle of the product of interest would be constructed using producer or operator specific data (i.e. modeling the exact life cycle depicting the supply-chain, use, and end-of-life phases). In practice, and as a general rule, for foreground processes (refers to those stages of the product life cycle for which direct information access is available), directly collected, specific inventory data should be used. These data are typically compiled as site specific data from the product/technology developer, goods producer, or service operator and should include, where possible, data collected from suppliers (incl. waste service suppliers). For background processes generic data will typically be used. Generic data is data sourced from third-party life cycle inventory databases, government or industry association reports, statistical databases, peer-reviewed literature, or other sources. All such data shall satisfy the quality requirements specified in the Product Environmental Footprint guidance document.
Documenting the data collection process is useful for improving the data quality over time, preparing for assurance, and revising future product inventories to reflect changes in the product’s life cycle. To ensure that all of the relevant information is documented, it may be helpful to establish a data management plan early in the inventory process (see Annex IV).
4.2 Sources of Resource Use and Emissions Profile Data Raw Material Acquisition and Pre-processing (Cradle-to-Facility Gate) The raw material acquisition and pre-processing stage starts when resources are extracted from nature and ends when the product components enter the gate of the studied product’s production facility. Processes that may occur in this stage include e.g.:
• Mining and extraction of resources • Pre-processing of all material inputs to the studied product, such as:
o Forming metals into ingots o Cleaning coal
• Conversion of recycled material • Photosynthesis for biogenic materials • Cultivation and harvesting of trees or crops • Transportation within and between extraction and pre-processing facilities, and to the production
facility Capital goods (if relevant) Examples of capital goods to be included in Product Environmental Footprint studies include:
• Machinery used in production processes • Buildings • Office equipment • Transport vehicles • Transportation infrastructure
Production

Product Environmental Footprint – General Guide; DRAFT ONLY FOR THE USE IN CASE STUDIES – DO NOT USE FOR ANY OTHER PURPOSE, OR CITE OR DISTRIBUTE
27
The production stage begins when the product components enter the production site for the studied product and ends when the finished product of interest leaves the production facility gate. Examples of production-related activities include:
• Chemical processing • Manufacturing • Transport of semi-finished products between manufacturing processes • Assembly of material components • Packaging • Treatment of waste • employee commuting (if material/relevant) • business travel (if material/relevant)
Product Distribution and Storage Products must be distributed to users and may be stored at various points along the supply chain. Examples of processes related to distribution and storage that should be included in the Product Environmental Footprint study include:
• Energy inputs for warehouse lighting and heating • Use of refrigerants in warehouses and transport vehicles • Fuel use in vehicles
Use The use stage begins when the consumer or end user takes possession of the product and ends when the used product is discarded for transport to a recycling or waste treatment facility. Examples of use phase processes to be included in the Product Environmental Footprint study include:
• Transportation to the location of use • Refrigeration at the location of use • Preparation for use (e.g., microwaving) • Resource consumption during the use stage (for example, detergent, energy and water for washing
machine use) • Repair and maintenance of the product during the use phase
The determination of the use profile (i.e. the related scenarios and assumed service life for the use stage of products) shall be based on published technical information using the following techniques.
• Product Footprint Category Rules (PFCR) (see chapter 9)
• Published international standards that specify guidance and requirements for development of scenarios and service life for the use stage for the product being assessed
• Published national guidelines that specify guidance for development of scenarios and service life for the use stage for the product being assessed
• Published industry guidelines that specify guidance for development of scenarios and service life for the use stage for the product being assessed
• Market surveys or other market data
All relevant assumptions for the use stage shall be documented. Where no method for determining the use stage of products has been established in accordance with the previously specified techniques, the approach taken in determining the use stage of products shall be

Product Environmental Footprint – General Guide; DRAFT ONLY FOR THE USE IN CASE STUDIES – DO NOT USE FOR ANY OTHER PURPOSE, OR CITE OR DISTRIBUTE
28
established by the organization carrying out the study. Documentation of methods and assumptions shall be provided. NOTE: The manufacturer’s recommended method to be applied in the use phase (e.g. cooking in an oven at a specified temperature for a specified time) might provide a basis for determining the use stage of a product. The actual usage pattern may, however, differ from those recommended and should be used if known. End-of-Life The end-of-life stage begins when the used product is discarded by the user and ends when the product is returned to nature as a waste or enters another product’s life cycle (i.e. as a recycled input). Examples of end-of-life processes to include in the Product Environmental Footprint study are:
• Collection and transport of end-of-life products and packages • Dismantling of components from end-of-life products • Shredding and sorting • Incineration and disposal of bottom ash • Landfilling and landfill operation and maintenance • Conversion into recycled material • Composting or other organic waste treatment methods
Accounting for Electricity UseFor electricity consumed during the production phase, country-specific consumption mix data shall be used. For electricity consumed during the use phase, the energy mix shall reflect ratios of sales between countries. Where such data is not available, the average EU consumption mix shall be used (ELCD Database). Accounting for Renewable Electricity Generation Some product systems may produce electricity from renewable sources in excess of the amount consumed. If excess renewable energy from the product system is sold, it may only be credited to the product system if the credit has not been taken in other product related schemes. Documentation is required to explain whether or not the credit is considered in the calculation. Accounting for temporary carbon storage and delayed emissions
Credits associated with temporary storage, delayed emissions, and substitution shall not be considered in the Product Environmental Footprint calculation. For more information, please see in the International Reference Life Cycle Data System Handbook: General Guide chapter 7.4.3.7.3.
Additional considerations for documenting greenhouse gas emissions and removals
Fossil and biogenic emissions: removals and emissions shall be reported separately for both fossil and biogenic sources.
Land Use Change (impact for climate change): greenhouse gas emissions from land use change shall be allocated to products for 20 years after the land use change occurs using the IPCC default values table. For details, see Annex I.
Indirect Land Use Change: shall not be included for the time being, as no accepted methodology is currently available.
Product Environmental Footprint – General Guide; DRAFT ONLY FOR THE USE IN CASE STUDIES – DO NOT USE FOR ANY OTHER PURPOSE, OR CITE OR DISTRIBUTE
29
REQUIREMENT: All relevant resource use and emissions associated with the life cycle stages included in the defined system boundaries shall be included in the Resource Use and Emissions Profile.
REQUIREMENT: Credits associated with temporary storage, delayed emissions, and substitution shall not be considered in the Product Environmental Footprint calculation. For more information, please see the International Reference Life Cycle Data System Handbook: General Guide chapter 7.4.3.7.3.
4.3 Nomenclature For a detailed treatment of nomenclature rules and supporting examples, see Annex III.
TIP: Check the documented nomenclature and properties for a given flow in the Resource Use and Emissions Profile against the ILCD nomenclature and properties (Annex III Ensure correspondence with the ILCD nomenclature rules and properties.
If nomenclature and properties for a given flow are not available in the ILCD, the practitioner must create an appropriate nomenclature and document the flow properties.
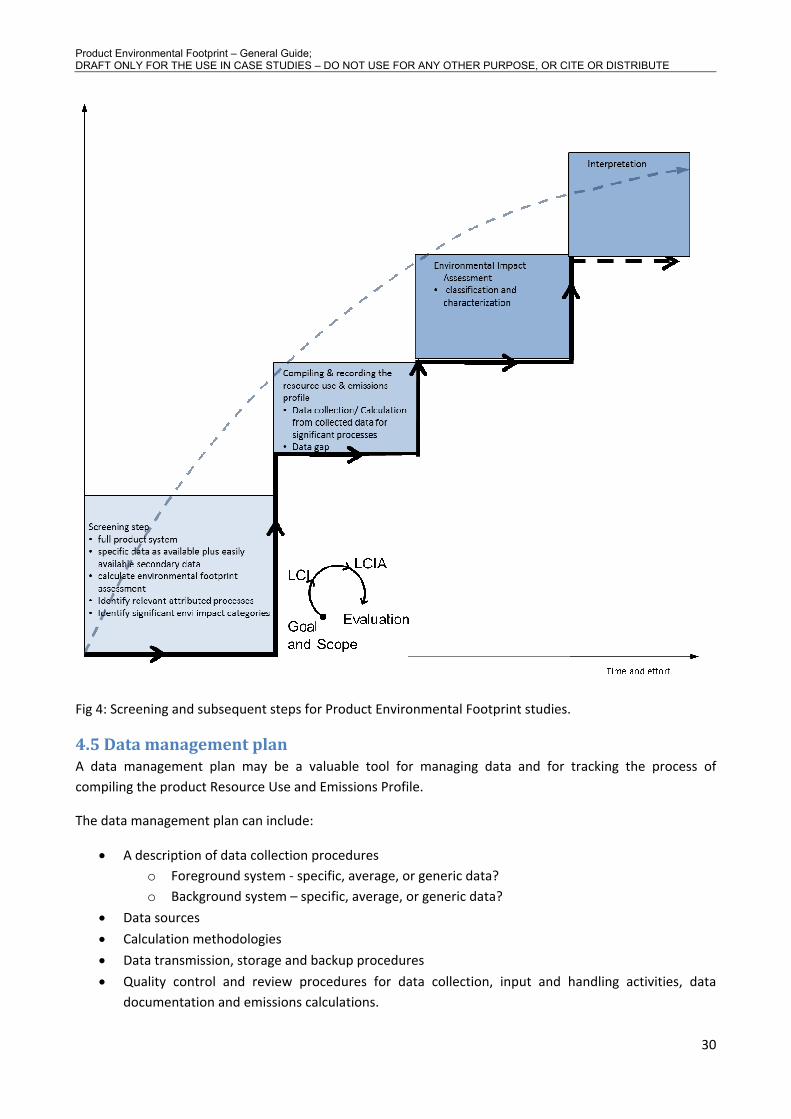
4.4 Identifying relevant processes within the product system boundary An initial “screening-level” Resource Use and Emissions Profile may be constructed using generic data, and environmental footprint impact assessment methods applied, in order to identify the most relevant processes within the product system boundary. In turn, this screening study can help focus data collection activities and data quality priorities for the actual Resource Use and Emissions Profile.
REQUIREMENT: The organization shall use a screening step to identify relevant processes. At least “basic quality” data shall be used to identify relevant processes.
Product Environmental Footprint – General Guide; DRAFT ONLY FOR THE USE IN CASE STUDIES – DO NOT USE FOR ANY OTHER PURPOSE, OR CITE OR DISTRIBUTE
30
Fig 4: Screening and subsequent steps for Product Environmental Footprint studies.
4.5 Data management plan A data management plan may be a valuable tool for managing data and for tracking the process of compiling the product Resource Use and Emissions Profile.
The data management plan can include:
• A description of data collection procedures o Foreground system - specific, average, or generic data? o Background system – specific, average, or generic data?
• Data sources
• Calculation methodologies
• Data transmission, storage and backup procedures
• Quality control and review procedures for data collection, input and handling activities, data documentation and emissions calculations.

Product Environmental Footprint – General Guide; DRAFT ONLY FOR THE USE IN CASE STUDIES – DO NOT USE FOR ANY OTHER PURPOSE, OR CITE OR DISTRIBUTE
31
For additional guidance on possible approaches to formulating a data management plan, see Annex IV.
4.6 Data quality requirements Data quality indicators address how well the data fits the given process in the product inventory. When identifying collected (primary or secondary) data for use in a Product Environmental Footprint study, data quality indicators shall be applied. Five data quality criteria are adopted for Product Environmental Footprint studies.
Table 3: Data quality compliance criteria
Data quality • Technological representativeness • Geographical representativeness • Time-related representativeness • Completeness; • Precision/uncertainty; • Methodological Appropriateness and Consistency • Semi-quantitative assessment of data quality
Method • Completion of Resource Use and Emissions Profile according to this general guide
Documentation • Compliance with ILCD format
Nomenclature • Compliance with ILCD nomenclature document (e.g. use of ILCD reference elementary flows for IT compatible inventories)
Review • Review by "Qualified reviewer” (see chapter 8): • knowledge of relevant sector • knowledge of represented process or product • LCA methods expertise and experience
• separate review report
Semi-quantitative assessment of data quality
The following tables and corresponding equation describe the criteria to be used for a semi-quantitative assessment of data quality.
Table 4 Criteria for semi-quantitative assessment of data quality.
Quality level
Quality rating
Definition (to be judged with respect to the data set's contribution to each environmental impact category and in comparison to a hypothetical ideal data quality)
Completeness Precision / uncertainty (relative standard deviation in %)
Very good 1 Meets the criterion to a very high degree, without need for improvement.
≥ 95 % ≤ 7 %
Product Environmental Footprint – General Guide; DRAFT ONLY FOR THE USE IN CASE STUDIES – DO NOT USE FOR ANY OTHER PURPOSE, OR CITE OR DISTRIBUTE
32
Good 2 Meets the criterion to a high degree, with little significant need for improvement.
[85 % to 95 %) (7 % to 10 %]
Fair 3 Meets the criterion to an acceptable degree, but merits improvement.
[75 % to 85 %) (10 % to 15 %]
Poor 4 Does not meet the criterion to a sufficient degree, but rather requires improvement.
[50 % to 75 %) (15 % to 25 %]
Very poor 5 Does not meet the criterion. Substantial improvement is necessary.
< 50 % > 25 %
Additional options, not being quality levels:
Not evaluated / unknown
5 This criterion was not judged / reviewed or its quality could not be verified / is unknown.
Na Na
Not applicable
0 This criterion is not applicable to this data set, e.g. its geographical representativeness cannot be evaluated as it is a location-unspecific technology unit process.
Na Na
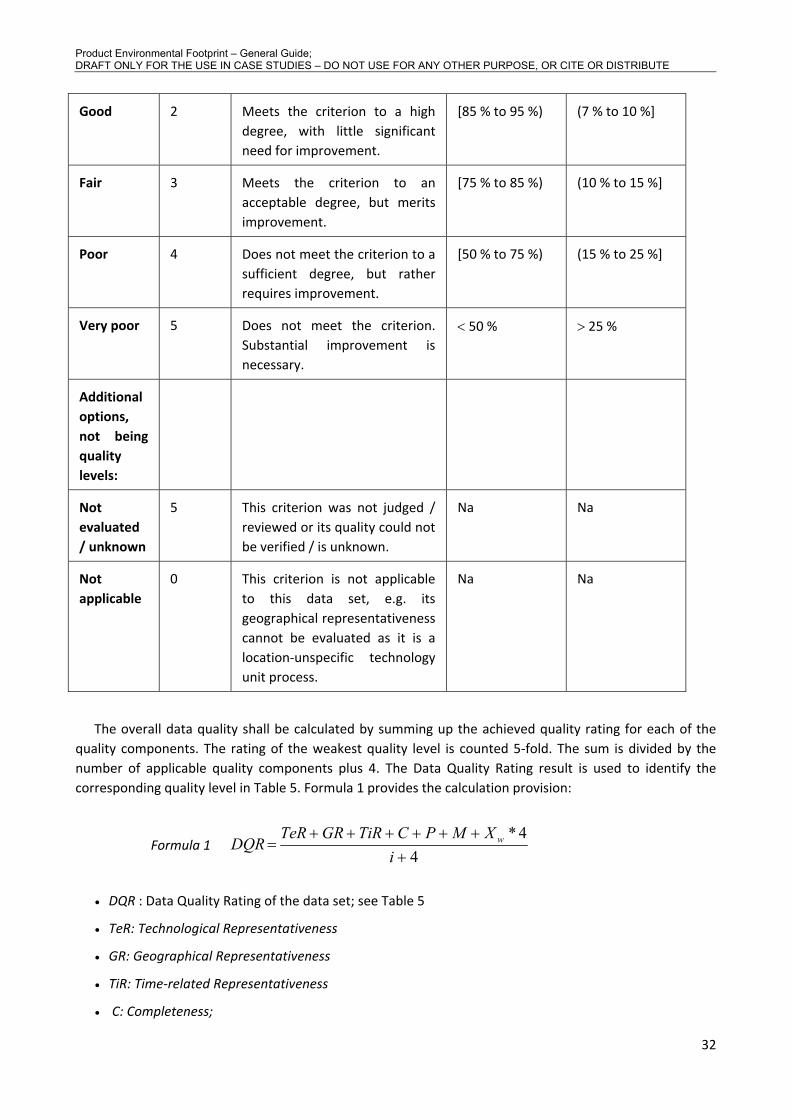
The overall data quality shall be calculated by summing up the achieved quality rating for each of the quality components. The rating of the weakest quality level is counted 5-fold. The sum is divided by the number of applicable quality components plus 4. The Data Quality Rating result is used to identify the corresponding quality level in Table 5. Formula 1 provides the calculation provision:
Formula 1 4
4*+
++++++=
iXMPCTiRGRTeR
DQR w
• DQR : Data Quality Rating of the data set; see Table 5
• TeR: Technological Representativeness
• GR: Geographical Representativeness
• TiR: Time-related Representativeness
• C: Completeness;

Product Environmental Footprint – General Guide; DRAFT ONLY FOR THE USE IN CASE STUDIES – DO NOT USE FOR ANY OTHER PURPOSE, OR CITE OR DISTRIBUTE
33
• P: Precision/uncertainty;
• M: Methodological Appropriateness and Consistency
• Xw : weakest quality level obtained (i.e. highest numeric value) among the data quality indicators
• i : number of applicable (i.e. not equal "0") data quality indicators
Table 5 shall be used to identify the overall data quality level according to the achieved data quality rating.
Table 5: overall data quality level according to the achieved data quality rating
Overall data quality rating (DQR) Overall data quality level
≤ 1.62 “Excellent quality”
>1.6 to≤ 2.0 "Very good quality"
>2.0 to ≤3.0 “Good quality”
>3 to ≤4.0 "Fair quality"
>4 “Poor quality”
REQUIREMENT: Both collected (primary) and generic (secondary) data shall satisfy the data quality compliance criteria. A semi-quantitative assessment of data quality shall be performed and reported. At least “good quality” data shall be used to model foreground and significant background processes.
2 This means that not all data in the set must achieve a ranking of "very good quality" for the data set to achieve an overall “very good quality” rating. Rather, two may be ranked as "good". If more than two are ranked as “good”, the data set is downgraded to the next quality class.

Product Environmental Footprint – General Guide; DRAFT ONLY FOR THE USE IN CASE STUDIES – DO NOT USE FOR ANY OTHER PURPOSE, OR CITE OR DISTRIBUTE
34
Example
4.7 Data Collection Specific data (including average data representing multiple sites whether internally or provided by a supplier) must be obtained for all significant/relevant foreground processes and for significant background processes where possible. The data should include all relevant inputs and outputs for the processes. Inputs are (for example) use of energy, water, materials, etc. Outputs are the products, co-products, and emissions. Emissions can be divided into four categories: emissions to air, to water, to soil, and emissions as solid waste. Specific data can be collected, measured or calculated.
Data collection - measurements and tailored questionnaires
The most representative sources of data for specific processes are measurements directly performed on the process, or obtained from operators via interviews or questionnaires. The data may need scaling, aggregation or other forms of mathematical treatment to bring them in relation to the process' functional unit and reference flow.
Typical specific data sources are:
• Process or plant level consumption data
• Bills and stock/inventory-changes of consumables
• Emission measurements (concentrations plus corresponding off-gas and wastewater amounts)
• Composition of waste and products
• Procurement and sale department(s)/unit(s)
Product Environmental Footprint – General Guide; DRAFT ONLY FOR THE USE IN CASE STUDIES – DO NOT USE FOR ANY OTHER PURPOSE, OR CITE OR DISTRIBUTE
35
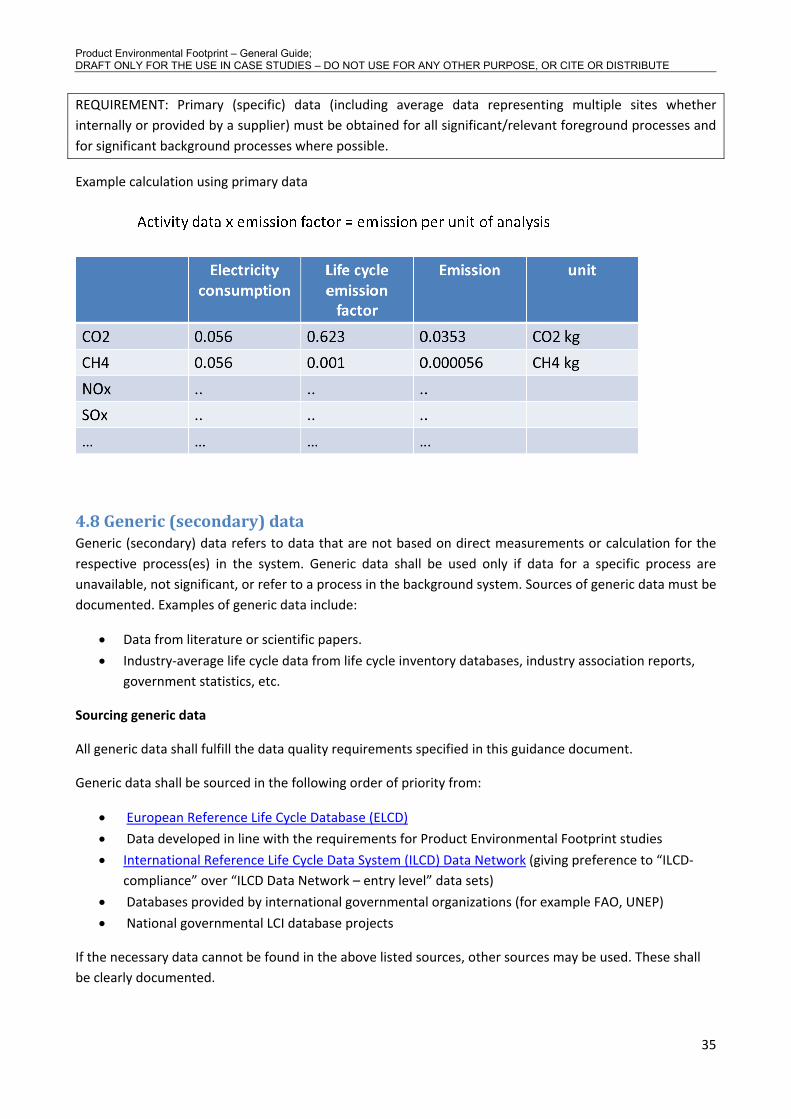
REQUIREMENT: Primary (specific) data (including average data representing multiple sites whether internally or provided by a supplier) must be obtained for all significant/relevant foreground processes and for significant background processes where possible.
Example calculation using primary data
4.8 Generic (secondary) data Generic (secondary) data refers to data that are not based on direct measurements or calculation for the respective process(es) in the system. Generic data shall be used only if data for a specific process are unavailable, not significant, or refer to a process in the background system. Sources of generic data must be documented. Examples of generic data include:
• Data from literature or scientific papers.
• Industry-average life cycle data from life cycle inventory databases, industry association reports, government statistics, etc.
Sourcing generic data
All generic data shall fulfill the data quality requirements specified in this guidance document.
Generic data shall be sourced in the following order of priority from:
• European Reference Life Cycle Database (ELCD)
• Data developed in line with the requirements for Product Environmental Footprint studies
• International Reference Life Cycle Data System (ILCD) Data Network (giving preference to “ILCD-compliance” over “ILCD Data Network – entry level” data sets)
• Databases provided by international governmental organizations (for example FAO, UNEP)
• National governmental LCI database projects
If the necessary data cannot be found in the above listed sources, other sources may be used. These shall be clearly documented.

Product Environmental Footprint – General Guide; DRAFT ONLY FOR THE USE IN CASE STUDIES – DO NOT USE FOR ANY OTHER PURPOSE, OR CITE OR DISTRIBUTE
36
REQUIREMENT: Generic data shall be used only if data for a specific process are unavailable, not significant, or refer to a process in the background system. Generic data shall be preferentially sourced from the identified priority data sources.
Example: Source of generic data: ELCD and ILCD Data network, for following data sets. European Reference Life Cycle Database (ELCD) Germany electric grid mix Ethylene production Natural gas production Distillation Desalting Hydro treating Methanol production Acetic acid production International Reference Life Cycle Data System (ILCD) Data network Detergent production Database AA Dye production Database CC Other data sets for Petro chemical industry US Chemical Association
4.9 Dealing with remaining unit process data gaps / missing data
General Data gaps exist when there is no available primary or secondary data that is sufficiently representative of the given process in the product’s life cycle. For most processes where data may be missing it should be possible to obtain sufficient information to provide a reasonable estimate of the missing data. Therefore, there should be few, if any, data gaps in the final Resource Use and Emissions Profile. Missing information can be of different types and have different characteristics, each requiring separate approaches to resolve.
Data gaps may exist when:
• Data does not exist for a specific input/product, or
• Data exists for a similar process but: o The data has been generated in a different region o The data has been generated using a different technology o The data has been generated in a different time period
How to deal with remaining missing inventory data / information The organization identifies significant/insignificant processes during the initial screening step. If processes are determined to be insignificant based on the screening step (i.e. relative to the established cut-off criteria) and data are unavailable for the process, then the process may be excluded from the inventory results. Documentation of missing data is required.
If processes in the foreground system are determined to be relevant based on the screening step and data is unavailable for the processes, the data gaps in specific data shall be filled using, in order of preference:
• generic data, subject to the quality provisions for generic data provided in this document
Product Environmental Footprint – General Guide; DRAFT ONLY FOR THE USE IN CASE STUDIES – DO NOT USE FOR ANY OTHER PURPOSE, OR CITE OR DISTRIBUTE
37
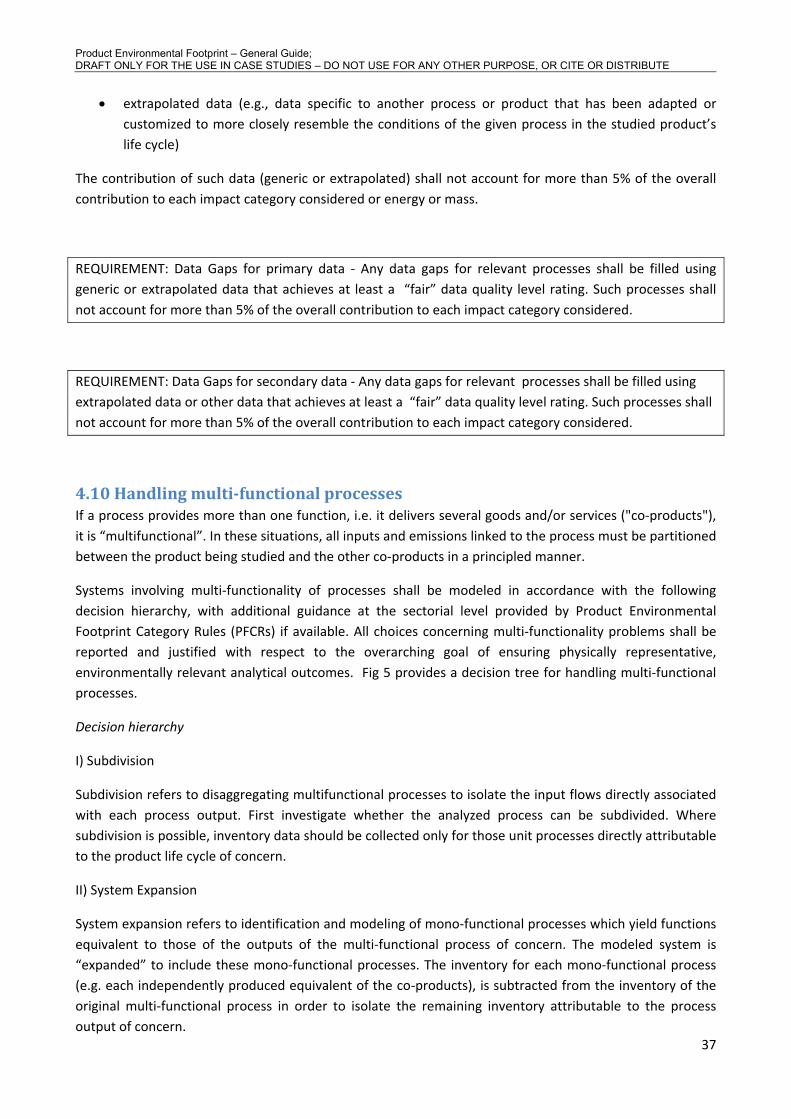
• extrapolated data (e.g., data specific to another process or product that has been adapted or customized to more closely resemble the conditions of the given process in the studied product’s life cycle)
The contribution of such data (generic or extrapolated) shall not account for more than 5% of the overall contribution to each impact category considered or energy or mass.
REQUIREMENT: Data Gaps for primary data - Any data gaps for relevant processes shall be filled using generic or extrapolated data that achieves at least a “fair” data quality level rating. Such processes shall not account for more than 5% of the overall contribution to each impact category considered.
REQUIREMENT: Data Gaps for secondary data - Any data gaps for relevant processes shall be filled using extrapolated data or other data that achieves at least a “fair” data quality level rating. Such processes shall not account for more than 5% of the overall contribution to each impact category considered.
4.10 Handling multi-functional processes If a process provides more than one function, i.e. it delivers several goods and/or services ("co-products"), it is “multifunctional”. In these situations, all inputs and emissions linked to the process must be partitioned between the product being studied and the other co-products in a principled manner.
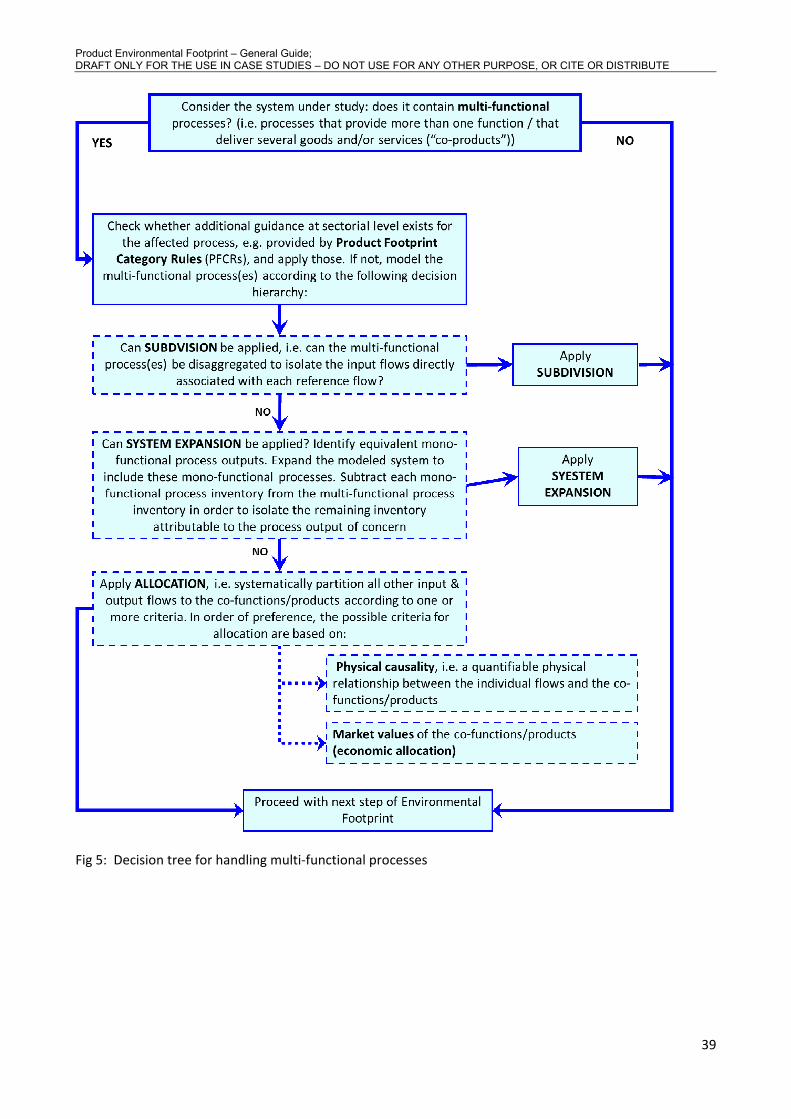
Systems involving multi-functionality of processes shall be modeled in accordance with the following decision hierarchy, with additional guidance at the sectorial level provided by Product Environmental Footprint Category Rules (PFCRs) if available. All choices concerning multi-functionality problems shall be reported and justified with respect to the overarching goal of ensuring physically representative, environmentally relevant analytical outcomes. Fig 5 provides a decision tree for handling multi-functional processes.
Decision hierarchy
I) Subdivision
Subdivision refers to disaggregating multifunctional processes to isolate the input flows directly associated with each process output. First investigate whether the analyzed process can be subdivided. Where subdivision is possible, inventory data should be collected only for those unit processes directly attributable to the product life cycle of concern.
II) System Expansion
System expansion refers to identification and modeling of mono-functional processes which yield functions equivalent to those of the outputs of the multi-functional process of concern. The modeled system is “expanded” to include these mono-functional processes. The inventory for each mono-functional process (e.g. each independently produced equivalent of the co-products), is subtracted from the inventory of the original multi-functional process in order to isolate the remaining inventory attributable to the process output of concern.

Product Environmental Footprint – General Guide; DRAFT ONLY FOR THE USE IN CASE STUDIES – DO NOT USE FOR ANY OTHER PURPOSE, OR CITE OR DISTRIBUTE
38
III) Allocation
Allocation refers to partitioning the input and output flows of a multi-functional process according to an appropriate, predetermined criterion. In order of preference, the possible criteria for allocation in Product Environmental Footprint studies are:
III.a) Allocation Based on a Relevant Physical Relationship
Allocation based on a relevant physical relationship refers to allocating the input and outflows of a multi-functional process in accordance with a relevant, quantifiable physical relationship between the process inputs and co-product outputs (for example, a physical property of the inputs and outputs that is relevant to the function provided by the co-product of interest).
III.b) Economic Allocation
Economic allocation refers to allocating inputs and outputs associated with multi-functional processes to the co-product outputs in proportion to their relative market value. The market price of the co-functions should refer to the specific condition and point at which the co-products are produced. Allocation based on economic value shall only be applied when (I, II and III.a) are not possible or in cases where economic allocation provides the more accurate representation of physical relationships and associated environmental burdens. In any case, a clear justification must be provided, with reference to ensuring the physical representativeness of the Product Environmental Footprint results.
The decision hierarchy also applies for product recycling (EoL). In cases of system expansion, the equation described in Annex II shall be applied.
REQUIREMENT: The Product Environmental Footprint multi-functionality decision hierarchy shall be applied for resolving all multi-functionality problems. All choices made in this context shall be reported and justified with respect to the overarching goal of ensuring physically representative, environmentally relevant results. For system expansion in recycling situations the equation described in Annex II shall be applied.
Product Environmental Footprint – General Guide; DRAFT ONLY FOR THE USE IN CASE STUDIES – DO NOT USE FOR ANY OTHER PURPOSE, OR CITE OR DISTRIBUTE
39
Fig 5: Decision tree for handling multi-functional processes
Product Environmental Footprint – General Guide; DRAFT ONLY FOR THE USE IN CASE STUDIES – DO NOT USE FOR ANY OTHER PURPOSE, OR CITE OR DISTRIBUTE
40
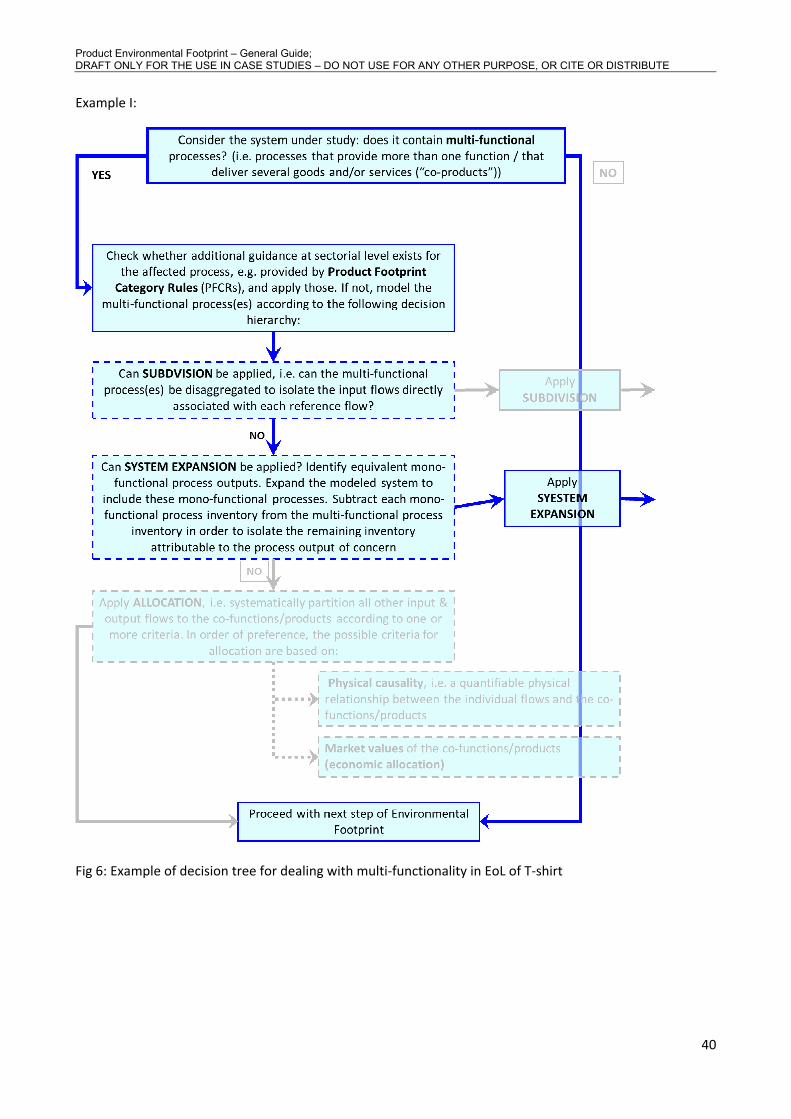
Example I:
Fig 6: Example of decision tree for dealing with multi-functionality in EoL of T-shirt

Product Environmental Footprint – General Guide; DRAFT ONLY FOR THE USE IN CASE STUDIES – DO NOT USE FOR ANY OTHER PURPOSE, OR CITE OR DISTRIBUTE
41
Example II:
Fig 7: Example of decision for dealing with multi-functionality in a refinery
4.11 Data collection template A data collection template is useful for organizing data collection activities and results while compiling the Resource Use and Emissions Profile. A data collection template may include the following aspects:
• Introduction to the Product Environmental Footprint study, including an overview of the objectives of data collection and the template/questionnaire employed

Product Environmental Footprint – General Guide; DRAFT ONLY FOR THE USE IN CASE STUDIES – DO NOT USE FOR ANY OTHER PURPOSE, OR CITE OR DISTRIBUTE
42
• Information on the entity(ies) or person(s) responsible for measurement and data collection procedures
• Description of the site where data is to be collected (for example, maximum and normal operation capacity, annual productive output, location, number of employees, etc.)
• Date/year of data collection
• Description of the product (and functional unit)
• Product system description
• Overall technical flow diagram
• Individual process diagram
• Input and output per reference flow per unit
Example: Data collection template
Technical overview
Fig 8: Process overview diagram for the production stage at a T-shirt company
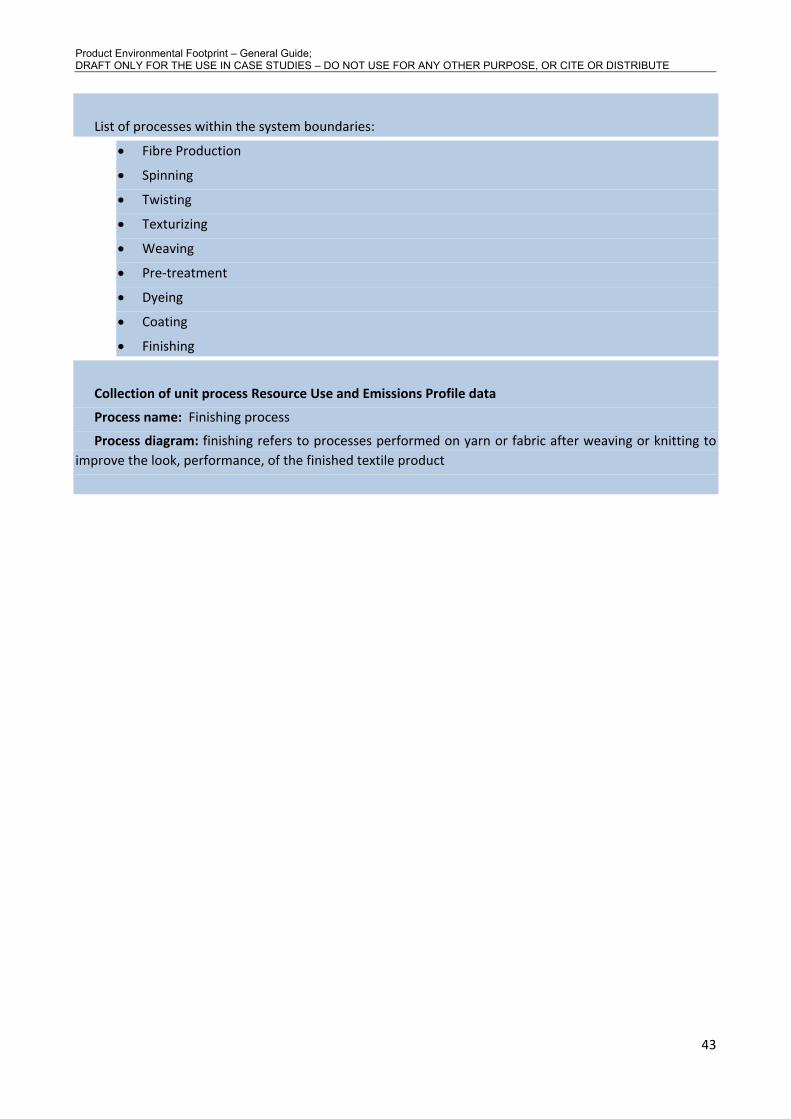
Product Environmental Footprint – General Guide; DRAFT ONLY FOR THE USE IN CASE STUDIES – DO NOT USE FOR ANY OTHER PURPOSE, OR CITE OR DISTRIBUTE
43
List of processes within the system boundaries:
• Fibre Production
• Spinning
• Twisting
• Texturizing
• Weaving
• Pre-treatment
• Dyeing
• Coating
• Finishing
Collection of unit process Resource Use and Emissions Profile data
Process name: Finishing process
Process diagram: finishing refers to processes performed on yarn or fabric after weaving or knitting to improve the look, performance, of the finished textile product

Product Environmental Footprint – General Guide; DRAFT ONLY FOR THE USE IN CASE STUDIES – DO NOT USE FOR ANY OTHER PURPOSE, OR CITE OR DISTRIBUTE
44
Fig 9: Technical process diagram- finishing process
Input
Code Name Amount Unit
Output (Per reference flow)
Code Name Amount Unit

Product Environmental Footprint – General Guide; DRAFT ONLY FOR THE USE IN CASE STUDIES – DO NOT USE FOR ANY OTHER PURPOSE, OR CITE OR DISTRIBUTE
45
Example of Resource Use and Emissions Profile data inventory (selected substances)
Parameter Unit/kg
Energy consumption MJ 115.5
Electricity MJ 34.6
Fossil Fuel MJ 76
Others MJ 4.9
Non-renewable resources Kg 2.7
Natural gas Kg 0.59
Natural gas, feedstock Kg 0.16
Crude oil Kg 0.57
Crude oil, feedstock Kg 0.48
Coal Kg 0.66
Coal, feedstock Kg 0.21
LPG Kg 0.02
Hydro power (MJel) MJ 5.2
Water Kg 12400
Emissions to air
CO2 g 5,132
CH4 g 8.2
SO2 g 3.9
Nox g 26.8
CH g 25.8
CO g 28
Emission to water
COD Mn g 13.3
BOD g 5.7
Tot-P g 0.052
Tot-N g 0.002

Product Environmental Footprint – General Guide; DRAFT ONLY FOR THE USE IN CASE STUDIES – DO NOT USE FOR ANY OTHER PURPOSE, OR CITE OR DISTRIBUTE
46
5. Environmental Footprint Impact Assessment Once the Resource Use and Emissions Profile has been compiled, the environmental footprint impact assessment phase is undertaken to calculate the environmental performance of the product being assessed, with respect to the key identified areas of concern. Environmental footprint impact assessment includes two mandatory and two optional steps.
5.1 Mandatory Steps: Classification and Characterization Environmental footprint impact assessment involves two mandatory steps:
1. The first step, which is called “classification,” requires assigning each data point that has been compiled in the Resource Use and Emissions Profile to the relevant environmental footprint impact categories (chosen during the goal and scope definition phases).
2. The second step, which is called “characterization,” requires applying characterization factors that represent the impact intensity of the substances associated with each data point in terms of common reference units for each environmental footprint impact category. This allows aggregation of impacts within categories.
5.1.1 Classification of Environmental Footprint Data Classification requires assigning the material/energy inputs and outputs tabulated in the Resource Use and Emissions Profile to the appropriate environmental footprint impact. For example, during the classification phase, all inputs/outputs that result in greenhouse gas emissions are assigned to the Climate Change category, whereas as those that result in emissions of ozone depleting substances are classified accordingly. In some cases, an input/output may contribute to more than one environmental footprint impact category (for example, chlorofluorocarbons (CFCs) contribute to both Climate Change and Ozone Depletion).
In principle, as part of the classification of the Resource Use and Emissions profile, data should be expressed in terms of constituent substances for which characterization factors (see 5.1.2) are available. For example, data for a composite NPK fertilizer should be disaggregated and classified according to its N, P, and K fractions, since each constituent element will contribute to different environmental footprint impact categories. In practice, much of the inventory data used to model the product supply chain of interest may be drawn from existing public or commercial life cycle inventory databases, where classification has already been implemented. In such cases, it must be assured that the classification and linked environmental footprint impact assessment pathways correspond to the requirements specified in this guidance document.
REQUIREMENT: All inputs/outputs tabulated during the compilation of the Resource Use and Emissions Profile shall be assigned to the environmental footprint impact categories to which they contribute (“classification”).
Example: Classification of data in the climate change impact category for a T-shirt study
CO2 g Yes
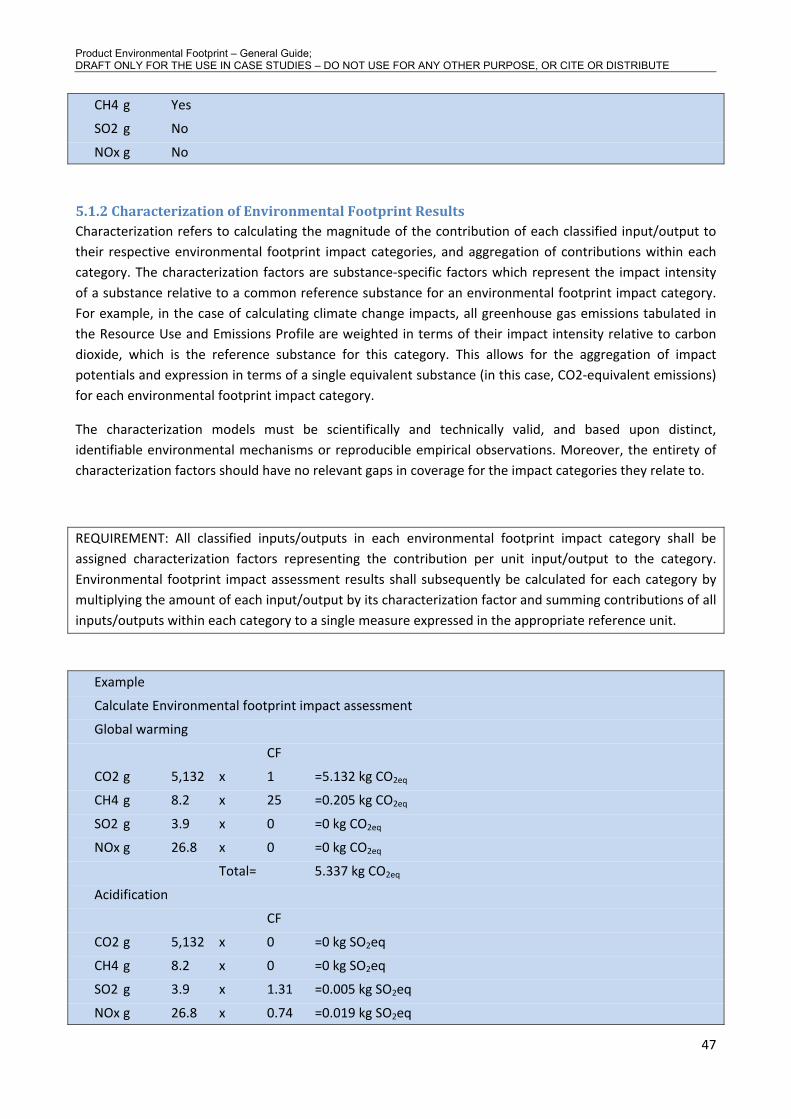
Product Environmental Footprint – General Guide; DRAFT ONLY FOR THE USE IN CASE STUDIES – DO NOT USE FOR ANY OTHER PURPOSE, OR CITE OR DISTRIBUTE
47
CH4 g Yes
SO2 g No
NOx g No
5.1.2 Characterization of Environmental Footprint Results Characterization refers to calculating the magnitude of the contribution of each classified input/output to their respective environmental footprint impact categories, and aggregation of contributions within each category. The characterization factors are substance-specific factors which represent the impact intensity of a substance relative to a common reference substance for an environmental footprint impact category. For example, in the case of calculating climate change impacts, all greenhouse gas emissions tabulated in the Resource Use and Emissions Profile are weighted in terms of their impact intensity relative to carbon dioxide, which is the reference substance for this category. This allows for the aggregation of impact potentials and expression in terms of a single equivalent substance (in this case, CO2-equivalent emissions) for each environmental footprint impact category.
The characterization models must be scientifically and technically valid, and based upon distinct, identifiable environmental mechanisms or reproducible empirical observations. Moreover, the entirety of characterization factors should have no relevant gaps in coverage for the impact categories they relate to.
REQUIREMENT: All classified inputs/outputs in each environmental footprint impact category shall be assigned characterization factors representing the contribution per unit input/output to the category. Environmental footprint impact assessment results shall subsequently be calculated for each category by multiplying the amount of each input/output by its characterization factor and summing contributions of all inputs/outputs within each category to a single measure expressed in the appropriate reference unit.
Example
Calculate Environmental footprint impact assessment
Global warming
CF
CO2 g 5,132 x 1 =5.132 kg CO2eq
CH4 g 8.2 x 25 =0.205 kg CO2eq
SO2 g 3.9 x 0 =0 kg CO2eq
NOx g 26.8 x 0 =0 kg CO2eq
Total= 5.337 kg CO2eq
Acidification
CF
CO2 g 5,132 x 0 =0 kg SO2eq
CH4 g 8.2 x 0 =0 kg SO2eq
SO2 g 3.9 x 1.31 =0.005 kg SO2eq
NOx g 26.8 x 0.74 =0.019 kg SO2eq

Product Environmental Footprint – General Guide; DRAFT ONLY FOR THE USE IN CASE STUDIES – DO NOT USE FOR ANY OTHER PURPOSE, OR CITE OR DISTRIBUTE
48
Total= 0.024kg SO2eq
Eutrophication
..
Eco Toxicity
…
5.2 Optional Steps: Normalization and Weighting Following the two mandatory steps of classification and characterisation, the environmental footprint impact assessment may be complemented with two optional steps (as appropriate to or required for the intended application): these are referred to as normalization and weighting.
5.2.1 Normalization of Environmental Footprint Impact Assessment Results Normalization is an optional step in which the environmental footprint impact assessment results are multiplied with normalization factors in order to calculate and compare the magnitude of their contributions to the environmental footprint impact categories of concern relative to a reference unit (typically a whole country or an average citizen). As a result, dimensionless, normalized environmental footprint results are obtained. This allows comparisons of the relevance of the contributions made by the product system to the environmental impact categories considered. Normalized environmental footprint results do not, however, indicate the severity/relevance of the respective impacts, nor can they be summed across impact categories.
REQUIREMENT: If normalization is applied, the normalized environmental footprint results shall be calculated using the provided normalization factors (see separate document).
5.2.2 Weighting of Environmental Footprint Impact Assessment Results Weighting is an additional, but not required step that may support the interpretation and communication of the results of the analysis. In this step, normalized environmental footprint results are multiplied by a set of weighting factors which reflect the perceived relative importance of the impact categories considered. Weighted environmental footprint results can then compared to assess their importance. They can also be summed across impact categories to obtain a single-value overall impact indicator. In contrast to the preceding, natural sciences-based phases (classification, characterisation and normalization), weighting requires value judgements as to the respective importance of the environmental impact categories considered. These judgments may be based on expert opionion, cultural/political view points, or economic considerations.
Application of normalization and weighting steps in Product Environmental Footprint studies must be consistent with the defined goals and scope of the study, including the intended applications. It should be noted that ISO 14040 and 14044 do not permit the use of weighting in support of comparative assertions3.
3 http://www.iso.org/iso/iso_catalogue/catalogue_tc/catalogue_tc_browse.htm?commid=54808
Product Environmental Footprint – General Guide; DRAFT ONLY FOR THE USE IN CASE STUDIES – DO NOT USE FOR ANY OTHER PURPOSE, OR CITE OR DISTRIBUTE
49
TIP: If weighting is applied, the environmental footprint results shall be multiplied by weighting factors which represent the perceived relevance of the impact categories considered. The basis for the weighting factors shall be explicitly justified and communicated. Results prior to weighting have to be communicated alongside weighted results.
6. Interpretation of Product Environmental Footprint results
6.1 General Interpretation of the results of the Product Environmental Footprint study serves two purposes:
• The first is to ensure that the way in which the environmental footprint model corresponds to the goals and quality requirements of the study. In this sense, interpretation may inform iterative improvements of the environmental footprint model until all goals and requirements are met;
• The second purpose is to derive robust conclusions and recommendations from the analysis, e.g. in support of environmental improvements.
To meet these objectives, the interpretation phase may be broken down into two key steps: “Identification of significant issues” and “Conclusions, limitations and recommendations”.
6.2 Identification of Significant Issues Identification of significant issues refers to:
• Identifying the methodological considerations and choices that may significantly influence the accuracy of the calculated Product Environmental Footprint results; and
• Identifying the main contributing elements to the calculated results in support of answering the study questions and assessing improvement potentials.
Identifying key methodological considerations requires assessing the extent to which methodological choices such as system boundaries, cut-off criteria, data sources, and allocation choices influence the analytical outcomes. It must be ensured that these correspond to the requirements specified in this guidance document, and that they are appropriate to the context.
Tools that should be used to assess the robustness of the Product Environmental Footprint model include:
• Completeness checks: assess the inventory data to ensure that it is complete relative to the defined goals, scope, system boundaries, cut-off criteria and quality criteria. This includes completeness of process coverage (i.e. all relevant processes at each supply chain stage considered have been included) and input/output coverage (i.e. all relevant material or energy inputs and emissions associated with each process have been included).
• Sensitivity checks: assess the extent to which the results are determined by specific methodological choices, and the impact of implementing alternative, defensible choices where these are identifiable. It is useful to structure sensitivity checks for each phase of the Product Environmental Footprint study, including goal and scope definition, the Resource Use and Emissions Profile, and environmental footprint impact assessment.
Product Environmental Footprint – General Guide; DRAFT ONLY FOR THE USE IN CASE STUDIES – DO NOT USE FOR ANY OTHER PURPOSE, OR CITE OR DISTRIBUTE
50
• Consistency checks: assess the extent to which assumptions, methods, and data quality considerations have been applied consistently throughout the Product Environmental Footprint study.
Any issues flagged in this evaluation should inform iterative improvements to the model.
Once it has been ensured that the Product Environmental Footprint model is robust and conforms with all aspects defined in the goal and scope definition phases, the next step is to identify the main contributing elements to the Product Environmental Footprint results. This step may also be referred to as “hot spot” or “weak point” analysis. Contributing elements may be specific life cycle stages, processes, or individual material/energy inputs/outputs associated with a given stage or process in the product supply chain. These are identified by systematically reviewing the Product Environmental Footprint study results. Graphical tools may be particularly useful in this context. Such analyses provide the necessary basis to identify improvement potentials associated with specific management interventions.
REQUIREMENT: Significant methodological issues shall be evaluated using a combination of completeness, sensitivity and consistency checks as appropriate. Product Environmental Footprint results shall subsequently be evaluated to assess supply chain hotspots/weak points on input/output, process, and supply chain stage bases and to assess improvement potentials
6.3 Calculating Uncertainty Estimating analytical uncertainties supports iterative improvement of Product Environmental Footprint studies. It also allows the target audience of the Product Environmental Footprint study results to assess their robustness and applicability. There are three key sources of uncertainty in Product Environmental Footprint studies. Each type of uncertainty must be accommodated separately.
(1) Stochastic uncertainties for inventory data or characterization factors
Stochastic uncertainties refer to statistical descriptions of variance around a mean. For normally distributed data, this variance is typically described in terms of an average and standard deviation. Product Environmental Footprint results that are calculated using average data (i.e. the mean of multiple data points for a given process) or using characterization factors with known associated variance do not reflect the uncertainty associated with such variance. However, uncertainty may be estimated and communicated using Monte Carlo simulations.
In practice, it may be difficult to access estimates of variance for all data used in a Product Environmental Footprint study. At a minimum, efforts to accurately characterize stochastic uncertainty and its impact on modeling outcomes should focus on those processes identified as significant in the environmental footprint impact assessment and interpretation phases.
(2) Choice-related uncertainties
Choices-related uncertainties arise from methodological choices including modeling principles, system boundaries and cut-off criteria, choice of environmental footprint impact assessment methods, and other
Product Environmental Footprint – General Guide; DRAFT ONLY FOR THE USE IN CASE STUDIES – DO NOT USE FOR ANY OTHER PURPOSE, OR CITE OR DISTRIBUTE
51
assumptions related to time, technology, geography, etc. These are not amenable to statistical description, but rather can only be characterized via scenario model assessments (e.g., modeling worst and best-case scenarios for significant processes).
REQUIREMENT: Quantitative uncertainty assessments shall be calculated for variance associated with significant processes and characterization factors using Monte Carlo simulations. The influence of choice-related uncertainties shall be estimated at the upper and lower bounds using scenario model assessments. These shall be clearly documented and reported. Where quantitative assessments are not possible, qualitative descriptions of any remaining uncertainties shall be provided.
6.4 Conclusions, Recommendations and Limitations The final aspect of the interpretation phase is to draw conclusions based on the analytical results, answer the questions posed at the outset of the Product Environmental Footprint study, and advance recommendations appropriate to the intended audience and context whilst explicitly taking into account any limitations to the robustness and applicability of the results.
As required under ISO 14044:2006, if the results of the Product Environmental Footprint study are intended to support comparative assertions (i.e. claims about the relative merits of products based on environmental footprint results), then it is essential to carefully consider whether any differences in data quality and methodological choices used to model the compared products may influence the comparability of the outcomes. Any inconsistencies in functional units, system boundaries, inventory data quality, or environmental footprint impact assessment must be considered and communicated.
Conclusions derived from the Product Environmental Footprint study should include a summary of identified supply chain “hotspots” and the improvement potentials associated with possible management interventions. The improvement potentials may be linked to, for example, cleaner technology techniques, EMAS or ISO 14001, or other systematic approaches.
REQUIREMENT: Conclusions, recommendations and limitations shall be described in accordance with the defined goals and scope of the Product Environmental Footprint study.
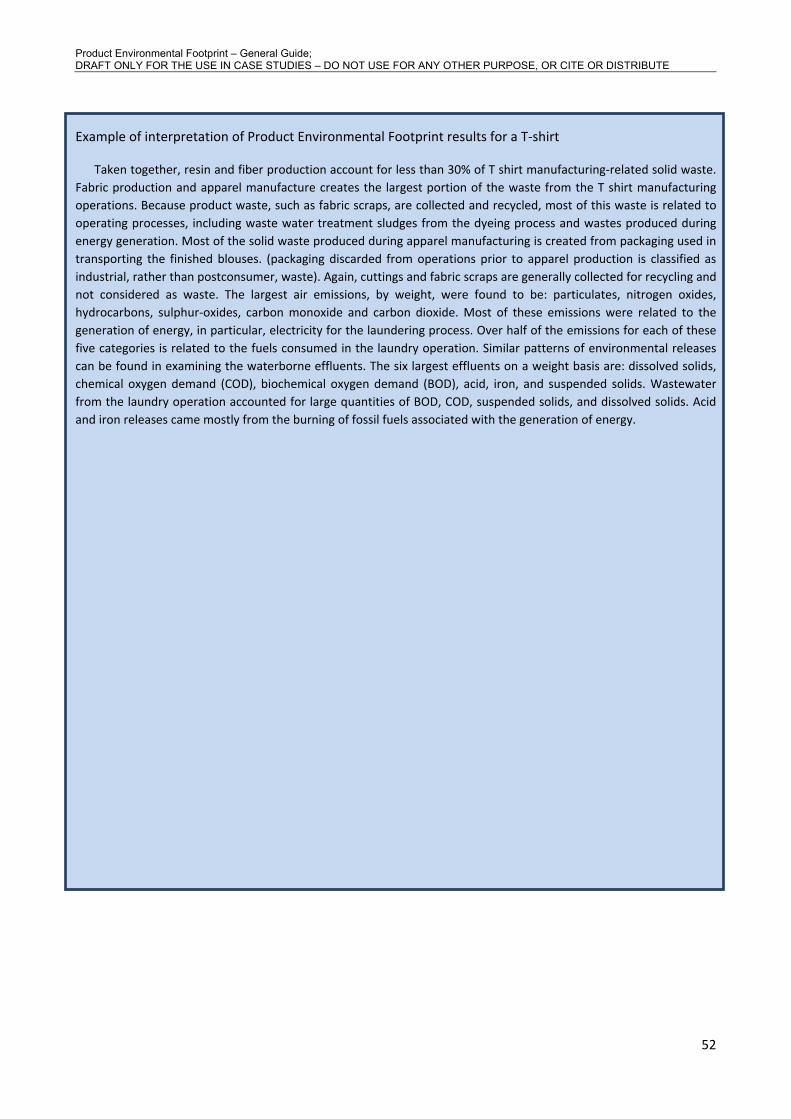
Product Environmental Footprint – General Guide; DRAFT ONLY FOR THE USE IN CASE STUDIES – DO NOT USE FOR ANY OTHER PURPOSE, OR CITE OR DISTRIBUTE
52
Example of interpretation of Product Environmental Footprint results for a T-shirt
Taken together, resin and fiber production account for less than 30% of T shirt manufacturing-related solid waste. Fabric production and apparel manufacture creates the largest portion of the waste from the T shirt manufacturing operations. Because product waste, such as fabric scraps, are collected and recycled, most of this waste is related to operating processes, including waste water treatment sludges from the dyeing process and wastes produced during energy generation. Most of the solid waste produced during apparel manufacturing is created from packaging used in transporting the finished blouses. (packaging discarded from operations prior to apparel production is classified as industrial, rather than postconsumer, waste). Again, cuttings and fabric scraps are generally collected for recycling and not considered as waste. The largest air emissions, by weight, were found to be: particulates, nitrogen oxides, hydrocarbons, sulphur-oxides, carbon monoxide and carbon dioxide. Most of these emissions were related to the generation of energy, in particular, electricity for the laundering process. Over half of the emissions for each of these five categories is related to the fuels consumed in the laundry operation. Similar patterns of environmental releases can be found in examining the waterborne effluents. The six largest effluents on a weight basis are: dissolved solids, chemical oxygen demand (COD), biochemical oxygen demand (BOD), acid, iron, and suspended solids. Wastewater from the laundry operation accounted for large quantities of BOD, COD, suspended solids, and dissolved solids. Acid and iron releases came mostly from the burning of fossil fuels associated with the generation of energy.
Product Environmental Footprint – General Guide; DRAFT ONLY FOR THE USE IN CASE STUDIES – DO NOT USE FOR ANY OTHER PURPOSE, OR CITE OR DISTRIBUTE
53
7. Product Environmental Footprint Reports
7.1 General A Product Environmental Footprint report provides a relevant, complete, consistent, accurate, and transparent account of the study and of the calculated environmental impacts associated with the product life cycle of concern. It reflects the best possible information in such a way as to maximize its usefulness to intended users, whilst honestly and transparently communicating limitations.
Effective Product Environmental Footprint reporting requires the satisfaction of several criteria, both procedural (report quality) and substantive (report content). The reported information must also provide a robust basis for assessing, tracking, and seeking to improve the environmental performance of the product over time. Towards this end, a combination of performance metrics will be useful.
For the purposes of tracking and seeking to improve performance, it is helpful to distinguish between absolute and intensity-based metrics. Absolute metrics convey the total contribution of production of the product to the environmental impact categories of concern. An example of an absolute metric would be the total greenhouse gas emissions associated with producing the product over a specified interval. Absolute metrics support management decisions associated with overall environmental performance objectives. In contrast, intensity-based metrics refer to environmental impacts per unit good/service. These are most useful from a resource and waste efficiency perspective, and for tracking relative environmental performance improvements at the product level.
7.2 Reporting elements A high quality Product Environmental Footprint report begins with a clear description of the methodologies, data sources, assumptions, results and limitations. Moreover, the reported information must be presented using internationally accepted formats and nomenclature.
The Product Environmental Footprint report consists of at least four elements: the Main Report, which is additionally condensed into a Technical Summary and an Executive Summary, and an Annex that documents e.g. assumptions and data (which can also be referenced). Confidential and proprietary information can be documented in a fifth element, a complementary confidential report. Review reports are either annexed as well or referenced.
First element: Executive Summary The summary shall be able to stand alone without compromising the results and conclusions/recommendations (if included).
The executive summary shall, at a minimum, include key elements of the goal and scope of the study. The main results from the inventory and impact assessment components shall be presented in a manner so as to ensure the proper use of the information, and relevant statements about data quality, assumptions and value judgments should be included.
Finally, the executive summary report should state any recommendations made and conclusions drawn, and shall specify any limitations that may apply.
Second element: Technical Summary This summary should be able to stand alone without compromising the results of the environmental footprint study. The technical summary should therefore also fulfill the same criteria about transparency, consistency, etc. as the detailed report.

Product Environmental Footprint – General Guide; DRAFT ONLY FOR THE USE IN CASE STUDIES – DO NOT USE FOR ANY OTHER PURPOSE, OR CITE OR DISTRIBUTE
54
The technical summary shall, at a minimum, include the goal, the scope, with relevant limitations and assumptions, an overall flow diagram of the system studied, and shall clearly indicate what has been achieved by the study. The main results from the inventory and impact assessment components shall be presented in a manner to ensure the proper use of the information, and statements about data quality and value judgments shall be included.
Finally, the technical summary shall specify any recommendations made and conclusions drawn.
Third element: Main Report The Main Report shall include the following components:
• Goal of the study: The report shall include clear and concise statements with respect to the following aspects:
o Intended application(s) o Methodological or impact category limitations o Reasons for carrying out the study o Target audience o Comparative assertions to be disclosed to the public o Commissioner of the study
• Scope of the study
The Scope chapter shall identify the analyzed system in detail and address the overall approach used to establish the system boundaries. The scope chapter should also address data quality requirements. Finally, the scope chapter includes a description of the methods applied for assessing potential environmental impacts and which impact categories, methods, normalization and weighting sets are included. Mandatory reporting elements are:
o Function, functional unit, and reference flow o System boundaries and cut-off criteria (completeness); o The reasons for and potential significance of any exclusions should be provided; o All assumptions and value judgments, along with justficiations for the assumptions made; o Data representativeness, appropriateness of data, andtypes/ sources of required data and
information o Impact assessment methods and factors, normalization basis and weighting set (if used)
• Compiling and recording the Resource Use and Emissions Profile
Mandatory reporting elements are:
o Flow diagram (should clearly describe the foreground system and links to the background system, and all major inputs and outputs)
o Description and documentation of all unit process data collected for the foreground system;
• Calculating Product Environmental Footprint impact assessment results
o Documentation of environmental footprint impact assessment methods and characterization factors
o If included, normalization and weighting factors and results
• Interpretation
o Significant issues
Product Environmental Footprint – General Guide; DRAFT ONLY FOR THE USE IN CASE STUDIES – DO NOT USE FOR ANY OTHER PURPOSE, OR CITE OR DISTRIBUTE
55
o Completeness check o Sensitivity check (of achieved accuracy and precision) o Consistency check o Conclusions o Recommendations and improvement potentials
Fourth element: Annex The annex serves to document elements that would inappropriately interrupt the reading flow of the main report, and which are of a more technical nature. It should include:
• Questionnaire / data collection template and raw data • Descriptions of all assumptions • Review report (if conducted) / answers to the review report (if any)
This should include those assumptions that have been shown to be irrelevant. The important ones are to be considered quantitatively in the sensitivity analysis and quantitatively and qualitatively in the interpretation.
• Full Resource Use and Emissions Profile (optional if considered sensitive and communicated separately in the Confidential Report)
Fifth element: Confidential report The confidential report shall contain all those data and information that is confidential or proprietary and cannot be made externally available. It shall be made available to the critical reviewers under confidentiality.
REQUIREMENT: The study report shall include, at a minimum, an Executive Summary, a Technical Summary, the Main Report, Annexes, and any other necessary supporting information.
For an example Product Environmental Footprint report template, see Annex V.
8. Product Environmental Footprint Review
8.1 General Critical review is important to ensuring the reliability of the Product Environmental Footprint results. This not only increases the credibility and acceptance of the Product Environmental Footprint study, but also helps improve its quality. Close interaction between the company and the reviewer is therefore vital for an efficient and effective review process.
The critical review shall serve to assure that:
• The methods used to carry out the Product Environmental Footprint study are consistent with this guidance document,
• The methods used to carry out the Product Environmental Footprint study are scientifically and technically valid,
• The data used are appropriate, reasonable and meet the defined data quality requirements, • The interpretation of results reflects the limitations identified, and • The study report is transparent, accurate and consistent.
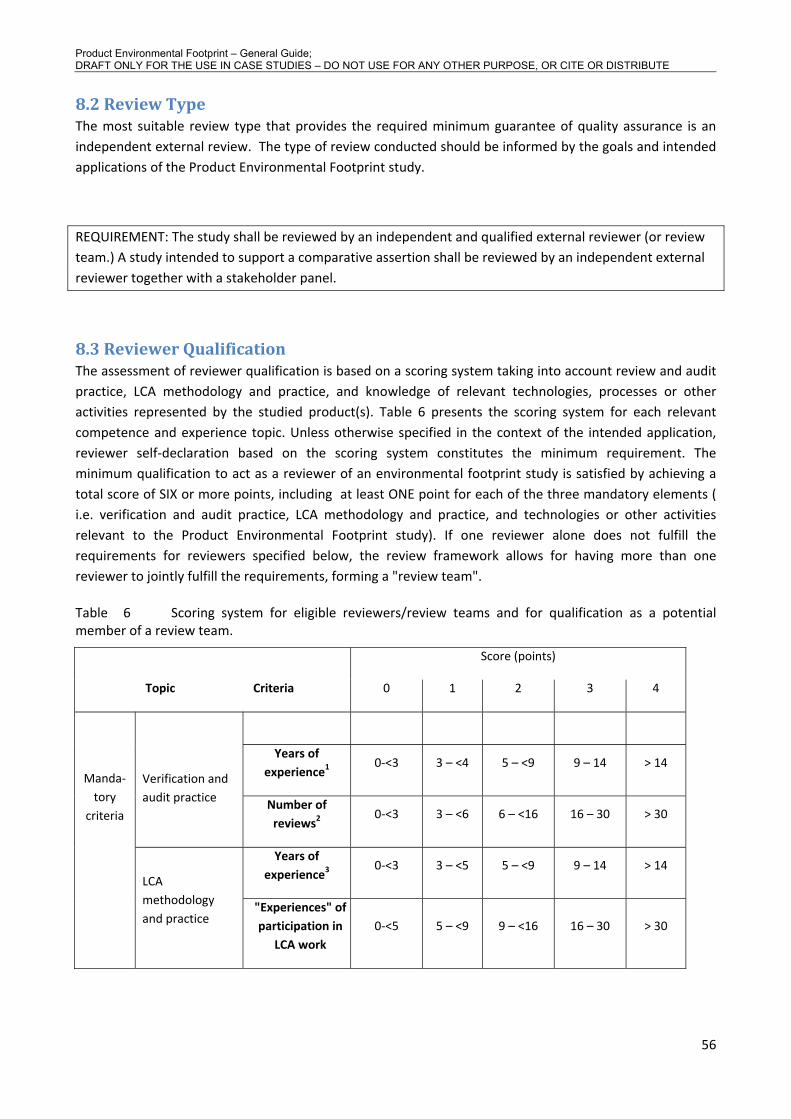
Product Environmental Footprint – General Guide; DRAFT ONLY FOR THE USE IN CASE STUDIES – DO NOT USE FOR ANY OTHER PURPOSE, OR CITE OR DISTRIBUTE
56
8.2 Review Type The most suitable review type that provides the required minimum guarantee of quality assurance is an independent external review. The type of review conducted should be informed by the goals and intended applications of the Product Environmental Footprint study.
REQUIREMENT: The study shall be reviewed by an independent and qualified external reviewer (or review team.) A study intended to support a comparative assertion shall be reviewed by an independent external reviewer together with a stakeholder panel.
8.3 Reviewer Qualification The assessment of reviewer qualification is based on a scoring system taking into account review and audit practice, LCA methodology and practice, and knowledge of relevant technologies, processes or other activities represented by the studied product(s). Table 6 presents the scoring system for each relevant competence and experience topic. Unless otherwise specified in the context of the intended application, reviewer self-declaration based on the scoring system constitutes the minimum requirement. The minimum qualification to act as a reviewer of an environmental footprint study is satisfied by achieving a total score of SIX or more points, including at least ONE point for each of the three mandatory elements ( i.e. verification and audit practice, LCA methodology and practice, and technologies or other activities relevant to the Product Environmental Footprint study). If one reviewer alone does not fulfill the requirements for reviewers specified below, the review framework allows for having more than one reviewer to jointly fulfill the requirements, forming a "review team".
Table 6 Scoring system for eligible reviewers/review teams and for qualification as a potential member of a review team.
Score (points)
Topic Criteria 0 1 2 3 4
Years of experience1
0-<3 3 – <4 5 – <9 9 – 14 > 14 Verification and audit practice Number of
reviews2 0-<3 3 – <6 6 – <16 16 – 30 > 30
Years of experience3
0-<3 3 – <5 5 – <9 9 – 14 > 14
Manda- tory
criteria
LCA methodology and practice
"Experiences" of participation in
LCA work 0-<5 5 – <9 9 – <16 16 – 30 > 30
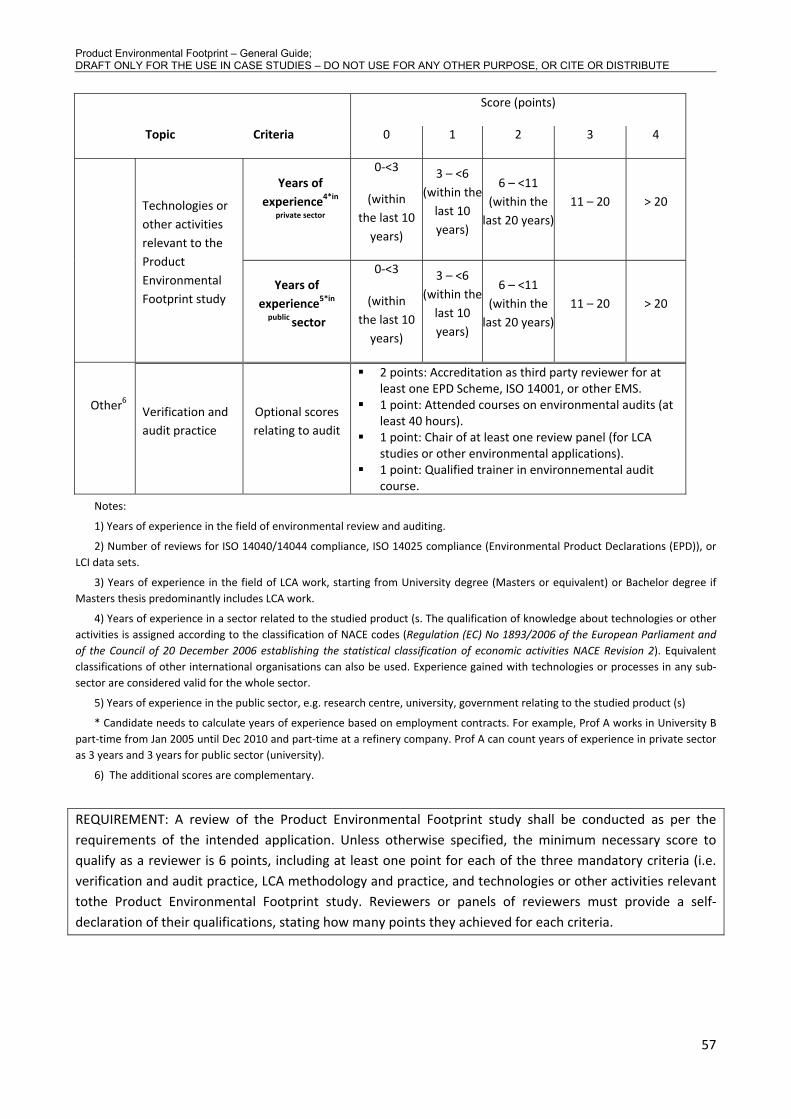
Product Environmental Footprint – General Guide; DRAFT ONLY FOR THE USE IN CASE STUDIES – DO NOT USE FOR ANY OTHER PURPOSE, OR CITE OR DISTRIBUTE
57
Score (points)
Topic Criteria 0 1 2 3 4
Years of experience4*in
private sector
0-<3
(within the last 10
years)
3 – <6 (within the
last 10 years)
6 – <11 (within the
last 20 years)11 – 20 > 20 Technologies or
other activities relevant to the Product Environmental Footprint study
Years of experience5*in
public sector
0-<3
(within the last 10
years)
3 – <6 (within the
last 10 years)
6 – <11 (within the
last 20 years)11 – 20 > 20
Other6
Verification and audit practice
Optional scores relating to audit
2 points: Accreditation as third party reviewer for at least one EPD Scheme, ISO 14001, or other EMS.
1 point: Attended courses on environmental audits (at least 40 hours).
1 point: Chair of at least one review panel (for LCA studies or other environmental applications).
1 point: Qualified trainer in environnemental audit course.
Notes:
1) Years of experience in the field of environmental review and auditing.
2) Number of reviews for ISO 14040/14044 compliance, ISO 14025 compliance (Environmental Product Declarations (EPD)), or LCI data sets.
3) Years of experience in the field of LCA work, starting from University degree (Masters or equivalent) or Bachelor degree if Masters thesis predominantly includes LCA work.
4) Years of experience in a sector related to the studied product (s. The qualification of knowledge about technologies or other activities is assigned according to the classification of NACE codes (Regulation (EC) No 1893/2006 of the European Parliament and of the Council of 20 December 2006 establishing the statistical classification of economic activities NACE Revision 2). Equivalent classifications of other international organisations can also be used. Experience gained with technologies or processes in any sub-sector are considered valid for the whole sector.
5) Years of experience in the public sector, e.g. research centre, university, government relating to the studied product (s)
* Candidate needs to calculate years of experience based on employment contracts. For example, Prof A works in University B part-time from Jan 2005 until Dec 2010 and part-time at a refinery company. Prof A can count years of experience in private sector as 3 years and 3 years for public sector (university).
6) The additional scores are complementary.
REQUIREMENT: A review of the Product Environmental Footprint study shall be conducted as per the requirements of the intended application. Unless otherwise specified, the minimum necessary score to qualify as a reviewer is 6 points, including at least one point for each of the three mandatory criteria (i.e. verification and audit practice, LCA methodology and practice, and technologies or other activities relevant tothe Product Environmental Footprint study. Reviewers or panels of reviewers must provide a self-declaration of their qualifications, stating how many points they achieved for each criteria.

Product Environmental Footprint – General Guide; DRAFT ONLY FOR THE USE IN CASE STUDIES – DO NOT USE FOR ANY OTHER PURPOSE, OR CITE OR DISTRIBUTE
58
9. Role of Product Environmental Footprint Category Rules
9.1 General Product Environmental Footprint Category Rules (PFCRs) can complement general methodological guidance for Product Environmental Footprint studies by providing further specification at the product level. PFCRs can thus make important contributions to increased reproducibility and consistency in Product Environmental Footprint studies.
PFCRs should, to the extent possible, be in conformity with existing international Product Category Rule (PCR) guidance documents. As defined in ISO 14025(2006), PCRs include sets of specific rules, guidelines and requirements that are aimed at developing “Type III environmental declarations” for any product category (i.e. goods and/or services providing equivalent functions). “Type III environmental declarations” are quantitative, LCA-based claims of the environmental aspects of a certain good or service, e.g. quantitative information regarding potential environmental impacts.
9.2 Role of PFCRs PFCRs should provide a robust, life cycle based framework in complement to this methodology guide for environmental footprint studies of products. PFCRs should aim to focus environmental footprint assessments on those aspects and parameters most pertinent to determining environmental performance for the product category considered. In practice, PFCRs developed for a given product category should provide further specification and guidance in:
• defining the goal and scope of thestudy, e.g. help reduce the number of impact category indicators to be considered in the assessment to only those most relevant to the product’s life cycle;
• identifying the proper boundary of the Product Environmental Footprint study, e.g. help apply cut-off rules to identify significant versus insignificant processes;
• identifying key parameters and key life cycle stages; • selecting the appropriate data sources; • conducting the Resource Use and Emissions Profile phase • Solving multi-functionality problems
9.3 Developing PFCRs - how to get started For the consistent development any PFCR, the starting point is to accurately and unambiguously define the product category for which environmental footprint category rules are to be developed.
Ideally, adopting a common framework for selection of product categories would reduce the risk of developing overlapping PFCRs, while allowing for a more efficient development and use of the rules derived.
For instance, the Global Ecolabelling Network – a non-profit association of environmental performance recognition, certification and labeling – provides a comprehensive list of products grouped per product-category (e.g. batteries, cleaners, building materials, dishwashers)4. Similarly, the United Nations (UN) Statistics Division provides a list that includes over 2,000 products categories5.
4 http://www.globalecolabelling.net/categories_7_criteria/ 5 http://unstats.un.org/unsd/cr/registry/regcia.asp?Cl=25
Product Environmental Footprint – General Guide; DRAFT ONLY FOR THE USE IN CASE STUDIES – DO NOT USE FOR ANY OTHER PURPOSE, OR CITE OR DISTRIBUTE
59
ISO 14025(2006) describes the procedure for development and review of PCRs and establishes requirements for comparability of different Type III environmental declarations.
The minimum content of a PCR document (following ISO 14025) includes, but is not limited to:
• Identification of the product category for which a PCR is to be developed, including a description of e.g., the product’s function(s), technical performance and utilization(s);
• Definition of goal and scope for the LCA of the product, according to the requirement of the ISO 14040 series in terms of e.g. functional unit, system boundary, data quality requirements, cut-off rules;
• Description of the Life Cycle Inventory (LCI) analysis, with special focus on the data collection phase, calculation procedures, and allocation rules;
• Choice of the environmental impact category indicators to be included in the LCA; • Description on any eventual predetermined parameter for reporting of LCA data, e.g. certain
predetermined inventory data categories and/or impact category indicators; • If not all life cycle stages are included in the LCA, information/justification on which stages are not
covered is to be provided; • Time span of validity of the PCR being developed.

Product Environmental Footprint – General Guide; DRAFT ONLY FOR THE USE IN CASE STUDIES – DO NOT USE FOR ANY OTHER PURPOSE, OR CITE OR DISTRIBUTE
60
10. Example (to be inserted for final version, if helpful)
Product Environmental Footprint – General Guide; DRAFT ONLY FOR THE USE IN CASE STUDIES – DO NOT USE FOR ANY OTHER PURPOSE, OR CITE OR DISTRIBUTE
61
11. Acronyms and Abbreviations
ADEME Agence de l'Environnement et de la Maîtrise de l'Energie
B2B Business to Business
B2C Business to Consumer
BSI British Standards Institution
ELCD European Reference Life Cycle Database
ILCD International Reference Life Cycle Data System
IPCC Intergovernmental Panel on Climate Change
LCA Life Cycle Assessment
LCI Life Cycle Inventory
LCIA Life Cycle Impact Assessment
PAS Publicly Available Specification
PFCR Product Footprint Category Rules
WRI World Resources Institute
WBCSD World Business Council for Sustainable Development

Product Environmental Footprint – General Guide; DRAFT ONLY FOR THE USE IN CASE STUDIES – DO NOT USE FOR ANY OTHER PURPOSE, OR CITE OR DISTRIBUTE
62
12. Glossary Allocation – An approach to solving multi-functionality problems. Refers to partitioning the input or output flows of a process or a product system between the multiple product input or outputs of the system.
Background System – Refers to those stages of the life cycle of a product for which no direct information access is possible. For example, most of the upstream supply-chain processes and generally all processes further downstream will be considered part of the background system.
Characterization - Calculating the magnitude of the contribution of each classified input/output to their respective environmental footprint impact categories, and aggregation of contributions within each category. This requires a linear multiplication of the inventory data with characterization factors for each substance and environmental footprint impact category of concern. For example, with respect to the environmental footprint impact category “climate change”, CO2 is chosen as reference substance and the reference unit is kg CO2-equivalents. In this case, the characterization factor of CH4 is set to 256 (kg CO2 / kg CH4), which means that the emission of a unit mass of CH4 contributes to climate change 25 times more than the emission of a unit mass of the reference substance CO2.
Classification - Assigning the material/energy inputs and outputs tabulated in the Resource and Emissions Profile to environmental footprint impact categories according to each substances potential to contribute to each of the environmental impact categories considered.
Comparative Assertions – A statement of overall superiority or equivalence of products concerning the relative environmental performance, here based on the results of a Product Environmental Footprint study.
Cradle to Gate - An assessment of a partial product life cycle from the extraction of raw materials (cradle) up to the manufacturer’s “gate”. The distribution, use phase and disposal phase of the product life cycle are omitted. Cradle-to-gate assessments are sometimes the basis for environmental product declarations (EPD).
Cradle to Grave - An assessment, including raw material extraction, processing, distribution, storage, use, and disposal or recycling phases. All relevant inputs and outputs are considered for all of the phases of the life cycle.
Cradle to Cradle - A specific kind of cradle-to-grave assessment, where the end-of-life disposal step for the product is a recycling process.
Cut-off Criterion - Specification of the amount of material or energy flow or the level of environmental significance associated with processes to be excluded from a Product Environmental Footprint study.
Data Quality - Characteristics of data that relate to their ability to satisfy predefined quality requirements. Data quality covers various aspects, such as technological, geographical and time-related representativeness, as well as completeness and precision of the inventory data.
Environmental Footprint Impact Category – Class of resource use or environmental impact to which the Resource Use and Emissions Profile data are related.
6 Global Warming Potential (GWP) for 100 years. Intergovernmental Panel on Climate Change - IPCC 4th Assessment Report (2006)
Product Environmental Footprint – General Guide; DRAFT ONLY FOR THE USE IN CASE STUDIES – DO NOT USE FOR ANY OTHER PURPOSE, OR CITE OR DISTRIBUTE
63
Environmental Footprint Impact Assessment Method – Protocol for quantitative translation of Resource Use and Emissions Profile data into contributions to an environmental impact of concern.
Foreground sSstem – Refers to those stages of the product life cycle for which direct information access is available. For example, the producer’s site and other processes operated by the company or contractors (e.g. goods transport, head-office services, etc.) belong to the foreground system.
Functional Unit - The functional unit defines the qualitative and quantitative aspects of the function(s) and/or service(s) that the product being evaluated provides; the functional unit definition answers the questions “what?”, “how much?”, “how well?”, and “for how long?”
Gate to Gate - A partial assessment looking only at the processes within a specific company or site.
Life Cycle Approach - Refers to taking into consideration the spectrum of resource flows and environmental interventions associated with a product, service, or organization from a supply chain perspective, including all phases from raw material acquisition through processing, distribution, use, and end-of-life processes, and all relevant related environmental impacts (in place of focusing on a single issue)
Life Cycle Impact Assessment (LCIA) - Phase of life cycle assessment aimed at understanding and evaluating the magnitude and significance of the potential environmental impacts for a product system throughout the life cycle of the product [ISO 14044:2006]. The employed LCIA methods provide impact characterization factors for elementary flows to aggregate the impact to a limited number of midpoint and/or damage indicators.
Global Warming Potential – Capacity of a greenhouse gas to influence radiative forcing, expressed in terms of a reference substance (for example, CO2-equivalent units) and specified time horizon (e.g. GWP 20, GWP 100, GWP 500, for 20, 100, and 500 years). Relates to capacity to influence changes in the global, average surface-air temperature and subsequent change of various climate parameters and their effects such as storm frequency and intensity, rainfall intensity and frequency of flooding etc
Land Use - Impact category related to use (occupation) and conversion (transformation) of land area by product-related activities such as agriculture, roads, housing, mining, etc. Land occupation considers the effects of the land use, the amount of area involved and the duration of its occupation (quality-changes multiplied with area and duration). Land transformation considers the extent of changes in land properties and the area affected (quality changes multiplied with the area).
Ozone Depletion Impact category that accounts for the degradation of stratospheric ozone due to emissions of ozone depleting substances, for example long-lived chlorine and bromine containing gases (e.g. CFCs, HCFCs, Halons). Human Toxicity –cancer – impact category that accounts for the adverse health effects on human beings caused by intake of toxic substances through inhalation of air, food/water ingestion, penetration through the skin as far as they are related to cancer
Human Toxicity- non cancer - Impact category that accounts for the adverse health effects on human beings caused by intake of toxic substances through inhalation of air, food/water ingestion, penetration through the skin as far as they are related to non-cancer effects that are not caused by particulate matter/repiratory inorganics or ionizing radiation.
Product Environmental Footprint – General Guide; DRAFT ONLY FOR THE USE IN CASE STUDIES – DO NOT USE FOR ANY OTHER PURPOSE, OR CITE OR DISTRIBUTE
64
Particulate Matter/Respiratory Inorganics – Impact categories that accounts for the adverse health effects on human health caused by emissions of Particulate Matter (PM) and its precursors (NOx, SOx, NH3)
Ionising Radiation, human health – Impact categories that accounts for the adverse health effects on human health caused by radioactive releases.
Photochemical Ozone Formation – Impact category that accounts for the formation of ozone at the ground level of the troposphere caused by photochemical oxidation of Volatile Organic Compounds (VOCs) and carbon monoxide (CO) in the presence of nitrogen oxides (NOxand sunlight. High concentrations of ground-level tropospheric ozone damage vegetation, human respiratory tracts and manmade materials through reaction with organic materials.
Acidification - Impact category that addresses impacts due to acidifying substances in the environment. Emissions of NOx, NH3 and SOx lead to releases of hydrogen ions (H+) when the gases are mineralized. The protons contribute to acidification of soils andwater when they are released in areas where the buffering capacity is low, resulting in forest decline and acidified lakes.
Eutrophication - Nutrients (mainly nitrogen and phosphorus) from sewage outfalls and fertilized farmland accelerate the growth of algae and other vegetation in water. The degradation of organic material consumes oxygen resulting in oxygen deficiency and, in some cases, fish death. Eutrophication translates the quantity of emission of substances into a common measure expressed as the oxygen required for the degradation of dead biomass.
Ecotoxicity: Impact category that addresses toxic impacts on an ecosystem, damaging individual species and changing the structure and function of the ecosystem. Ecotoxicity is a result of a variety of different toxicological mechanisms caused by release of all substances with a direct effect on the health of the ecosystem.
Resource Depletion - Impact category that addresses impacts due to the use of natural resources, either renewable or non-renewable, and either biotic or abiotic.
Life Cycle Inventory - Phase of life cycle assessment involving the compilation and quantification of inputs and outputs (mass and energy basis) for a given product system throughout its life cycle.
Normalization – After the characterization step, normalization is an optional step in which the LCIA results are multiplied with normalization factors that represent the overall inventory of a reference unit (e.g., a whole country or an average citizen). Normalized LCIA results express the relative shares of the impacts of the analyzed system in terms of the total contributions to each impact category per reference unit. When displaying the normalised LCIA results of the different impact topics next to each other, it becomes evident which impact categories the analyzed system affects most, and least. Normalized LCIA results reflect only the contribution of the analyzed product to the total impact potential, not the severity/relevance of the respective total impact. Normalized results are dimensionless, but not additive.
Product Environmental Footprint Category Rules – are product-specific, life cycle based rules that complement general methodological guidance for Product Environmental Footprint studies by providing further specification at the product level. PFCRs can help shifting the focus of the Product Environmental Footprint study towards those aspects and parameters that matter the most, and hence contribute to increased relevance, reproducibility and consistency.
Product Environmental Footprint – General Guide; DRAFT ONLY FOR THE USE IN CASE STUDIES – DO NOT USE FOR ANY OTHER PURPOSE, OR CITE OR DISTRIBUTE
65
Reference Flow – measure of the outputs from processes in a given product system required to fulfill the function expressed by the functional unit
Resource Use and Emissions Profile – Refers to the inventory of data collected to represent the inputs and outputs associated with each stage of the product life cycle of concern. The Resource Use and Emissions Profile includes three types of data: specific data, average data, and generic data.
Specific Data – Refer to data directly measured or collected data representative of activities at a specific stage of the activity (data on resource use and emission) for a specific facility or company.
A pharmaceutical company compiles data from internal inventory records to represent the material and energy inputs and emissions from a factory producing acetylsalicylic acid.
Average Data – Refers to a production-weighted average of specific data.
A pharmaceutical company compiles production-weighted average data for twenty of their factories producing acetylsalicylic acid.
Generic Data – Refers to data that is not directly collected, measured, or estimated, but rather sourced from a third-party life cycle inventory database or other source that complies with the data quality requirements of the Product Environmental Footprint method.
A company operating a product system that purchases acetylsalicylic acid from a number of regional firms on a least-cost basis as an input to their production process sources generic data from a life cycle inventory database to represent average acetylsalicylic acid production conditions in the region of interest.
System Boundary – Definition of aspects included or excluded from the study. For example, for a “cradle-to-grave” environmental footprint analysis, this should include all activities from extraction of raw materials through processing, manufacturing, use, repair and maintenance processes as well as transport, waste treatment and other purchased services such as e.g. cleaning and legal services, marketing, production and decommissioning of capital goods, operation of premises such as retail, storage, administration offices, staff commuting, business travel, and end-of-life processes.
Soil Organic Matter (SOM) – is the measure of the content of organic material in soil. This derives from plants and animals and comprises all of the organic matter in the soil exclusive of the material that has not decayed.
Weighting - Weighting is an additional, but not required, step that may support the interpretation and communication of the results of the analysis. Normalized Product Environmental Footprint results are multiplied by a set of weighting factors, which reflect the perceived relative importance of the impact categories considered. Weighted environmental footprint results can be directly compared across impact categoies, and also summed across impact categories to obtain a single-value overall impact indicator. In contrast to the preceding, natural sciences-based phases (classification, characterisation and normalization), weighting requires value judgements as to the respective importance of the environmental footprint impact categories considered. These judgments may be based on expert opinion, social science methods, cultural/political view points, or economic considerations.
Product Environmental Footprint – General Guide; DRAFT ONLY FOR THE USE IN CASE STUDIES – DO NOT USE FOR ANY OTHER PURPOSE, OR CITE OR DISTRIBUTE
66
13. References • Council of the European Union. 2008. Council Conclusions on the "Sustainable Consumption and
Production and Sustainable Industrial Policy Action Plan". http://www.eu2008.fr/webdav/site/PFUE/shared/import/1204_Conseil_Environnement/Council_conclusions_Sustainable_consumption_and_production_EN.pdf
• Council of the European Union. 2010. Council conclusions on sustainable materials management and sustainable production and consumption: key contribution to a resource-efficient Europe. http://www.consilium.europa.eu/uedocs/cms_data/docs/pressdata/en/envir/118642.pdf.
• European Commission. 2010. Product Carbon Footprinting – a study on methodologies and initiatives. Final report. http://www.saiplatform.org/uploads/Library/Ernst%20and%20Young%20Review.pdf.
• European Commission - Joint Research Centre - Institute for Environment and Sustainability: International Reference Life Cycle Data System (ILCD) Handbook - General guide for Life Cycle Assessment - Detailed guidance. First edition March 2010. EUR 24708 EN. Luxembourg. Publications Office of the European Union; 2010
• European Commission - Joint Research Centre - Institute for Environment and Sustainability: International Reference Life Cycle Data System (ILCD) Handbook - Review schemes for Life Cycle Assessment. First edition March 2010. EUR 24710 EN. Luxembourg. Publications Office of the European Union; 2010
• European Commission - Joint Research Centre - Institute for Environment and Sustainability: International Reference Life Cycle Data System (ILCD) Handbook - Framework and Requirements for Life Cycle Impact Assessment Models and Indicators. First edition March 2010. EUR 24586 EN. Luxembourg. Publications Office of the European Union; 2010
• European Commission - Joint Research Centre - Institute for Environment and Sustainability. International Reference Life Cycle Data System (ILCD) Handbook - Recommendations based on existing environmental impact assessment models and factors for Life Cycle Assessment in a European context. Publications Office of the European Union; in publication, 2011
• Eurostat: http://epp.eurostat.ec.europa.eu/portal/page/portal/environment/data/main_tables • Intergovernmental Panel on Climate Change 2006 report • International Resource Panel. 2011: Recycling rates of metal- a status report ISBN:978-92-807-
3161-3 • WRI and WBCSD. 2004. The Greenhouse Gas Protocol: A Corporate Accounting and Reporting
Standard. Revised Edition. World Resources Institute, Washington, DC and World Business Council for Sustainable Development, Geneva.
• WRI and WBSCD. 2010. Corporate Value Chain (Scope 3) Accounting and Reporting. Supplement to the GHG Protocol Corporate Accounting and Reporting Standard. Draft for Stakeholder Review. World Resources Institute, Washington, DC and World Business Council for Sustainable Development, Geneva.
• WRI and WBSCD. 2010. Product Accounting & Reporting Standard. Draft for Stakeholder Review. World Resources Institute, Washington, DC and World Business Council for Sustainable Development, Geneva
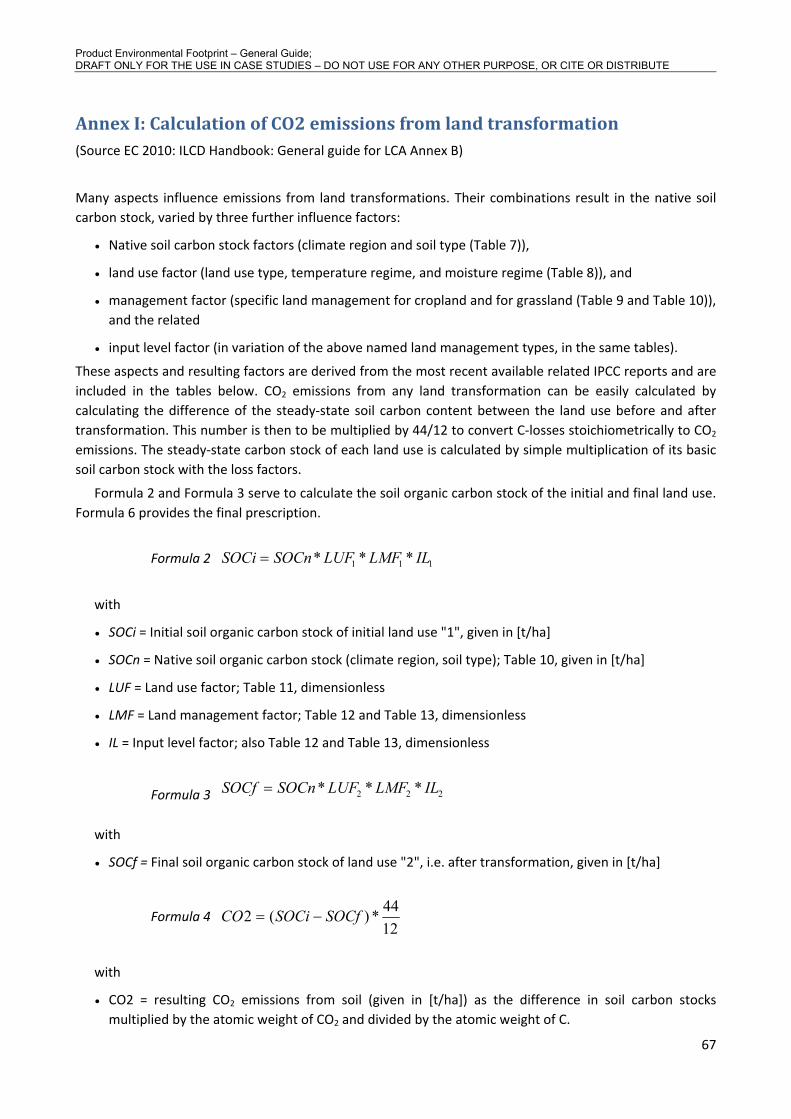
Product Environmental Footprint – General Guide; DRAFT ONLY FOR THE USE IN CASE STUDIES – DO NOT USE FOR ANY OTHER PURPOSE, OR CITE OR DISTRIBUTE
67
Annex I: Calculation of CO2 emissions from land transformation (Source EC 2010: ILCD Handbook: General guide for LCA Annex B)
Many aspects influence emissions from land transformations. Their combinations result in the native soil carbon stock, varied by three further influence factors:
• Native soil carbon stock factors (climate region and soil type (Table 7)),
• land use factor (land use type, temperature regime, and moisture regime (Table 8)), and
• management factor (specific land management for cropland and for grassland (Table 9 and Table 10)), and the related
• input level factor (in variation of the above named land management types, in the same tables).
These aspects and resulting factors are derived from the most recent available related IPCC reports and are included in the tables below. CO2 emissions from any land transformation can be easily calculated by calculating the difference of the steady-state soil carbon content between the land use before and after transformation. This number is then to be multiplied by 44/12 to convert C-losses stoichiometrically to CO2 emissions. The steady-state carbon stock of each land use is calculated by simple multiplication of its basic soil carbon stock with the loss factors.
Formula 2 and Formula 3 serve to calculate the soil organic carbon stock of the initial and final land use. Formula 6 provides the final prescription.
Formula 2 111 *** ILLMFLUFSOCnSOCi =
with
• SOCi = Initial soil organic carbon stock of initial land use "1", given in [t/ha]
• SOCn = Native soil organic carbon stock (climate region, soil type); Table 10, given in [t/ha]
• LUF = Land use factor; Table 11, dimensionless
• LMF = Land management factor; Table 12 and Table 13, dimensionless
• IL = Input level factor; also Table 12 and Table 13, dimensionless
Formula 3 222 *** ILLMFLUFSOCnSOCf =
with
• SOCf = Final soil organic carbon stock of land use "2", i.e. after transformation, given in [t/ha]
Formula 4 1244*)(2 SOCfSOCiCO −=
with
• CO2 = resulting CO2 emissions from soil (given in [t/ha]) as the difference in soil carbon stocks multiplied by the atomic weight of CO2 and divided by the atomic weight of C.

Product Environmental Footprint – General Guide; DRAFT ONLY FOR THE USE IN CASE STUDIES – DO NOT USE FOR ANY OTHER PURPOSE, OR CITE OR DISTRIBUTE
68
Note that this is the total amount of CO2 that has to be allocated to the individual crops and/or crop years after conversion, as detailed in the ILCD general handbook chapter 7.4.4.1.
At the end of the tables some example calculations are given.
Table 7: Native soil carbon stocks under native vegetation (tonnes C ha-1 in upper 30 cm of soil) (IPCC 2006)
Climate Region High activity clay soils
Low activity clay soils
Sandy soils
Spodic soils
Volcanic soils
Wetland soils
Boreal 68 NA 10 117 20 146
Cold temperate, dry 50 33 34 NA 20
Cold temperate, moist 95 85 71 115 130
97
Warm temperate, dry 38 24 19 NA 70
Warm temperate, moist
88 63 34 NA 80
88
Tropical, dry 38 35 31 NA 50
Tropical, moist 65 47 39 NA 70
Tropical, wet 44 60 66 NA 130
Tropical montane 88 63 34 NA 80
86
Table 8: Land use factors (IPCC 2006)
Land-use Temperature regime Moisture regime
Land use factors (IPCC default)
Error (±)7
Dry 0.80 9 % Temperate/Boreal
Moist 0.69 12 %
Dry 0.58 61 % Tropical
Moist/Wet 0.48 46 %
Long-term cultivated
Tropical montane n/a 0.64 50 %
7 Error = two standard deviations, expressed as a percent of the mean; where sufficient studies were not available for a statistical analysis a default, a value based on expert judgement (40 %, 50%, or 90%) is used as a measure of the error. NA denotes ‘Not Applicable’, for factor values that constitute reference values or nominal practices for the input or management classes. This error range does not include potential systematic error due to small sample sizes that may not be representative of the true impact for all regions of the world.

Product Environmental Footprint – General Guide; DRAFT ONLY FOR THE USE IN CASE STUDIES – DO NOT USE FOR ANY OTHER PURPOSE, OR CITE OR DISTRIBUTE
69
Permanent grassland All 1.00
Paddy rice All 1.10 50 %
Perennial/Tree Crop All
Dry and
Moist/Wet 1.00 50 %
Dry 0.93 11 % Temperate/Boreal
and Tropical Moist/Wet 0.82 17 %
Set-aside (< 20 yrs)
Tropical montane n/a 0.88 9
Table 9: Land management and input level factors for cropland (IPCC 2006)
Land management (for cultivated land only)
Land-use management
Temperature regime Moisture regime
Land management and input level factors (IPCC defaults)
Error (±)225
Full tillage All Dry and Moist/Wet
1.00 NA
Dry 1.02 6 % Temperate/Boreal
Moist 1.08 5 %
Dry 1.09 9 % Tropical
Moist/Wet 1.15 8 %
Reduced tillage
Tropical montane n/a 1.09 50 %
Dry 1.10 5 % Temperate/Boreal
Moist 1.15 4 %
Dry 1.17 8 % Tropical
Moist/Wet 1.22 7 %
No tillage
Tropical montane n/a 1.16 50 %
Input level (for cultivated land only)
Dry 0.95 13 % Temperate/Boreal
Moist 0.92 14 %
Dry 0.95 13 %
Low input
Tropical
Moist/Wet 0.92 14 %

Product Environmental Footprint – General Guide; DRAFT ONLY FOR THE USE IN CASE STUDIES – DO NOT USE FOR ANY OTHER PURPOSE, OR CITE OR DISTRIBUTE
70
Tropical montane n/a 0.94 50 %
Medium input All Dry and Moist/Wet
1.00 NA
Dry 1.04 13 % Temperate/Boreal
and Tropical Moist/Wet 1.11 10 %
High input without manure
Tropical montane n/a 1.08 50 %
Dry 1.37 12 % Temperate/Boreal
and Tropical Moist/Wet 1.44 13 %
High input with manure
Tropical montane n/a 1.41
Table 10: Land management and input level factors for grassland (IPCC 2006)
Land management (for grassland only)
Land-use management Temperature regime
Land management and input level factors (IPCC defaults)
Error (±)225
Nominally managed (non-degraded) All 1.00 NA
Temperate/Boreal 0.95 13 %
Tropical 0.97 11 %
Moderately degraded
Tropical Montane 0.96 40 %
Severely degraded All 0.70 40 %
Temperate/Boreal 1.14 11 %
Tropical 1.17 9 %
Improved grassland
Tropical Montane 1.16 40 %
Input level (for improved grass land only)
Medium All 1.00 NA
High All 1.11 7 %
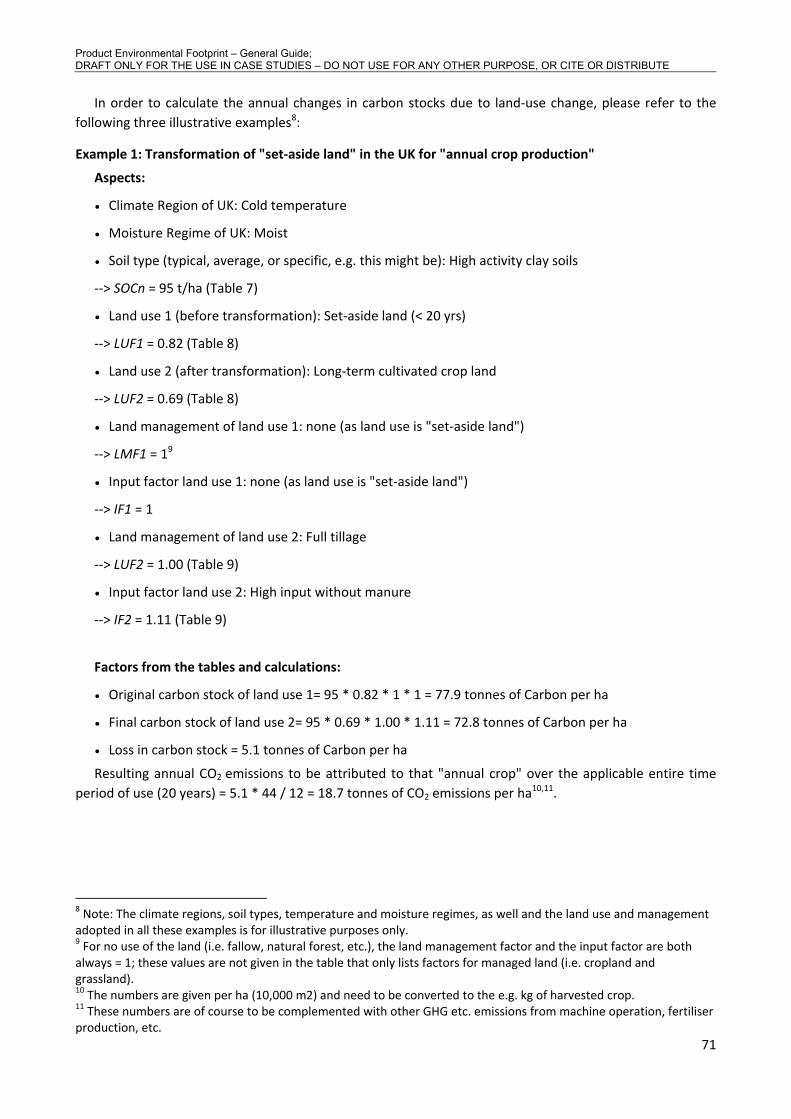
Product Environmental Footprint – General Guide; DRAFT ONLY FOR THE USE IN CASE STUDIES – DO NOT USE FOR ANY OTHER PURPOSE, OR CITE OR DISTRIBUTE
71
In order to calculate the annual changes in carbon stocks due to land-use change, please refer to the following three illustrative examples8:
Example 1: Transformation of "set-aside land" in the UK for "annual crop production"
Aspects:
• Climate Region of UK: Cold temperature
• Moisture Regime of UK: Moist
• Soil type (typical, average, or specific, e.g. this might be): High activity clay soils
--> SOCn = 95 t/ha (Table 7)
• Land use 1 (before transformation): Set-aside land (< 20 yrs)
--> LUF1 = 0.82 (Table 8)
• Land use 2 (after transformation): Long-term cultivated crop land
--> LUF2 = 0.69 (Table 8)
• Land management of land use 1: none (as land use is "set-aside land")
--> LMF1 = 19
• Input factor land use 1: none (as land use is "set-aside land")
--> IF1 = 1
• Land management of land use 2: Full tillage
--> LUF2 = 1.00 (Table 9)
• Input factor land use 2: High input without manure
--> IF2 = 1.11 (Table 9)
Factors from the tables and calculations:
• Original carbon stock of land use 1= 95 * 0.82 * 1 * 1 = 77.9 tonnes of Carbon per ha
• Final carbon stock of land use 2= 95 * 0.69 * 1.00 * 1.11 = 72.8 tonnes of Carbon per ha
• Loss in carbon stock = 5.1 tonnes of Carbon per ha
Resulting annual CO2 emissions to be attributed to that "annual crop" over the applicable entire time period of use (20 years) = 5.1 * 44 / 12 = 18.7 tonnes of CO2 emissions per ha10,11.
8 Note: The climate regions, soil types, temperature and moisture regimes, as well and the land use and management adopted in all these examples is for illustrative purposes only. 9 For no use of the land (i.e. fallow, natural forest, etc.), the land management factor and the input factor are both always = 1; these values are not given in the table that only lists factors for managed land (i.e. cropland and grassland). 10 The numbers are given per ha (10,000 m2) and need to be converted to the e.g. kg of harvested crop. 11 These numbers are of course to be complemented with other GHG etc. emissions from machine operation, fertiliser production, etc.

Product Environmental Footprint – General Guide; DRAFT ONLY FOR THE USE IN CASE STUDIES – DO NOT USE FOR ANY OTHER PURPOSE, OR CITE OR DISTRIBUTE
72
Example 2: Transformation of forest in Indonesia for annual crop production
• Climate Region of Indonesia: Tropical
• Moisture Regime of Indonesia: wet
• Soil type: Volcanic
• Land use 1: Native
• Land use 2: Long-term cultivated
• Land management and input level of land use 1: none
• Land management and input level of land use 2: Reduced tillage, low input
• Original carbon stock of land use 1= 130 * 1.00 * 1 * 1 = 130 tonnes of Carbon per ha
• Final carbon stock of land use 2 = 130 * 0.48 * 1.15 * 0.92 = 66.0 tonnes of Carbon per ha
• Loss in carbon stock = 64.0 tonnes of Carbon per ha12
Resulting annual CO2 emissions to be attributed to that "annual crop" over the applicable entire time period of use (20 years) = 64 * 44 / 12 = 234.67 tonnes of CO2 emissions per ha.
Example 3: Transformation of grassland in Canada for annual crop production
• Climate Region of Canada: Cold temperate
• Moisture Regime of Canada: dry
• Soil type: Sandy soils
• Land use 1: Permanent grassland
• Land use 2: Long-term cultivated
• Land management and input level of land use 1: Nominally managed (non-degraded), medium input
• Land management and input level of land use 2: Full tillage, high input with manure
• Original carbon stock of land use 1 = 34 * 1.00 * 1.00 * 1.00= 34 tonnes of Carbon per ha
• Final carbon stock of land use 2 = 34 * 0.80 * 1.00 * 1.37 = 37.3 tonnes of Carbon per ha
• Loss in carbon stock = -3.313 tonnes of Carbon per ha
Resulting annual CO2 emissions to be attributed to that "annual crop" over the applicable entire time period of use (20 years) = -3.3 * 44 / 12 = -12.1 tonnes of CO2 emissions per ha, i.e. 12.1 tonnes of CO2 accumulation / binding as soil organic carbon.
12 Note that the Carbon bound in the biomass (i.e. trees) of the natural tropical forest is several times higher. 13 Negative loss, i.e. an accumulation

Product Environmental Footprint – General Guide; DRAFT ONLY FOR THE USE IN CASE STUDIES – DO NOT USE FOR ANY OTHER PURPOSE, OR CITE OR DISTRIBUTE
73
This last example illustrates a land transformation that results in net carbon storage in the soil. Please note that, even though this crop is credited for sequestering carbon dioxide from the atmosphere to the soil, the temporary nature of this storage may need to be considered in the results interpretation.

Product Environmental Footprint – General Guide; DRAFT ONLY FOR THE USE IN CASE STUDIES – DO NOT USE FOR ANY OTHER PURPOSE, OR CITE OR DISTRIBUTE
74
Annex II Dealing with Multi-functionality in recycling situations
Recycling rate method:
This method is typically referred to as the "end-of-life recycling" approach, or the "recyclability substitution” approach. The emissions (per unit of analysis) associated with the entire waste management of the product to be recycled can be estimated as follows:
Formula 5: Emissions (per unit of analysis) = ED + ERD + EV*(1-Rm) - Rm*EV*(Ps/Pp)
Where:
• ED = emissions and avoided emissions (per unit of analysis) arising from disposal of waste material;
• ERD = emissions and avoided emissions (per unit of analysis) arising from the processing of recycled material output for use in a subsequent product system;
• EV = emissions and avoided emissions (per unit of analysis) arising from the input of virgin material;
• Rm = “recycling rate”, i.e. the proportion of material in the product that is recycled at end-of-life;
• Pp = market price of the primary material;
• Ps = market price of the secondary material
Formula 6: Emissions (per unit of analysis) = ED + ERD + Ee*(1-Rr) - Rr*Ee*(Pr/Pe)
Where:
• ED = emissions and avoided emissions (per unit of analysis) arising from disposal of waste material;
• ERD = emissions and avoided emissions (per unit of analysis) arising from the processing of recycled material output for use in a subsequent product system;
• Ee = emissions and avoided emissions (per unit of analysis) arising from the input of energy production;
• Rr = “ energy recovery rate”; Rr + Rm =<
• Pe = market price of the substituted primary energy;
• Pr = market price of the recovery energy

Product Environmental Footprint – General Guide; DRAFT ONLY FOR THE USE IN CASE STUDIES – DO NOT USE FOR ANY OTHER PURPOSE, OR CITE OR DISTRIBUTE
75
To use the above formula for calculating the emissions associated with the waste management of a product being recycled, the (end-of-life) recycling rate (R) should be known. The following table (Table 11)), based on statistics from Eurostat14,15,16, provides default recycling rate values for a number of selected streams of packaging waste (reference year: 2008). These shall be intended as purely indicative values, which may be used as default only if specific, high quality data are not available. Fig 10 provides recycling rates for packaging waste (i.e. all packaging waste streams included) in the EU-27 Member States (reference year: 2007) 17. Table 12 provides suggested default recycling rates for metals18. Comprehensive statistics on waste recycling rates can be found in the above referenced sources from Eurostat.
Table 11: Suggested default recycling rates for selected streams of packaging waste (Eurostat, 2008)
Country Overall packaging
waste
Plastic packaging
Paper & Cardboard packaging
Metal packaging
Wooden packaging
Belgium 78.9 39.5 89.4 94.0 57.9 Bulgaria 50.3 15.6 84.9 65.1 40.6 Czeck Republic 67.1 50.2 93.8 42.9 29.3 Denmark 59.7 25.4 61.0 81.9 41.0 Germany 70.5 47.3 87.7 91.7 28.8 Estonia 43.5 22.0 65.1 25.6 56.7 Ireland 61.7 28.9 78.2 62.0 76.7 Greece 43.8 11.9 73.6 43.8 30.8 Spain 59.1 24.4 73.4 67.8 58.2 France 55.2 22.5 86.9 60.2 18.9 Italy 59.6 31.1 73.8 68.4 53.1 Cyprus 34 14.8 59.9 94.9 14.9 Latvia 46.8 17.6 66.1 68.1 28.3 Lithuania 51.7 32.6 73.0 62.1 43.4 Luxemburg 63.6 29.7 77.6 79.4 19.2 Hungary 50.8 25.1 90.6 66.9 22.6 Netherlands 72.4 36.4 96.4 86.3 36.1 Austria 67.9 34.9 85.4 63.9 21.9 Poland 42.9 23.9 67.1 37.5 26.3 Portugal 61.0 19.1 87.8 64.8 64.5 Romania 33.5 15.5 61.6 51.0 8.3 Slovenia 52.4 55.6 66.4 21.4 7.2 Slovakia 47.7 43.7 53.6 55.8 16.1 Finland 56.7 22.7 93.1 75.4 21.3 Sweden 58.5 37.0 74.1 71.3 16.7 United Kingdom 61.5 23.7 79.7 56.9 76.5
14 Eurostat: http://epp.eurostat.ec.europa.eu/portal/page/portal/environment/data/main_tables 15 Eurostat 2010 report “Environmental statistics and accounts in Europe”; ISBN 978-92-79-15701-1; available online at http://epp.eurostat.ec.europa.eu/portal/page/portal/environment/introduction 16 Eurostat - Environmental Data Center on Waste; http://epp.eurostat.ec.europa.eu/portal/page/portal/waste/data/wastemanagement/recycling 17 Eurostat - Environmental Data Center on Waste; http://epp.eurostat.ec.europa.eu/portal/page/portal/waste/data/wastemanagement/recycling 18 Based on the International Resource Panel: Appendix C and Appendix E of “Recycling Rates of Metals: a status report” ISBN: 978-92-807-3161-3

Product Environmental Footprint – General Guide; DRAFT ONLY FOR THE USE IN CASE STUDIES – DO NOT USE FOR ANY OTHER PURPOSE, OR CITE OR DISTRIBUTE
76
Fig 10: Packaging waste recycling rates in EU-27 Member States (year 2007)
Table 12: suggested default recycling rates for metals
Metal Recycling Rate (R) Metal Recycling Rate (R) Cr 90% Mg 39%
Mn 53% Al 57% Fe 72% Ti 91% Ni 59% Co 68% Nb 53% Cu 48% Mo 30% Zn 40% V 1% Sn 75%
Ru 10% Pb 72% Rh 55% Pt 71% Pd 65% Au 51% Ag 65% Os 1%
Table 14: Primary material price

Product Environmental Footprint – General Guide; DRAFT ONLY FOR THE USE IN CASE STUDIES – DO NOT USE FOR ANY OTHER PURPOSE, OR CITE OR DISTRIBUTE
77
World Bank Commodity Price Data (Pink Sheet)Annual Prices in Nominal and Real 2000 US dollars, 1960 to Present (Annual series are available in nominal and real 2000 dollars; see column "BU" for real price series)Updated as of: December 6, 2010
Nominal US dollars Nominal US dollarsSteel Steel Steel Steel Steel
Petroleum Coal Natural gasNatural gasNatural gas Iron Index cold rolled hot rolledcrude Australian US Europe Japan Cocoa Aluminum Copper Lead Tin Nickel Zinc Gold Silver ore Japan coilsheet coilsheet rebar wire rod($/bbl) ($/mt) ($/mmbtu) ($/mmbtu) ($/mmbtu) (cents/kg) ($/mt) ($/mt) (cents/kg) (cents/kg) ($/mt) (cents/kg) ($/toz) (cents/toz) ($/mt fe) (2000=100 ($/mt) ($/mt) ($/mt) ($/mt)
1980 36.87 40.14 1.55 4.22 5.70 260.35 1456.00 2182.00 90.60 1677.49 6518.70 76.10 607.90 2063.60 28.09 108.74 386.08 323.33 330.83 350.831981 35.48 53.62 1.93 4.60 6.03 207.96 1263.00 1741.90 72.70 1415.91 5953.10 84.60 459.75 1051.80 28.09 111.43 399.67 328.83 313.33 387.501982 32.65 54.77 2.40 4.45 6.05 173.56 992.00 1480.40 54.60 1282.58 4837.50 74.50 375.80 794.70 32.50 95.27 367.92 281.67 242.50 353.331983 29.66 38.19 2.53 4.05 5.55 211.99 1439.00 1591.90 42.50 1298.80 4672.80 76.40 422.53 1144.10 29.00 89.02 360.42 270.00 222.50 312.501984 28.56 30.96 2.59 3.80 5.24 239.60 1251.00 1377.30 44.30 1223.35 4752.30 92.20 360.47 814.10 26.15 93.70 376.67 283.83 233.33 308.751985 27.18 33.75 2.45 3.70 5.23 225.45 1041.00 1417.40 39.10 1153.90 4899.10 78.30 317.91 614.20 26.56 80.96 326.25 245.83 225.42 272.921986 14.35 31.13 1.89 2.90 4.10 206.97 1150.00 1373.80 40.60 616.14 3881.20 75.40 364.17 547.00 26.26 82.49 325.42 269.58 219.58 239.581987 18.15 27.50 1.62 2.15 3.35 199.42 1565.00 1782.50 59.70 666.48 4872.20 79.90 446.47 701.00 25.30 95.86 385.42 323.33 202.92 248.331988 14.72 34.88 1.64 2.00 3.34 158.46 2551.00 2601.70 65.60 705.16 13778.30 124.10 437.05 654.00 24.30 125.30 501.25 395.83 262.50 313.751989 17.84 38.00 1.70 2.10 3.28 124.10 1951.00 2848.40 67.30 853.44 13308.20 165.90 381.43 550.00 27.83 140.08 550.42 441.92 341.67 350.831990 22.88 39.67 1.70 2.55 3.64 126.67 1639.00 2661.50 81.10 608.54 8864.10 151.30 383.47 488.83 32.50 134.43 511.25 411.25 364.17 362.921991 19.37 39.67 1.49 3.11 3.99 119.51 1302.20 2338.80 55.80 559.50 8155.60 111.70 362.18 404.14 34.76 131.86 504.17 408.33 367.08 383.331992 19.02 38.56 1.77 2.56 3.60 109.96 1254.30 2281.15 54.10 610.10 7001.23 124.00 343.73 393.60 33.10 116.48 469.17 369.17 306.67 372.501993 16.84 31.33 2.12 2.67 3.51 111.69 1139.05 1913.08 40.64 516.11 5293.42 96.20 359.77 429.84 29.09 122.67 470.00 375.83 348.75 395.831994 15.89 32.30 1.92 2.44 3.18 139.60 1476.78 2307.42 54.78 546.38 6339.82 99.77 384.01 528.42 26.47 122.59 511.67 402.92 322.50 371.671995 17.18 39.37 1.72 2.73 3.45 143.24 1805.65 2935.61 63.10 621.38 8228.04 103.11 384.16 519.18 28.38 141.87 554.17 440.83 381.67 420.831996 20.42 38.07 2.73 2.84 3.67 145.56 1505.66 2294.86 77.43 616.51 7500.82 102.51 387.70 518.34 30.00 128.42 483.92 365.58 360.17 438.501997 19.17 35.10 2.48 2.74 3.91 161.87 1599.33 2276.77 62.42 564.68 6927.39 131.61 331.10 489.22 30.15 117.94 448.17 337.25 325.17 382.671998 13.07 29.23 2.09 2.42 3.02 167.64 1357.47 1654.06 52.86 554.03 4629.52 102.45 294.16 553.43 31.00 98.44 370.83 279.17 257.50 332.081999 18.07 25.89 2.27 2.13 3.14 113.53 1361.09 1572.86 50.26 540.36 6011.23 107.63 278.77 524.95 27.59 89.09 340.42 243.33 234.17 290.002000 28.23 26.25 4.31 3.86 4.71 90.58 1549.14 1813.47 45.39 543.57 8637.74 112.81 279.03 499.92 28.79 100.00 385.83 295.83 244.17 291.672001 24.35 32.31 3.96 4.06 4.63 106.87 1443.63 1578.29 47.62 448.44 5944.73 88.58 270.99 438.61 30.03 86.93 299.15 216.52 221.46 302.292002 24.93 25.31 3.36 3.05 4.28 177.79 1349.92 1559.48 45.27 406.05 6771.75 77.88 309.97 462.52 29.31 88.21 328.33 246.67 204.17 300.002003 28.90 26.09 5.49 3.91 4.73 175.09 1431.29 1779.14 51.50 489.49 9629.47 82.77 363.51 491.07 31.95 103.31 444.58 320.21 265.83 300.002004 37.73 52.95 5.90 4.28 5.13 154.99 1715.54 2865.88 88.65 851.27 13823.24 104.78 409.21 669.05 37.90 168.19 607.08 502.50 428.75 487.502005 53.39 47.62 8.92 6.33 5.99 153.81 1898.31 3678.88 97.64 737.98 14743.96 138.13 444.84 733.81 65.00 186.80 733.33 633.33 423.13 579.172006 64.29 49.09 6.72 8.47 7.08 159.19 2569.90 6722.13 128.97 878.08 24254.41 327.53 604.34 1156.91 77.35 181.62 693.75 600.00 443.75 581.252007 71.12 65.73 6.98 8.56 7.68 195.23 2638.18 7118.23 258.00 1453.68 37229.81 324.24 696.72 1341.25 84.70 181.97 650.00 550.00 521.50 533.332008 96.99 127.10 8.86 13.41 12.55 257.71 2572.79 6955.88 209.07 1851.01 21110.64 187.47 871.71 1499.90 140.60 289.33 965.63 883.33 760.17 1009.752009 61.76 71.84 3.95 8.71 8.94 288.92 1664.83 5149.74 171.93 1357.39 14654.63 165.51 972.97 1469.41 100.95 227.05 783.33 683.33 486.04 969.42
Table 14: Secondary material price
Material Secondary material price per kg
Al 1.45
Cu 1.67
Zn 2.32
Au 9653.23
Ag 166.55
Ni 7.84
Steel 0.29
Sn -
PET 1.15
Paper 0.14
Glass -
HDPE 0.93
PP
Stainless steel
Ref: (Analysis of National Solid Waste Recycling Programs, 1999; Financial Times, 2000; American Metal Market, 1999; US Geological Survey, 1997–2000)

Product Environmental Footprint – General Guide; DRAFT ONLY FOR THE USE IN CASE STUDIES – DO NOT USE FOR ANY OTHER PURPOSE, OR CITE OR DISTRIBUTE
78
Annex III Identifying Appropriate Nomenclature and Properties for Specific Flows
Required rules for each flow type.
Items Rule from the ILCD- Nomenclature
Raw material, Input 2, 4, 5
Emission, output 2,4,9
Product flow 10,11,13,14,15,16,17
ILCD Nomenclature Rules.
Rule #
Rule Category Rule/ Required Nomenclature
1 Requirement status of the individual rules
For ILCD-compliant LCI data sets, LCA studies and other ILCD-compliant deliverables the "mandatory" rules shall always be met, while the “recommended” ones are only recommended.
CLASSIFICATION/CATEGORIZATION OF FLOWS
CLASSIFICATION/CHARACTERIZATION OF ELEMENTARY FLOWS
Classification / categorisation according to (sub)compartment of receiving / providing environment
2 "elementary flow categories" by receiving / providing environmental compartment
Resources - Resources from ground
Resources - Resources from water
Resources - Resources from air
Resources – Resources from biosphere
Land use – Land transformation
Land use – Land occupation
Emissions – Emissions to air - Emissions to air, unspecified
Emissions – Emissions to air - Emissions to air, unspecified (long-term)
Emissions – Emissions to air - Emissions to urban air close to ground

Product Environmental Footprint – General Guide; DRAFT ONLY FOR THE USE IN CASE STUDIES – DO NOT USE FOR ANY OTHER PURPOSE, OR CITE OR DISTRIBUTE
79
Rule #
Rule Category Rule/ Required Nomenclature
Emissions – Emissions to air - Emissions to non-urban air or from high stacks
Emissions – Emissions to air - Emissions to lower stratosphere and upper troposphere
Emissions – Emissions to water - Emissions to water, unspecified
Emissions – Emissions to water - Emissions to water, unspecified (long-term)
Emissions – Emissions to water - Emissions to fresh water
Emissions – Emissions to water - Emissions to sea water
Emissions – Emissions to soil - Emissions to soil, unspecified
Emissions – Emissions to soil - Emissions to agricultural soil
Emissions – Emissions to soil - Emissions to non-agricultural soil
Emissions – Emissions to soil - Emissions to soil, unspecified (long-term)
Other elementary flows
3 Splitting emissions to brackish water
If an emission into brackish water appears, the amount of emissions should be split into a 50% share of emission to seawater and 50% to freshwater.
Discussion of a possible further differentiation of receiving / providing environment
4 Further differentiation of providing/receiving environmental compartments
Further differentiated receiving / providing environmental compartments below the compartments defined more above shall presently not be used.
Classification according to substance-type of elementary flow
Substance-type based classification for resources
5 Additional, non-identifying classification for "Resources from
“Non-renewable material resources from ground” (e.g. "Sand", "Anhydrite; 100%", etc.)
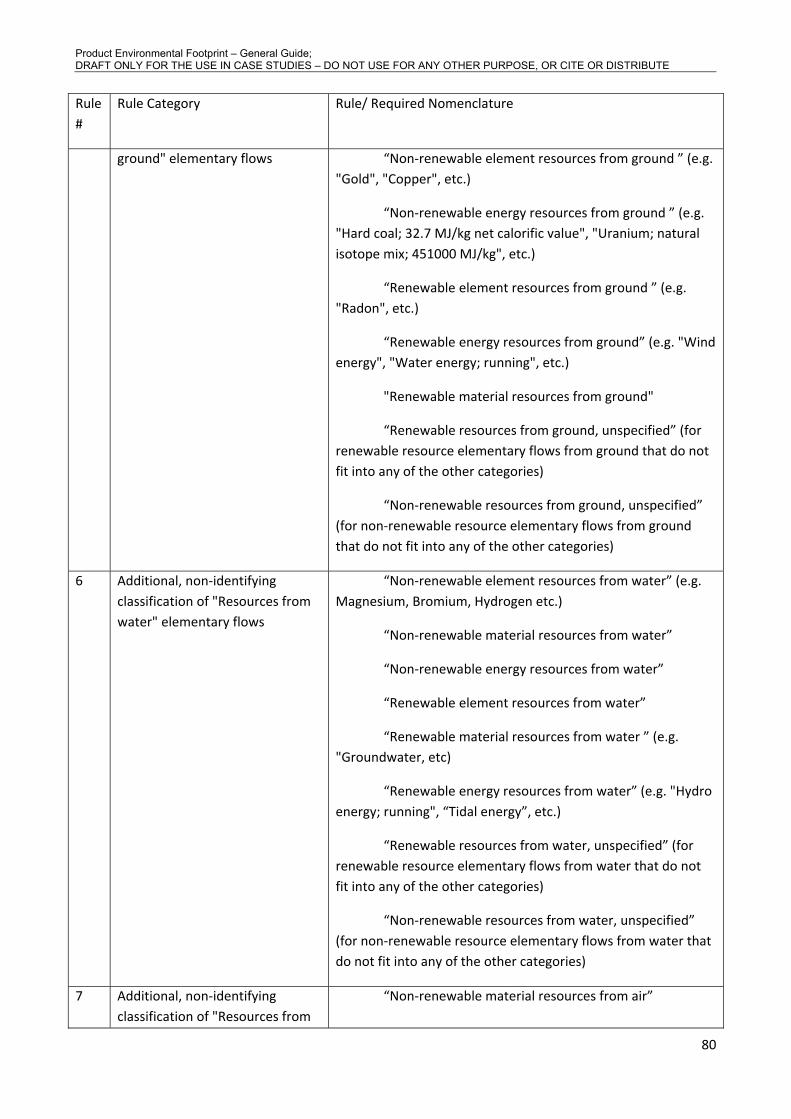
Product Environmental Footprint – General Guide; DRAFT ONLY FOR THE USE IN CASE STUDIES – DO NOT USE FOR ANY OTHER PURPOSE, OR CITE OR DISTRIBUTE
80
Rule #
Rule Category Rule/ Required Nomenclature
ground" elementary flows “Non-renewable element resources from ground ” (e.g. "Gold", "Copper", etc.)
“Non-renewable energy resources from ground ” (e.g. "Hard coal; 32.7 MJ/kg net calorific value", "Uranium; natural isotope mix; 451000 MJ/kg", etc.)
“Renewable element resources from ground ” (e.g. "Radon", etc.)
“Renewable energy resources from ground” (e.g. "Wind energy", "Water energy; running", etc.)
"Renewable material resources from ground"
“Renewable resources from ground, unspecified” (for renewable resource elementary flows from ground that do not fit into any of the other categories)
“Non-renewable resources from ground, unspecified” (for non-renewable resource elementary flows from ground that do not fit into any of the other categories)
6 Additional, non-identifying classification of "Resources from water" elementary flows
“Non-renewable element resources from water” (e.g. Magnesium, Bromium, Hydrogen etc.)
“Non-renewable material resources from water”
“Non-renewable energy resources from water”
“Renewable element resources from water”
“Renewable material resources from water ” (e.g. "Groundwater, etc)
“Renewable energy resources from water” (e.g. "Hydro energy; running", “Tidal energy”, etc.)
“Renewable resources from water, unspecified” (for renewable resource elementary flows from water that do not fit into any of the other categories)
“Non-renewable resources from water, unspecified” (for non-renewable resource elementary flows from water that do not fit into any of the other categories)
7 Additional, non-identifying classification of "Resources from
“Non-renewable material resources from air”
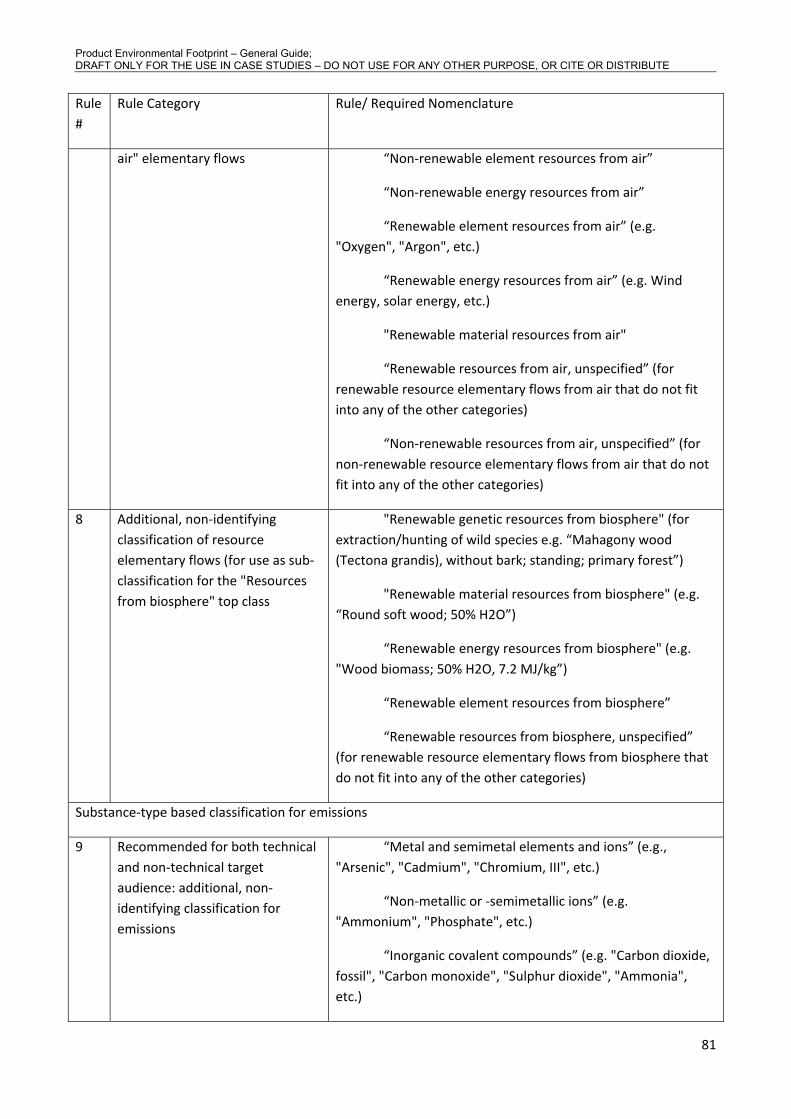
Product Environmental Footprint – General Guide; DRAFT ONLY FOR THE USE IN CASE STUDIES – DO NOT USE FOR ANY OTHER PURPOSE, OR CITE OR DISTRIBUTE
81
Rule #
Rule Category Rule/ Required Nomenclature
air" elementary flows “Non-renewable element resources from air”
“Non-renewable energy resources from air”
“Renewable element resources from air” (e.g. "Oxygen", "Argon", etc.)
“Renewable energy resources from air” (e.g. Wind energy, solar energy, etc.)
"Renewable material resources from air"
“Renewable resources from air, unspecified” (for renewable resource elementary flows from air that do not fit into any of the other categories)
“Non-renewable resources from air, unspecified” (for non-renewable resource elementary flows from air that do not fit into any of the other categories)
8 Additional, non-identifying classification of resource elementary flows (for use as sub-classification for the "Resources from biosphere" top class
"Renewable genetic resources from biosphere" (for extraction/hunting of wild species e.g. “Mahagony wood (Tectona grandis), without bark; standing; primary forest”)
"Renewable material resources from biosphere" (e.g. “Round soft wood; 50% H2O”)
“Renewable energy resources from biosphere" (e.g. "Wood biomass; 50% H2O, 7.2 MJ/kg”)
“Renewable element resources from biosphere”
“Renewable resources from biosphere, unspecified” (for renewable resource elementary flows from biosphere that do not fit into any of the other categories)
Substance-type based classification for emissions
9 Recommended for both technical and non-technical target audience: additional, non-identifying classification for emissions
“Metal and semimetal elements and ions” (e.g., "Arsenic", "Cadmium", "Chromium, III", etc.)
“Non-metallic or -semimetallic ions” (e.g. "Ammonium", "Phosphate", etc.)
“Inorganic covalent compounds” (e.g. "Carbon dioxide, fossil", "Carbon monoxide", "Sulphur dioxide", "Ammonia", etc.)

Product Environmental Footprint – General Guide; DRAFT ONLY FOR THE USE IN CASE STUDIES – DO NOT USE FOR ANY OTHER PURPOSE, OR CITE OR DISTRIBUTE
82
Rule #
Rule Category Rule/ Required Nomenclature
“Cyclic organics” (e.g. "Hexachloro-benzene", "Cyclopentane", "Naphthalene", etc.)
“Acyclic organics” (e.g. "Ethene", "3-methyl-1-butene", "1,2-chloro-pentane" etc.)
“Pesticides” (e.g. "Chlorfenvinphos", "Tributyl-tin" etc.)
“Radioactives” (e.g. "Cesium-137", "Radon-220", etc.)
“Particles” (e.g. "PM <2.5μm", "PM 2.5-10μm", etc.)
"Other substance type"
HIERARCHICAL CLASSIFICATION OF PRODUCT FLOWS, WASTE FLOWS, AND PROCESSES
10 Top-level classification for Product flows, Waste flows, and Processes
“Energy carriers and technologies”
“Materials production”
“Systems”
“End-of-life treatment”
“Transport services”
“Use and consumption”
“Other services”
11 Second level classifications for Product flows, Waste flows, and Processes (for preceding top-level classification)
“Energy carriers and technologies”
“Energetic raw materials” (Note: this refers to the extracted products and related technologies, not the resources e.g. in the ground)
"Electricity”
"Heat and steam”
"Mechanical energy"
"Hard coal based fuels"
"Lignite based fuels"
"Crude oil based fuels"
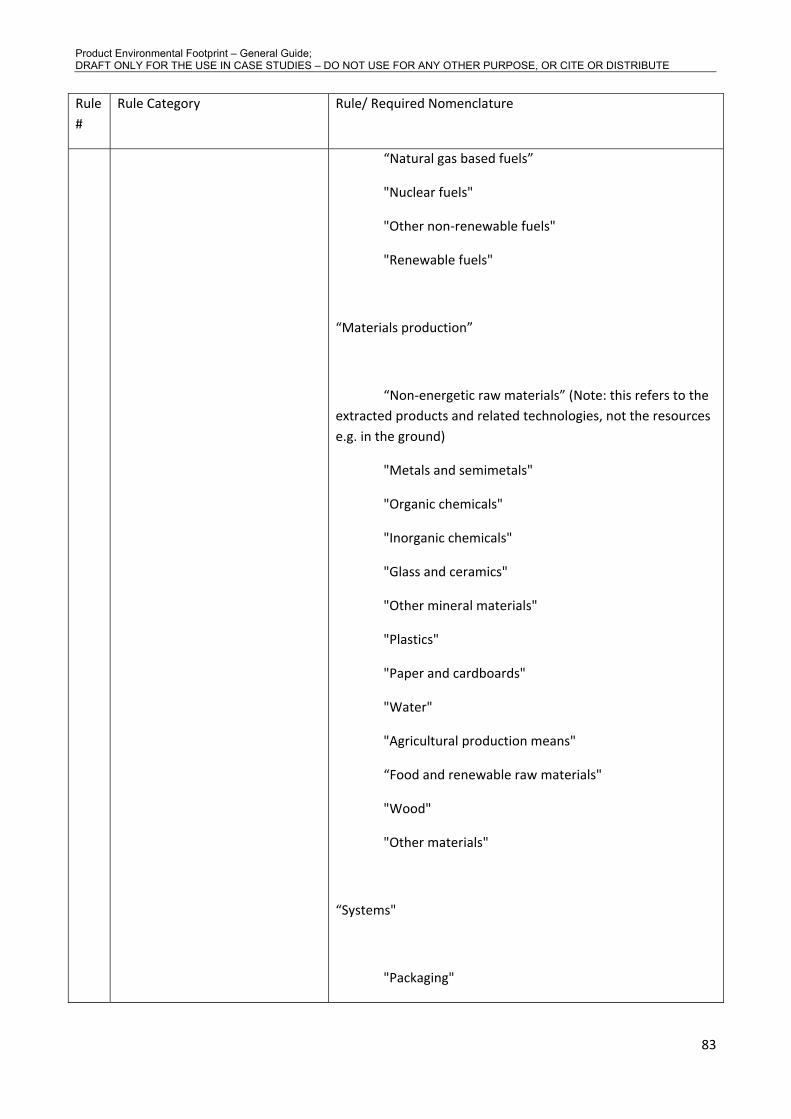
Product Environmental Footprint – General Guide; DRAFT ONLY FOR THE USE IN CASE STUDIES – DO NOT USE FOR ANY OTHER PURPOSE, OR CITE OR DISTRIBUTE
83
Rule #
Rule Category Rule/ Required Nomenclature
“Natural gas based fuels”
"Nuclear fuels"
"Other non-renewable fuels"
"Renewable fuels"
“Materials production”
“Non-energetic raw materials” (Note: this refers to the extracted products and related technologies, not the resources e.g. in the ground)
"Metals and semimetals"
"Organic chemicals"
"Inorganic chemicals"
"Glass and ceramics"
"Other mineral materials"
"Plastics"
"Paper and cardboards"
"Water"
"Agricultural production means"
“Food and renewable raw materials"
"Wood"
"Other materials"
“Systems"
"Packaging"
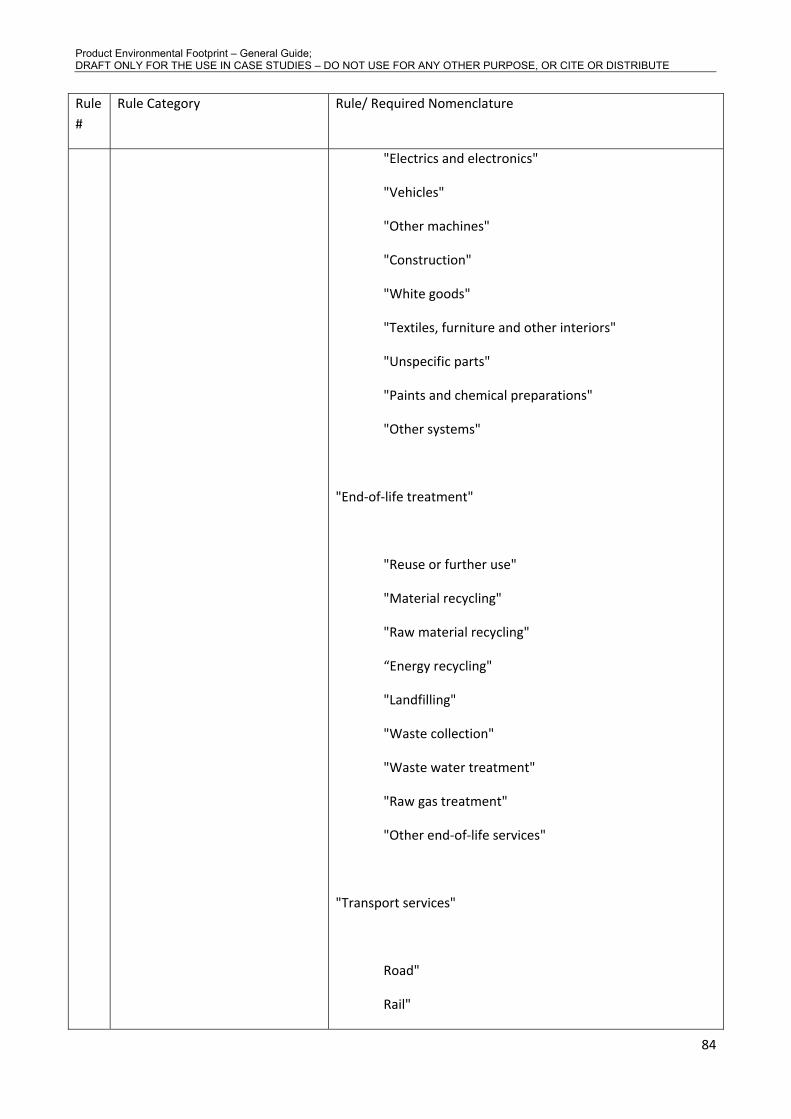
Product Environmental Footprint – General Guide; DRAFT ONLY FOR THE USE IN CASE STUDIES – DO NOT USE FOR ANY OTHER PURPOSE, OR CITE OR DISTRIBUTE
84
Rule #
Rule Category Rule/ Required Nomenclature
"Electrics and electronics"
"Vehicles"
"Other machines"
"Construction"
"White goods"
"Textiles, furniture and other interiors"
"Unspecific parts"
"Paints and chemical preparations"
"Other systems"
"End-of-life treatment"
"Reuse or further use"
"Material recycling"
"Raw material recycling"
“Energy recycling"
"Landfilling"
"Waste collection"
"Waste water treatment"
"Raw gas treatment"
"Other end-of-life services"
"Transport services"
Road"
Rail"
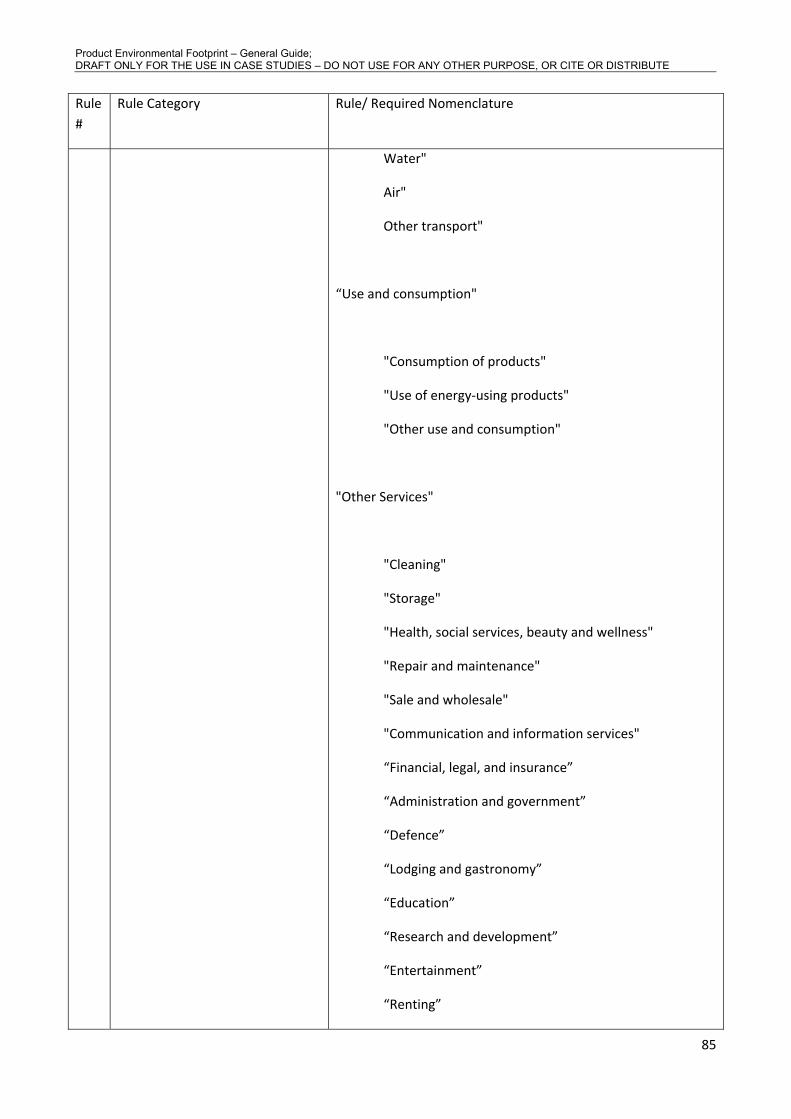
Product Environmental Footprint – General Guide; DRAFT ONLY FOR THE USE IN CASE STUDIES – DO NOT USE FOR ANY OTHER PURPOSE, OR CITE OR DISTRIBUTE
85
Rule #
Rule Category Rule/ Required Nomenclature
Water"
Air"
Other transport"
“Use and consumption"
"Consumption of products"
"Use of energy-using products"
"Other use and consumption"
"Other Services"
"Cleaning"
"Storage"
"Health, social services, beauty and wellness"
"Repair and maintenance"
"Sale and wholesale"
"Communication and information services"
“Financial, legal, and insurance”
“Administration and government”
“Defence”
“Lodging and gastronomy”
“Education”
“Research and development”
“Entertainment”
“Renting”

Product Environmental Footprint – General Guide; DRAFT ONLY FOR THE USE IN CASE STUDIES – DO NOT USE FOR ANY OTHER PURPOSE, OR CITE OR DISTRIBUTE
86
Rule #
Rule Category Rule/ Required Nomenclature
“Engineering and consulting”
"Other services"
NOMENCLATURE FOR FLOWS AND PROCESSES
STRUCTURING FLOW NAMES
12 General flow and process naming rules
the entries within the same name component field should be listed separated by the character ",". Within the entries of the various name component fields the character ";" should be avoided
abbreviations should be avoided in the base name field, unless these are very widely in use and complement the long name in the name field (e.g. do not use "PP" for "Polypropylene", but it can be added as "Polypropylene, PP") or chemical element symbols (e.g. do not use "Fe" for "Iron"). Chemical symbols can be used in the "Quantitative flow properties" field to indicate concentrations (e.g. "45% Fe" for an iron ore can be used).
brackets within the field entries should be avoided
13 “Base name” field Definition: "General descriptive name of the flow. Technical language should be used."
Additional recommendations: The technical name should be given as it is used in the respective industry or towards their customers. For emissions the "base name" is the only one to be used; for certain resource flows also the last name component "quantitative flow properties" (see more below) is required, e.g. for energetic raw materials such as "Hard coal; 32.7 MJ/kg net calorific value". Recommendations for land use flows will depend on further developments in the LCIA area.

Product Environmental Footprint – General Guide; DRAFT ONLY FOR THE USE IN CASE STUDIES – DO NOT USE FOR ANY OTHER PURPOSE, OR CITE OR DISTRIBUTE
87
Rule #
Rule Category Rule/ Required Nomenclature
14 “Treatment, standards, routes” name field
Definition: "Qualitative information on the (product or waste) flow in technical term(s): treatment received, standard fulfilled, product quality, use information, production route name, educt name, primary / secondary etc. separated by commata."
Additional recommendations and examples: Examples for types of terms that should be used preferably are:
o For "treatment received": e.g. "polished", "cleaned", "chromium plated", "sterilised", etc.
o For "standard fulfilled": technical standards such as for material grades/purity, fulfilled emission limits, etc.
o For "product quality": other qualitative information such as e.g. "glossy", "UV-resistant", "flame-retardant", "antibacterial finishing", etc.
o For "use information": e.g. "indoor use", "bottle grade", "for wafer production", etc.
o For "production route name": process or production route used for producing this product, such as "suspension polymerisation", "spray dried", "Fischer-Tropsch", etc.
o For "educt name": main in-going products ("educts") in case different routes exist may be needed, such as "from ore roasting" for sulphuric acid, "pine wood" for timber, etc. (note that in practice often the educt is part of the commonly used base name, e.g. "Pine wood table").
o For "primary / secondary": "primary", "secondary"; for mixes with a fixed share of primary/secondary it should be enough to quantify the shares in the next name field on "Quantitative flow properties".
15 “Mix type and location type” name field
Definition: "Specifying information on the (product or waste) flow whether being a production mixture or consumption mix, location type of availability (such as e.g. "to consumer" or "at plant"), separated by commata."
Additional recommendations and examples:
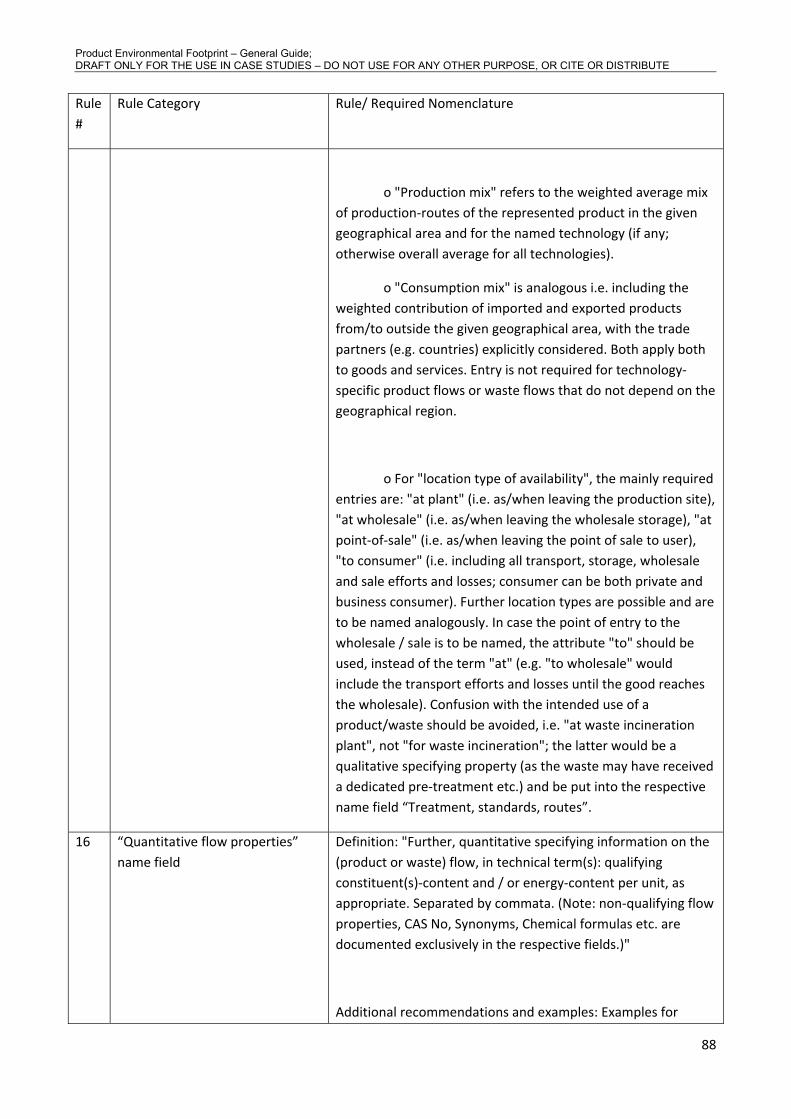
Product Environmental Footprint – General Guide; DRAFT ONLY FOR THE USE IN CASE STUDIES – DO NOT USE FOR ANY OTHER PURPOSE, OR CITE OR DISTRIBUTE
88
Rule #
Rule Category Rule/ Required Nomenclature
o "Production mix" refers to the weighted average mix of production-routes of the represented product in the given geographical area and for the named technology (if any; otherwise overall average for all technologies).
o "Consumption mix" is analogous i.e. including the weighted contribution of imported and exported products from/to outside the given geographical area, with the trade partners (e.g. countries) explicitly considered. Both apply both to goods and services. Entry is not required for technology-specific product flows or waste flows that do not depend on the geographical region.
o For "location type of availability", the mainly required entries are: "at plant" (i.e. as/when leaving the production site), "at wholesale" (i.e. as/when leaving the wholesale storage), "at point-of-sale" (i.e. as/when leaving the point of sale to user), "to consumer" (i.e. including all transport, storage, wholesale and sale efforts and losses; consumer can be both private and business consumer). Further location types are possible and are to be named analogously. In case the point of entry to the wholesale / sale is to be named, the attribute "to" should be used, instead of the term "at" (e.g. "to wholesale" would include the transport efforts and losses until the good reaches the wholesale). Confusion with the intended use of a product/waste should be avoided, i.e. "at waste incineration plant", not "for waste incineration"; the latter would be a qualitative specifying property (as the waste may have received a dedicated pre-treatment etc.) and be put into the respective name field “Treatment, standards, routes”.
16 “Quantitative flow properties” name field
Definition: "Further, quantitative specifying information on the (product or waste) flow, in technical term(s): qualifying constituent(s)-content and / or energy-content per unit, as appropriate. Separated by commata. (Note: non-qualifying flow properties, CAS No, Synonyms, Chemical formulas etc. are documented exclusively in the respective fields.)"
Additional recommendations and examples: Examples for

Product Environmental Footprint – General Guide; DRAFT ONLY FOR THE USE IN CASE STUDIES – DO NOT USE FOR ANY OTHER PURPOSE, OR CITE OR DISTRIBUTE
89
Rule #
Rule Category Rule/ Required Nomenclature
which kind of terms should be used preferably are:
o For "qualifying constituent(s)-content and / or energy-content per unit": quantitative element-, substance-, or energy-content, expressed in units per unit of a relevant other flow property. Examples: "24% Fe", "9.6 MJ/kg net calorific value", "90.5% methane by volume". Note that often the units are not required explicitly; e.g. "24% Fe" refers per default to "mass/mass". If another relation is meant, this one has to be given explicitly, of course, e.g. "24% Fe molar" for chemical interim products or e.g. "13.5% ethanol by volume" for wine. Any ambiguity should be avoided, of course.
17 Naming pattern of flows and processes
<“Base name”; “Treatment, standards, routes”; “Mix type and location type”; “Quantitative flow properties”>.
NAMING OF ELEMENTARY FLOWS
18 Naming of elementary flows Substances and materials should be given a lower case first letter. Brand names should be given a upper case first letter (E.g. "benzene", "1,2,3-trichloro-benzene", "Alachlor").
Isotopes of elements (e.g. used for radioactive substances) are given the IUPAC name plus the isotope number added at the end with a hyphen (e.g. "radon-220").
Particles are to be inventoried via the widely used and understood abbreviation "PM", with further specification of the particle size class (e.g. "PM <2.5μm" or "PM unspecified".)
Salts of O-containing acids are to be named according to the commonly used trivial names as also supported by IUPAC (e.g. “calcium carbonate” better than the name derived from applying the SETAC WG rule, which results in “carbonic acid, calcium salt”).
Other simple chemicals are to be named according to the commonly used trivial names, if widely used (e.g. "methane", "sulphuric acid", "acetone", etc.).
Pesticides should be named by their commonly used trivial or even brand names when commonly used as trivial names across industry (e.g. "Alachlor" better than "2-chloro-n-

Product Environmental Footprint – General Guide; DRAFT ONLY FOR THE USE IN CASE STUDIES – DO NOT USE FOR ANY OTHER PURPOSE, OR CITE OR DISTRIBUTE
90
Rule #
Rule Category Rule/ Required Nomenclature
(2,6-diethylphenyl)-n-(methoxymethyl)-acetamide").
Artificial splitting of fixed technical terms with change of order of the name fragments is to be avoided (e.g. "hard coal" better than “coal, hard”; the complete flow name should comprise quantitative flow properties information, e.g. "hard coal; 32.7 MJ/kg net calorific value", of course).
The attributes of flows "to" for emissions and "in" for resources as foreseen in the SETAC WG document are redundant, as this information is already given by the class the flow belongs to (e.g. "Emissions to air"), as this is part of the elementary flow identifying information. For the sake of shortening the flow names this info is not be doubled in the flow name.
The “…, ion” variants of metal emissions are to be joined with the elemental flow, with the exception of chromium (e.g. the flow “iron” to water should represent all variants, i.e. Fe III, Fe II, organically bound or ionic or complexed iron and metallic Fe to water; note that NO "ion" information is inn the name.). The only exception are the commonly used flows “chromium III” and “chromium VI” ions, while a joint flow “chromium, unspecified” is required, too, that one joining also metallic chromium. (To be revised in view of further developed LCIA methods.)
Substituted organics are to be named applying the former IUPAC recommendation, that was in place until the late 1990ies and is still widely preferred in industry practice (e.g. “1,2,3-trichloro-benzene“ better than the new IUPAC pattern that was recommended by the SETAC WG “benzene, 1,2,3-trichloro-“).
CFCs and HCFCs are to be named using their trivial name. The full chemical name is to be given in the “Synonyms” field only (e.g. “HFC-227” as flow name with the chemical name "1,1,1,2,3,3,3-heptafluoro-propane" only in the "Synonyms" field).
Carbon dioxide and methane are to be separately inventoried whether from biogenic or fossil sources, both as emission and resource (the latter e.g. from uptake into biomass); the source is added at the end of the base name separated by a comma. (E.g. "carbon dioxide, fossil", "methane,
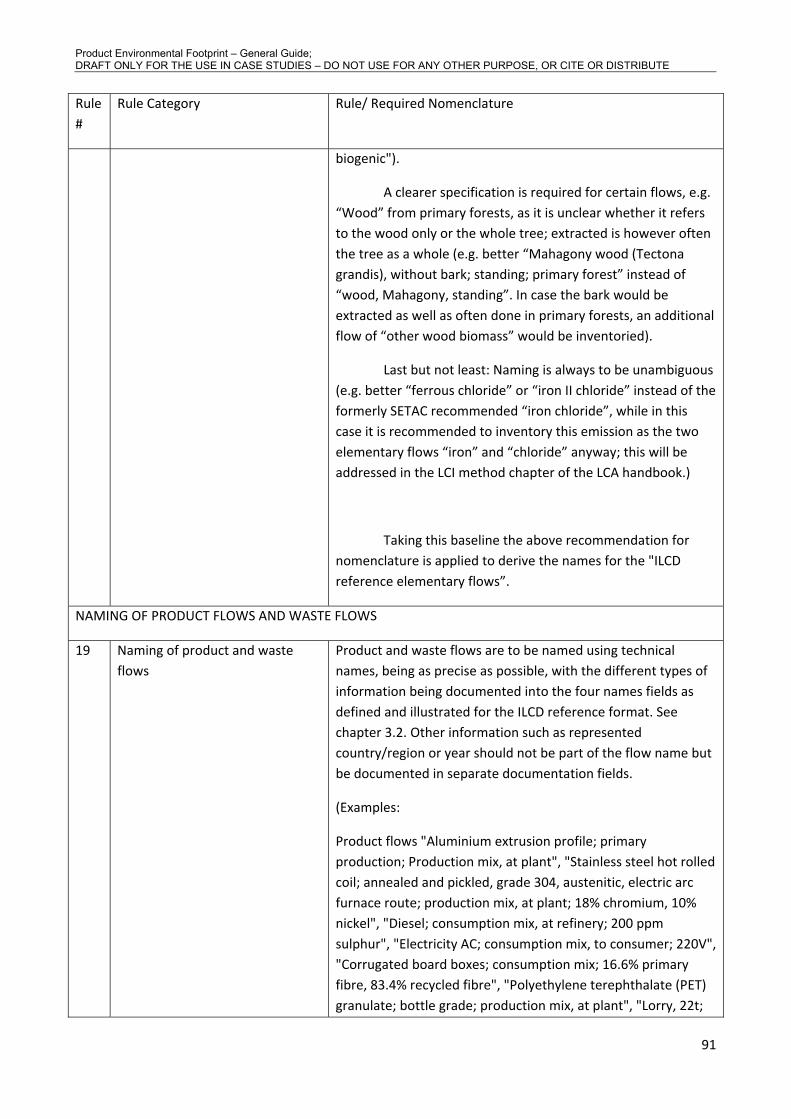
Product Environmental Footprint – General Guide; DRAFT ONLY FOR THE USE IN CASE STUDIES – DO NOT USE FOR ANY OTHER PURPOSE, OR CITE OR DISTRIBUTE
91
Rule #
Rule Category Rule/ Required Nomenclature
biogenic").
A clearer specification is required for certain flows, e.g. “Wood” from primary forests, as it is unclear whether it refers to the wood only or the whole tree; extracted is however often the tree as a whole (e.g. better “Mahagony wood (Tectona grandis), without bark; standing; primary forest” instead of “wood, Mahagony, standing”. In case the bark would be extracted as well as often done in primary forests, an additional flow of “other wood biomass” would be inventoried).
Last but not least: Naming is always to be unambiguous (e.g. better “ferrous chloride” or “iron II chloride” instead of the formerly SETAC recommended “iron chloride”, while in this case it is recommended to inventory this emission as the two elementary flows “iron” and “chloride” anyway; this will be addressed in the LCI method chapter of the LCA handbook.)
Taking this baseline the above recommendation for nomenclature is applied to derive the names for the "ILCD reference elementary flows”.
NAMING OF PRODUCT FLOWS AND WASTE FLOWS
19 Naming of product and waste flows
Product and waste flows are to be named using technical names, being as precise as possible, with the different types of information being documented into the four names fields as defined and illustrated for the ILCD reference format. See chapter 3.2. Other information such as represented country/region or year should not be part of the flow name but be documented in separate documentation fields.
(Examples:
Product flows "Aluminium extrusion profile; primary production; Production mix, at plant", "Stainless steel hot rolled coil; annealed and pickled, grade 304, austenitic, electric arc furnace route; production mix, at plant; 18% chromium, 10% nickel", "Diesel; consumption mix, at refinery; 200 ppm sulphur", "Electricity AC; consumption mix, to consumer; 220V", "Corrugated board boxes; consumption mix; 16.6% primary fibre, 83.4% recycled fibre", "Polyethylene terephthalate (PET) granulate; bottle grade; production mix, at plant", "Lorry, 22t;
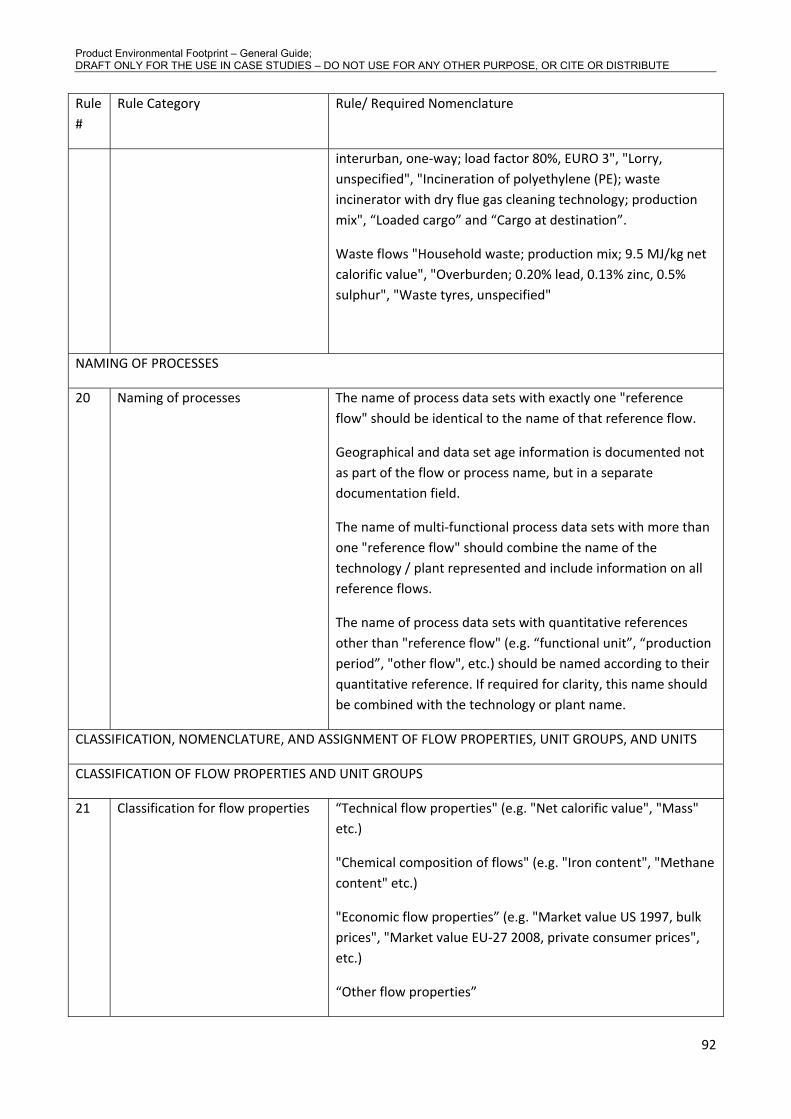
Product Environmental Footprint – General Guide; DRAFT ONLY FOR THE USE IN CASE STUDIES – DO NOT USE FOR ANY OTHER PURPOSE, OR CITE OR DISTRIBUTE
92
Rule #
Rule Category Rule/ Required Nomenclature
interurban, one-way; load factor 80%, EURO 3", "Lorry, unspecified", "Incineration of polyethylene (PE); waste incinerator with dry flue gas cleaning technology; production mix", “Loaded cargo” and “Cargo at destination”.
Waste flows "Household waste; production mix; 9.5 MJ/kg net calorific value", "Overburden; 0.20% lead, 0.13% zinc, 0.5% sulphur", "Waste tyres, unspecified"
NAMING OF PROCESSES
20 Naming of processes The name of process data sets with exactly one "reference flow" should be identical to the name of that reference flow.
Geographical and data set age information is documented not as part of the flow or process name, but in a separate documentation field.
The name of multi-functional process data sets with more than one "reference flow" should combine the name of the technology / plant represented and include information on all reference flows.
The name of process data sets with quantitative references other than "reference flow" (e.g. “functional unit”, “production period”, "other flow", etc.) should be named according to their quantitative reference. If required for clarity, this name should be combined with the technology or plant name.
CLASSIFICATION, NOMENCLATURE, AND ASSIGNMENT OF FLOW PROPERTIES, UNIT GROUPS, AND UNITS
CLASSIFICATION OF FLOW PROPERTIES AND UNIT GROUPS
21 Classification for flow properties “Technical flow properties" (e.g. "Net calorific value", "Mass" etc.)
"Chemical composition of flows" (e.g. "Iron content", "Methane content" etc.)
"Economic flow properties” (e.g. "Market value US 1997, bulk prices", "Market value EU-27 2008, private consumer prices", etc.)
“Other flow properties”
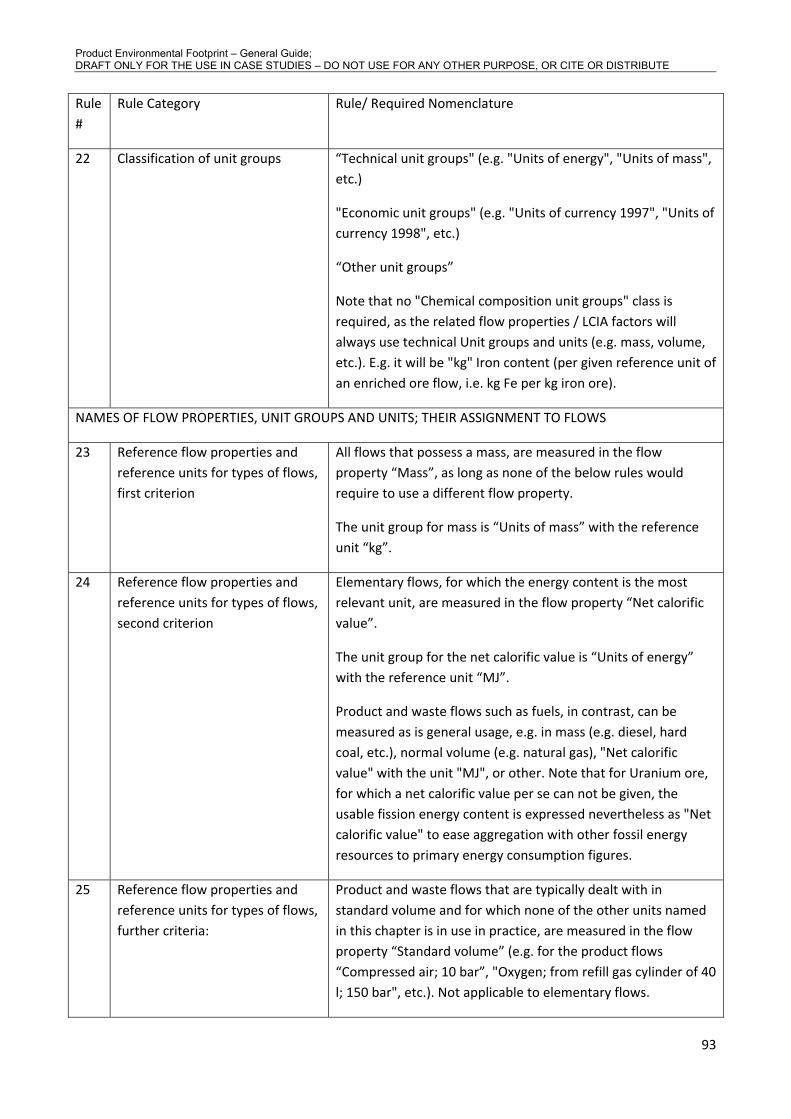
Product Environmental Footprint – General Guide; DRAFT ONLY FOR THE USE IN CASE STUDIES – DO NOT USE FOR ANY OTHER PURPOSE, OR CITE OR DISTRIBUTE
93
Rule #
Rule Category Rule/ Required Nomenclature
22 Classification of unit groups “Technical unit groups" (e.g. "Units of energy", "Units of mass", etc.)
"Economic unit groups" (e.g. "Units of currency 1997", "Units of currency 1998", etc.)
“Other unit groups”
Note that no "Chemical composition unit groups" class is required, as the related flow properties / LCIA factors will always use technical Unit groups and units (e.g. mass, volume, etc.). E.g. it will be "kg" Iron content (per given reference unit of an enriched ore flow, i.e. kg Fe per kg iron ore).
NAMES OF FLOW PROPERTIES, UNIT GROUPS AND UNITS; THEIR ASSIGNMENT TO FLOWS
23 Reference flow properties and reference units for types of flows, first criterion
All flows that possess a mass, are measured in the flow property “Mass”, as long as none of the below rules would require to use a different flow property.
The unit group for mass is “Units of mass” with the reference unit “kg”.
24 Reference flow properties and reference units for types of flows, second criterion
Elementary flows, for which the energy content is the most relevant unit, are measured in the flow property “Net calorific value”.
The unit group for the net calorific value is “Units of energy” with the reference unit “MJ”.
Product and waste flows such as fuels, in contrast, can be measured as is general usage, e.g. in mass (e.g. diesel, hard coal, etc.), normal volume (e.g. natural gas), "Net calorific value" with the unit "MJ", or other. Note that for Uranium ore, for which a net calorific value per se can not be given, the usable fission energy content is expressed nevertheless as "Net calorific value" to ease aggregation with other fossil energy resources to primary energy consumption figures.
25 Reference flow properties and reference units for types of flows, further criteria:
Product and waste flows that are typically dealt with in standard volume and for which none of the other units named in this chapter is in use in practice, are measured in the flow property “Standard volume” (e.g. for the product flows “Compressed air; 10 bar”, "Oxygen; from refill gas cylinder of 40 l; 150 bar", etc.). Not applicable to elementary flows.

Product Environmental Footprint – General Guide; DRAFT ONLY FOR THE USE IN CASE STUDIES – DO NOT USE FOR ANY OTHER PURPOSE, OR CITE OR DISTRIBUTE
94
Rule #
Rule Category Rule/ Required Nomenclature
The unit group is “Units of volume” with the reference unit “m3”.
Elementary flows for which the substance’s radioactivity is in focus, are measured in the flow property “Radioactivity” (e.g. elementary flow "thallium-201").
The unit group is “Units of radioactivity” with the reference unit “kBq”, i.e. Kilo-Becquerel.
Flows that are typically dealt with in number of items are measured in the flow property “Number” (e.g. product flows "Spare tyre passenger car; generic average", "Milk cow; Holstein, alive, start of lactation" etc.).
The unit group is “Units of items” with the reference unit “Item(s)".
Product and waste flows that are typically dealt with in length or distance are measured in the flow property “Length” (e.g. product flows "Welding seam; MIG/MAG, steel on steel" and "Water pipe; copper; max 5 bar, 15mm diameter", etc.). Not applicable to elementary flows.
The unit group is “Units of length” with the reference unit “m”.
Product and waste flows that are typically dealt with in duration are measured in the flow property “Time” (e.g. product flow / functional unit "Storage in warehouse; unheated"). Not applicable to elementary flows.
The unit group is “Units of time” with the reference unit “d”, i.e. days.
Product and waste flows that are typically dealt with in weight multiplied with distance are measured in the flow property “Mass*length” (e.g. product flow / functional unit "Road transport; bulk goods, generic mix; long distance"). Not
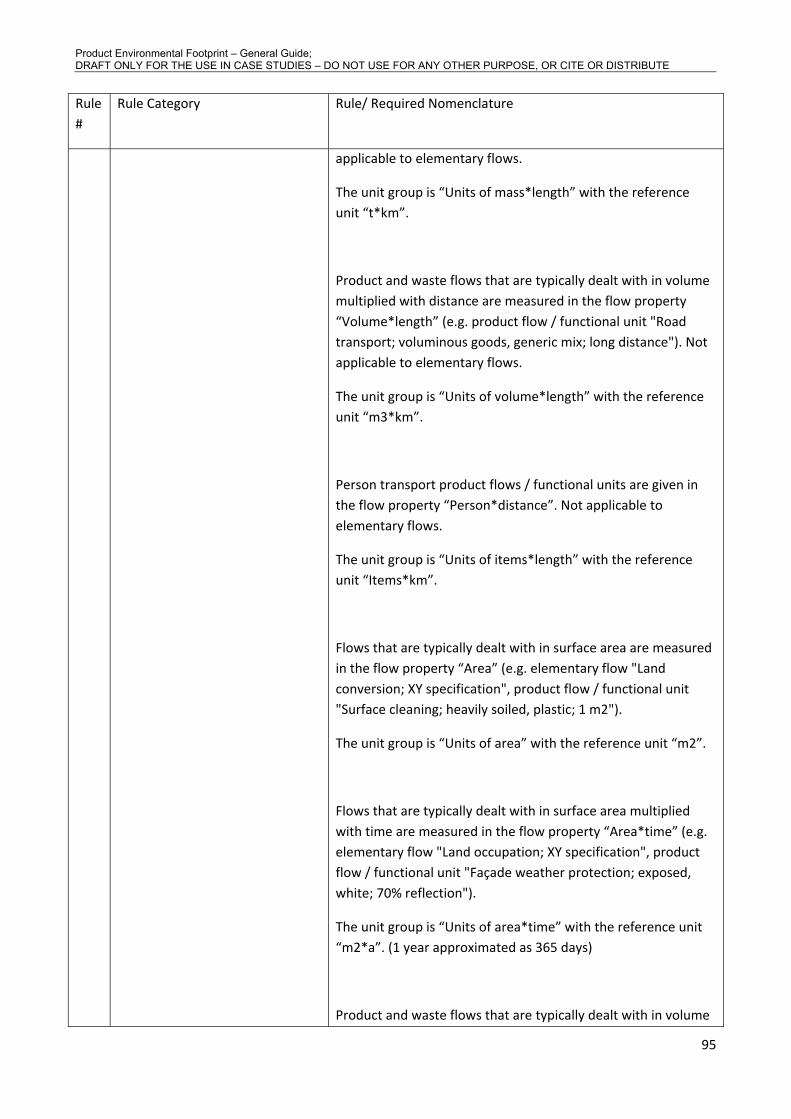
Product Environmental Footprint – General Guide; DRAFT ONLY FOR THE USE IN CASE STUDIES – DO NOT USE FOR ANY OTHER PURPOSE, OR CITE OR DISTRIBUTE
95
Rule #
Rule Category Rule/ Required Nomenclature
applicable to elementary flows.
The unit group is “Units of mass*length” with the reference unit “t*km”.
Product and waste flows that are typically dealt with in volume multiplied with distance are measured in the flow property “Volume*length” (e.g. product flow / functional unit "Road transport; voluminous goods, generic mix; long distance"). Not applicable to elementary flows.
The unit group is “Units of volume*length” with the reference unit “m3*km”.
Person transport product flows / functional units are given in the flow property “Person*distance”. Not applicable to elementary flows.
The unit group is “Units of items*length” with the reference unit “Items*km”.
Flows that are typically dealt with in surface area are measured in the flow property “Area” (e.g. elementary flow "Land conversion; XY specification", product flow / functional unit "Surface cleaning; heavily soiled, plastic; 1 m2").
The unit group is “Units of area” with the reference unit “m2”.
Flows that are typically dealt with in surface area multiplied with time are measured in the flow property “Area*time” (e.g. elementary flow "Land occupation; XY specification", product flow / functional unit "Façade weather protection; exposed, white; 70% reflection").
The unit group is “Units of area*time” with the reference unit “m2*a”. (1 year approximated as 365 days)
Product and waste flows that are typically dealt with in volume

Product Environmental Footprint – General Guide; DRAFT ONLY FOR THE USE IN CASE STUDIES – DO NOT USE FOR ANY OTHER PURPOSE, OR CITE OR DISTRIBUTE
96
Rule #
Rule Category Rule/ Required Nomenclature
multiplied with time are measured in the flow property “Volume*time” (e.g. product flow / functional unit "Landfill occupation"). Not applicable to elementary flows.
The unit group is “Units of volume*time” with the reference unit “m3*a”. (1 year approximated as 365 days)
For products where the content of specific elements or of well defined chemical compounds is of interest, the respective information should be given as secondary flow property for conversion, display or modelling purposes. This is done using flow properties of the type “Substance/element X content”, e.g. “Cadmium content”, “Ammonia content”, “Water content”, “Methane content” etc. (Nomenclature for the element or substance name should be identical to the one for these elements or substances as given elsewhere in this document).
Depending on the specific interest, the information can be given in mass or volume units: E.g. “Iron content” in the product flow “Iron ore, enriched; floating …” as mass information or “Methane content” in the product flow “Natural gas; …” volumetric. The required “Unit group data set” is then the same as already defined “Units of mass” and “Units of volume”, i.e. there is no necessity to define new Unit group data sets.
For product and waste flows where the economic value should be given (typically as secondary flow property for allocation purposes or cost calculation in Life Cycle Costing) this is done using the flow property “Market value”, which is further specified as required, typically referring to the country or region, time period, and wholesale/retail etc. situation, by adding the respective information: E.g. "Market value US 1997, bulk prices", "Market value EU 2000, private consumer prices". (Can be used for e.g. product / waste / elementary flows "Gold", "Waste tyres", "Carbon dioxide", etc.).
The unit group name is formed by the combination of the string "Units of currency" and an addition that characterises the time period to which it refers, e.g. "1997", "1990-1999", "May 1995" etc., e.g. “Units of currency 1997” with the reference unit
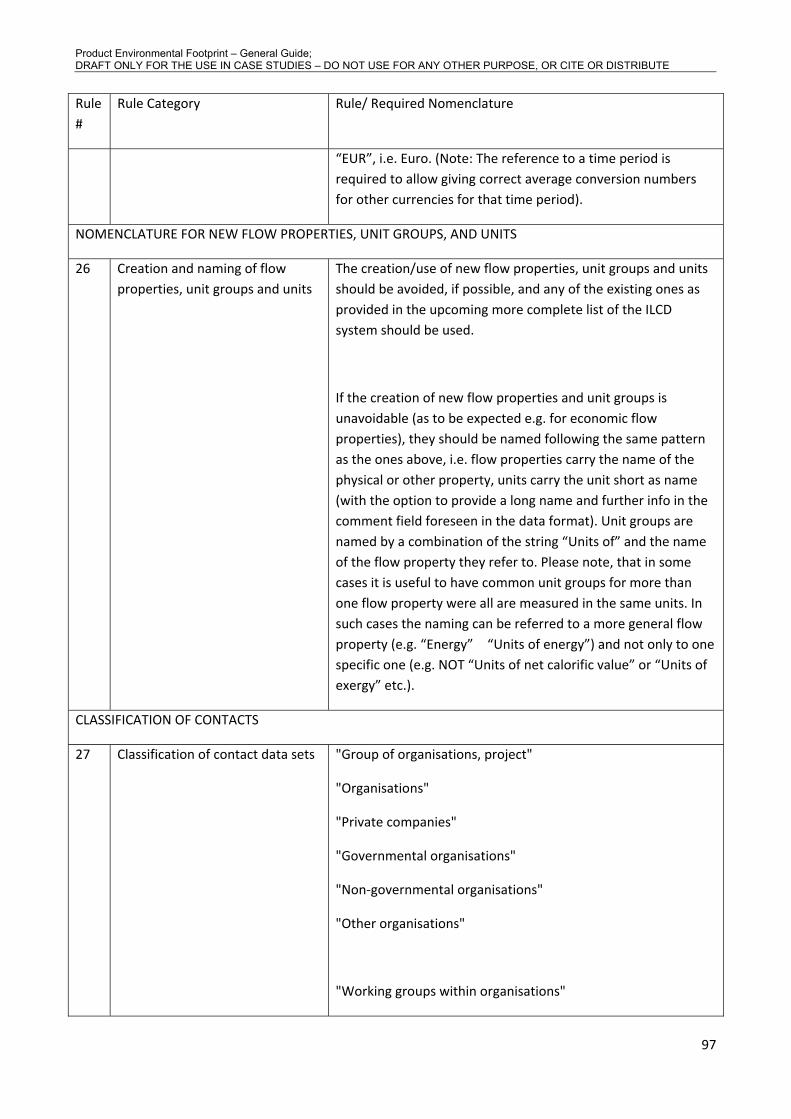
Product Environmental Footprint – General Guide; DRAFT ONLY FOR THE USE IN CASE STUDIES – DO NOT USE FOR ANY OTHER PURPOSE, OR CITE OR DISTRIBUTE
97
Rule #
Rule Category Rule/ Required Nomenclature
“EUR”, i.e. Euro. (Note: The reference to a time period is required to allow giving correct average conversion numbers for other currencies for that time period).
NOMENCLATURE FOR NEW FLOW PROPERTIES, UNIT GROUPS, AND UNITS
26 Creation and naming of flow properties, unit groups and units
The creation/use of new flow properties, unit groups and units should be avoided, if possible, and any of the existing ones as provided in the upcoming more complete list of the ILCD system should be used.
If the creation of new flow properties and unit groups is unavoidable (as to be expected e.g. for economic flow properties), they should be named following the same pattern as the ones above, i.e. flow properties carry the name of the physical or other property, units carry the unit short as name (with the option to provide a long name and further info in the comment field foreseen in the data format). Unit groups are named by a combination of the string “Units of” and the name of the flow property they refer to. Please note, that in some cases it is useful to have common unit groups for more than one flow property were all are measured in the same units. In such cases the naming can be referred to a more general flow property (e.g. “Energy” � “Units of energy”) and not only to one specific one (e.g. NOT “Units of net calorific value” or “Units of exergy” etc.).
CLASSIFICATION OF CONTACTS
27 Classification of contact data sets "Group of organisations, project"
"Organisations"
"Private companies"
"Governmental organisations"
"Non-governmental organisations"
"Other organisations"
"Working groups within organisations"

Product Environmental Footprint – General Guide; DRAFT ONLY FOR THE USE IN CASE STUDIES – DO NOT USE FOR ANY OTHER PURPOSE, OR CITE OR DISTRIBUTE
98
Rule #
Rule Category Rule/ Required Nomenclature
"Persons"
"Other"
CLASSIFICATION OF SOURCES
28 Classification of source data sets "Images"
"Data set formats"
"Databases"
"Compliance systems"
"Statistical classifications"
"Publications and communications"
"Other source types"
Example of Identifying Appropriate Nomenclature and Properties for Specific Flows
Raw material, Input: Crude oil (Rules 2,4,5)
(1)Specify "elementary flow category" by receiving / providing environmental compartment:
Example: Resources - Resources from ground
(2) Further differentiation of providing/receiving environmental compartments
Example: Non-renewable energy resources from ground
(3)additional, non-identifying classification for "Resources from ground" elementary flows
Example:
Example: Non-renewable energy resources from ground ” (e.g. "Crude oil; 42.3 MJ/kg net calorific value")
Flow data set: Crude oil: 42.3 MJ/kg net calorific value
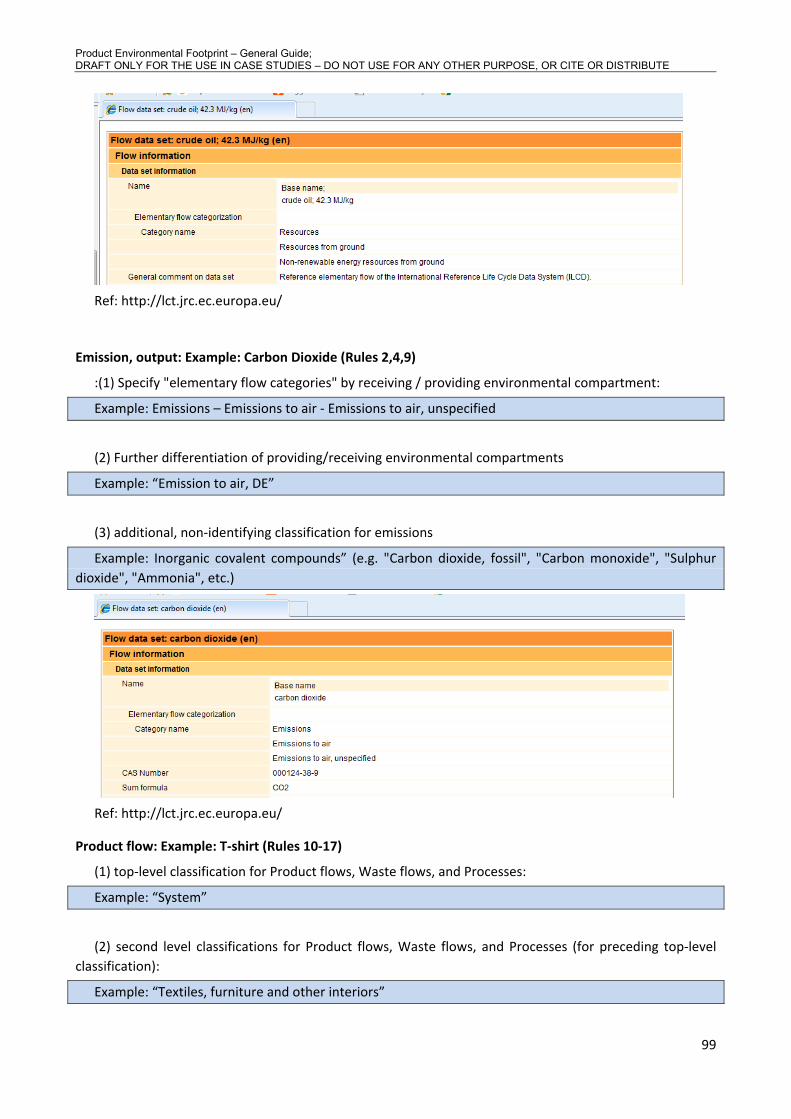
Product Environmental Footprint – General Guide; DRAFT ONLY FOR THE USE IN CASE STUDIES – DO NOT USE FOR ANY OTHER PURPOSE, OR CITE OR DISTRIBUTE
99
Ref: http://lct.jrc.ec.europa.eu/
Emission, output: Example: Carbon Dioxide (Rules 2,4,9)
:(1) Specify "elementary flow categories" by receiving / providing environmental compartment:
Example: Emissions – Emissions to air - Emissions to air, unspecified
(2) Further differentiation of providing/receiving environmental compartments
Example: “Emission to air, DE”
(3) additional, non-identifying classification for emissions
Example: Inorganic covalent compounds” (e.g. "Carbon dioxide, fossil", "Carbon monoxide", "Sulphur dioxide", "Ammonia", etc.)
Ref: http://lct.jrc.ec.europa.eu/
Product flow: Example: T-shirt (Rules 10-17)
(1) top-level classification for Product flows, Waste flows, and Processes:
Example: “System”
(2) second level classifications for Product flows, Waste flows, and Processes (for preceding top-level classification):
Example: “Textiles, furniture and other interiors”

Product Environmental Footprint – General Guide; DRAFT ONLY FOR THE USE IN CASE STUDIES – DO NOT USE FOR ANY OTHER PURPOSE, OR CITE OR DISTRIBUTE
100
(3) “Base name” field:
Example: “Base Name: White polyester Tshirt”
(4) “Treatment, standards, routes” name field:
Example: “ ”
(5) “Mix type and location type” name field:
“Production mix, at point of sale”
(6) “Quantitative flow properties” name field:
Example: “160 grams polyester”
(7) naming pattern of flows and processes.
<“Base name”; “Treatment, standards, routes”; “Mix type and location type”; “Quantitative flow properties”>.
Example: “White polyester Tshirt; product mix at point of sale; 160 grams polyester”
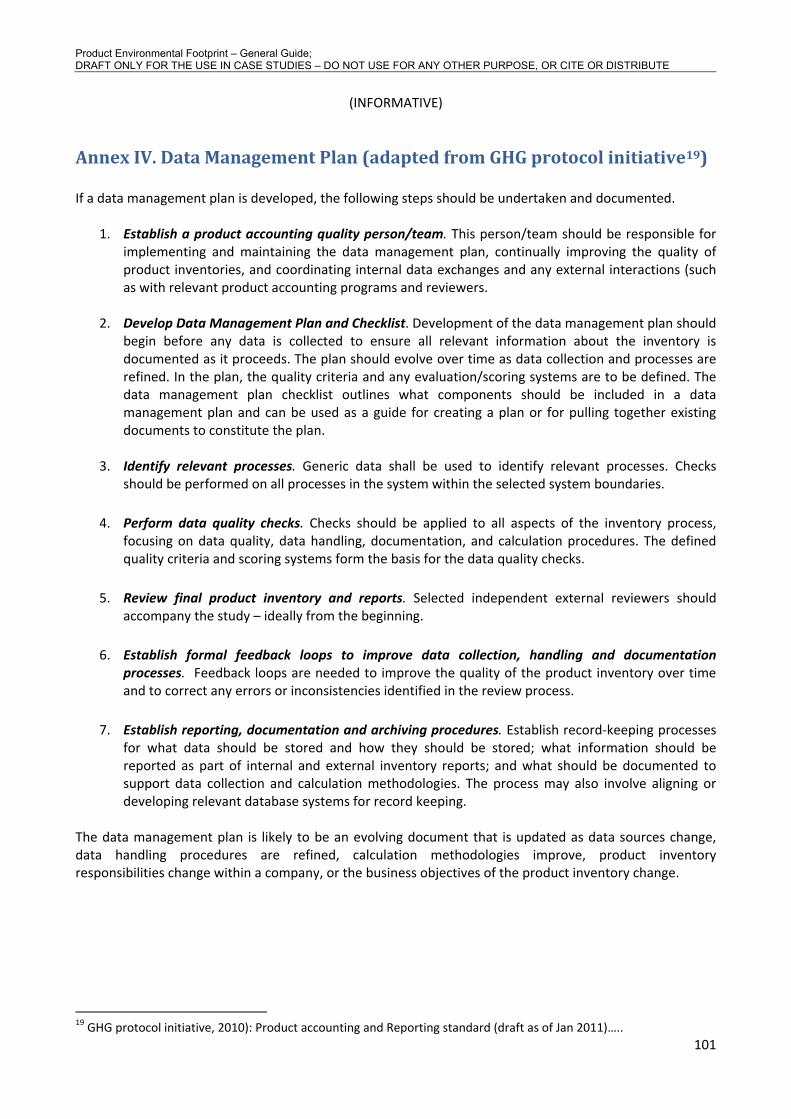
Product Environmental Footprint – General Guide; DRAFT ONLY FOR THE USE IN CASE STUDIES – DO NOT USE FOR ANY OTHER PURPOSE, OR CITE OR DISTRIBUTE
101
(INFORMATIVE)
Annex IV. Data Management Plan (adapted from GHG protocol initiative19) If a data management plan is developed, the following steps should be undertaken and documented.
1. Establish a product accounting quality person/team. This person/team should be responsible for implementing and maintaining the data management plan, continually improving the quality of product inventories, and coordinating internal data exchanges and any external interactions (such as with relevant product accounting programs and reviewers.
2. Develop Data Management Plan and Checklist. Development of the data management plan should
begin before any data is collected to ensure all relevant information about the inventory is documented as it proceeds. The plan should evolve over time as data collection and processes are refined. In the plan, the quality criteria and any evaluation/scoring systems are to be defined. The data management plan checklist outlines what components should be included in a data management plan and can be used as a guide for creating a plan or for pulling together existing documents to constitute the plan.
3. Identify relevant processes. Generic data shall be used to identify relevant processes. Checks
should be performed on all processes in the system within the selected system boundaries.
4. Perform data quality checks. Checks should be applied to all aspects of the inventory process, focusing on data quality, data handling, documentation, and calculation procedures. The defined quality criteria and scoring systems form the basis for the data quality checks.
5. Review final product inventory and reports. Selected independent external reviewers should
accompany the study – ideally from the beginning.
6. Establish formal feedback loops to improve data collection, handling and documentation processes. Feedback loops are needed to improve the quality of the product inventory over time and to correct any errors or inconsistencies identified in the review process.
7. Establish reporting, documentation and archiving procedures. Establish record-keeping processes
for what data should be stored and how they should be stored; what information should be reported as part of internal and external inventory reports; and what should be documented to support data collection and calculation methodologies. The process may also involve aligning or developing relevant database systems for record keeping.
The data management plan is likely to be an evolving document that is updated as data sources change, data handling procedures are refined, calculation methodologies improve, product inventory responsibilities change within a company, or the business objectives of the product inventory change.
19 GHG protocol initiative, 2010): Product accounting and Reporting standard (draft as of Jan 2011)…..

Product Environmental Footprint – General Guide; DRAFT ONLY FOR THE USE IN CASE STUDIES – DO NOT USE FOR ANY OTHER PURPOSE, OR CITE OR DISTRIBUTE
102
Annex V. Example Product Environmental Footprint Report Template

Product Environmental Footprint – General Guide; DRAFT ONLY FOR THE USE IN CASE STUDIES – DO NOT USE FOR ANY OTHER PURPOSE, OR CITE OR DISTRIBUTE
103
Scope of Product Environmental Footprint
Items Description
Unit of Analysis
(functional unit)
Reference flow
Reference time of the study (year/month)
Country/Region of product
System boundary Cradle to cradle
Cradle to grave
Cradle to gate
Gate to gate
Description of system boundary
System boundary diagram
Cut-off criteria
Impact assessment categories covered Impact assessment method use
Data quality requirements
Generic data sources
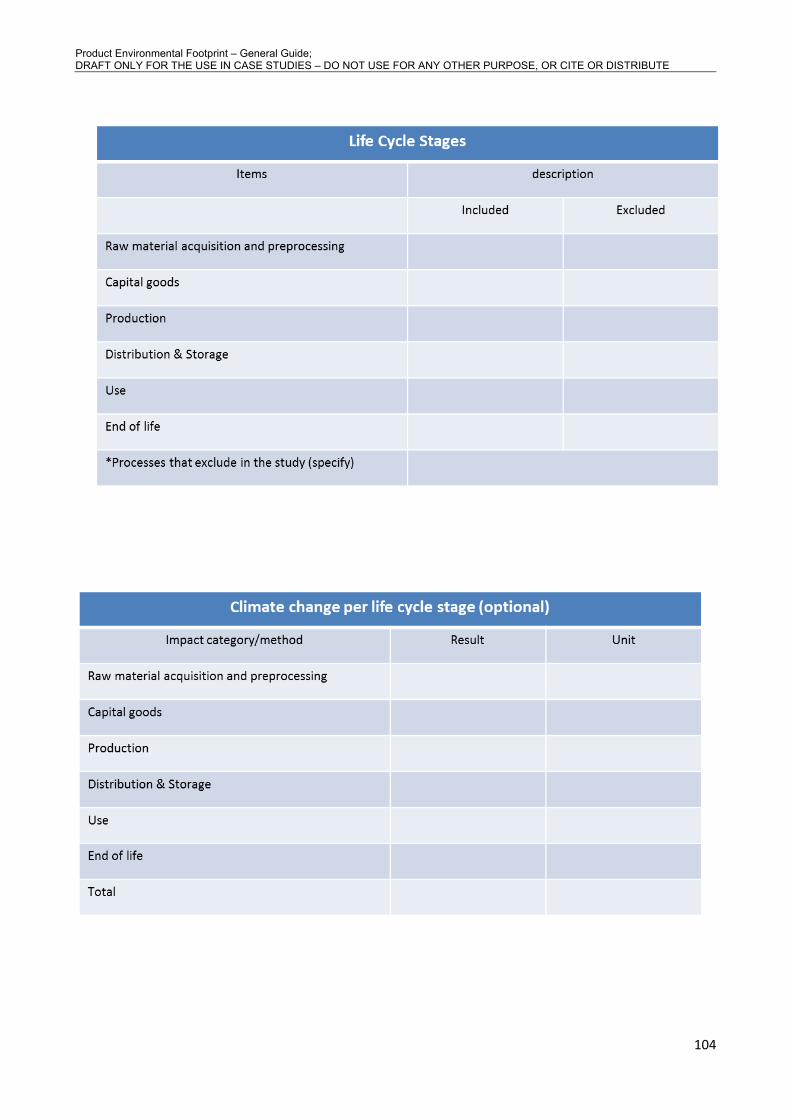
Product Environmental Footprint – General Guide; DRAFT ONLY FOR THE USE IN CASE STUDIES – DO NOT USE FOR ANY OTHER PURPOSE, OR CITE OR DISTRIBUTE
104
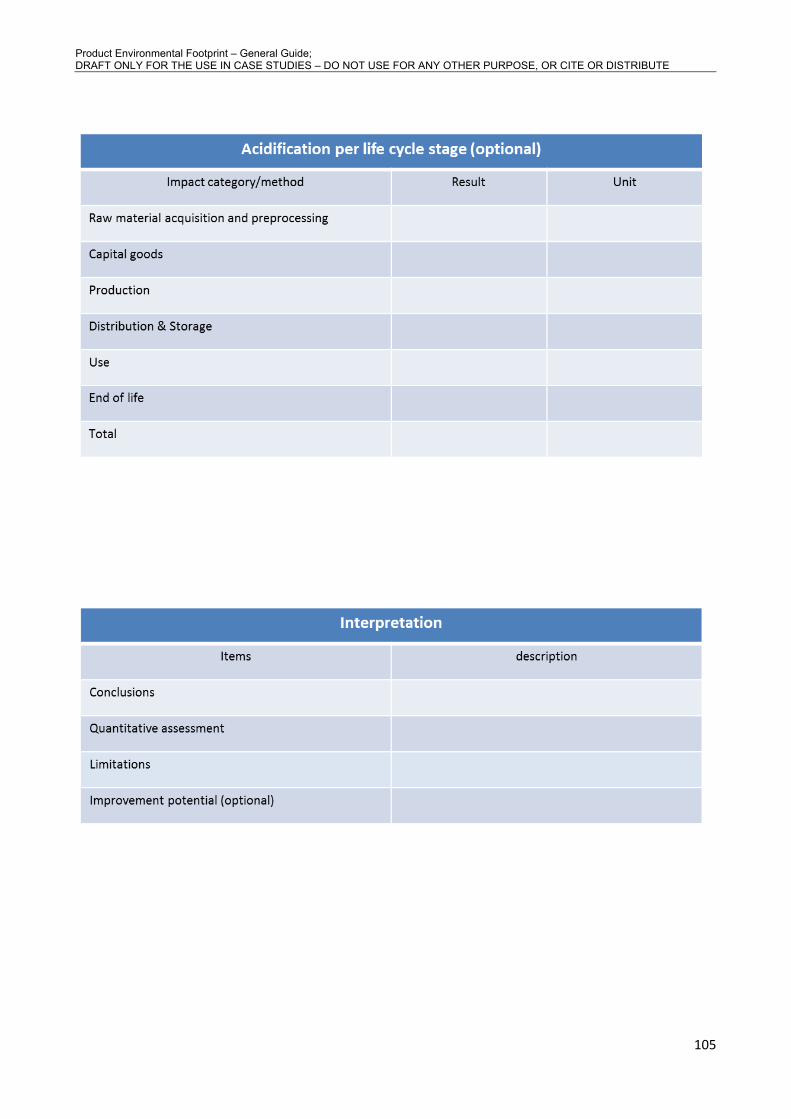
Product Environmental Footprint – General Guide; DRAFT ONLY FOR THE USE IN CASE STUDIES – DO NOT USE FOR ANY OTHER PURPOSE, OR CITE OR DISTRIBUTE
105