Draft outline of initial key messages for Farnborough ... · 2.2. This part of the consultation...
52
Airspace Consultation Part B: Proposed changes below 4,000ft in the vicinity of Farnborough Airport (Affecting Parts of Hampshire, Surrey, West Sussex and Berkshire) Figure B1 Consultation Areas Overview © TAG Farnborough except Ordnance Survey data © Crown copyright and database right 2013 Airfield Farnborough Airport Use PDF zoom tools to study this map more closely Part C Part C Part D Part D Part B N W E S Part B: Farnborough aircraft below 4,000ft Part C: Farnborough aircraft 4,000ft-7,000ft Part D: Southampton and Bournemouth arriving aircraft from the east 4,000ft-7,000ft Part D: Bournemouth arriving aircraft from the east 2,500ft-4,000ft Part C
Transcript of Draft outline of initial key messages for Farnborough ... · 2.2. This part of the consultation...

Airspace Consultation
Part B: Proposed changes below 4,000ft in the vicinity of Farnborough Airport
(Affecting Parts of Hampshire, Surrey, West Sussex and Berkshire)
Figure B1 Consultation Areas Overview
© TAG Farnborough
except Ordnance Survey data ©
Crown copyright and database right 2013
Airfield
Farnborough
Airport
Use PDF zoom tools
to study this map
more closely
Part C
Part C
Part DPart D
Part B
N
W E
S
Part B: Farnborough aircraft
below 4,000ft
Part C: Farnborough aircraft
4,000ft-7,000ft
Part D: Southampton and
Bournemouth arriving aircraft
from the east 4,000ft-7,000ft
Part D: Bournemouth arriving
aircraft from the east 2,500ft-4,000ft
Part
C

Airspace Consultation
Contents
Page B2 Part B: Proposed Changes below 4,000ft in the vicinity of Farnborough Airport
Contents
1. Introduction to Part B .......................................................................................... 5
2. Today’s airspace usage ........................................................................................ 9
3. Objectives and justification for proposed changes below 4,000ft .............................. 16
4. Local considerations for route positioning .............................................................. 21
5. Northern dashed blue area – GA impact in the vicinity ............................................ 45
6. Western blue dashed area - RAF Odiham – Changes to departure routes ................... 47
7. Changes above 4,000ft ....................................................................................... 52
List of Figures
Figure B1: Consultation areas overview ........................................................................ 5
Figure B2: Consultation areas in the vicinity of Farnborough ........................................... 7
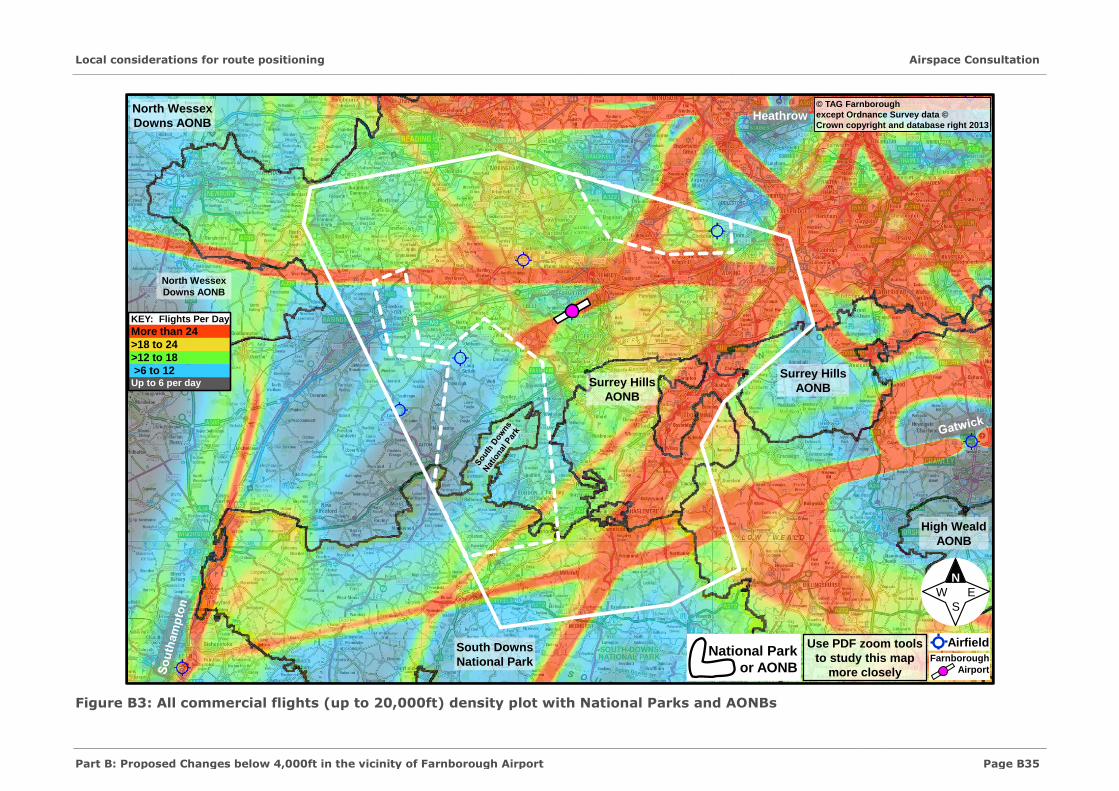
Figure B3: All commercial flights (up to 20,000ft) density plot with National Parks and
AONBs .................................................................................................................... 35
Figure B4: Farnborough departures and arrivals (up to 20,000ft) density plot .................. 36
Figure B5: Arrows/dotted lines show Runway 06 departure flows (Radar data shows all
Farnborough air traffic below 4,000ft) ......................................................................... 37
Figure B6: Arrows/dotted lines show Runway 24 departure flows (Radar data shows all
Farnborough air traffic below 4,000ft) ......................................................................... 38
Figure B7: Arrows/dotted lines show Runway 06 arrival flows (Radar data shows all
Farnborough air traffic below 4,000ft) ......................................................................... 39
Figure B8: Arrows/dotted lines show Runway 24 arrival flows (Radar data shows all
Farnborough air traffic below 4,000ft) ......................................................................... 40
Figure B9: Proposed Farnborough departures from both runways below 4,000ft ............... 41
Figure B10: Farnborough arrivals to Runway 06 below 4,000ft ....................................... 42
Figure B11: Farnborough arrivals to Runway 24 below 4,000ft ....................................... 43
Figure B12: Fairoaks and other light aircraft – Increased access ..................................... 45
Figure B13: Proposed change to RAF Odiham departure routes (Western blue area) ......... 50

Contents
Airspace Consultation
Part B: Proposed Changes below 4,000ft in the vicinity of Farnborough Airport Page B3
List of Tables
Table B1: Runway 06 Departures to the north .............................................................. 30
Table B2: Runway 06 Departures to the south ............................................................. 30
Table B3: Runway 06 Departures to the southwest ....................................................... 30
Table B4: Runway 24 Departures to the north .............................................................. 31
Table B5: Runway 24 Departures to the south ............................................................. 31
Table B6: Runway 24 Departures to the southwest ....................................................... 31
Table B7: Runway 06 Arrivals from the north ............................................................... 32
Table B8: Runway 06 Arrivals from the south ............................................................... 32
Table B9: Runway 06 Arrivals from the southwest ........................................................ 32
Table B10: Runway 24 Arrivals from the north ............................................................. 33
Table B11: Runway 24 Arrivals from the south ............................................................. 33
Table B12: Runway 24 Arrivals from the southwest ...................................................... 33
Table B13: Departures - Typical loudest noise level (Lmax dBA) at various heights for the
most common aircraft types, and the noisiest aircraft types, using Farnborough .............. 34
Table B14: Arrivals - Typical loudest noise level (Lmax dBA) at various heights for the most
common aircraft types, and the noisiest aircraft types, using Farnborough ...................... 34
Table B15: Table of noise levels (Lmax dBA) for equivalent sounds ................................. 34
Table B16 relating to Figure B13: Chinook noise information, extract from a USAPHC report49

Airspace Consultation
Contents
Page B4 Part B: Proposed Changes below 4,000ft in the vicinity of Farnborough Airport
This page intentionally left blank

Introduction to Part B
Airspace Consultation
Part B: Proposed Changes below 4,000ft in the vicinity of Farnborough Airport Page B5
1. Introduction to Part B
1.1. This part of the consultation material describes the airspace changes
proposed from the surface to less than 4,000ft above mean sea level1. The
region which may be affected is shown enclosed by the solid blue line in
Figure B1 below. The dashed blue outlined areas are specific sub-areas of
the main Part B region.
Figure B1: Consultation areas overview
1.2. Part B assumes that:
a. You have read and understood the first half of Part A (this sets the
context for the proposed changes)
b. You have identified that the geographic areas (shown outlined in blue in
Figure B1) above are of interest to you, and
c. You understand that this consultation only covers the areas identified in
Figure B1 where changes to air traffic flows are likely to occur as a result
of this proposal.
1 Altitudes of flights and airspace are given in feet above mean sea level (AMSL). Farnborough Airport is at 238ft AMSL. The terrain around Farnborough
within the area shown in Figure B1 varies between about 100ft to about 900ft in elevation. To calculate the height above ground level (AGL) where you
are, subtract your elevation from the altitudes in this document.
For example, if you live on a 200ft hill (AMSL), and aircraft fly over you at an altitude of 3,400ft, that aircraft is 3,400 – 200 = 3,200ft AGL (above you).
Figure B1 Consultation Areas Overview
© TAG Farnborough
except Ordnance Survey data ©
Crown copyright and database right 2013
Airfield
Farnborough
Airport
Use PDF zoom tools
to study this map
more closely
Part C
Part C
Part DPart D
Part B
N
W E
S
Part B: Farnborough aircraft
below 4,000ft
Part C: Farnborough aircraft
4,000ft-7,000ft
Part D: Southampton and
Bournemouth arriving aircraft
from the east 4,000ft-7,000ft
Part D: Bournemouth arriving
aircraft from the east 2,500ft-4,000ft
Part
C

Airspace Consultation
Introduction to Part B
Page B6 Part B: Proposed Changes below 4,000ft in the vicinity of Farnborough Airport
1.3. This part explains the proposed changes to routes and airspace in the near
vicinity of TAG Farnborough Airport. In particular, we aim to provide an
understanding of the impacts that the proposed changes would have on
people within the solid blue outlined area shown in Figures B1 (above) and
B2 (on Page B7, a zoomed in view). The main focus of this document is on
the impacts of establishing Farnborough departure and arrival routes which
are covered in detail in Sections 1-4 of this document. We advise you to
consider this information to determine the local impact on your area of
interest.
1.4. We also explain consequential changes to light General Aviation (GA2) traffic
flows, and to a very small number of RAF Odiham departures that would
generate further potential impacts. The areas where GA and RAF Odiham
flights would be affected are shown by the dashed blue outlined areas
shown in Figures B1 and B2. Each is described separately in this document;
Sections 5 and 6 in the document respectively for the Northern and Western
blue dashed areas. Even if your primary interest is within the blue dashed
areas, you should still consider Sections 1-4 as there may be other flights in
the region (discussed in those Sections) that are relevant to you.
1.5. Other air traffic flows, such as Heathrow and Gatwick departures, also use
the same airspace at higher altitudes in the vicinity of Farnborough. Within
the solid blue outlined area of this proposal, we are not considering changes
to flows other than Farnborough arrivals and departures.
1.6. We need to gather feedback from stakeholders, to enable us to understand
how the change may impact you. We have included questions and a
statement which are highlighted in a box like this. The easiest way to
respond to the consultation is to answer these questions via the website:
www.Consultation.TAGFarnboroughAirport.com
1.7. Care has been taken to make this consultation accessible to anyone who
may wish to respond. The design and operation of airspace is, by its nature,
a complex and technical issue. We aim to avoid technical jargon, but in
order to help readers fully understand the rationale behind the changes
being proposed we have, where appropriate and necessary, gone into some
technical details and used relevant terminology. Any technical terms used
are explained briefly, and summarised as a glossary in Appendix B.
2 GA is often light slow-moving aircraft flying at relatively low altitudes for pleasure or training. See Glossary for more information on GA.

Introduction to Part B
Airspace Consultation
Part B: Proposed Changes below 4,000ft in the vicinity of Farnborough Airport Page B7
Figure B2: Consultation areas in the vicinity of Farnborough
1.8. In this part, we will describe:
a. Today's airspace usage - a description of today’s flight-paths including
maps of where aircraft are generally seen;
b. The objectives and justification for the proposed changes – describing the
routes we are seeking to implement and their potential benefits and
impacts; and
c. Local considerations for route positioning; describing potential local
impacts. We ask for your feedback on any location that may require
special consideration in the ongoing design process, and why you think
we should consider it special. This will help us assess and balance the
impacts of the design.
1.9. We will ask you questions, and will also refer to Part A.
© TAG Farnborough
except Ordnance Survey data ©
Crown copyright and database right 2013
Airfield
Farnborough
Airport
Use PDF zoom tools
to study this map
more closely
Figure B2 Consultation Areas in the vicinity of Farnborough
N
W E
S
Airspace Consultation
Introduction to Part B
Page B8 Part B: Proposed Changes below 4,000ft in the vicinity of Farnborough Airport
How do I work out the change in impact within the solid blue
outlined area?
1.10. Later in this document, there are worked examples of how to assess the
change of impact on a place. Use it for where you live or work, in order to
decide how the change might affect you. These worked examples start in
Section 4 on Page B25.
1.11. Sections 2 and 3 provide background information that is provided to give an
understanding of our objectives for this proposal.

Today’s airspace usage
Airspace Consultation
Part B: Proposed Changes below 4,000ft in the vicinity of Farnborough Airport Page B9
2. Today’s airspace usage
2.1. The airspace around London, which includes Farnborough, is one of the
busiest and most complex volumes of airspace in the world. The
Farnborough area is over-flown by aircraft originating from many different
airports, as shown in Figure B3 on Page B35, which is a ‘density plot’ (see
explanation below). This map shows all commercial air traffic in the region,
up to 20,000ft. Most notably there are several arrival and departure routes
to and from Heathrow and Gatwick airports crossing the region. We have
also highlighted National Parks and Areas of Outstanding Natural Beauty so
you can see how often these places are over-flown by commercial aircraft
today.
2.2. This part of the consultation document focuses on changes to the routes to/from Farnborough at altitudes below 4,000ft. The areas that would be
affected by these changes are identified in Figure B2, specifically the solid
blue outlined area.
Aircraft flight-path density plots
2.3. In order to illustrate where commercial aircraft currently fly, we have
provided maps overlaid with aircraft flight-paths (Figures B3-B7). These are
known as density plots, which are produced using radar data, and show how
many aircraft over-flew a particular place. These maps start from Page B35.
2.4. The density plots show all flights for one month3, and hence give a good
representation of where flights are most concentrated. A colour key explains
the average number of flights per day over a particular place.
Note that, because Farnborough has far fewer flights than Heathrow or
Gatwick, the colour keys are different between density plots that show all
airports and those that only show flights relating to Farnborough.
2.5. We have filtered the radar data so we can show you different views:
a. Figure B3 shows all flights to/from all airports up to 20,000ft;
b. Figure B4 shows only flights to/from Farnborough up to 20,000ft;
c. Figures B5, B6, B7 and B8 show only flights to/from Farnborough, below
4,000ft.
2.6. The density plots are provided to illustrate the spread of tracks today. The
diagrams also have arrows which show the general direction of the traffic flows to aid your interpretation of these plots. The arrows are illustrative of
the general flow directions because there are no current formal airspace
routes.
3 Period chosen: September 2012. This month was chosen because it was a representative sample of aircraft types and destinations, and was outside
the 2012 Olympics period. During the Olympics, special airspace was applied to the London region for parts of July and August - those special flight-
paths did not represent the typical paths normally flown.

Airspace Consultation
Today’s airspace usage
Page B10 Part B: Proposed Changes below 4,000ft in the vicinity of Farnborough Airport
Runway directions
2.7. Farnborough has one long stretch of concrete and asphalt which aircraft use
to take off and land. However, because it can be used in either direction, this length of concrete is officially classed as being two runways (Runway 24
and Runway 06) 4.
2.8. Airspace near the airport is used by departing aircraft as they climb after
takeoff, and by arriving aircraft as they descend to land. The wind direction
on any given day (or hour) dictates which direction the runway is used for
take-off and landing; for safety reasons the runway used is generally the one
that has aircraft taking off and landing into the wind. This in turn influences
the traffic patterns seen in the surrounding airspace.
2.9. If the wind is from the west or calm, aircraft take off and land using the
westerly facing runway (Runway 24) and if the wind is from the east they
take off and land using the easterly facing runway (Runway 06). Due to
local airspace restrictions and prevailing wind conditions, Runway 24 is used
approximately 80% of the time and Runway 06 used 20% of the time.
2.10. When departures get high enough, Air Traffic Control (ATC) at Farnborough
hand them over to the next ‘link’ in the ATC chain (the national ‘en-route’
ATC). After this handover they are directed to join air routes that head off in
the direction of their ultimate destination.
2.11. Arriving aircraft initially come from the general direction of their departure
airport via the air route network, but when they get close to our airport (and
have descended sufficiently) they leave the air route and are directed to final
approach for whichever runway is in use.
2.12. Initially these arriving aircraft are controlled from the national ‘en-route’ ATC
centre, but are transferred at an appropriate time to the local airport
controllers at Farnborough to be directed onto final approach.
2.13. See Part A for more details on runway direction, usage, and designation.
Farnborough’s Runway 06 and Runway 24 air traffic patterns are explained
below.
General information about Farnborough departures
2.14. ATC currently manages departing aircraft by manually directing each flight
as there are no formal departure routes from Farnborough. When ATC
manually directs a flight it is known as ‘vectoring’. The controller that is
responsible for the aircraft immediately after take-off plans a safe flight-path
avoiding arrivals and any GA in the area. This regularly includes ‘unknown’
aircraft (not in contact with a Farnborough controller) – these are
represented only by blips on the radar screen with no confirmed information
about their height or their intentions (Part A has more background
information on ‘known’ and ‘unknown’ aircraft). For safe passage through
the airspace, some departures are given longer flight-paths, and some
4 The runway numbers ‘24’ and ‘06’ refer to the magnetic heading an aircraft would display on its compass, if it was aligned with the runway centreline.
Farnborough’s runways are aligned 064° and 244°, abbreviated to 06 and 24.

Today’s airspace usage
Airspace Consultation
Part B: Proposed Changes below 4,000ft in the vicinity of Farnborough Airport Page B11
shorter, depending on the specific situation at the time. Equally, some
aircraft are climbed early, or late, for the same reason.
2.15. This variance/manual intervention due to other flights in the region means
that departure flight-paths at altitudes below 7,000ft do not currently follow
specific paths and tend to be spread over a wide area, as shown by Figures
B5 and B6.
Today’s Farnborough departures – Runway 06 (20% of all departures) See Figure B5 on Page B37
2.16. Figure B5 shows all departures from Runway 06 fly straight ahead
immediately after take-off until they pass a distance of 2 nautical miles5
(nm) from the runway. Usually this is at about 1,000ft, but it varies because
different aircraft climb at different rates. They then perform a U-turn to the
right whilst still climbing to about 2,000ft, before climbing further and
turning to join the route network mainly to the north or south, with some
heading southwest. This U-turn to the right is necessary to avoid Heathrow
Airport airspace northeast of Farnborough.
2.17. Arrow 1 illustrates Runway 06 departures to the north. About 9% of all our
departures route this way.
2.18. Arrow 2 illustrates Runway 06 departures to the south. About 9% of all our
departures route this way.
2.19. Arrow 3 illustrates Runway 06 departures to the southwest. About 2% of all
our departures route this way.
2.20. Remember that these percentages only apply to Runway 06 departures. If
you live or work in an area over-flown by Runway 06 departures, you may
also be over-flown by Runway 24 departures, and arrivals to either runway.
Please consider all the maps in this document to assess how your area of
interest might be affected.
Today’s Farnborough departures – Runway 24 (80% of all
departures) See Figure B6 on Page B38
2.21. Some aircraft departing Runway 24 turn slightly left, some climb straight
ahead, and a few turn immediately right after takeoff. When above about
2,000ft they are turned to join the route network mainly to the north or
south (see Figure B6), with some heading southwest.
2.22. Arrow 1 illustrates Runway 24 departures to the north. About 36% of all our
departures route this way.
2.23. Arrow 2 illustrates Runway 24 departures to the south. About 36% of all our
departures route this way.
5 Aviation measures distances in nautical miles. One nautical mile (nm) is 1,852 metres. One ‘road’ mile (statute mile) is 1,609 metres, making a
nautical mile about 15% longer than a road mile.

Airspace Consultation
Today’s airspace usage
Page B12 Part B: Proposed Changes below 4,000ft in the vicinity of Farnborough Airport
2.24. Arrow 3 illustrates Runway 24 departures to the southwest. About 8% of all
our departures route this way.
2.25. Remember that these percentages only apply to Runway 24 departures. If
you live or work in an area over-flown by Runway 24 departures, you may
also be over-flown by Runway 06 departures, and arrivals to either runway.
Please consider all the maps in this document to assess how your area of
interest might be affected.
Points to note about Farnborough departures
2.26. Where the tracks end in Figures B5 and B6, the aircraft have climbed above
4,000ft. For example, for Runway 06 departures to the south, most are
above 4,000ft by the time they get south of Haslemere. This may seem
later than necessary, but they need to keep underneath Gatwick and
Heathrow air traffic until clear – these are shown in Figure B3. Note a red
(departure) flow from Gatwick heading west, passing just south of
Haslemere. Also note a wide red (departure) flow from Heathrow, towards
the southwest, crossing the Gatwick flow around Haslemere.
2.27. For both runways, unknown aircraft on the radar often cause controllers to
turn our departures a long way left and/or right, and they may have to
change the climb instructions as per paragraphs 2.14-2.15. Occasionally,
they need to be delayed on the runway at the last moment, ready for
takeoff, waiting for a gap between other air traffic (known or unknown).
This means the specific takeoff time, flight-path and altitude are not often
predictable, making the controller’s (and the departing pilot’s) work more
difficult until they can climb into the air route network. Joining the network
may take a long time depending on other air traffic, causing an
unpredictable delay and an unpredictable extra distance to be flown.
General information about Farnborough arrivals
2.28. Aircraft must line up with the runway as they begin their final approach to
land. The final approach flight-path descends directly to the runway and is
fixed in line with the extended centreline of the runway6. Aircraft today
generally join our final approach path between five and eight nautical miles
from touchdown, typically at an altitude of about 2,000ft.
2.29. Because Runway 06’s final approach path gets very close to other
aerodromes (Lasham and RAF Odiham), arrivals to Runway 06 tend to join
final approach nearer than those to Runway 24.
2.30. ATC must ensure that aircraft on final approach have been organised into an
efficient sequence for landing. This is where aircraft are safely spaced,
ensuring the runway is utilised efficiently and that flights are not
unnecessarily delayed in the air.
6 Technology and operational practices are being developed to enable curved final approach tracks; however, this is not sufficiently mature for
consideration at this time.

Today’s airspace usage
Airspace Consultation
Part B: Proposed Changes below 4,000ft in the vicinity of Farnborough Airport Page B13
2.31. ATC currently manages arriving aircraft into the required sequence by
vectoring (see paragraph 2.14). As the aircraft descend from about 7,000ft
towards the runway, our radar controller takes command of the arrival and is
planning a safe flight-path avoiding our departures, unknown radar blips or
other aircraft known to be in the area. Some arrivals are given longer flight-
paths, and some shorter, depending on the specific situation at the time.
Equally, some aircraft are descended early, or late, for the same reason.
2.32. This variance/manual intervention due to unknown air traffic means that
arriving flight-paths below about 7,000ft do not currently follow specific
paths and tend to be spread over a wide area, as shown by Figures B7
and B8.
Today’s Farnborough arrivals – Runway 06 (20% of all arrivals)
See Figure B7 on Page B39
2.33. Figure B7 depicts the pattern of traffic arriving to land on Runway 06.
2.34. Arrow 1 illustrates Runway 06 arrivals from the south. About 7% of all our
arrivals route this way.
2.35. Arrows 2 and 3 illustrate Runway 06 arrivals from the north. About 11% of
all our arrivals route from the north, with half of those (Arrow 2) routing
directly to final approach and the other half (Arrow 3) crossing to the south
of the airport, joining final approach via a U-turn from there.
2.36. Arrow 4 illustrates Runway 06 arrivals from the southwest. About 2% of all
our arrivals route this way.
2.37. Remember that these percentages only apply to Runway 06 arrivals. If you
live or work in an area over-flown by Runway 06 arrivals, you may also be
over-flown by Runway 24 arrivals, and departures from either runway.
Please consider the maps in this document to assess how your area of
interest might be affected.
Today’s Farnborough arrivals – Runway 24 (80% of all arrivals)
See Figure B8 on Page B40
2.38. Figure B8 depicts the pattern of traffic arriving to land on Runway 24.
2.39. Arrow 1 illustrates Runway 24 arrivals from the south. About 28% of all our
arrivals route this way.
2.40. Arrows 2 illustrates Runway 24 arrivals from the north. About 44% of all our
arrivals route from the north, crossing to the south of the airport, joining
Arrow 1’s flow towards the U-turn onto final approach.
2.41. Arrow 3 illustrates Runway 24 arrivals from the southwest. About 8% of all
our arrivals route this way, joining Arrows 2 and 3 south of the airport.

Airspace Consultation
Today’s airspace usage
Page B14 Part B: Proposed Changes below 4,000ft in the vicinity of Farnborough Airport
2.42. Remember that these percentages only apply to Runway 24 arrivals. If you
live or work in an area over-flown by Runway 24 arrivals, you may also be
over-flown by Runway 06 arrivals, and departures from either runway.
Please consider the maps in this document to assess how your area of
interest might be affected.
Points to note about Farnborough arrivals
2.43. Where the tracks start in Figures B7 and B8, the aircraft have descended
below 4,000ft. For example, for Runway 24 arrivals from the north, many
start descending below 4,000ft by the time they cross the A33 between
Reading and Basingstoke. This may seem earlier than necessary, but they
need to be descended below, and kept clear of, Heathrow air traffic – these
are shown in Figure B3. Note a red (departure) flow from Heathrow heading
southwest towards Farnborough, and a red (arrival) flow from west to east
crossing just north of Farnborough.
2.44. For both runways, unknown aircraft on the radar often cause controllers to
turn our arrivals a long way left and/or right, and they may have to change
the descent instructions (as per paragraphs 2.31-2.32). Occasionally, they
have to be placed in a holding pattern in a safe area. This means the
specific arrival time, flight-path and altitude are not often predictable,
making the controller’s (and the arriving pilot’s) work more difficult until
they land. This causes an unpredictable delay and an unpredictable extra
distance to be flown.
Traffic to/from other airports, and the environmental impact of General Aviation (GA)7 aircraft
2.45. Figure B3 shows that, in the vicinity of Farnborough, everywhere is over-
flown to some extent – there are no white areas on the map. Figures B4 to
B8 only depict Farnborough traffic flows and show that Farnborough air
traffic is a relatively small part of that overall picture shown in Figure B3 –
remember that the colour key for Figure B3 is bigger than that used in the
other density plots because Farnborough is much less busy than Heathrow or
Gatwick. Regardless of our proposal, the traffic to/from other airports will
continue to be seen and heard over-flying these areas (in particular
Heathrow and Gatwick arrivals and departures) at similar altitudes to today.
These aircraft are currently, and would continue to be, at higher altitudes
than our aircraft within the solid blue area.
2.46. Whilst this proposal will not change the tracks of air traffic into and out of
Heathrow and Gatwick, it is likely to have an effect on where some light GA
aircraft (and a small number of military aircraft) fly. The change of impacts
to people on the ground due to this is impossible to predict accurately as GA
flights do not follow predictable tracks in the way that passenger and freight
flights do. However, we make an estimate later in this document based on
the experience of our controllers in dealing with such flights.
7 General Aviation (GA) aircraft are usually private light aircraft, gliders, recreational aircraft etc. See Part A for more details.

Today’s airspace usage
Airspace Consultation
Part B: Proposed Changes below 4,000ft in the vicinity of Farnborough Airport Page B15
2.47. We know that there are popular areas of GA activity that we have tried to
avoid as far as practicable, given our own requirements for consistent and
predictable routes.
2.48. We also know that changing flight-paths or airspace boundaries can be
challenging to GA, and our intention is for as little disruption as possible by
striking a fair balance.

Airspace Consultation
Objectives and justification for proposed changes below 4,000ft
Page B16 Part B: Proposed Changes below 4,000ft in the vicinity of Farnborough Airport
3. Objectives and justification for proposed changes below 4,000ft
3.1. This section describes our objectives for changing the routes to/from
Farnborough Airport; it describes what we are trying to achieve and the
generic benefits/impacts that would result. We welcome your feedback on
these objectives. The effects on specific aviation users are discussed in Part
E. Specific local considerations are discussed below in Section 4.
3.2. This consultation is to develop airspace solutions, assuming unchanged
airport infrastructure. It is not associated with the work being undertaken
by the Airports Commission. Any further proposals arising from any
recommendations made by the Airports Commission would be subject to
separate consultation at a later date.
3.3. The introduction of PBN, as recommended by the aviation industry’s CAA-supported FAS, means the route system must undergo change (these terms
are explained in Part A). This provides the opportunity to consider changes
that will enable us to make best use of the runways and to improve the
management of noise impact.
3.4. Specific justifications: We are seeking to optimise the route structure to
bring benefits to the ATC operation. We intend to do this whilst enabling
environmental benefits at these low altitudes (noise over fewer people), and
considering GA activity areas as far as practicable, making airspace more
efficient for as many users as possible. In particular we are proposing to
introduce formal departure routes from both runways, and to improve the
management of arrivals, by using the RNAV navigation standards which
would make the flight-paths more consistent and predictable (see Part A for
details of RNAV). The more consistent and predictable the routes, the more
efficient they can be, and the already-high safety standards can be further
enhanced. The airspace management would be more efficient for all users
as well as the airport itself.
3.5. Maintaining Farnborough’s competitive position in the UK and international
market is important both for the airport and for the local communities that
benefit from having a commercially successful airport as a neighbour.
Improving noise management - Positioning routes away from
populated areas and noise sensitive areas as much as possible
3.6. The proposed routes would enable the position of the aircraft to be more
precisely controlled. In particular, with careful design the routes can be
optimised so that they minimize over-flight of noise sensitive areas, such as
populated areas.
3.7. We estimate that, due to the design proposed in this part of the consultation, 345,000 fewer people8 would be over-flown by flight-paths at low
altitudes (below 4,000ft).
8 Population data based on information supplied by CACI for 2012. This is a net figure based on a simple comparison of the populations within the areas
covered by the current flight-paths vs the (smaller) areas covered by the proposed flight-paths. It is not intended to imply that all (continued over)

Objectives and justification for proposed changes below 4,000ft
Airspace Consultation
Part B: Proposed Changes below 4,000ft in the vicinity of Farnborough Airport Page B17
3.8. In addition to positioning the routes to reduce noise impact, we are also
proposing changes that will keep arrivals higher for longer and climb
departures higher earlier. The higher an aircraft is, the quieter and smaller it
appears and so these changes would further reduce overall noise impact,
however we are not able to quantify this benefit.
Potential negative impacts
3.9. Avoiding over-flight of one area inevitably means flights over neighbouring
ones instead. For example, avoiding over-flight of a town almost always
means flying over the surrounding countryside, which may be valued for its
relative tranquillity9. This applies equally to departure and arrival routes.
3.10. As a result of this proposal, some areas would experience new or more
flights overhead, some fewer, and some would be unchanged.
3.11. The proposed routes mean some aircraft would have to fly longer tracks than
today. Part A Section 10 describes how these longer routes, avoiding
populated areas and GA activity areas as much as possible, causes aircraft to
use more fuel.
Concentration versus dispersal
3.12. Aircraft following RNAV routes have more reliable and accurate track-
keeping, and hence most aircraft follow the same paths within closer
tolerances. Flights are concentrated along the routes, rather than being
dispersed more widely across an area. This means that net fewer people are
over-flown, but those that are, would be over-flown more often.
Airspace sharing with gliders – infrequent use of an alternate southbound departure route
3.13. This change would have an impact on the gliding community. We intend to
reduce this impact as much as possible, whilst still achieving our operational
and environmental objectives.
3.14. In Figure B9, there are notes regarding a proposed alternate departure route
to the south that would only be used under certain circumstances.
3.15. Outside the blue outlined area, we propose sharing certain volumes of
airspace with the gliding community, on a limited number of days of the
year. This would change the southbound departure flow within the blue
outlined area, but only when this sharing arrangement was activated. It
would also only happen once the departing aircraft was at or above 4,000ft,
in the grey shaded area of Figure B9.
areas benefit from this proposal – some areas would, but others would not. It is intended to show that, as a net calculation, fewer people would be over-flown by the flight-paths described in this proposal than are currently over-flown.
9 Route positioning is limited by aircraft manoeuvrability. Aircraft fly at high speeds; this limits how tightly, and how often, aircraft can turn in order for
the route to be considered flyable and safe (this is governed by international design standards); hence avoiding one sensitive area can often mean over-
flying another.

Airspace Consultation
Objectives and justification for proposed changes below 4,000ft
Page B18 Part B: Proposed Changes below 4,000ft in the vicinity of Farnborough Airport
3.16. For more details of this sharing arrangement, known as Flexible Use of
Airspace (FUA), see Part C.
Overall benefit
3.17. Our assessment of impacts is based on our interpretation of the
Government’s priorities described in Part A, which focusses on minimising
the numbers of people over-flown by aircraft flying below 4,000ft. Whilst
the proposed design would have both positive and negative impacts, we
believe that by reducing the net number of people overflown at low altitudes
and by avoiding disruption of GA areas as far as practicable, our design
achieves the best balance. We therefore believe that the change is justified.
In the questions below we ask about the principles behind our design
decisions, and in Section 4 we are seeking local views in order to help
determine whether our design can be improved further.
Questions B1-B3
The following three questions are intended to gather your views regarding our justification
for the proposed change, and the balances we strike between competing priorities.
Please remember that these three questions are not asking about specific locations, only
the principles behind why and how we designed the proposed routes.
Answering these questions does not prevent you from providing information on local
sensitivities in answer to the questions in Section 4; for example you may support the
objective of improving noise management but have strong views on areas that should be
avoided. Equally you may have information that we have not considered that leads you to
oppose the objective of improving noise management, regardless of local issues. Please use
the questions below to express your views on the general principles.
Question B4 will ask about the impact on specific locations.

Objectives and justification for proposed changes below 4,000ft
Airspace Consultation
Part B: Proposed Changes below 4,000ft in the vicinity of Farnborough Airport Page B19
Question B1 – Routes and airspace structures
This question is about justification for change.
In Section 3 above, we say that the more predictable aircraft flight-paths are, the more efficient their safe management can be.
This applies both to Farnborough flights within CAS, and to GA flights outside CAS.
This proposal is seeking to introduce new departure and arrival routes, and airspace structures to surround them, which would change some flight-paths below 4,000ft.
This would improve the consistency of aircraft flight-paths on those routes, using modern navigational capabilities. Consistent flight-paths would be predictable and
more efficient to manage safely.
The use of CAS structures would help separate Farnborough aircraft from
recreational and military flights that also operate in the area. This means that everything inside the structures would be known and predictable, which would also be more efficient to manage safely. GA users outside CAS would fly more
predictable paths due to the presence of the CAS structures themselves, and could make requests to cross them, again using predictable paths.
To what extent do you agree with our justification:
Introducing new routes and airspace would make aircraft flight-paths more predictable. Making them more predictable makes them more
efficient to manage safely.
1 Strongly agree
2 Somewhat agree
3 No preference
4 Somewhat disagree
5 Strongly disagree
You are welcome to provide a statement to support your answer.
Airspace Consultation
Objectives and justification for proposed changes below 4,000ft
Page B20 Part B: Proposed Changes below 4,000ft in the vicinity of Farnborough Airport
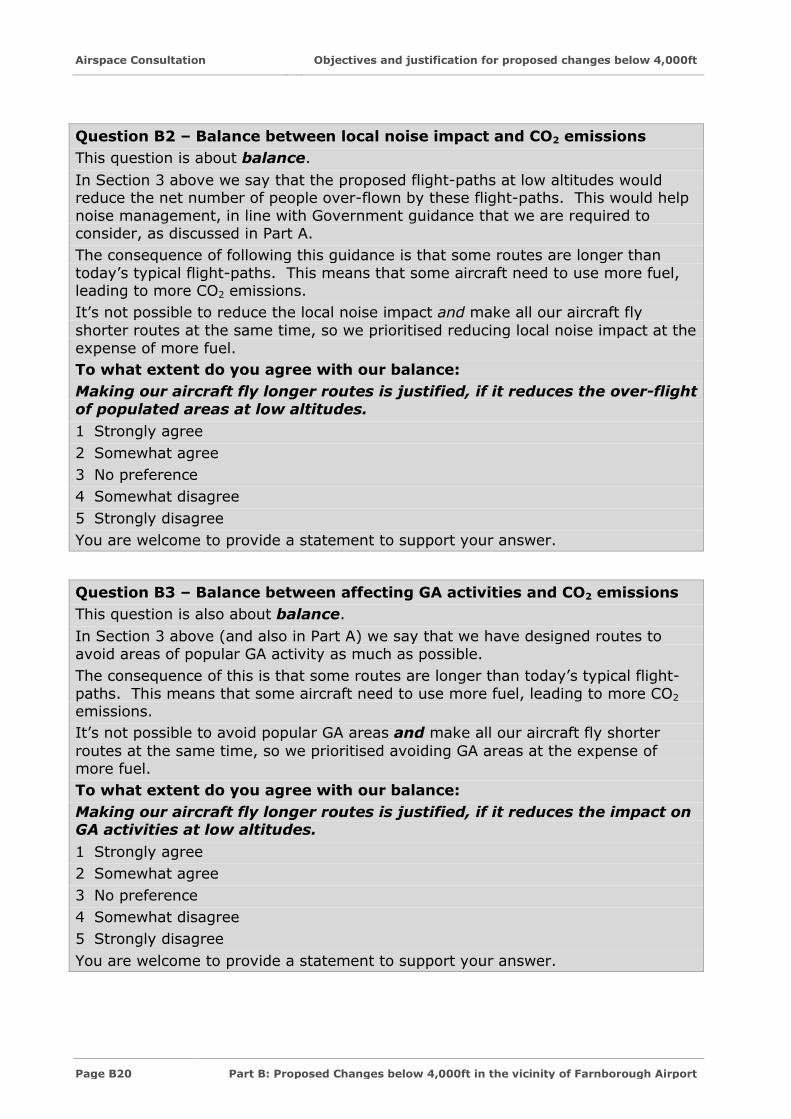
Question B2 – Balance between local noise impact and CO2 emissions
This question is about balance.
In Section 3 above we say that the proposed flight-paths at low altitudes would reduce the net number of people over-flown by these flight-paths. This would help
noise management, in line with Government guidance that we are required to consider, as discussed in Part A.
The consequence of following this guidance is that some routes are longer than
today’s typical flight-paths. This means that some aircraft need to use more fuel, leading to more CO2 emissions.
It’s not possible to reduce the local noise impact and make all our aircraft fly
shorter routes at the same time, so we prioritised reducing local noise impact at the
expense of more fuel.
To what extent do you agree with our balance:
Making our aircraft fly longer routes is justified, if it reduces the over-flight
of populated areas at low altitudes.
1 Strongly agree
2 Somewhat agree
3 No preference
4 Somewhat disagree
5 Strongly disagree
You are welcome to provide a statement to support your answer.
Question B3 – Balance between affecting GA activities and CO2 emissions
This question is also about balance.
In Section 3 above (and also in Part A) we say that we have designed routes to
avoid areas of popular GA activity as much as possible.
The consequence of this is that some routes are longer than today’s typical flight-
paths. This means that some aircraft need to use more fuel, leading to more CO2 emissions.
It’s not possible to avoid popular GA areas and make all our aircraft fly shorter
routes at the same time, so we prioritised avoiding GA areas at the expense of more fuel.
To what extent do you agree with our balance:
Making our aircraft fly longer routes is justified, if it reduces the impact on GA activities at low altitudes.
1 Strongly agree
2 Somewhat agree
3 No preference
4 Somewhat disagree
5 Strongly disagree
You are welcome to provide a statement to support your answer.

Local considerations for route positioning
Airspace Consultation
Part B: Proposed Changes below 4,000ft in the vicinity of Farnborough Airport Page B21
4. Local considerations for route positioning
4.1. Figures B4-B8 show current air traffic flows, and Figures B9-B11 show the
proposed air traffic flows. You can also view the maps interactively at:
www.Consultation.TAGFarnboroughAirport.com
and use the postcode search function. The website will also allow you to zoom
in on maps, and to easily switch between the current day traffic picture and
the consultation swathes for the new routes.
How to use the maps and data to assess potential effects
4.2. We have provided information to help answer the questions ‘Would the
change mean more or fewer over-flights? And if so, how many aircraft and
what is the potential change in impact?’ This information is in the form of
maps and data that indicates potential noise and visual impacts across the
consultation swathe. These swathes cover all options for the positioning of
the new routes described in this document (they do not cover existing flight-
paths that would not change). The consultation swathes themselves are
shown in Figures B9 to B11, including data indicating the predicted numbers
of flights affected. These Figures may be directly compared to the maps in
Figures B2 to B8 which show today’s air traffic flows.
4.3. The information we have provided describes:
a. The potential number of aircraft that would fly on the route. Tables are
provided on the data pages preceding the maps
b. The lowest, and the most likely, altitudes these aircraft would be at. This
is shown by the shading on the maps themselves and is discussed in
more detail in the paragraphs below; and
c. A measurement of the maximum noise impact aircraft over-flying at that
height would generate at ground level (referred to as Lmax). This is also
dependent on the aircraft types expected. A summary is provided on the
data pages preceding the maps.
Swathes
4.4. The swathe maps have shaded areas to show where flight-paths would
normally be as a consequence of this proposal. The areas enclosed by the
dashed black lines denote the widest extent of the likely traffic spread, and
the solid black lines show where traffic would normally be concentrated. We
have not yet finalised the exact position of the routes we are proposing, but
they would need to be within the area enclosed by the solid black lines.

Airspace Consultation
Local considerations for route positioning
Page B22 Part B: Proposed Changes below 4,000ft in the vicinity of Farnborough Airport
Arrows
4.5. The swathe maps have arrows which indicate the general direction of the
traffic flows, provided to help you interpret the maps. These arrows are
illustrative and do not represent the precise position of any formal airspace
route.
Altitude data
4.6. The altitude information presented on the maps shows a worst case (lowest)
altitude and an indication of typical (most likely) altitude for aircraft during
normal operations. The worst case represents the lowest altitude we would
normally expect an aircraft to be on the flight-path in question. For
example, the start of the ‘minimum 3,000ft’ altitude band on a map for a
departure route is the area by which we would normally expect all aircraft to
have reached 3,000ft. This would include the worst case of a slow climbing
aircraft. Slow climbers are generally the larger/older aircraft types – most
aircraft significantly outperform these slow climbers and would therefore
usually be higher. Most Farnborough aircraft tend to be amongst the highest
performing types.
4.7. The typical altitude is shown to indicate that most aircraft would usually be
above the worst case; however, predicting typical altitudes for aircraft for a
future airspace design is not an exact science. We have therefore erred on
the side of caution with these typical values, and even they do not represent
the true range of altitudes that many aircraft are expected to achieve. It is
worth noting that, in general, we expect the proposed changes to mean that,
for a given location, aircraft will be at least the same, but most probably at
higher, altitudes than today.
4.8. Whilst this variation in altitudes would happen in reality, it is difficult to
represent in a consultation document. We therefore suggest that, as a
default, stakeholders should consider the potential impact of aircraft at the
minimum altitudes shown on Figures B9 to B11.
Tranquillity
4.9. Another factor that may determine the significance of a potential impact is
tranquillity. CAA guidance for airspace change does not provide a method
for assessing tranquillity. Any assessment will therefore be subjective and
dependent on the specific location in question. The Government guidance
(see Appendix A) specifically mentions AONBs and National Parks and so we
have highlighted them in Figure B3 and in the worked examples later in this
section. You may wish to consider the potential effect on tranquillity when
providing feedback.

Local considerations for route positioning
Airspace Consultation
Part B: Proposed Changes below 4,000ft in the vicinity of Farnborough Airport Page B23
Assumptions
4.10. In order to ensure you do not underestimate the number of over-flights over
a particular location, and to ensure we get feedback across the range of
options within the swathes presented in this consultation, we ask you to
make the following assumptions if your area of interest falls within the
shaded areas bounded by the black lines on the maps:
a. Assume the flight-path may be positioned directly above you at the
altitudes shown (so the maximum number of over-flights would apply to
this area, as described in the data tables); and
b. Assume that all aircraft would consistently fly along the flight-path in
question rather than being vectored elsewhere in the vicinity by ATC.
4.11. These assumptions, combined with the worst-case assumptions regarding
minimum altitude described above, mean that the potential impact may be
overestimated in this document. This is because the consultation swathes
presented are wider than the routes which would be positioned within them,
so not all the areas would be directly over-flown by the route; and because
vectoring off route would happen some of the time (albeit less than today).
4.12. We believe that this is a prudent and favourable approach over one which
risks you underestimating the potential effects as it is better for us to
analyse and filter the salient points from a wide consultation response, than
to risk stakeholders not responding because they assume the impact is lower
than it might in fact be. For this reason, please think about what feedback
you would supply us if you were directly over-flown by one, some or all of
the routes and provide your feedback by answering the questions we ask.
General characteristics of proposed changes
4.13. The following paragraphs present the consultation swathes and describe the
key factors that determine where they sit.
4.14. The traffic data shown on the pages preceding Figures B3 to B11 show a
forecast of the average daily number of flights.
Farnborough’s proposed departure routes – See Figure B9 on Page B41
4.15. Figure B9 shows the consultation swathe for the departure routes from both
runways. Compare this with Figures B5 and B6. You may prefer to view the
website where you can switch between these maps on screen.
4.16. Figure B9 illustrates that the areas over-flown would generally be in a
smaller region than today (enclosed by the dashed lines), and the flights
would be mostly concentrated somewhere within an even narrower corridor
(between the solid black lines). Also, it illustrates where the departures
from either runway would most likely climb past 4,000ft (grey shaded
region).
Airspace Consultation
Local considerations for route positioning
Page B24 Part B: Proposed Changes below 4,000ft in the vicinity of Farnborough Airport
4.17. Under this proposal, northerly departures would head southwest first. This
means that places to the west and northwest of Farnborough would not
be over-flown by our departures below 4,000ft in normal circumstances.
4.18. Some southerly departures would head further to the southwest before
turning south, but many of them would follow a similar path to today albeit
in a narrower stream (especially those from Runway 24).
Farnborough’s proposed arrival routes See Figures B10 on Page B42 and Figure B11 on Page B43
4.19. Figures B10 and B11 show the consultation swathes for positioning the
proposed arrival routes below 4,000ft to final approach. Compare Figure B10
with Figure B7, and Figure B11 with Figure B8. You may prefer to view the
website where you can switch between these maps on screen.
4.20. Figure B10 illustrates that Runway 06 arrivals would generally be in a
smaller region than today (enclosed by the dashed lines) and the flights
would be mostly concentrated somewhere within an even narrower corridor
(between the solid black lines). Also, it illustrates where the arrivals would
most likely still be at or above 4,000ft (grey shaded region).
4.21. Comparing Figure B10 with Figure B7, it would be highly unlikely that
arrivals from the northwest would join final approach directly from the north,
as happens today for approximately half of Runway 06 arrivals that join final
approach via Hook, North Warnborough and Crookham. Under this proposal,
these flights would stay higher whilst northwest of the M3 motorway, cross
to the south of the airport and join the flow of arrivals from the southwest of
the airport.
4.22. Figure B11 illustrates that Runway 24 arrivals would generally be in a
smaller region than today (enclosed by the dashed lines) and the flights
would be mostly concentrated somewhere within an even narrower corridor
(between the solid black lines). Also, it illustrates where the arrivals would
most likely still be at or above 4,000ft (grey shaded region). The basic
structure of the flight-paths from both north and south would be similar to
that seen today, i.e. the flows would join together to the south of the airport
and sweep around to land in a westerly direction, but it would be narrower
and more consistent.
4.23. The alignment of the final approach to either runway would not change, so
the areas nearest the airport highlighted by the brightest colours in
Figures B7 and B8 are likely to remain.
4.24. The precise positions of the routes within the swathes shown in Figures B10
and B11 will be determined after consultation feedback has been analysed.
We believe they would be best placed within the solid black lines shown on
those maps.
Current and forecast air traffic information for Figures B9-B11
4.25. Below, Tables B1-B12 show the potential number of flights that could pass
directly overhead if that is where a route gets positioned.

Local considerations for route positioning
Airspace Consultation
Part B: Proposed Changes below 4,000ft in the vicinity of Farnborough Airport Page B25
4.26. Areas beneath the final routes would expect more over-flights than today
due to the more consistent and accurate flight-paths. Areas away from the
routes would expect fewer over-flights.
4.27. The hourly numbers given in Tables B1-B12 (Pages B30-B33) are averages10. Like any airport, there are busy periods where flights per hour
are greater than the average, likewise there are quiet periods where there
are few flights, or none at all. At Farnborough, these peaks and troughs are
based on too many factors to be predictable, though weekends and public
holidays tend to be less busy than weekdays. This would not change due to
the proposal.
Noise impact for Figures B9-B11
4.28. Below, Tables B13-B14 show the potential noise impact of a single flight
directly overhead at a given height. This measurement is known as Lmax.
What is the impact now, and what would it be in the future? Worked
examples
4.29. The following paragraphs explain how to work out the changes in impact for
real places, as an example. Follow these examples, use the maps to find
where you live or work, and run through the same method for your area of
interest.
4.30. We have worked two examples, using the towns of Hook and Haslemere. To
follow the examples we suggest you have the maps nearby, or have the
consultation website open with the map pages on display.
4.31. We describe what impacts Hook and Haslemere are exposed to now, what
they would be exposed to in the future if this proposal was not implemented,
and what they would be exposed to in the future if this proposal was
implemented.
4.32. To describe the impact today, we used radar data and aircraft numbers from
2012. In 2019, if the proposal was not implemented, aircraft would continue
to follow the same flight-paths as today. We have provided forecast numbers
for both the most likely and the highest cases.
4.33. In these examples, we will compare today’s movement numbers with the
most likely forecast movement numbers for 2019.
4.34. Please remember the assumptions in paragraphs 4.10-4.12.
4.35. The relevant Figures (B3-B11) are on Pages B35-B43. The relevant Tables
(B1-B15) are on Pages B30-B34.
10 These averages were calculated based on Farnborough being open 253 weekdays for 15 hours, and 110 weekend/ Bank Holiday days for 12 hours,
with two days closed (Dec 25th and 26th). The weekend limit set by the Planning Deed will be observed (maximum 17.8% of all annual flights are
allowed at weekends).

Airspace Consultation
Local considerations for route positioning
Page B26 Part B: Proposed Changes below 4,000ft in the vicinity of Farnborough Airport
4.36. We will use: | In order to:
Figures B3-B8 | See where the place is, in relation to current flight-
| paths
Figures B9-B11 | See where the place is, in relation to proposed flight-
| paths
Tables B1-B12 | Find out how many flights affect the place
Tables B13-B15 | Understand the noise impacts involved for that place.
Hook
4.37. From Figure B3, Hook is currently over-flown by commercial air traffic to and
from many airports, including Heathrow and Gatwick. This density plot
shows Hook covered by green and yellow colours. This means that, on
average over a month, Hook is over-flown by more than twelve and up to
twenty four flights per day. Hook is not within a National Park or AONB.
4.38. From Figure B4, Hook is currently regularly overflown by Farnborough air
traffic. This density plot shows Hook covered by the light blue colour11. This
means that, on average over a month, Hook is over-flown one to three times
per day by Farnborough flights. The spread of the colours means that other
Farnborough aircraft fly through the vicinity.
Hook today, and if the proposal was not implemented
4.39. Using Figure B5, Hook is partly over-flown by Farnborough Runway 06
departures to the north. Table B1 shows that, in 2012, about 1,035 aircraft
flew that route. In 2019 the most likely number to fly that route would be
1,760.
4.40. Using Figure B6, Hook is over-flown by Farnborough Runway 24 departures
to the north. Table B4 shows that, in 2012, about 4,140 aircraft flew that
route In 2019 the most likely number to fly that route would be 7,040.
4.41. Using Figure B7, Hook is partly over-flown by Farnborough Runway 06
arrivals from the north. Table B7 shows that, in 2012, about 1,265 aircraft
flew that route. In 2019 the most likely number to fly that route would be
1,760.
4.42. Using Figure B8, Hook is partly over-flown by Farnborough Runway 24
arrivals from the north. Table B10 shows that, in 2012, about 5,060 aircraft
flew that route. In 2019 the most likely number to fly that route would be
7,040.
11 Remember that the colour key for Figure B3 is different from Figures B4-B8 because Figure B3 includes traffic for all airports

Local considerations for route positioning
Airspace Consultation
Part B: Proposed Changes below 4,000ft in the vicinity of Farnborough Airport Page B27
4.43. The vicinity of Hook is therefore currently over-flown by:
1,035 + 4,140 = 5,175 departures
1,265 + 5,060 = 6,325 arrivals
4.44. If the proposal was not implemented (no change to tracks), in 2019 the
vicinity of Hook would be over-flown by:
1,760 + 7,040 = 8,800 departures
1,760 + 7,040 = 8,800 arrivals.
Hook under this proposal
4.45. Using Figure B9, Hook would not usually be over-flown by any Farnborough
departures at all. Therefore there is no need to look at the tables for any
departure numbers.
4.46. Using Figure B10, the vicinity of Hook would be partly over-flown by
Farnborough Runway 06 arrivals from the north in a similar way to today,
normally at or above 4,000ft. From Table B7, in 2019 the most likely number
to fly that route would be 1,760.
4.47. Using Figure B11, the vicinity of Hook would be partly over-flown by
Farnborough Runway 24 arrivals from the north in a similar way to today,
normally at or above 4,000ft. From Table B10, in 2019 the most likely
number to fly that route would be 7,040.
4.48. Under this proposal, in 2019 the vicinity of Hook would be over-flown by:
Few or no departures Insignificant departure noise impact
1,760 + 7,040 = 8,800 arrivals For noise impacts, see Table B14
Haslemere
4.49. From Figure B3, Haslemere is currently over-flown by commercial air traffic
to and from many airports, including Heathrow and Gatwick. This density
plot shows Haslemere covered by yellow and red colours. This means that,
on average over a month, Haslemere is over-flown by more than eighteen
flights per day, with eastern Haslemere experiencing more than twenty four
flights per day. Haslemere is not within a National Park or AONB, but it is
bordered by Surrey Hills AONB to the north and east, and the South Downs
National Park to the south.
4.50. From Figure B4, the vicinity of Haslemere is currently regularly overflown by
Farnborough air traffic. This density plot shows Haslemere covered by the
light grey colour12. This means that, on average over a month, the vicinity
of Haslemere is over-flown up to once per day by Farnborough flights. The
spread of the grey area means that other Farnborough flights pass nearby.
12 Remember that the colour key for Figure B3 is different from Figures B4-B8 because Figure B3 includes traffic for all airports

Airspace Consultation
Local considerations for route positioning
Page B28 Part B: Proposed Changes below 4,000ft in the vicinity of Farnborough Airport
Haslemere today, and if the proposal was not implemented
4.51. Using Figure B5, the vicinity of Haslemere is over-flown by Farnborough
Runway 06 departures to the south. Table B2 shows that, in 2012, about
1,035 aircraft flew that route. In 2019 the most likely number to fly that
route would be 1,120.
4.52. Using Figure B6, Haslemere is rarely over-flown by Farnborough Runway 24
departures. Therefore there is no need to look at Table B5 for Runway 24
departure numbers.
4.53. Using Figure B7, Haslemere is over-flown by Farnborough Runway 06
arrivals from the south. Table B8 shows that, in 2012, about 805 aircraft
flew that route. In 2019 the most likely number to fly that route would be
1,120.
4.54. Using Figure B8, the vicinity of Haslemere is over-flown by Farnborough
Runway 24 arrivals from the south. Table B11 shows that, in 2012, about
3,220 aircraft flew that route. In 2019 the most likely number to fly that
route would be 4,480.
4.55. the vicinity of Haslemere is therefore currently over-flown by:
1,035 + zero = 1,035 departures
805 + 3,220 = 4,025 arrivals
4.56. If the proposal was not implemented (no change to tracks), in 2019 the
vicinity of Haslemere would be over-flown by:
1,120 + zero = 1,120 departures
1,120 + 4,480 = 5,600 arrivals
Haslemere under this proposal
4.57. Using Figure B9, the vicinity of Haslemere would not usually be over-flown
by any Farnborough departures at all. Therefore there is no need to look at
the tables for any departure numbers.
4.58. Using Figure B10, the vicinity of Haslemere would be partly over-flown by
Farnborough Runway 06 arrivals from the south in a similar way to today,
normally between 3,000ft and 4,000ft. From Table B8, in 2019 the most
likely number to fly that route would be 1,120. However, they would be
joined by arrivals from the southwest as per Figure B10 and the text below
Table B8, which says that we should add the number from Table B9. So
from Table B9, in 2019 the most likely additional number to join from the
southwest would be 320.
Local considerations for route positioning
Airspace Consultation
Part B: Proposed Changes below 4,000ft in the vicinity of Farnborough Airport Page B29
4.59. Using Figure B11, Haslemere would be over-flown by Farnborough
Runway 24 arrivals from the south a similar way to today, normally between
3,000ft and 4,000ft. From Table B11, in 2019 the most likely number to fly
that route would be 4,480. However, they would be joined by arrivals from
the southwest as per Figure B11 and the text below Table B11, which says
that we should add the number from Table B12. So from Table B12, in 2019
the most likely additional number to join from the southwest would be1,280.
4.60. Under this proposal, in 2019 the vicinity of Haslemere would be over-flown
by:
Few or no departures Insignificant departure noise impact
(1,120+320) + (4,480+1,280) = 7,200 arrivals For noise impacts, see Table
B14
Noise impacts
4.61. Comparing the noise impacts for departures (Table B13) and arrivals
(Table B14) against Table B15 (which gives examples of everyday noises)
allows you to understand the approximate scale of the noise impact.
Farnborough aircraft are generally moving quickly, so each noise impact
would build then disappear as each aircraft got closer then moved away.
End of worked examples
4.62. Completing this exercise for yourself will allow you to form your own opinion
on the change in impact this proposal could have on where you live or work.
4.63. Remember that, if this proposal is not implemented, the forecast 2019
traffic numbers would still apply to today’s flight-paths.

Airspace Consultation
Local considerations for route positioning
Page B30 Part B: Proposed Changes below 4,000ft in the vicinity of Farnborough Airport
Runway 06 Departing Aircraft Numbers13: Figures B5 and B9
Flights 2012 Typical
2015 Most Likely
2015 High Forecast
2019 Most Likely
2019 High Forecast
Annual 1,035 1,485 2,475 1,760 2,750
Average Per Hr Weekday
0.22 0.32 0.54 0.38 0.60
Average Per Hr Weekend
0.14 0.20 0.33 0.24 0.37
Table B1: Runway 06 Departures to the north
Under this proposal, future departures to the north would route southwest first, and
departures to the east would initially route north instead of south.
Flights 2012 Typical
2015 Most Likely
2015 High Forecast
2019 Most Likely
2019 High Forecast
Annual 1,035 945 1,575 1,120 1,750
Average Per Hr Weekday
0.22 0.20 0.34 0.24 0.38
Average Per Hr Weekend
0.14 0.13 0.21 0.15 0.24
Table B2: Runway 06 Departures to the south
Under this proposal, future departures to the south would route in a similar manner to
today. Departures to the east would initially route north instead of south.
Flights 2012 Typical
2015 Most Likely
2015 High Forecast
2019 Most Likely
2019 High Forecast
Annual 230 270 450 320 500
Average Per Hr Weekday
0.05 0.06 0.10 0.07 0.11
Average Per Hr Weekend
0.03 0.04 0.06 0.04 0.07
Table B3: Runway 06 Departures to the southwest
Under this proposal, future departures to the southwest would route west first. There would
be no change to the proportion of departures routing this way.
13 As per Part A, the proportion of departures to the north would change due to requests from NATS En-Route, the next ‘link’ in the ATC chain. This has
been included in these calculations.

Local considerations for route positioning
Airspace Consultation
Part B: Proposed Changes below 4,000ft in the vicinity of Farnborough Airport Page B31
Runway 24 Departing Aircraft Numbers14: Figures B6 and B9
Flights 2012 Typical
2015 Most Likely
2015 High Forecast
2019 Most Likely
2019 High Forecast
Annual 4,140 5,940 9,900 7,040 11,000
Average Per Hr Weekday
0.90 1.29 2.14 1.52 2.38
Average Per Hr Weekend
0.56 0.80 1.34 0.95 1.48
Table B4: Runway 24 Departures to the north
Under this proposal, future departures to the north would route southwest first, and
departures to the east would initially route north instead of south.
Flights 2012 Typical
2015 Most Likely
2015 High Forecast
2019 Most Likely
2019 High Forecast
Annual 4,140 3,780 6,300 4,480 7,000
Average Per Hr Weekday
0.90 0.82 1.36 0.97 1.52
Average Per Hr Weekend
0.56 0.51 0.85 0.60 0.94
Table B5: Runway 24 Departures to the south
Under this proposal, future departures to the south would route in a similar manner to
today. Departures to the east would initially route north instead of south.
Flights 2012 Typical
2015 Most Likely
2015 High Forecast
2019 Most Likely
2019 High Forecast
Annual 920 1,080 1,800 1,280 2,000
Average Per Hr Weekday
0.20 0.23 0.39 0.28 0.43
Average Per Hr Weekend
0.12 0.15 0.24 0.17 0.27
Table B6: Runway 24 Departures to the southwest
Under this proposal, future departures to the southwest would route west first. There would
be no change to the proportion of departures routing this way.
14 As per Part A, the proportion of departures to the north would change due to requests from NATS En-Route, the next ‘link’ in the ATC chain. This has
been included in these calculations.

Airspace Consultation
Local considerations for route positioning
Page B32 Part B: Proposed Changes below 4,000ft in the vicinity of Farnborough Airport
Arriving Aircraft Numbers for Runway 06: Figures B7 and B10
Flights 2012 Typical
2015 Most Likely
2015 High Forecast
2019 Most Likely
2019 High Forecast
Annual 1,265 1,485 2,475 1,760 2,750
Average Per Hr Weekday
0.27 0.32 0.54 0.38 0.60
Average Per Hr Weekend
0.17 0.20 0.33 0.24 0.37
Table B7: Runway 06 Arrivals from the north
Under this proposal, all future arrivals from the north would cross to the south of the airport
before positioning to make their approach to land. Currently, this crossover happens about
half the time.
Flights 2012 Typical
2015 Most Likely
2015 High Forecast
2019 Most Likely
2019 High Forecast
Annual 805 945 1,575 1,120 1,750
Average Per Hr Weekday
0.17 0.20 0.34 0.24 0.38
Average Per Hr Weekend
0.11 0.13 0.21 0.15 0.24
Table B8: Runway 06 Arrivals from the south
Under this proposal, all future arrivals from the south would route in a similar manner to
today, and would be joined by the arrivals from the southwest (adding from Table B9).
Flights 2012 Typical
2015 Most Likely
2015 High Forecast
2019 Most Likely
2019 High Forecast
Annual 230 270 450 320 500
Average Per Hr Weekday
0.05 0.06 0.10 0.07 0.11
Average Per Hr Weekend
0.03 0.04 0.06 0.04 0.07
Table B9: Runway 06 Arrivals from the southwest
Under this proposal, all future arrivals from the southwest would route at a higher altitude
heading eastwards, turning left to join the arrivals from the south (adding to Table B8).

Local considerations for route positioning
Airspace Consultation
Part B: Proposed Changes below 4,000ft in the vicinity of Farnborough Airport Page B33
Arriving Aircraft Numbers for Runway 24: Figures B8 and B11
Flights 2012 Typical
2015 Most Likely
2015 High Forecast
2019 Most Likely
2019 High Forecast
Annual 5,060 5,940 9,900 7,040 11,000
Average Per Hr Weekday
1.10 1.29 2.14 1.52 2.38
Average Per Hr Weekend
0.68 0.80 1.34 0.95 1.48
Table B10: Runway 24 Arrivals from the north
Under this proposal, all future arrivals from the north would route in a similar manner to
today.
Flights 2012 Typical
2015 Most Likely
2015 High Forecast
2019 Most Likely
2019 High Forecast
Annual 3,220 3,780 6,300 4,480 7,000
Average Per Hr Weekday
0.70 0.82 1.36 0.97 1.52
Average Per Hr Weekend
0.43 0.51 0.85 0.60 0.94
Table B11: Runway 24 Arrivals from the south
Under this proposal, all future arrivals from the south would route in a similar manner to
today, and would be joined by the arrivals from the southwest (adding from Table B12).
Flights 2012 Typical
2015 Most Likely
2015 High Forecast
2019 Most Likely
2019 High Forecast
Annual 920 1,080 1,800 1,280 2,000
Average Per Hr Weekday
0.20 0.23 0.39 0.28 0.43
Average Per Hr Weekend
0.12 0.15 0.24 0.17 0.27
Table B12: Runway 24 Arrivals from the southwest
Under this proposal, all future arrivals from the southwest would route at a higher altitude
heading eastwards, turning left to join the arrivals from the south (adding to Table B11).

Airspace Consultation
Local considerations for route positioning
Page B34 Part B: Proposed Changes below 4,000ft in the vicinity of Farnborough Airport
Departure Noise Information
Height above ground Peak noise impact of most common aircraft types Executive Jets (75%)
Peak noise impact of noisiest aircraft types A320/ Boeing 737 (10%)
Up to 2,000ft 75-92 dBA 75-93 dBA
2,000ft-3,000ft 69-75 dBA 70-75 dBA
3,000ft-4,000ft 64-69 dBA 66-70 dBA
Table B13: Departures - Typical loudest noise level (Lmax dBA) at various heights
for the most common aircraft types, and the noisiest aircraft types, using
Farnborough
The highest Lmax dBA would be for the aircraft at the lowest altitude in each band.
Arrival Noise Information
Height above ground (ft) Peak noise impact of most common aircraft types Executive Jets (75%)
Peak noise impact of noisiest aircraft types A320/ Boeing 737 (10%)
Up to 2,000 66-87 dBA 69-87 dBA
2,000-3,000 60-66 dBA 64-69 dBA
3,000-4,000 57-60 dBA 61-64 dBA
Table B14: Arrivals - Typical loudest noise level (Lmax dBA) at various heights for
the most common aircraft types, and the noisiest aircraft types, using
Farnborough
The highest Lmax dBA would be for the aircraft at the lowest altitude in each band.
Table of Equivalent Sounds
Example Sound Noise level (dBA)
Chainsaw, 1m distance 110
Disco, 1m from speaker 100
Diesel truck pass-by, 10m away 90
Kerbside of busy road, 5m away 80
Vacuum cleaner, 1m distance 70
Conversational speech, 1m away 60
Quiet office 50
Room in quiet suburban area 40
Table B15: Table of noise levels (Lmax dBA) for equivalent sounds15
15 Based substantially on www.sengpielaudio.com/TableOfSoundPressureLevels.htm
Local considerations for route positioning
Airspace Consultation
Part B: Proposed Changes below 4,000ft in the vicinity of Farnborough Airport Page B35
Figure B3: All commercial flights (up to 20,000ft) density plot with National Parks and AONBs
KEY: Flights Per Day
More than 24
>18 to 24
>12 to 18
>6 to 12Up to 6 per day
© TAG Farnborough
except Ordnance Survey data ©
Crown copyright and database right 2013
Airfield
Farnborough
Airport
Use PDF zoom tools
to study this map
more closely
South Downs
National Park
Surrey Hills
AONB
Surrey Hills
AONB
High Weald
AONB
North Wessex
Downs AONB
North Wessex
Downs AONB
National Park
or AONB
Figure B3 All commercial flights (up to 20,000ft) Density Plot with National Parks and AONBs
Heathrow
N
W E
S

Airspace Consultation
Local considerations for route positioning
Page B36 Part B: Proposed Changes below 4,000ft in the vicinity of Farnborough Airport
Figure B4: Farnborough departures and arrivals (up to 20,000ft) density plot Figure B4 Farnborough departures and arrivals (up to 20,000ft) Density Plot
© TAG Farnborough
except Ordnance Survey data ©
Crown copyright and database right 2013
Airfield
Farnborough
Airport
Use PDF zoom tools
to study this map
more closely
KEY: Flights Per Day
More than 8
>5 to 8
>3 to 5
1 to 3Fewer than 1 Per Day
N
W E
S

Local considerations for route positioning
Airspace Consultation
Part B: Proposed Changes below 4,000ft in the vicinity of Farnborough Airport Page B37
Figure B5: Arrows/dotted lines show Runway 06 departure flows (Radar data shows all Farnborough air traffic below 4,000ft)
KEY: Flights Per Day
More than 8
>5 to 8
>3 to 5
1 to 3Fewer than 1 Per Day
© TAG Farnborough
except Ordnance Survey data ©
Crown copyright and database right 2013
Airfield
Farnborough
Airport
Use PDF zoom tools
to study this map
more closely
Runway 06
Departure
Flows
Figure B5 Arrows/dotted lines show Runway 06 departure flows (Radar data shows all Farnborough air traffic below 4,000ft)
N
W E
S
1
2
3
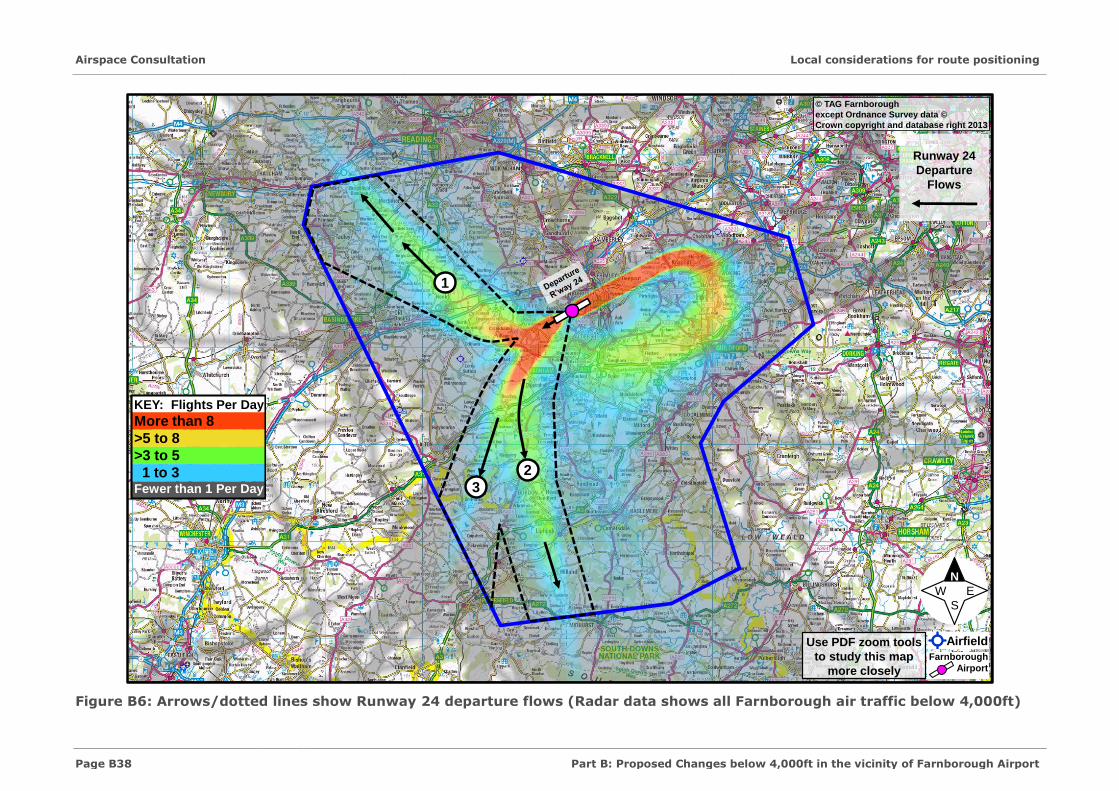
Airspace Consultation
Local considerations for route positioning
Page B38 Part B: Proposed Changes below 4,000ft in the vicinity of Farnborough Airport
Figure B6: Arrows/dotted lines show Runway 24 departure flows (Radar data shows all Farnborough air traffic below 4,000ft)
© TAG Farnborough
except Ordnance Survey data ©
Crown copyright and database right 2013
KEY: Flights Per Day
More than 8
>5 to 8
>3 to 5
1 to 3Fewer than 1 Per Day
Airfield
Farnborough
Airport
Use PDF zoom tools
to study this map
more closely
Runway 24
Departure
Flows
Figure B6 Arrows/dotted lines show Runway 24 departure flows (Radar data shows all Farnborough air traffic below 4,000ft)
N
W E
S
1
2
3

Local considerations for route positioning
Airspace Consultation
Part B: Proposed Changes below 4,000ft in the vicinity of Farnborough Airport Page B39
Figure B7: Arrows/dotted lines show Runway 06 arrival flows (Radar data shows all Farnborough air traffic below 4,000ft)
KEY: Flights Per Day
More than 8
>5 to 8
>3 to 5
1 to 3Fewer than 1 Per Day
Airfield
Farnborough
Airport
Use PDF zoom tools
to study this map
more closely
© TAG Farnborough
except Ordnance Survey data ©
Crown copyright and database right 2013
Runway 06
Arrival
Flows
1
3
2
Figure B7 Arrows/dotted lines show Runway 06 arrival flows (Radar data shows all Farnborough air traffic below 4,000ft)
4
N
W E
S

Airspace Consultation
Local considerations for route positioning
Page B40 Part B: Proposed Changes below 4,000ft in the vicinity of Farnborough Airport
Figure B8: Arrows/dotted lines show Runway 24 arrival flows (Radar data shows all Farnborough air traffic below 4,000ft)
KEY: Flights Per Day
More than 8
>5 to 8
>3 to 5
1 to 3Fewer than 1 Per Day
© TAG Farnborough
except Ordnance Survey data ©
Crown copyright and database right 2013
Airfield
Farnborough
Airport
Use PDF zoom tools
to study this map
more closely
Runway 24
Arrival
Flows
1
2
Figure B8 Arrows/dotted lines show Runway 24 arrival flows (Radar data shows all Farnborough air traffic below 4,000ft)
3
N
W E
S

Local considerations for route positioning
Airspace Consultation
Part B: Proposed Changes below 4,000ft in the vicinity of Farnborough Airport Page B41
Figure B9: Proposed Farnborough departures from both runways below 4,000ft
See Part C for consultation information in this area
for departures to the north and to the southwest
© TAG Farnborough
except Ordnance Survey data ©
Crown copyright and database right 2013
Min 3,000ft,
typically 4,000ft+
Airfield
Farnborough
Airport
Use PDF zoom tools
to study this map
more closely
Min 1,000ft,
Max 2,000ft
Min 2,000ft,
Max 3,000ft
1,000ft
or below
Departures
may be
within this area
at any altitude
Departures
are most likely to be
between these lines
Departures
would usually be
between these lines
Normally 4,000ft
and above
Figure B9 Proposed Farnborough departures from both runways below 4,000ft
Departure
Flows
N
W E
S
Few or no
departures
in this area
Few or no
departures
in this area
See Part C for consultation information in
this area, and also regarding a proposed
alternate departure route to the south
See Part C regarding a proposed
alternate departure route to the south
(to be infrequently used, 5,000ft+).
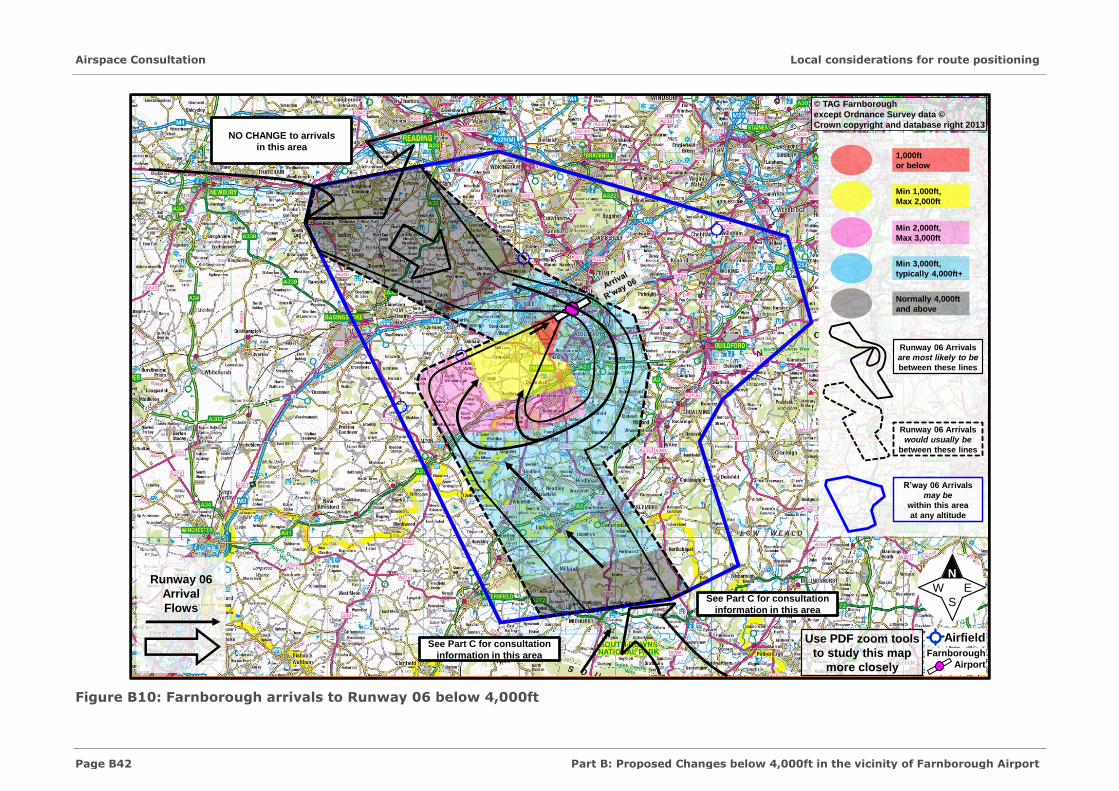
Airspace Consultation
Local considerations for route positioning
Page B42 Part B: Proposed Changes below 4,000ft in the vicinity of Farnborough Airport
Figure B10: Farnborough arrivals to Runway 06 below 4,000ft
R’way 06 Arrivals
may be
within this area
at any altitude
Normally 4,000ft
and above
Min 3,000ft,
typically 4,000ft+
Min 1,000ft,
Max 2,000ft
Min 2,000ft,
Max 3,000ft
1,000ft
or below
Airfield
Farnborough
Airport
Use PDF zoom tools
to study this map
more closely
© TAG Farnborough
except Ordnance Survey data ©
Crown copyright and database right 2013
Runway 06 Arrivals
are most likely to be
between these lines
Runway 06 Arrivals
would usually be
between these lines
Figure B10 Farnborough arrivals to Runway 06 below 4,000ft
Runway 06
Arrival
Flows
See Part C for consultation
information in this area
NO CHANGE to arrivals
in this area
See Part C for consultation
information in this area
N
W E
S

Local considerations for route positioning
Airspace Consultation
Part B: Proposed Changes below 4,000ft in the vicinity of Farnborough Airport Page B43
Figure B11: Farnborough arrivals to Runway 24 below 4,000ft
R’way 24 Arrivals
may be
within this area
at any altitude
Normally 4,000ft
and above
Min 3,000ft,
typically 4,000ft+
Min 1,000ft,
Max 2,000ft
Min 2,000ft,
Max 3,000ft
1,000ft
or below
Runway 24 Arrivals
are most likely to be
between these lines
Runway 24 Arrivals
would usually be
between these lines
© TAG Farnborough
except Ordnance Survey data ©
Crown copyright and database right 2013
Airfield
Farnborough
Airport
Use PDF zoom tools
to study this map
more closely
Figure B11 Farnborough arrivals to Runway 24 below 4,000ft
Runway 24
Arrival
Flows
See Part C for consultation
information in this area
See Part C for consultation
information in this area
NO CHANGE to arrivals
in this area
N
W E
S
Airspace Consultation
Local considerations for route positioning
Page B44 Part B: Proposed Changes below 4,000ft in the vicinity of Farnborough Airport
Question B4 – Specific Locations
This question is about places within the consultation swathes.
In Section 4 we asked you to consider your area(s) of interest using the maps, and compare the impact now with the impact under this proposal.
We want you to tell us about places within the blue consultation region that you
think require special consideration in the ongoing design process.
Ideally, you would supply us with a postcode of the location. Otherwise, please use
town or village names, the names of National Parks/AONBs, or other easily identifiable location. This means we can find the right place more easily.
Tell us broadly what type of place this is by choosing the closest type from the
online menu. Do you think these places would benefit from the proposed change, or not, and to what extent? Describe the characteristics of these places, stating
whether they should be considered special due to concerns about noise impact, visual impact or other reason.
You can do this for as many locations as you wish. We have provided a template
for you below. Choose the closest or most important option from those suggested, or add your own if none are suitable.
Structuring your response like this will make it easier for us to analyse your feedback, which in turn makes it more effective on your behalf.
Location
Postcode, or name of easily identifiable place.
What type of place is this? I consider this a…
Populated residential area / Busy commercial area (town centre, retail park) / Industrial area (including military use) / Recreational area / Tranquil area /
Sensitive area (e.g. hospital) / Village / Nature area / Tourist attraction / Transport link (railway, motorway, airport) / Other (brief description)
What would the change in impact be, on this place? If the change occurred,
this place would…
Benefit significantly from the change / Benefit slightly / Probably not notice the
change / Be slightly negatively impacted / Be very negatively impacted by the change
Why would the impact change, on this place? If I was at this place…
I would hear less aircraft noise / I would see fewer aircraft / It wouldn’t make much difference to me / I would hear more aircraft noise / I would see more aircraft /
Other (brief description)
Choose the most relevant, or most important, item from the suggestions, or add
your own if none are suitable.
Please repeat this process until you have finished telling us about specific locations
that you think require special consideration
.

Northern dashed blue area – GA impact in the vicinity
Airspace Consultation
Part B: Proposed Changes below 4,000ft in the vicinity of Farnborough Airport Page B45
5. Northern dashed blue area – GA impact in the vicinity
5.1. The northern blue dashed area shown in Figure B1, and zoomed in Figure
B12 below, is currently sometimes used by light GA aircraft, helicopters
to/from London, and flights to/from Fairoaks airport.
5.2. No Farnborough flights operate within this area.
5.3. GA aircraft wishing to route between the east and west must currently avoid Heathrow by routing outside the red and blue areas, so they fly around the
southern blue edge. This makes them more likely to interact with our
departures and arrivals (see the yellow arrow on Figure B12). To manage
this safely, our controllers apply a delay or a longer routing to our aircraft.
This is unpredictable and inefficient for Farnborough flights, Fairoaks flights,
and other GA aircraft in the vicinity.
5.4. As part of the airspace redesign, we have the opportunity16 to use this blue
area. If requested, we could give these light GA aircraft a shortcut between
east and west (or vice versa). It would also take them away from
Farnborough’s departure and arrival flight-paths, reducing overall delay and
increasing airspace efficiency.
5.5. The consequence of this increased efficiency and predictability would be a
probable increase in light GA aircraft within the blue area, mainly routing
along the ‘corridor’ in either direction. From anecdotal evidence and through speaking with local experts, we estimate an average of four to five light GA
flights per day would use this blue corridor, and they would most likely be
between 1,000ft and 2,000ft.
5.6. This number would vary day by day. We would expect more when the
weather is good, far fewer when dark, and fewer still (or none at all) when
the weather is bad. We also know that GA flight-paths tend to be relatively
unpredictable, so we cannot say precisely where they might fly within the
blue area.
Figure B12: Fairoaks and other light aircraft – Increased access
16 Those with a General Aviation (GA) interest should also see Part E where this is discussed from a GA pilot's perspective. The ‘London CTR
Reclassification’ is driven by European legislation, in order to provide more consistency between member States regarding the use of certain airspace
classifications for certain purposes. Heathrow’s airspace is currently Class A and is likely to change to Class D late 2014.
Fairoaks
Airport
N
W E
S
Figure B12 Fairoaks and other light aircraft – increased access
Heathrow onlyGA under special conditions
Airspace Consultation
Northern dashed blue area – GA impact in the vicinity
Page B46 Part B: Proposed Changes below 4,000ft in the vicinity of Farnborough Airport
Question B5 – Northern Dashed Blue Area – GA impact in the vicinity
This question is about justification for change, and impacts within this area.
In Section 5 we describe our proposal to improve the predictability and efficiency of airspace management for all airspace users. This would be due to the provision of greater access for light GA aircraft to fly inside the blue area.
To what extent do you support or oppose this change, and why?
B5a - Extent
How strongly do you support or oppose this change?
1 Strongly support
2 Somewhat support
3 No preference
4 Somewhat oppose
5 Strongly oppose
B5b – Reason why
This airspace is already used by some light GA aircraft between 1,000ft and 2,000ft.
It includes Fairoaks traffic, and also helicopters serving central London.
Choose the most relevant, or the most important, or supply your own reason.
1 More efficient use of this airspace would be better overall
2 I wouldn’t really notice the difference if this change happened
3 I would definitely notice the difference if this change happened
4 I see no reason to change the current arrangements
5 I object to all existing and future GA flights within this area
6 Other (please add brief reason)

Western blue dashed area - RAF Odiham – Changes to departure routes
Airspace Consultation
Part B: Proposed Changes below 4,000ft in the vicinity of Farnborough Airport Page B47
6. Western blue dashed area - RAF Odiham – Changes to departure routes
6.1. RAF Odiham is six nautical miles away from Farnborough. This means that
we work very closely with their ATC staff at all times, to ensure our aircraft
and theirs operate safely and efficiently.
6.2. The changes we are proposing inevitably affect RAF Odiham.
Some of Odiham’s existing departure routes (called the CPT 27 Group, and
HAZEL/SAM 09, respectively) are being considered for change, in order to
reduce controller and pilot workload.
6.3. There would also be subtle changes to Odiham’s local traffic, known as the
‘radar circuit pattern’. Our operational experts have agreed with Odiham
controllers that these technical changes would lie within the normal extents
and variance of today’s radar circuit pattern. It is extremely unlikely that
these subtle changes would be discernible to people on the ground beneath
today’s radar circuit pattern.
6.4. Other departure routes would not change at all, and the arrival routes would
not be affected.
6.5. RAF Odiham have permitted changes to these two types of departure route
to be proposed here. These changes would increase both Odiham’s flexibility
and ours, should the proposal be implemented, and would keep the ATC
workload to a minimum in the new airspace.
6.6. RAF Odiham’s aircraft currently have the freedom to operate anywhere at
any altitude within Class G airspace in accordance with their military tasks.
This would not change under the proposal – their aircraft would continue to
fly in similar places at similar altitudes most of the time. The departure
route changes described here would facilitate the airspace structure we
propose to implement.
6.7. The best known of RAF Odiham’s aircraft is the Boeing CH-47 ‘Chinook’
helicopter. Other helicopter types such as the Westland Lynx, the Agusta-
Westland Puma and the Merlin sometimes use Odiham, as do some fixed-
wing aircraft.
6.8. The Chinook is the most likely aircraft type to be using these routes, and is
also the noisiest.
6.9. RAF Odiham does not usually fly military operations on weekends or public
holidays. The statistics we present here are from September 2013, which
contained 21 weekdays and no public holidays. This is a good example of a
typical month.
6.10. The RAF does not comment on changes to fleet distribution, therefore it is
not possible to provide an accurate forecast for flights in 2015 or 2019. For
the same reason, we are not able to give current-day radar data illustrating
these routes.

Airspace Consultation
Western blue dashed area - RAF Odiham – Changes to departure routes
Page B48 Part B: Proposed Changes below 4,000ft in the vicinity of Farnborough Airport
Route Changes
6.11. Figure B13 on Page B50 contains two maps. The smaller map shows the CPT
27 Group route, the larger map shows the HAZEL/SAM 09 route.
6.12. Each map illustrates the current (red) and proposed (black) flight-paths so
you can see the difference.
6.13. The lines represent the most likely average centre of the proposed tracks.
There are no swathe corridors in these maps because we do not have
information on military aircraft navigation standards and cannot predict how
far either side of the centreline they may fly.
CPT 27 Group route
6.14. This is the more commonly used route. The track it follows would change
slightly under this proposal.
6.15. It was used 26 times in the month of September 2013, averaging 1.2
departures per day.
6.16. Today, aircraft typically climb straight ahead (west) until passing 900ft,
which is when they start their first turn (to the right, still climbing), to
2,500ft.
6.17. The traffic on this route generally climbs above 2,000ft between the M3 and
the A33, reaching 2,500ft on passing the A33 northbound. Under this
proposal, the climb is expected to operate in a similar manner.
HAZEL/SAM 09 route
6.18. This is used much less often. The track it follows would change significantly
under this proposal.
6.19. It was used twice in the month of September 2013, averaging 0.1
departures per day.
6.20. Today, aircraft typically climb straight ahead (east) until passing 900ft,
which is when they start their first turn (to the left still climbing, back
overhead RAF Odiham), to 2,500ft.
6.21. The traffic on this route generally climbs above 2,000ft overhead RAF
Odiham, reaching 2,500ft when established southbound. Under this
proposal, the climb is expected to pass 2,000ft at about the A31, reaching
2,500ft shortly after (probably on passing the A325).
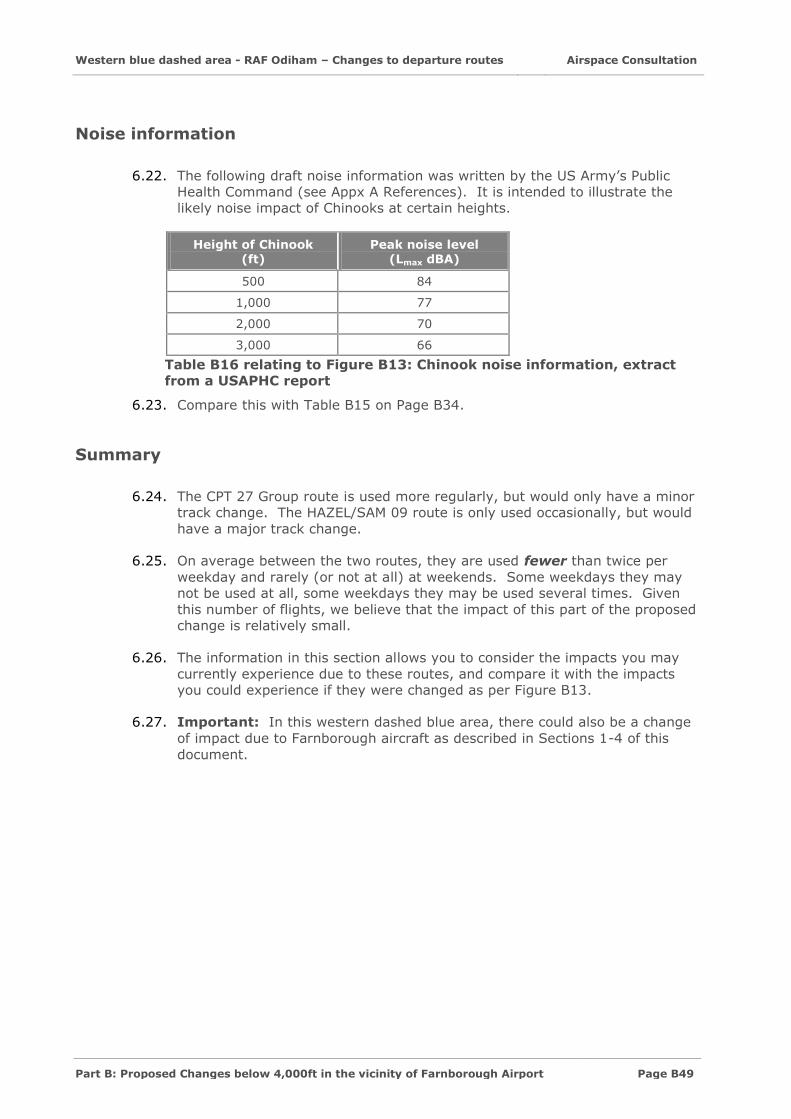
Western blue dashed area - RAF Odiham – Changes to departure routes
Airspace Consultation
Part B: Proposed Changes below 4,000ft in the vicinity of Farnborough Airport Page B49
Noise information
6.22. The following draft noise information was written by the US Army’s Public
Health Command (see Appx A References). It is intended to illustrate the
likely noise impact of Chinooks at certain heights.
Height of Chinook (ft)
Peak noise level (Lmax dBA)
500 84
1,000 77
2,000 70
3,000 66
Table B16 relating to Figure B13: Chinook noise information, extract
from a USAPHC report
6.23. Compare this with Table B15 on Page B34.
Summary
6.24. The CPT 27 Group route is used more regularly, but would only have a minor
track change. The HAZEL/SAM 09 route is only used occasionally, but would
have a major track change.
6.25. On average between the two routes, they are used fewer than twice per
weekday and rarely (or not at all) at weekends. Some weekdays they may
not be used at all, some weekdays they may be used several times. Given
this number of flights, we believe that the impact of this part of the proposed
change is relatively small.
6.26. The information in this section allows you to consider the impacts you may
currently experience due to these routes, and compare it with the impacts
you could experience if they were changed as per Figure B13.
6.27. Important: In this western dashed blue area, there could also be a change
of impact due to Farnborough aircraft as described in Sections 1-4 of this
document.

Airspace Consultation
Western blue dashed area - RAF Odiham – Changes to departure routes
Page B50 Part B: Proposed Changes below 4,000ft in the vicinity of Farnborough Airport
Figure B13: Proposed change to RAF Odiham departure routes (Western blue area)
Current Departure Track
Proposed Departure Track
© TAG Farnborough
except Ordnance Survey data ©
Crown copyright and database right 2013
RAF
Odiham
Other
Airfield
Figure B13 Proposed Change to RAF Odiham Departure Routes (Western blue area)
Use PDF zoom tools
to study this map
more closely
HAZEL/SAM 09
Route
(used occasionally)
CPT Group 27
Route
(used regularly)
Typically 2,000ft
Typically 2,500ft
Typically
2,000ft
Typically
2,500ftExpected
2,500ft
Expected
2,000ft
Expected 2,000ft
Expected 2,500ft
N
W E
S
N
W E
S

Western blue dashed area - RAF Odiham – Changes to departure routes
Airspace Consultation
Part B: Proposed Changes below 4,000ft in the vicinity of Farnborough Airport Page B51
Question B6 – Western Dashed Blue Area - Departure routes from RAF Odiham
This question is about places near these departure routes.
In Section 6 we gave you information to help you decide the current and proposed
impacts this change might have, near these routes.
Consider your area(s) of interest using the maps, and compare the impact now with the impact under this proposal. We want you to tell us about places near these
routes that you think require special consideration in the ongoing design process.
Ideally, you would supply us with a postcode of the location. Otherwise, please use
town or village names, the names of National Parks/AONBs, or other easily identifiable location from the maps in Figure B13. This means we can find the right
place more easily.
Tell us broadly what type of place this is by choosing the closest type from the online menu. Do you think these places would benefit from the proposed change,
or not, and to what extent? Describe the characteristics of these places, stating whether they should be considered special due to concerns about noise impact,
visual impact or other reason.
You can do this for as many locations as you wish. We have provided a template for you below. Choose the closest or most important option from those suggested,
or add your own if none are suitable. Structuring your response like this will make it easier for us to analyse your feedback, which in turn makes it more effective on
your behalf.
Location
Postcode, or name of easily identifiable place.
What type of place is this? I consider this a…
Populated residential area / Busy commercial area (town centre, retail park) /
Industrial area (including military use) / Recreational area / Tranquil area / Sensitive area (e.g. hospital) / Village / Nature area / Tourist attraction / Transport link (railway, motorway, airport) / Other (brief description)
What would the change in impact be, on this place? If the change occurred, this place would…
Benefit significantly from the change / Benefit slightly / Probably not notice the change / Be slightly negatively impacted / Be very negatively impacted by the change
Why would the impact change, on this place? If I was at this place…
I would hear less aircraft noise / I would see fewer aircraft / It wouldn’t make much
difference to me / I would hear more aircraft noise / I would see more aircraft / Other (brief description)
Choose the most relevant, or most important, item from the suggestions, or add
your own if none are suitable.
Please repeat this process until you have finished telling us about specific locations
that you think require special consideration.

Airspace Consultation
Changes above 4,000ft
Page B52 Part B: Proposed Changes below 4,000ft in the vicinity of Farnborough Airport
7. Changes above 4,000ft
7.1. For information relating to changes from 4,000ft to 7,000ft in this vicinity,
see Part C of this consultation document.
7.2. Changes above 7,000ft are designed for flight efficiency because they are far
less likely to be noticeable from the ground. Changes due to this proposal
above 7,000ft are mostly over the sea wherever possible, or are within
modified areas of the current air route network where aircraft are already
common.
General Question
If there is something that you think we should know that hasn’t already been
covered by the questions in this document (or by other questions in other parts of
this consultation), please provide a statement.
![Police Aviation News Farnborough + ALEA · Police Aviation News Farnborough + ALEA 3 11-17 July 2016. Farnborough International Airshow [FIA]. Farnborough, Hampshire. This year may](https://static.fdocuments.in/doc/165x107/5e9e19e3b98669093d52cf99/police-aviation-news-farnborough-police-aviation-news-farnborough-alea-3-11-17.jpg)