
Draft: Nov. 28 - ips-dc.org · Just 100 CEOs have company retirement funds worth $4 ... The...
24
Draft: Nov. 28
Transcript of Draft: Nov. 28 - ips-dc.org · Just 100 CEOs have company retirement funds worth $4 ... The...

Draft: Nov. 28

Authors
Sarah Anderson directs the Global Economy Project at the Institute for Policy Studies and
has co-authored 23 IPS annual reports on executive compensation. She is also a co-editor
of the IPS web site Inequality.org.
Scott Klinger has worked in the arenas of corporate social responsibility, executive
compensation, and corporate taxes for three decades. He crafted the first shareholder
proposals on executive pay while working as a social investment portfolio manager. Scott
is a CFA charterholder.
Research Assistance: Christopher Pitt.
Design: Kenneth Worles.
Acknowledgements: We’re indebted to Monique Morrissey of the Economic Policy Institute for
generously providing data on retirement assets of American families. We also highly value the
thoughtful input received on last year’s edition from Nancy Altman of Social Security Works.
The Institute for Policy Studies (www.IPS-dc.org) is a multi-issue research center that has conducted path-
breaking research on executive compensation for more than 20 years.
The IPS Inequality.org website (http://inequality.org/) provides an online portal into all things related to the
income and wealth gaps that so divide us, in the United States and throughout the world. Sign up for our
weekly newsletter at: http://inequality.org/thisweek/ Twitter: @inequalityorg
Institute for Policy Studies
1301 Connecticut Ave. NW, Suite 600
Washington, DC 20036
202 234-9382
www.ips-dc.org, Twitter: @IPS_DC
Facebook: http://www.facebook.com/InstituteforPolicyStudies
Email: [email protected]
© 2016 Institute for Policy Studies

Contents
Key Findings…………………………………………………………………………….…… 1
Introduction ……………………………………………………………………….….…….. 2
The Retirement Divide……………………….……………………………..…….………… 3
CEOs v. the rest of us
CEOs v. African-American and Latino families
CEOs v. female-headed households
CEOs v. white working class families
White male CEOs v. other CEOs
History of the Retirement Divide...…………………………………..…………………… 10
Reforms to Narrow the Retirement Divide……………………………………………… 14
Appendix 1: The 100 CEOs with the largest retirement assets …………………….… 17
Appendix 2: Methodology and sources………………………..……….………………. 20
Endnotes…………………………………………….……………..……….………………. 21
1
Key findings
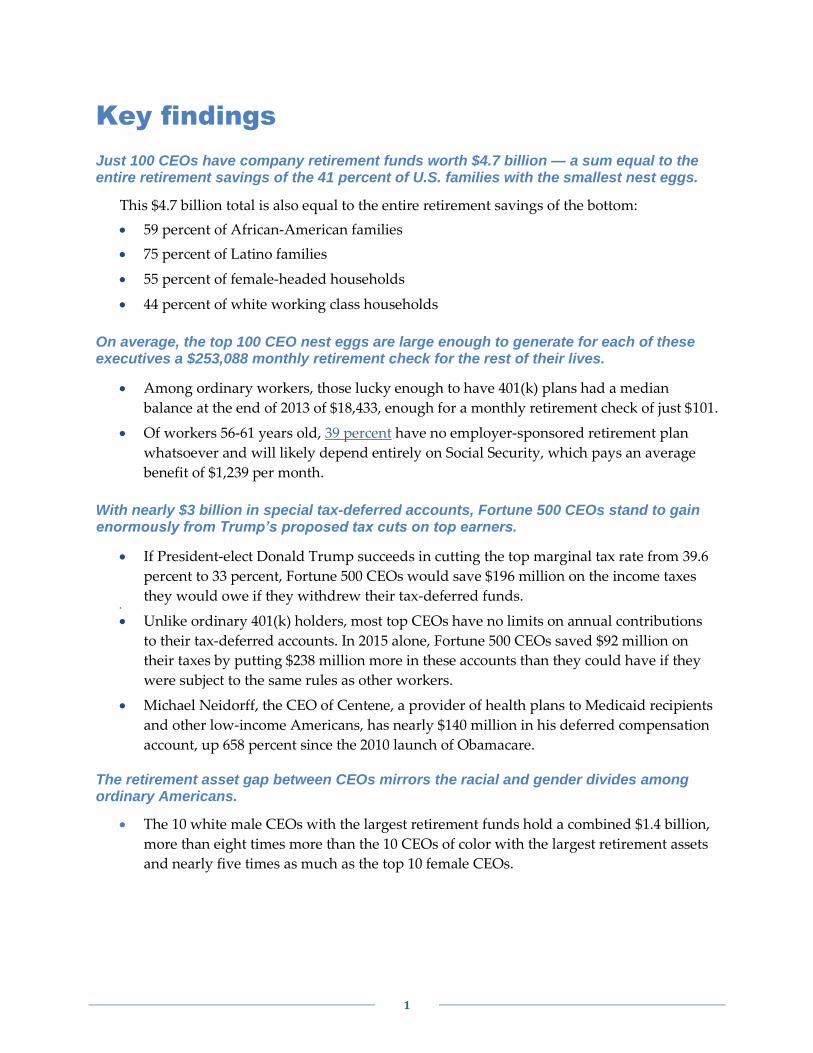
Just 100 CEOs have company retirement funds worth $4.7 billion — a sum equal to the entire retirement savings of the 41 percent of U.S. families with the smallest nest eggs.
This $4.7 billion total is also equal to the entire retirement savings of the bottom:
59 percent of African-American families
75 percent of Latino families
55 percent of female-headed households
44 percent of white working class households
On average, the top 100 CEO nest eggs are large enough to generate for each of these executives a $253,088 monthly retirement check for the rest of their lives.
Among ordinary workers, those lucky enough to have 401(k) plans had a median
balance at the end of 2013 of $18,433, enough for a monthly retirement check of just $101.
Of workers 56-61 years old, 39 percent have no employer-sponsored retirement plan
whatsoever and will likely depend entirely on Social Security, which pays an average
benefit of $1,239 per month.
With nearly $3 billion in special tax-deferred accounts, Fortune 500 CEOs stand to gain enormously from Trump’s proposed tax cuts on top earners.
If President-elect Donald Trump succeeds in cutting the top marginal tax rate from 39.6
percent to 33 percent, Fortune 500 CEOs would save $196 million on the income taxes
they would owe if they withdrew their tax-deferred funds.
Unlike ordinary 401(k) holders, most top CEOs have no limits on annual contributions
to their tax-deferred accounts. In 2015 alone, Fortune 500 CEOs saved $92 million on
their taxes by putting $238 million more in these accounts than they could have if they
were subject to the same rules as other workers.
Michael Neidorff, the CEO of Centene, a provider of health plans to Medicaid recipients
and other low-income Americans, has nearly $140 million in his deferred compensation
account, up 658 percent since the 2010 launch of Obamacare. The retirement asset gap between CEOs mirrors the racial and gender divides among ordinary Americans.
The 10 white male CEOs with the largest retirement funds hold a combined $1.4 billion,
more than eight times more than the 10 CEOs of color with the largest retirement assets
and nearly five times as much as the top 10 female CEOs.
2
Introduction
The presidential election put a spotlight on the decline of American manufacturing and the
related economic insecurity among white working class males. In recent decades, this
demographic group lost millions of unionized factory jobs that were once a major source of
both decent pay and retirement benefits.
But they’re not the only ones with reason to be concerned about their economic futures. White
working class families, families of color, and female-headed households share common worries
about whether they’ll be able to afford to retire and whether their golden years will be tarnished
by financial stress. Our country’s real retirement divide is between those at the top of corporate
America and nearly all the rest of us.
This second annual IPS “Two Retirements” report provides a detailed analysis of this CEO-
worker retirement benefit gap. As our numbers make startlingly clear, big company CEOs are
continuing to enjoy colossal nest eggs while many of these leaders are further eroding their own
employees’ retirement security.
Why has the CEO-worker retirement benefit gap become such a chasm? This is not the result of
executives working harder or investing more wisely. Instead, this gap is one more example of
rule-rigging in favor of the 1%.
Pension rules: Ordinary workers face strict limits on how much pre-tax income they can
invest each year in tax-deferred plans like 401(k)s. But most Fortune 500 firms set up special
unlimited tax-deferred compensation accounts for their executives where their money can
grow, tax-free, until they retire and withdraw it.
Compensation rules: Since more than half of executive compensation is now tied to the
company’s stock price, CEOs have a powerful personal incentive for slashing worker
retirement benefits in order to boost the short-term bottom line. Every dollar not spent on
employee retirement security is money in the CEO’s pocket.
Tax rules: CEO retirement funds are growing because CEO pay is growing and much of it
is stashed in executive tax-deferred retirement accounts. Our tax code encourages excessive
CEO pay by allowing corporations to deduct unlimited amounts of executive compensation
off their federal income taxes, as long as it is “performance-based.” The more corporations
pay their CEO, the less they owe in taxes. The rest of us make up the difference.
This report ends with a series of proposals to unrig the rules that bloat CEO retirement benefits
while ensuring a dignified retirement for other Americans.

3
The Retirement Divide
On top of their massive annual paychecks, CEOs of most large U.S. corporations have amassed
gilded retirement fortunes. These fortunes come from two pots:
1. Pension plans: CEOs often participate in both a regular employee plan (if it’s available) and
a far more lucrative Supplemental Executive Retirement Plan. SERPs can be designed as defined
benefit plans, which guarantee a monthly check after retirement, or as defined contribution
plans, which may include variable or performance-based features.
2. Non-qualified Deferred compensation plans: Whereas ordinary workers face limits on
how much of their pay they can set aside each year in a 401(k) or other defined contribution
plan (currently $24,000 for employees approaching retirement), CEOs face no such limits on
special deferred compensation plans set up by their companies.
Based on SEC filings, the 100 largest CEO nest eggs in the Fortune 500 in 2015 amounted to a
combined total of $4.7 billion. Glenn Renwick of the Progressive insurance company had the
largest, with more than $194 million. He retired in July 2016, and using an annuities calculator,
we estimate his monthly retirement check to be more than $1 million. The eight largest funds
each exceeded $120 million. All of these men can expect to receive a check for more than a half
million dollars every month for the rest of their lives.
The 10 Largest CEO Retirement Funds
CEO Corporation Total retirement
assets, 2015 Monthly
retirement check
Glenn M. Renwick Progressive $194,468,207 $1,035,733
Paul Saville NVR $175,241,964 $933,335
David M. Cote Honeywell $170,618,895 $908,712
John H. Hammergren McKesson $146,891,146 $782,339
Michael F. Neidorff Centene $139,664,473 $743,850
Larry J. Merlo CVS Health $138,156,128 $735,816
Richard B. Handler Leucadia National $136,214,897 $725,477
Brian L. Roberts Comcast $126,604,993 $705,770
Jeffrey R. Immelt General Electric $92,164,987 $490,869
John Strangfeld Prudential Financial $85,054,087 $453,179
See Appendix 1 for details on the 100 largest CEO retirement funds in 2015. While the combined
value of these funds was down slightly over the top 100 total in 2014, this was due to the
departure of just a few CEOs with exceptionally large retirement funds. Among the 85 CEOs
who appeared on the top 100 lists in both 2014 and 2015, retirement assets grew by 4 percent on
average last year. By contrast, more than 70 percent of U.S. investors lost money in 2015.

4
John Hammergren, McKesson
Closing worker pensions while feathering a $147 million nest egg
A few months after John Hammergren joined McKesson in 1996, the drug wholesaling giant
froze its employee pension fund, closing it to employees who started work in 1997. But that
didn’t stop the company from launching a lavish Executive Benefit Retirement Account that
has showered Hammergren with $114 million in McKesson pension assets. That works out to
nearly $22,000 per day during the 20 years he’s spent as CEO. 1 Hammergren has another $33
million socked away in his tax-deferred compensation account, for a total retirement nest egg
of $147 million, the fourth-largest in the Fortune 500.
McKesson’s pay has come under intense scrutiny. Recently, the Teamsters union called for the
firm to claw back millions of dollars in bonuses that went to Hammergren during a period in
which the union charges the CEO damaged the company’s reputation by failing to prevent
opioids produced by the firm from being diverted into the black market.
Profiting from Obamacare
Health care CEOs are particularly well-represented at the top of the largest nest egg list. There
are 10 chief executives from this sector in the top 100, including three that made it into the top
10. The health industry CEO with the largest increase in his retirement assets since the launch of
the Affordable Care Act is Centene’s Michael Neidorff. While leading a firm whose core
business is managing state-run Medicaid programs for low-income Americans, Neidorff has
seen his retirement assets balloon by 658 percent since 2010 to nearly $140 million.
Health Care CEOs Among the Top 100 in Retirement Assets
CEO Corporation Total retirement
assets, 2015
% change since Obamacare
began in 2010
John Hammergen McKesson $146,891,146 38.0%
Michael Neidorff Centene $139,664,743 658.3%
Larry Merlo CVS Health $138,156,128 264.9%
Ian Read Pfizer $81,849,948 217.8%
Wayne Smith Community Health $52,726,124 63.6%
John Lechleiter Eli Lilly $48,012,204 83.9%
Myles White Abbott Labs $35,999,563 38.3%
Kenneth Frazier Merck $32,882,143 178.7%
Lamberto Andreotti Bristol Myers $31,449,725 500.6%
Alex Gorsky Johnson & Johnson $23,300,399 N/A (started in 2012)
Total
$730,932,123

5
CEOs v. the Rest of Us
The sum of the 100 largest CEO company retirement funds — $4.7 billion — is equal to the
entire retirement account savings of the 41 percent of American families that have the least
amount of retirement savings (this represents 50 million families and 116 million people).
On average, the CEOs’ nest eggs are worth nearly $47.5 million. If converted to an annuity at
age 65, this would be enough to generate a $253,088 monthly retirement check for the rest of
their lives. Contrast that with the situation for ordinary workers. For those lucky enough to
have a 401(k) plan, the median balance at the end of 2013 was just $18,433, enough for a
monthly retirement check of just $101.
According to the Economic Policy Institute, the share of prime working age families covered by
a defined benefit pension dropped from 41 percent in 1989 to 21 percent in 2013. Of workers 56-
61 years old, 39 percent have no employer-sponsored retirement plan whatsoever. These
workers are likely to be wholly dependent on Social Security, which pays an average benefit of
$1,239 per month.
Younger Americans face a particularly difficult time saving for retirement. More than half of
millennials have not yet begun to save for retirement because of stagnating wages and high
levels of student loan debt. Americans under 40 have saved 7 percent less for retirement than
people in that age group were able to save in 1983. As our population ages, young workers will
have an even harder time gaining a foothold in the economy, as more experienced employees
have no choice but to extend their working years.
Since corporate retirement plans are based in part on earnings, women and people of color, who
earn on average significantly lower wages than their white male counterparts, fare worse in
retirement.
41 percent of all American families
(represents 50 million families and 116 million people. Of all American families, 37% have no retirement wealth)
59 percent of African-American families
(represents 11 million families and 25 million people. Of all African-American families, 51% have no retirement wealth)
75 percent of Latino families
(represents 10 million families and 29 million people. Of all Latino families, 66% have no retirement wealth)
55 percent of female-headed households
(represents 19 million families and 37 million people. Of all female-headed households, 49% have no retirement wealth)
44 percent of white working class households
(represents 21 million families and 47 million people. “Working class” is defined as non-college-educated. Of all white working class households, 39% have no retirement wealth)
The Top 100 CEOs Have More Retirement Wealth Than...

6
CEOs v. African-American and Latino families
The 100 largest CEO retirement funds are worth a combined $4.7 billion. That’s equal to the
entire retirement account savings of 59 percent of African-American families and 75 percent of
Latino families. Fifty-one percent of African-American families and 66 percent of Latino families
have no retirement savings at all, compared to 37 percent of all U.S. households. For families
that do have retirement account savings, the median amount balance is $22,000 for black and
Latino families, compared with $73,000 for white families.
Monique Morrisey of the Economic Policy Institute has done in-depth analysis of prime
working age families, those headed by individuals 32 to 61 years old. One of her key findings is
that 59 percent of full-time white workers and 53 percent of African Americans in this age
group were enrolled in an employer-based retirement plan in 2012, compared to only 34 percent
of Latinos. She has concluded that the main reason for this is that Latinos are more likely to
work for employers who offer no plan whatsoever. Nearly 60 percent of Latino full-time
workers are in this situation.
CEOs v. female-headed households
The $4.7 billion held in the 100 largest CEO retirement funds is equal to the entire retirement
account savings of 55 percent of female-headed households. Throughout their work lives,
women typically earn 79 cents for every dollar earned by a man. They also are more likely than
men to leave the workforce for a number of years to tend to their children. Because defined
benefit and defined contribution plans as well as Social Security are all based in part on lifetime
earnings, both of these factors contribute to women having fewer retirement assets than men.
Median incomes for women 65 and older are 45 percent lower than their male counterparts
($17,375 vs. $31,169). Once retired, women must stretch their retirement savings further because
they live longer than men. According to EPI’s Morrisey, single women are particularly
vulnerable to economic hardship in their old age. As of 2013, households headed by prime
working age single women had only $30,000 in retirement savings, compared to $34,000 for
single men and $78,000 for married couples.
CEOs v. white working class families
The retirement divide between CEOs and the white working class is also extreme. The top 100
CEOs’ nest eggs are equal to the total retirement savings of the 44 percent of white working
class families with the least amount of retirement wealth. This represents 21 million families
headed by a white person without a college education, or 47 million people.
The share of white working class families with no retirement savings whatsoever is 39 percent.
This makes this demographic group more likely to have some retirement savings than African-
American, Latino, and female-headed households. But the economic hardship tens of millions
of non-college-educated whites are facing in their old age is still severe and their slight edge

7
over other demographic groups does little to reduce their concerns. As polling around the
presidential election suggests, the demoralizing downward economic slide of the white
working class over the past several decades has heightened economic insecurity and fears for
the future. Less than a quarter of the white working class expect their children to do better than
them economically, compared to 36 percent of working class African-Americans and 48 percent
of working class Latinos, according to a CNN-Kaiser Family poll.
The United States has lost five million manufacturing jobs since 2000 alone. Those that still exist
tend to pay less and provide fewer benefits. The hollowing out of American manufacturing is a
significant factor in the drop in private sector employee pension coverage by more than half
since the early 1990s. The number of manufacturing jobs held by black workers has declined
more rapidly than for white workers. But in terms of total job losses from industrial decline,
white workers without a college education have experienced the largest losses.
Trump Tax Plan Will Make CEO Retirement Loopholes More Lucrative
One major reason CEO retirement assets are so large is that the tax code allows preferential
treatment for executives. The 50 percent of Americans who are offered a 401(k) plan at their
workplace face strict limits on how much they can set aside tax-free each year toward their
retirement. Workers 50 and older can contribute $24,000 each year, while younger workers can
contribute $18,000 tax-free into their 401(k).
Most CEOs of big corporations have no such limits. Nearly three-fourths of Fortune 500 firms
offer special unlimited deferred compensation plans to their top executives. The corporations
may not deduct the cost of this compensation off their income taxes until it is withdrawn, and
therefore such plans are restricted to just a handful of elite executives. Executives with these
special deferred accounts benefit from the tax-free compounding of investment returns.
The 10 Largest CEO Deferred Compensation Accounts
CEO Company Total deferred compensation
Glenn M. Renwick Progressive $194,363,690
Paul Saville NVR $175,241,964
Michael F. Neidorff Centene $139,193,316
Richard B. Handler Leucadia National $135,875,302
Brian L. Roberts Comcast $126,604,993
David M. Cote Honeywell $114,648,591
Larry J. Merlo CVS Health $93,624,599
C. Douglas McMillon Walmart $67,824,078
Thomas J. May Eversource Energy $55,938,452
John P. Wiehoff CH Robinson Worldwide $55,153,642

8
Because CEOs pay only pay income taxes on these sums once they withdraw the funds, those
that have accumulated huge balances in these tax-deferred accounts stand to benefit
enormously if President-elect Donald Trump succeeds in his plan to cut the top marginal tax
rate from 39.6 percent to 33 percent. As of the end of 2015, Fortune 500 CEOs had accumulated
nearly $3 billion in these deferred compensation accounts. At a 39.6 percent income tax rate,
they would owe $1.2 billion to the IRS on this income. At a 33 percent rate, they would owe
Uncle Sam only $979 million, for a combined savings of $196 million.
Executives can also take steps to minimize their state income tax liability by moving after
retirement to a state with low or no state income taxes (e.g., Florida). These accounts can even
be passed on to the executive’s heirs, allowing our country’s extreme wealth concentration to be
passed on to future generations.
The federal government and state governments lose millions of dollars of revenue a year
because of these tax-deferred accounts. In 2007, the Senate passed a minimum wage bill that
would have limited annual executive pay deferrals to $1 million, but the provision was dropped
in the conference committee. According to the Joint Tax Committee, at that time the measure
would’ve saved taxpayers $806 million over 10 years. With today’s even larger deferred
accounts, the taxpayer benefits of eliminating this loophole are likely much larger.
In 2015 alone, 215 Fortune 500 CEOs invested a combined $227 million more of their pre-tax
income in these plans than they would have been able to invest if they’d been subject to the
maximum $24,000 cap that applies to ordinary workers. If they had been subject to this limit,
they would’ve owed the U.S. Treasury $90 million more in income taxes last year.2 The CEO
with the largest nest egg, Glenn Renwick of Progressive Insurance, has $194 million in deferred
compensation. In 2015, he added $25 million more to this account than his own employees
would be allowed to, saving $9.8 million on his tax bill that year.
Walmart CEO Doug McMillon had $67.8 million in his deferred compensation account in
2015. This was the eighth-largest tax-sheltered stash in the Fortune 500, impressive for a
man who’s been CEO since just 2014. But it still pales in comparison to the nest egg enjoyed
by his predecessor, Michael Duke. In 2013, he walked away with more than $140 million in
deferred compensation. Lee Scott, who led the giant retailer from 2000 to 2009, accumulated
$47 million in his tax-sheltered pot. All total, these three CEOs had more than a quarter of a
billion dollars in these accounts.
Among the 1.5 million ordinary U.S. Walmart employees, less than two-thirds have a
company-sponsored retirement account. Those that do have an average balance of just
$23,893 — enough to generate a monthly retirement check of $131 per month. CEO
McMillon can expect to receive at least $360,000 every month — more than 2,700 times the
amount a typical Walmart worker with a 401(k) account can expect.
Walmart: The Quarter Billion Dollar Men

9
White male CEOs v. other CEOs
The rules of the executive retirement system have been rigged to privilege those who have
traditionally led large U.S. corporations—white males. Even when women and people of color
break into Fortune 500 corner offices, their retirement assets still don’t measure up to those of
their white male counterparts. In 2015, the top 10 largest retirement funds among Fortune 500
CEOs—all held by white males—added up to $1.4 billion. By contrast, the 10 largest retirement
funds held by female CEOs added up to $300 million and the 10 largest held by CEOs who are
people of color added up to $165 million.3
Largest CEO Retirement Assets by Demographic Group
CEO Company Total retirement assets
10 largest held by white male CEOs: $1.4 billion total
Glenn M. Renwick Progressive $194,468,207
Paul Saville NVR $175,241,964
David M. Cote Honeywell $170,618,895
John H. Hammergren McKesson $146,891,146
Michael F. Neidorff Centene $139,664,473
Larry J. Merlo CVS Health $138,156,128
Richard B. Handler Leucadia National $136,214,897
Brian L. Roberts Comcast $126,604,993
Jeffrey R. Immelt General Electric $92,164,987
John Strangfeld Prudential Financial $85,088,397
10 largest held by female CEOs: $300 million total
Marillyn A. Hewson Lockheed Martin $74,676,599
Irene Rosenfeld Mondelez $43,532,386
Debra L. Reed Sempra Energy $39,002,887
Indra K. Nooyi PepsiCo $35,366,021
Carol Meyrowitz TJX $32,437,909
Ellen J. Kullman DuPont $22,989,958
V.M. Rometty IBM $18,351,975
Ursula M. Burns Xerox $16,937,837
Denise M. Morrison Campbell Soup $10,007,678
Lynn J. Good Duke Energy $6,982,153
10 largest held by CEOs who are people of color: $165 million total
Kenneth I. Chenault American Express $44,580,451
Indra K. Nooyi Pepsico $35,366,021
Kenneth C. Frazier Merck $32,882,143
Ursula M. Burns Xerox $16,937,837
Richard Gonzalez Abbvie $15,950,220
George Paz Express Script $9,513,479
Carlos A. Rodriguez ADP $6,142,657
Robert E. Sanchez Ryder Systems $2,455,014
Joseph Alvarado Commercial Metals $1,191,889
S. Ghasemi Air Products & Chemicals $191,323

10
History of the Retirement Divide
Top executives have long sought to limit their companies’ responsibilities toward worker
retirement security. The first private pension plan was started in 1875 (by American Express)
and in the early 20th century newly unionized workers successfully pushed for pensions at
railroad and steel companies. However, most early plans included disclaimers that pension
obligations were not enforceable.
1946-1980: Expanding Pension Benefits for Working People
At the close of World War II, workers organized for better benefits, including pensions. In 1946,
there were nearly 5,000 strikes involving 4.6 million American workers. By 1960, 41 percent of
private sector workers were covered by defined benefit pensions, up from 15 percent in 1940.
In the 1940s, Congress also ended the corporate practice of using pensions for top executives as
a tax-avoiding tool. A new law in 1942 limited favorable tax treatment only to plans that did not
discriminate in favor of highly compensated employees. Congress also imposed other rules to
ensure that private pensions delivered on their promises. In the late 1950s, the federal
government increased disclosure requirements governing pensions and in 1962 the federal
government enacted legislation regulating pensions to safeguard workers from fraud and poor
management.
Unions continued to press for more and better pensions and the number of workers receiving
pensions continued to grow. In 1974, Congress enacted the Employee Retirement Income
Security Act (ERISA), which establishes standards for private sector pensions. Defined benefit
pensions reached a high in 1980, when 46 percent of the private sector workforce was covered.
1980-Present: Rule Shifts Prioritize Corporate Profits Over Worker Retirement Security
In 1981, the federal government dramatically reversed several decades of supporting and
protecting labor unions when President Ronald Reagan broke the air traffic controllers’ union
strike by bringing in replacement workers. With labor power on the decline, companies began
to adopt new defined contribution programs, such as 401(k)s, that shifted investment risk from
workers to employers. Rather than providing employees a guaranteed monthly income
throughout their retirement years, these new plans allowed workers to set aside money
deducted from their pay, with the company sometimes, but not always, matching a portion of
the employee contribution. There was no guarantee of monthly benefits at retirement. The
amount workers received depended on how much the individual contributed, the success of
their investments, and the size of administrative costs and fees, which are often hidden from
view. This move slashed corporate employee retirement costs, boosting earnings and stock
prices.

11
Freezing and underfunding worker pensions while padding his own
GE used to operate a contributory pension plan which employees funded each month from
their paychecks. But because rising markets offset the company’s expected contribution, the
company wound up not putting a penny into their employee pension plans between 1987 and
2011. After stock market losses in the Great Recession eroded pension assets, CEO Jeff Immelt
decided to freeze the company’s pensions and close them to new participants rather than
investing the billions of dollars necessary to make up for market losses.4 Workers were offered
a riskier and less generous 401(k) plan. Since 2011, when its pension was closed, GE’s pension
deficit (the amount which it owes its workers less the value of assets in the pension plan) has
widened from $18 billion to $23 billion. Over the same period, Immelt’s company-sponsored
retirement assets have ballooned from $53 million to more than $92 million in 2015, making
him No. 9 on our list of CEOs with the largest retirement funds.
Another strategy companies began to use in the 1980s to shield their pension liabilities was to
convert their traditional pensions into cash balance plans. While technically considered
pensions, these plans have more in common with defined contribution plans, like 401(k)s.
Companies place a percentage of the employee’s salary into their account, with retirement
benefits determined by the account’s performance over their career. There is no guaranteed
monthly income upon retirement.
These plans have been heavily criticized for undercutting the retirement security of older
workers, since traditional pensions were funded with small contributions in the early years of
an employee’s career and much larger payments as workers reached retirement. Cash balance
plans make equal payments throughout the worker’s life. Unions have claimed these plans are a
form of age discrimination, but courts have consistently ruled the plans non-discriminatory and
Congress further clarified the rules with the passage of the Pension Protection Act of 2006,
which made all future conversions to cash balance plans legal. The number of cash balance
plans has tripled since the 2006 Act was passed and now account for a quarter of all defined
benefit plans.
The decline of traditional pensions was indirectly fueled by changes in CEOs compensation
rules. In 1993, when Congress responded to outrage over CEO pay by capping the deductibility
of executive pay at $1 million, but leaving a massive loophole for so-called “performance-
based” pay. To maximize their tax deductions, companies began shoveling out huge amounts of
stock-based compensation, which bloated paychecks and encouraged CEOs to fixate on short-
term stock prices. Cutting employee retirement costs was one way to do that.
Remaining traditional pensions have often been inadequately funded. Companies were allowed
to forego pension contributions in years when stock market returns boosted the value of their
Jeff Immelt, General Electric
vid Cote, Honeywell

12
pension plan assets more than the growth of their liabilities to beneficiaries. Strong markets
throughout much of the 1980s, 1990s, and early 2000s meant that companies needed to
contribute very little, if at all, to keep their pension accounts healthy. But falling stock prices
during the Great Recession meant companies needed to invest hundreds of billions of dollars to
make up for market declines and shore up pensions. Instead, many executives chose to freeze
benefits for current workers and close plans to new employees. Defined contribution plans,
such as 401(k)s, became the standard employee retirement account.
Pension Status at the 10 Corporations with Largest CEO Retirement Accounts w
Company Pension status Amount owed to
pension fund
% of pension obligations
funded
Progressive No pension, only 401(k) NA NA
NVR No pension, profit-sharing retirement plan and ESOP
NA NA
Honeywell Open and active $949 million 94.5%
McKesson Closed to new hires, 1996 $273 million 49.0%
Centene No pension, only 401(k) NA NA
CVS Health Pension terminated, 2015 $231 million 72.6%
Leucadia National Pension frozen, 2005 $89 million 56.9%
Comcast Pension terminated. 2014 $309 million 0.0%
General Electric Closed to new hires, 2010 $23 billion 66.5%
Prudential Financial Open and active $302 million overfunded
103.0%
Source: Corporate 10-K reports.
By 2013, three times as many private sector workers were participating in a defined
contribution plan as were covered by a traditional defined benefit pension. Many defined
contribution plans require employees to contribute before the company will match the
employee’s contribution, if there is any match at all. For many low-wage workers who are
struggling to pay rent and put food on the table, 401(k)s are out of reach, even when their
employers offer generous matches. One in four American workers do not save enough in their
401(k) plans to receive the full match offered by their companies. In 2014, the average amount of
employer match not received was $1,336, according to Missing Out, published by Financial
Engines, Inc.
The Pension Rights Center has compiled data on nearly 200 large U.S. corporations that have
reduced coverage or benefits for employees since the end of 2005, either by converting
traditional defined benefit plans to cash balance plans, freezing the plans so that participating
employees stop accruing additional benefits, closing plans to new hires, or terminating plans
altogether.

13
ERISA, the nation’s pension protection law, allows companies to not fully fund employee
pensions and in 2014, Congress gave corporations additional rights to put off required funding
of employee pensions. As a result, pension contributions in 2014 fell to their lowest levels in six
years, and the average large pension fund had enough assets to cover just 82 percent of their
obligations. In 2015, this figure remained unchanged.
The erosion of pension protections continues through “risk-stripping” moves that transfer risk
from employer to employee. One common risk-stripping move is to offer workers a one-time
lump-sum payment rather than a guaranteed monthly check. This is a high-risk option for most
retirees, who must then manage the funds to last throughout the rest of their lives. The IRS
banned corporations from offering lump sum payments to workers already receiving pensions,
starting in July 2015. Workers and retirees in more than two dozen large firms have already
been offered lump sum payments.
Select Fortune 500 Firms Offering Workers Lump Sum Payments
Company Number of workers/retirees
affected Date of announcement
UPS 50,000 11/9/2016
Newell Rubbermaid 3,300 8/24/2015
Ryder 11,000 10/22/2014
Motorola Solutions 32,000 9/25/2014
Washington Post Undisclosed 9/213/2014
Boeing 40,000 9/15/2014
Computer Sciences Corp. Undisclosed 9/2014
Hartford Financial Services Group 13,500 9/2014
Archer Daniels Midland 10,000 8/5/2014
Lockheed Martin 33,000 Unknown
Baxter International 16,000 10/19/2012
YUM Brands Undisclosed 10/9/2012
Sears Holdings Undisclosed 9/14/2012
J. C. Penney 35,000 9/2012
Visteon Nearly 10,000 9/19/2012
New York Times 5,200 9/14/2012
General Motors 42,000 6/1/2012
Ford Motor 90,000 4/27/2012
Source: Pension Rights Center
Today’s CEO fixation on short-term profits, together with our government’s failure to prevent
union-busting, help explain the decline in private sector employees receiving a pension at work
from 46 percent in 1980 to 35 percent in the early 1990s to just 18 percent in 2011.

14
Reforms to Narrow the Retirement Divide
The retirement divide is the result of tax, pension, contracting, and labor rules and regulations
that disproportionately reward company executives far more than ordinary workers. The
following are rule changes to rein in the accumulation of retirement assets at the top, while
expanding the funds available to ensure a dignified retirement for all.
Tax Reforms 1. Eliminate special tax-deferred compensation plans for corporate executives
Corporate executives should be subject to the same rules that govern the retirement assets of the
people they employ. At present older workers may set aside a maximum of $24,000 in their
corporate 401(k) accounts while younger workers can contribute up to $18,000. The same limits
should apply to CEOs. President Obama proposed capping IRAs and other deferred tax
retirement accounts at $3 million, an amount sufficient to generate about $200,000 a year in
annual income during retirement. Such a cap would raise an estimated $9 billion over 10 years,
revenue that could be put into the Social Security Trust Fund for the benefit of all workers.
Another approach would be to ban special executive deferred accounts unless the company is
funding retirement plans for all workers.
2. Eliminate tax breaks for companies that increase worker retirement insecurity
Corporations should not be allowed to deduct executive pension and retirement costs from
their federal taxes if they have frozen worker pensions, closed plans to new hires, or have
employee pension accounts that are not at least 90 percent funded. Taxpayers should not have
to subsidize lavish executive retirement packages for employers who have reduced employee
retirement security. 3. Eliminate the “performance pay” loophole that allows unlimited corporate tax
deductions for executive pay
CEO retirement assets have ballooned because CEO pay has ballooned and executives have
stuffed a large share of their expanding paychecks in deferred compensation accounts. One
reason for the explosion of executive pay is a 1993 tax reform that capped the tax deductibility
of executive compensation at $1 million but with a huge loophole— corporations could still
deduct unlimited amounts of stock options and other “performance-based” pay from their
federal income taxes. As a result, the more corporations pay their CEO, the less they pay in
taxes. The Joint Committee on Taxation estimates that eliminating this perverse loophole would
generate more than $50 billion over 10 years. The Stop Subsidizing Multimillion Dollar
Corporate Bonuses Act (S. 1127 and HR 2103) would eliminate the “performance pay”
exemption and cap the deductibility of compensation at $1 million for every employee.
15
Social Security and Pension Reforms 4. Expand Social Security and require CEOs to pay their fair share
While we can take steps to reduce public subsidies for lavish CEO retirement accounts, the real
answer to the retirement divide lies in expanding Social Security to provide for the millions of
soon-to-be-retiring American workers who have worked all of their lives for employers who
provided little or nothing for their retirement security. In direct contrast to the private sector
retirement divide, Social Security’s benefits are progressive, favoring low and middle income
workers. A worker who was earning around $20,000 in 2014 and retiring at age 65 would
receive a benefit equal to about 54 percent of his or her pay. A worker earning around $46,000
would receive a benefit equal to about 40 percent of that pay. In contrast, a CEO earning $10.5
million who retires at age 65 would receive a Social Security benefit that replaced just 0.28
percent of that pay.
As these percentages reveal, across-the-board Social Security benefit increases, whether
structured to provide the increase progressively or simply proportionately, is the best method
of addressing the retirement income divide. In addition to across the board increases, targeted
increases for low income workers, the very old, who are disproportionately women, and other
groups of seniors who experience disproportionately high levels of poverty should also be
enacted. There should also be a caregiver credit, which would mostly help women by giving
them 5-8 years of work credit if they were out of the labor force caring for a family member.
Requiring the wealthiest to pay more for Social Security will pay for the increased benefits as
well as the projected shortfall. It has the side benefit of ameliorating somewhat the nation’s
dangerously high levels of income and wealth inequality, of which the retirement divide is only
one symptom. Some common sense steps to pay for Social Security expansion fairly include
requiring the wealthiest to contribute to Social Security on all their earned income, as almost all
workers now do, as well as the unearned income of those at the top, including stock-based pay
such as that commonly received by CEOs. Other potential revenue sources include a new tax on
annual incomes in excess of $1 million and a more robust federal estate tax.
5. Safeguard public pensions
The public sector is the one sector where traditional defined benefit pension plans remain
strong. More than 75 percent of state and local employees and nearly all federal employees
participate in these plans. But these plans are under sustained, ideological assault. Some of the
fiercest attacks are on the strongest public plans. Most state and local government employees do
not participate in Social Security, which means they must fully rely on their public pension
benefits. According to an Economic Policy Institute report, Wisconsin, Florida, and North
Carolina all had the most solvent public employee pension funds at the start of 2011, yet all
three enacted dramatic cut-backs. To keep the retirement divide from increasing, it is important
to protect and strengthen these plans.

16
6. Support universal retirement funds
Twenty-eight states have considered legislation that would deal with the looming retirement
crisis facing their citizens by starting state-run pensions that would be professionally managed
and at much lower costs than the mutual fund investments typically found in 401(k) plans. At
least eight states have passed legislation either calling for additional study or authorizing state
pension officials to begin the process of implementation. The U.S. Department of Labor and the
IRS both need to approve these sorts of plans before they can begin to operate. The Pension
Rights Center has gathered additional information on these state proposals here. In the last
Congress, now-retired Senator Tom Harkin proposed a similar plan at the federal level called
USA Retirement Fund.
Employers that are currently not providing retirement benefits should be required to contribute
to a retirement fund on their workers’ behalf. These funds would be pooled and professionally
managed, ensuring that all workers have some pension assets to supplement their Social
Security.
Labor Reforms 7. Strengthen the ability of all workers to unionize
Since the election of Ronald Reagan in 1981 and his firing of 13,000 striking air traffic
controllers, the federal government has failed to adequately protect workers’ rights to unionize
and bargain collectively. The impact of Reagan’s action is in the numbers: In 1983, 21.6 percent
of workers were members of unions. Today, it is only 12.4 percent—and half of those work in
the public sector. Only 6.7 percent of today’s private sector workers are unionized. The
percentage of workers covered by private pensions is higher when and where unions are
strongest. Increasing unionization increases pressure on employers to provide strong retirement
benefits.
Procurement Reforms 8. Prohibit large government contractors from providing executives with retirement
benefits that are larger than those received by the President of the United States
Taxpayer money should not be used to widen the pension divide. Corporations that manage
state-run programs (e.g., Centene’s management of Medicaid plans), earn 50 percent or more of
their revenue from federal contracts, grants, and loans, or that have received at least $500
million in federal contracts the previous year should be prohibited from providing their
executives retirement benefits that are worth more than what the President of the United States
receives. (For President Obama, this is estimated to be $205,700 per year or $17,142 per month)

17
Appendix 1: 100 Largest CEO retirement assets
Corporation, ranked by total CEO retirement assets
CEO Pension
2015 ($mill)
Deferred comp 2015
($mill)
Total retirement
assets 2015 (mill)
Monthly check ($)
1 Progressive Glenn M. Renwick 0.0 194.5 194.5 1,035,733
2 NVR Paul Saville 0.0 175.2 175.2 933,335
3 Honeywell David M. Cote 56.0 114.6 170.6 908,712
4 McKesson John H. Hammergren 114.0 32.9 146.9 782,339
5 Centene Michael F. Neidorff 0.0 139.7 139.7 743,850
6 CVS Health Larry J. Merlo 44.4 93.7 138.2 735,816
7 Leucadia National Richard B. Handler 0.2 136.0 136.2 725,477
8 Comcast Brian L. Roberts 0.0 126.6 126.6 705,770
9 General Electric Jeffrey R. Immelt 78.3 13.9 92.2 490,869
10 Prudential Financial John Strangfeld 75.4 9.6 85.1 453,179
11 Pfizer Ian C. Read 44.6 37.2 81.8 435,931
12 AT&T Randall Stephenson 50.9 28.6 79.5 423,174
13 Eversource Energy Thomas J. May 23.4 55.9 79.3 422,570
14 Lockheed Martin Marillyn A. Hewson 47.0 27.7 74.7 397,726
15 Exxon Mobil Rex Tillerson 69.6 2.1 71.6 381,384
16 Walmart C. Douglas McMillon 0.0 67.8 67.8 361,229
17 Freeport McMoRan Richard C. Adkerson 30.6 32.3 63.0 335,275
18 W.R. Berkley William R. Berkley 59.4 2.3 61.8 328,898
19 AFLAC Daniel P. Amos 54.4 5.4 59.8 318,603
20 PPG Industries C. E. Bunch 46.0 9.9 55.9 297,622
21 CH Robinson Worldwide
John P. Wiehoff 0.0 55.2 55.2 293,747
22 Community Health Systems
Wayne T. Smith 45.3 7.4 52.7 280,818
23 Hess John Hess 52.7 0.0 52.7 280,749
24 Boeing W. James McNerney, Jr. 47.6 5.0 52.6 279,884
25 Discovery Communications
David M. Zaslav 0.0 52.5 52.5 279,529
26 Chevron J.S. Watson 39.5 9.9 49.4 263,247
27 Eli Lilly John C. Lechleiter, Ph.D. 32.5 15.5 48.0 255,712
28 Edison International Theodore F. Craver, Jr. 20.0 26.5 46.5 247,777
29 Praxair Stephen F. Angel 39.6 6.5 46.0 245,073
30 American Express Kenneth I. Chenault 9.0 35.6 44.6 237,434
31 Whirlpool Jeff M. Fettig 21.7 21.9 43.6 232,328
32 Mondelez Irene Rosenfeld 36.5 7.0 43.5 231,852
33 Northrop Grumman Wesley G. Bush 33.5 9.9 43.5 231,431
34 Public Service Enterprise
Ralph Izzo 12.3 31.1 43.4 231,355
35 Coca-Cola Muhtar Kent 40.1 2.5 42.7 227,160
36 Ameriprise Financial James M. Cracchiolo 11.0 30.7 41.7 222,033
37 Ralph Lauren Ralph Lauren 0.0 41.2 41.2 219,582

18
Corporation, ranked by total CEO retirement assets
CEO Pension
2015 ($mill)
Deferred comp 2015
($mill)
Total retirement
assets 2015 (mill)
Monthly check ($)
38 Sempra Energy Debra L. Reed 28.0 11.0 39.0 207,728
39 Goldman Sachs Lloyd C. Blankfein 0.0 38.5 38.6 205,439
40 Parker-Hannifin Donald E. Washkewicz 31.6 6.8 38.4 204,469
41 Devon Energy John Richels 33.6 3.8 37.5 199,468
42 Morgan Stanley James P. Gorman 0.1 37.3 37.4 199,185
43 Dow Chemical Andrew Liveris 34.5 2.8 37.2 198,352
44 BB&T Kelly S. King 29.0 7.2 36.2 192,674
45 Abbott Laboratories Miles D. White 36.0 0.0 36.0 191,733
46 Pepsico Indra K. Nooyi 23.3 12.1 35.4 188,359
47 Seaboard Steven J. Bresky 20.9 14.4 35.3 187,815
48 Marathon Petroleum Gary R. Heminger 29.9 5.1 35.0 186,453
49 CBS Leslie Moonves 11.2 23.8 34.9 185,958
50 US Bancorp Richard K. Davis 30.5 3.1 33.5 178,613
51 Crown Holdings John Conway 33.5 0.0 33.5 178,566
52 CSX Michael J. Ward 21.6 11.5 33.0 175,971
53 3M Inge G. Thulin 24.9 8.0 32.9 175,428
54 Merck Kenneth C. Frazier 21.8 11.0 32.9 175,130
55 TJX Carol Meyrowitz 28.9 3.6 32.4 172,764
56 Regions Financial O. B. Grayson Hall, Jr 29.8 2.5 32.4 172,302
57 Monsanto Hugh Grant 7.1 24.7 31.8 169,270
58 Bristol-Myers Squibb Lamberto Andreotti 6.4 25.0 31.4 167,500
59 Deere Samuel R. Allen 15.5 15.5 31.0 164,976
60 Ashland James J. O’Brien 14.0 16.9 30.9 164,647
61 Principal Financial Larry D. Zimpleman 26.6 4.1 30.7 163,664
62 Caterpillar Douglas R. Oberhelman 25.5 5.1 30.6 162,943
63 Hershey Foods John P. Bilbrey 22.2 8.0 30.2 160,630
64 Lowe's Companies Robert A. Niblock 0.0 29.8 29.8 158,625
65 Colgate Palmolive Ian Cook 28.4 1.4 29.7 158,314
66 General Mills Kendall J. Powell 27.2 2.3 29.6 157,442
67 ConocoPhillips R.M. Lance 25.4 3.8 29.2 155,686
68 AK Steel Holding James L. Wainscott 28.6 0.4 29.0 154,461
69 Corning Wendell P. Weeks 23.9 4.8 28.6 152,485
70 Loews James S. Tisch 28.6 0.0 28.6 152,203
71 Capital One Financial Richard Fairbank 0.1 27.6 27.8 147,833
72 Genuine Parts Thomas C. Gallagher 25.7 2.0 27.7 147,791
73 Emerson David N. Farr 20.4 7.1 27.5 146,437
74 Discover Financial Services
David W. Nelms 0.2 26.9 27.1 144,476
75 FedEx Frederick W. Smith 27.2 0.0 27.2 144,619
76 Dominion Resources Thomas F. Farrell II 27.0 0.0 27.0 143,639
77 Phillips 66 Greg C. Garland 25.1 1.9 27.0 143,604

19
Corporation, ranked by total CEO retirement assets
CEO Pension
2015 ($mill)
Deferred comp 2015
($mill)
Total retirement
assets 2015 (mill)
Monthly check ($)
78 Alphabet (formerly Google)
Eric E. Schmidt 0.0 26.8 26.8 142,510
79 L Brands Leslie H. Wexner 0.0 26.7 26.7 142,241
80 Macy's Terry J. Lundgren 23.8 2.8 26.6 141,755
81 VF Corp Eric C. Wiseman 16.3 9.7 26.0 138,408
82 Huntington Ingalls Industries
C. Michael Petters 22.6 3.1 25.8 137,377
83 Mattel Christopher Sinclair 21.7 3.6 25.3 134,829
84 Rockwell Automation Keith D. Nosbusch 23.0 2.3 25.2 134,387
85 Ecolab Douglas M. Baker, Jr. 21.2 3.9 25.1 133,502
86 Dillard's William Dillard, II 25.0 0.0 25.0 133,272
87 Disney Robert A. Iger 20.8 4.1 24.9 132,574
88 Cummins N. T. Linebarger 20.1 4.8 24.9 132,479
89 Halliburton David J. Lesar 0.0 24.5 24.5 130,751
90 UNUM Thomas R. Watjen 21.6 2.9 24.5 130,684
91 Lincoln National DENNIS R. GLASS 2.7 21.8 24.5 130,386
92 Wells Fargo John G. Stumpf 20.0 4.4 24.4 129,709
93 J.M. Smucker Richard K. Smucker 14.5 9.7 24.3 129,308
94 Hormel Foods Jeffrey M. Ettinger 12.0 11.8 23.8 126,745
95 Avery Dennison Dean A. Scarborough 18.8 4.9 23.8 126,655
96 Philip Morris International
André Calantzopoulos 23.5 0.0 23.5 125,125
97 Norfolk Southern Charles W. Moorman, IV 22.2 1.1 23.3 124,226
98 Johnson & Johnson Alex Gorsky 14.3 9.0 23.3 124,097
99 DuPont Ellen J. Kullman 16.9 6.1 23.0 122,444
100 Kimberly Clark Thomas J. Falk 18.8 4.1 22.9 121,923
Total 2,487.2 2,262.4 4,751.9 25,308,763
Average 25.1 22.6 47.5 253,088

20
Appendix 2: Methodology and sources
Firms studied: Publicly held firms on Fortune magazine’s annual list of the 500 largest U.S.
corporations, by revenue.
Total CEO retirement assets: Pension and nonqualified deferred compensation data reported
by the companies to the U.S. Securities and Exchange Commission (SEC). In calculating total
retirement assets we added back in distributions made during the year to the year-end balances,
as distributions made during the year were part of the total retirement package provided to
CEOs. In most instances CEO retirement data can be found in the firm’s annual proxy
statement, Form DEF 14-A. In some cases, especially when firms are awaiting a special meeting
of shareholders to consider a merger or other corporate restructuring, executive compensation
data will be published in the company’s annual report, FORM 10-K. In several cases
corporations either replaced their CEO mid-year or had two co-CEOs. In each of these cases we
reported the individual with the largest retirement assets.
American family retirement assets: Calculated by Monique Morrisey, Economist, Economic
Policy Institute. Aggregate defined benefit pension entitlements and defined contribution plan
and IRA assets are from Federal Reserve Flow of Funds data, Table L.117 Private and Public
Pension Funds, September 18, 2015. Aggregated defined benefit, defined contribution, and IRA
data from 2013 and 2015 were used to adjust CEO values for comparison with 2013 Survey of
Consumer Finances data and to impute defined benefit pension wealth for families identified as
having a defined benefit plan in the Federal Reserve Survey of Consumer Finances (SCF). All
other statistics were based on EPI analysis of SCF microdata, using the following variables:
Wgt: Sample weight
Hhsex: Gender of household head
Edcl: Education category of head of household
Kids: Total number of children in household
Married: Marital status of head of household
Race: Race/ethnicity of respondent
Retqliq: Total value of quasi-liquid held by household, 2013 dollars
Dbplant: Either head or spouse/partner has DB plan on current job or some type of pension
Monthly retirement checks: In order to add meaning to the large size of CEO retirement
assets, we calculated how much these leaders could expect to receive in monthly retirement
checks if the retirement assets were converted into an annuity at age 65. In order to assure an
apples to apples comparison, we used the annuity calculator found at
www.immediateannuities.com and selected, Male, age 65, New York, and immediate payout
where choices were required. The calculation was performed on November 21, 2016. Amounts
for female CEOs would generally be lower owing to women’s longer life expectancies.
Corporate pension plans have their own formulas for determining annuitized payments, but we
believe the use of an annuity calculator provides a useful estimate of the size of executive

21
retirement wealth in terms the average person can easily understand, the size of a monthly
retirement check.
Funding position of corporate employee retirement plans: If a company operates a defined
benefit pension plan for employees, they report on the funding status of these plans in the
annual report, FORM 10-K, filed annually with the SEC. This disclosure is found in the financial
footnotes, that immediately follow the income statement, balance sheet and statements of cash
flow and shareholder equity, typically near the end of the report. Information about employee
pensions is generally posted under a heading like “Pensions” or “Post-Retirement Benefits.”
Companies report a variety of information pertaining to their pension assets and liabilities. In
presenting their funded status and level of underfunding, we divided the total plan assets by
the total projected benefit obligation.
Endnotes 1 Based on average business days per year of 261.
2 Based on total contributions in fiscal year 2015 of $232,349,775. Among Fortune 500 CEOs, 215 CEOs
made such contributions. If they had only been able to deferred $24,000, their total contributions would’ve been $5,160,000. Based on the top individual tax rate of 39.6 percent, their tax savings comes to 88,604,012
3 The three people of color CEOs include five Latinos, two Asians, and three African-Americans.
4 For more information on other large corporations freezing or otherwise changing their pension plans,
visit the Pension Rights Center.