DRAFT Neighborhood for Dallasdallascityhall.com/departments/pnv/DCH Documents... · Neighborhood ....
80
Collective Impact Framework Alleviate Poverty Fight Blight Attract and Retain the Middle Class Expand Home- Ownership Enhance Rental Options Neighborhood Revitalization Plan for Dallas June 2015 DRAFT
Transcript of DRAFT Neighborhood for Dallasdallascityhall.com/departments/pnv/DCH Documents... · Neighborhood ....

Collective ImpactFramework
AlleviatePoverty
FightBlight
Attract and Retain theMiddle Class
Expand Home-Ownership
Enhance Rental Options
Neighborhood Revitalization Planfor Dallas June 2015
DRAFT

The Neighborhood Plus Plan updates and replaces the Housing and Neighborhood Elements of the forwardDallas! Comprehensive Plan.
DRAFT

OFFICE OF THE MAYOR CITY HALL 1500 MARILLA ST., 5EN DALLAS, TEXAS 75201
MICHAEL S. RAWLINGS
MAYOR
CITY OF DALLAS June 2015 Greetings, Dallas is riding a wave of unprecedented prosperity. Yet, disturbing trends persist. A high proportion of our children remain in poverty and too many of our neighborhoods, strained by disinvestment and broken by blight, have been abandoned by the same economy that has swelled the number of Dallas millionaires in the last four years. These young people will soon become the region’s workforce and these neighborhoods will determine the strength of our tax base. Today, neither is prepared to maximize their future potential, to their disadvantage and to ours. As Dallas improves our strategic advantage in an increasingly competitive global marketplace, we must be attuned to new opportunities. We must also be vigilant about the challenges that threaten to weaken our position as a leader within the region, nation and world. There must be a proactive plan to ensure a brighter future for all of our residents. We cannot rely on old tactics that haven’t worked. It is time to open our minds to a deeper understanding of our unique challenges and opportunities. We must be willing to discard failed strategies and try fresh approaches. It is with this spirit that I started the GrowSouth Initiative four years ago, and it is with this same spirit that Neighborhood Plus has been developed with the active participation of residents, businesses, non-profit organizations, philanthropic foundations, government agencies, educational institutions and stakeholder groups who are committed to the promise of Dallas’ future. Neighborhood Plus recognizes Dallas as a city of neighborhoods and embraces the unique identity and strength of each. It is a plan that strives to enhance our collective impact through collaboration and partnerships to leverage our resources and produce effective results. Finally, it is a plan that recognizes the increasing need for Dallas to take a leadership role within our region and to tackle many of the challenges that extend beyond our borders and hinder our economy. Dallas has faced and overcome big challenges before. We have never let opportunity pass us by. It is with a strong sense of optimism that I put forward the Neighborhood Plus Plan. In the spirit of collaboration, I also urge you to invest in Dallas' future and to work together to put this plan into action, for the children of Dallas and for the prosperity of our neighborhoods. Best regards, Michael S. Rawlings Mayor

ACKNOWLEDGEMENTS
Dallas City CouncilMayor Mike Rawlings
Mayor Pro Tem Tennell Atkins, District 8
Deputy Mayor Pro Tem Monica Alonzo, District 6
Scott Griggs, District 1
Adam Medrano, District 2
Vonciel Jones Hill, District 3
Dwaine Caraway, District 4
Rick Callahan, District 5
Carolyn R. Davis, District 7
Sheffie Kadane, District 9
Jerry R. Allen, District 10
Lee M. Kleinman, District 11
Sandy Greyson, District 12
Jennifer Staubach Gates, District 13
Philip Kingston, District 14
Boards and CommissionsCity Plan Commission
Community Development Commission
Senior Affairs Commission
Housing Finance Corporation
City ManagementA.C. Gonzalez, City Manager
Ryan S. Evans, First Assistant City Manager
Eric Campbell, Assistant City Manager
Jill A. Jordan, P.E., Assistant City Manager
Mark McDaniel, Assistant City Manager
Joey Zapata, Assistant City Manager
City StaffTheresa O’Donnell, Chief Planning Officer
Peer Chacko, AICP, Assistant Director, Planning and Neighborhood Vitality
Luis Tamayo, Senior Planner, Planning and Neighborhood Vitality
Karen L. Riley, Planning Manager, Planning and Neighborhood Vitality
Cobbie Ransom, Manager, Planning and Neighborhood Vitality
Vana Hammond, Chief of Community Relations & Grow South, Mayor’s Office
Don Babers, Consultant, Housing Department
Bernadette Mitchell, Interim Director, Housing Department
Charles Brideau, Assistant Director, Housing Department
Beverly Davis, Assistant Director, Fair Housing
Cynthia Rogers-Ellickson, Manager, Housing Department
Robin Bentley, Assistant City Attorney, City Attorney’s Office
Maureen Milligan, Executive Assistant City Attorney, City Attorney’s Office
Tammy Palomino, Senior Assistant City Attorney, City Attorney’s Office
Robyn Gerard, Senior Public Information Officer, Sustainable Development and Construction
Tim Glass, Manager, Office of Economic Development
Arturo Del Castillo, Interim Manager, City Design Studio
Evan Sheets, Planner, City Design Studio
Megan O’Neal, Planner, City Design Studio
Chalonda Jackson, Coordinator, City Design Studio
Consultant TeamFregonese Associates
DRAFT

If you want to go fast, go alone. If you want to go far, go together.
~ African proverb
Core PartnersU.S. Department of Housing and Urban Development, Fort Worth Regional Office Garry Sweeney, Shirley Henley
Dallas Housing AuthorityMaryann Russ
Children’s Health Care Systems Peter Roberts, Cheryl Mayo-Williams
Dallas Independent School DistrictPaula Blackmon, Michael Koprowski and Mohammed Choudhury
Dallas Area Rapid Transit Todd Plesko and Jeremy Lott
Federal Reserve Bank of DallasAlfreda Norman, Elizabeth Sobel-Blum, and Julie Gunter
Habitat for Humanity Bill Hall, Kristen Schulz and Cyndy Lutz
Health and Wellness AllianceCheryl Boswell
MetroTex Association of RealtorsRomeo Arrieta
Dallas Area RealtistsBen Brown
The Real Estate CouncilLinda McMahon and Robin Minick
Dallas Builders AssociationPhil Crone
United Way Metropolitan DallasSusan Hoff and Stephanie Mace
The Meadows Foundation Deborah Fitzpatrick
North Central Texas Council of GovernmentsMike Eastland
University of Texas at DallasDr. Timothy Bray
Parkland HealthcareAngela Morris
Dallas County Community College District Mary Brumbach and Pyeper Wilkins
Commit 2 Dallas Tarik Ward
Workforce Solutions Greater Dallas Laurie Larrea
City SquareLarry James
Southfair Community Development CorporationAnnie Jones Evans
City Wide Community Development CorporationSherman Roberts
East Dallas Community OrganizationGerry Carlton
Builders of HopeNorman Henry
The Senior SourceLynda Taylor Endner
2000 Roses FoundationAlonzo Harris
Inner City Development CorporationDiane Ragsdale
Inclusive Community ProjectBetsy Julian, Demetria McCain and Susan Watkins
Social Impact ArchitectsSuzanne Smith
UpLift EducationAnn StevensonChildren at RiskSara Melnick Albert
Texas Trees FoundationJanette Monear
Trust for Public LandRobert Kent
DRAFT

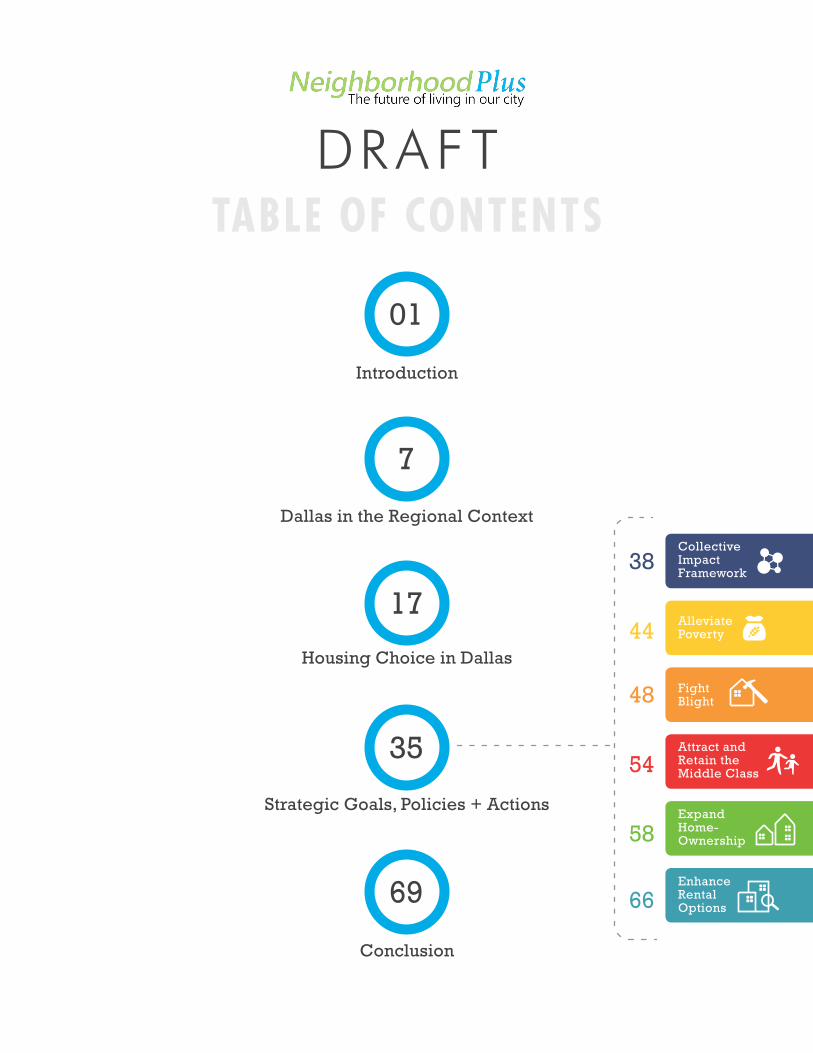
01
Introduction
Housing Choice in Dallas
Dallas in the Regional Context
Strategic Goals, Policies + Actions
Conclusion
69
17
7
TABLE OF CONTENTS
35
Collective ImpactFramework
AlleviatePoverty
FightBlight
Attract and Retain theMiddle Class
Expand Home-Ownership
Enhance Rental Options
38
44
48
54
58
66
DRAFT

If you are going to achieve excellence in big things, you develop the habit in little
matters. Excellence is not an exception, it is a prevailing attitude.
~ Colin Powell
image credit: Sydney Aaliyah

INTRODUCTION
I N T R O D U C T I O N
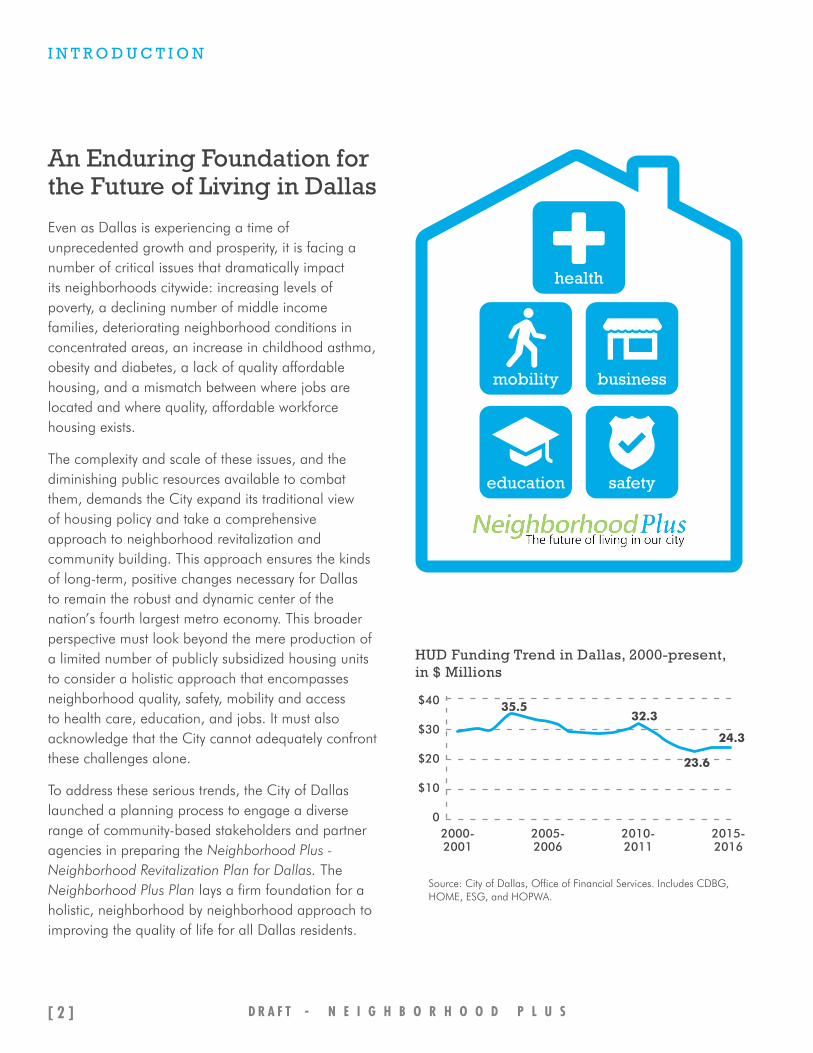
An Enduring Foundation for the Future of Living in Dallas
Even as Dallas is experiencing a time of unprecedented growth and prosperity, it is facing a number of critical issues that dramatically impact its neighborhoods citywide: increasing levels of poverty, a declining number of middle income families, deteriorating neighborhood conditions in concentrated areas, an increase in childhood asthma, obesity and diabetes, a lack of quality affordable housing, and a mismatch between where jobs are located and where quality, affordable workforce housing exists.
The complexity and scale of these issues, and the diminishing public resources available to combat them, demands the City expand its traditional view of housing policy and take a comprehensive approach to neighborhood revitalization and community building. This approach ensures the kinds of long-term, positive changes necessary for Dallas to remain the robust and dynamic center of the nation’s fourth largest metro economy. This broader perspective must look beyond the mere production of a limited number of publicly subsidized housing units to consider a holistic approach that encompasses neighborhood quality, safety, mobility and access to health care, education, and jobs. It must also acknowledge that the City cannot adequately confront these challenges alone.
To address these serious trends, the City of Dallas launched a planning process to engage a diverse range of community-based stakeholders and partner agencies in preparing the Neighborhood Plus - Neighborhood Revitalization Plan for Dallas. The Neighborhood Plus Plan lays a firm foundation for a holistic, neighborhood by neighborhood approach to improving the quality of life for all Dallas residents.
D R A F T - N E I G H B O R H O O D P L U S[ 2 ]
HUD Funding Trend in Dallas, 2000-present, in $ Millions
Source: City of Dallas, Office of Financial Services. Includes CDBG, HOME, ESG, and HOPWA.
2000-2001
2005-2006
2010-2011
2015-2016
$40
$30
$20
$10
0
35.532.3
23.6
24.3

INT
RO
DU
CT
ION
Relating to forwardDallas! and the Consolidated Plan
The Neighborhood Plus Plan combines, updates and replaces the Housing and Neighborhood elements of the forwardDallas! Comprehensive Plan. In the 10 years since the forwardDallas! comprehensive planning process began in 2005, much has changed in Dallas’ housing market. The market has largely corrected following the recession past 2007. Reassessing and updating these elements now is timely, particularly as we begin to face new challenges in our neighborhoods. The Neighborhood Plus Plan adds new strategic goals, policies, and a set of short- and long-term actions with measurable outcomes developed in collaboration with a wide network of partners.
The forwardDallas! Comprehensive Plan provides the broad vision and strategic direction to guide land use, economic development and transportation policy for the City of Dallas. While much broader in scope, forwardDallas! also provides the framework to guide more specific housing related priorities and targets set through Dallas’ HUD mandated Consolidated Plan. The goal is to ensure that these two documents are linked to support the desired outcomes of increasing affordability and promoting a healthy and sustainable mix of housing and
The purpose of Neighborhood Plus is to:
• Set a new direction and shape new policy for housing and neighborhood revitalization in Dallas.
• Create a strategic planning and decision-making framework to guide more effective community investment decisions.
• Create a framework for inter-agency collaboration, acknowledging the inter-dependence of local government with other public and private agencies, for-profit businesses, nonprofits organizations, and philanthropic foundations.
• Position the City of Dallas to take a leadership role in initiating a regional dialogue on important housing issues.
N e i g h b o r h o o d R e v i t a l i z a t i o n P l a n f o r D a l l a s - D R A F T [ 3 ]
Fair H
ousin
g Sym
posiu
m
Counc
il Wor
kshop
Neighb
orho
od Bl
ock P
arty
Partn
er Sy
mposia
Commun
ity W
orksh
ops
City C
ounc
il Brie
fing
Fair H
ousin
g Sym
posiu
m
Housin
g Com
mittee B
riefin
g
Housin
g Com
mittee B
riefin
g
Draft N
eighb
orho
od Pl
us Pl
an
APRIL JUNE AUG JUNE
2014 2015
DECNOV FEB APRILOCT
Ongoing Partner Meetings
Neighborhood Plus Planning Process
I N T R O D U C T I O N
neighborhood choices in Dallas. To this end, the Neighborhood Plus Plan is written to serve as a guide for future updates of the Consolidated Plan.
How to Use the Neighborhood Plus Plan
The Neighborhood Plus Plan is comprised of four chapters that lay out a new direction for ensuring safe, healthy and sustainable neighborhoods for all Dallas residents.
The Introduction outlines the impetus, the process, and the purpose of the Neighborhood Plus Plan. The second chapter, Dallas in the Regional Context, provides key demographic and geographic data, highlighting trends that explain Dallas’ unique place at the heart of the region and sheds light on expectations for the future. The third chapter, Housing Choice in Dallas focuses on the important factors that influence our decisions on where we live. This chapter also provides information on the housing decisions people have made in the past, and how this decision-making process is likely to change based on shifting demographic trends. Potential mismatches between current housing supply and demand are highlighted and the outlook for future balanced housing growth is also summarized in terms of housing type and affordability.
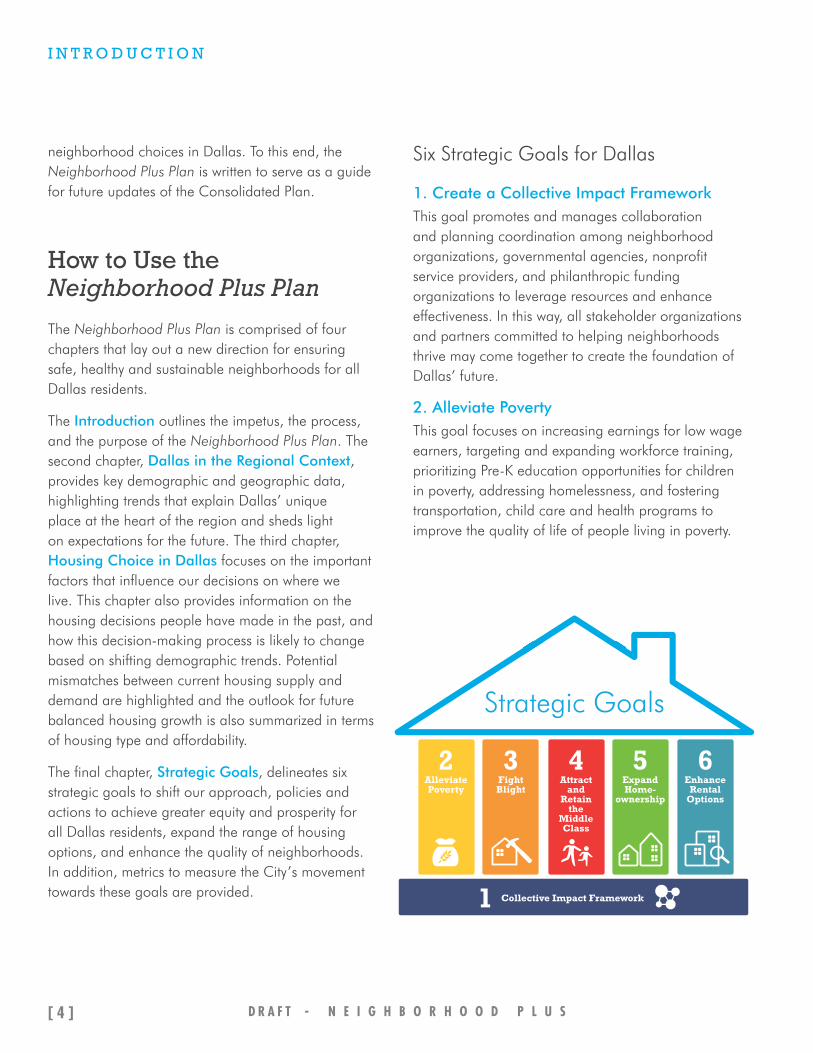
The final chapter, Strategic Goals, delineates six strategic goals to shift our approach, policies and actions to achieve greater equity and prosperity for all Dallas residents, expand the range of housing options, and enhance the quality of neighborhoods. In addition, metrics to measure the City’s movement towards these goals are provided.
Six Strategic Goals for Dallas
1. Create a Collective Impact Framework This goal promotes and manages collaboration and planning coordination among neighborhood organizations, governmental agencies, nonprofit service providers, and philanthropic funding organizations to leverage resources and enhance effectiveness. In this way, all stakeholder organizations and partners committed to helping neighborhoods thrive may come together to create the foundation of Dallas’ future.
2. Alleviate PovertyThis goal focuses on increasing earnings for low wage earners, targeting and expanding workforce training, prioritizing Pre-K education opportunities for children in poverty, addressing homelessness, and fostering transportation, child care and health programs to improve the quality of life of people living in poverty.
D R A F T - N E I G H B O R H O O D P L U S[ 4 ]

INT
RO
DU
CT
ION
3. Fight Blight This goal works to identify and target blighted properties more strategically and effectively to eliminate their negative impact on neighborhoods and return them to productive use.
4. Attract and Retain the Middle Class This goal focuses on identifying piloting programs that promote neighborhood assets, eliminating barriers to neighborhood revitalization and infill, supporting school choice, and addressing neighborhood infrastructure needs.
5. Expand HomeownershipThis goal encourages a wider range of housing types to respond to emerging preferences, identifies incentives for infill development and home improvement in targeted neighborhoods, expands programs to reach a broader range of potential home buyers, and develops partnerships to increase the pool of eligible loan applicants.
6. Enhance Rental OptionsThis goal works to raise the quality of rental housing through better design standards and proactive and systematic code enforcement, expands affordable housing options and encourages its distribution across the city and region, and aligns planning and investment around DART transit stations.
...an economic system’s legitimacy is...tied to its
ability to make two things accessible to all: the
riches it generates and the social benefits that arise from that wealth.
~ Jim Yong Kim, President of the World Bank
N e i g h b o r h o o d R e v i t a l i z a t i o n P l a n f o r D a l l a s - D R A F T [ 5 ]

If you don’t know where you’ve come from, you don’t know where you are going.
~ Maya Angelou
image credit: Neff Conner

DALLAS IN THE REGIONAL
CONTEXT

D A L L A S I N T H E R E G I O N A L C O N T E X T
Growing with the RegionDallas is the fourth largest metropolitan economy in the U.S. and the 12th largest in the world. This economic engine fuels rapid growth and that growth, in turn, powers a robust economy. The City’s goal is to maintain around half of Dallas County’s population. To capture new growth and maintain pace with Dallas County will require the City to build new housing that appeals to a wide range of current and future residents. This could include a wider diversity of ownership options affordable to moderate and middle income households. It also means the City will need to invest in the infrastructure and amenities that create quality neighborhoods and keep the housing market strong. Creating walkable neighborhoods with quality schools, services, transit and employment will take coordinated investment and efforts by the City and its many partners.
By 2035, Dallas County is projected to grow by nearly 800,000
people. What portion of this growth will Dallas capture?
Less than $15,000
D R A F T - N E I G H B O R H O O D P L U S[ 8 ]
Source: US Decennial Census 1980-2010, ACS 2012 One-Year Estimate, Woods & Poole Population Projections 2020 and 2035.
1990
10 M
8 M
6 M
4 M
2 M
2000 2010 2020 2035
Population Growth and Projections, 1990-2035
5,622,128
2,368,139
1,197,816
6,764,564
2,630,930
1,315,465
8,673,698
3,195,830
1,597,915
Dallas County
Dallas CountyProjections
City of Dallas
City of DallasTarget Growth
DFW 4 County Area
DFW 4 County Area Projections

DA
LL
AS
IN T
HE
RE
GIO
NA
L C
ON
TE
XT
Opportunities for GrowthDallas is a major employment hub with over 500,000 workers commuting daily into the city from other parts of the region. Inbound commuters make up the majority of the Dallas workforce, with numbers more than double the number of residents who work in the City. These inbound commuters have higher incomes than people who live and work in the city and those who live in Dallas but commute outside the city for work. Dallas has a significant opportunity to convert some of these inbound commuters into residents.
Share of Dallas’ Workforce by Residence Earning $40,000 or More Annually
Provided by the City of Dallas Economic Development Department.Source: Census LED Origin-Destination Data, 2011
23%
23%
Total of all employees working in the City earning over $40,000 annually
370,235
19%
9% 14%
12%Outside the 4-County
Area
Total inbound commuters
67%
Inbound Commuters
Live and Work in the City
Outbound Commuters
14%
16%
21%
33%
41%
41%
53%
43%
38%
Less than $15,000
$15,000 to $39,999
$40,000 or more
Source: U.S. Census Bureau, Center for Economic Studies downloaded via OnTheMap.ces.census.gov.
Income Distribution of Workforce, 2011
Inbound commuters make up the
majority of the Dallas workforce, and they are more
affluent than Dallas’ resident workforce.
Residence of Workforce, 2002-2011
Source: U.S. Census Bureau, Center for Economic Studies downloaded via OnTheMap.ces.census.gov.
0
200K
400K
600K
Outbound Commuters
Inbound Commuters
Live and Work in the City
2003 2005 2007 2009 2011
N e i g h b o r h o o d R e v i t a l i z a t i o n P l a n f o r D a l l a s - D R A F T [ 9 ]
D A L L A S I N T H E R E G I O N A L C O N T E X T
Demographic Profile
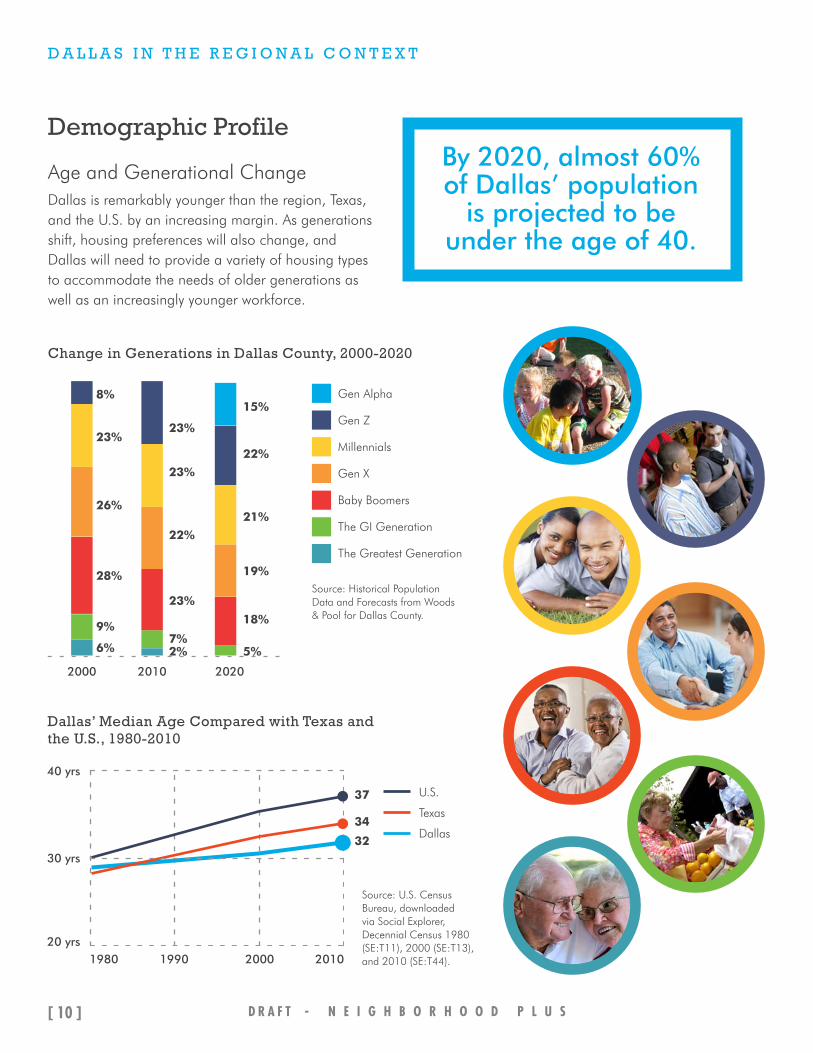
Age and Generational ChangeDallas is remarkably younger than the region, Texas, and the U.S. by an increasing margin. As generations shift, housing preferences will also change, and Dallas will need to provide a variety of housing types to accommodate the needs of older generations as well as an increasingly younger workforce.
Dallas’ Median Age Compared with Texas and the U.S., 1980-2010
Source: U.S. Census Bureau, downloaded via Social Explorer, Decennial Census 1980 (SE:T11), 2000 (SE:T13), and 2010 (SE:T44).
By 2020, almost 60% of Dallas’ population
is projected to be under the age of 40.
Change in Generations in Dallas County, 2000-2020
Source: Historical Population Data and Forecasts from Woods & Pool for Dallas County.
6%
9%
28%
26%
23%
8%
2000
Gen Alpha
Gen Z
Millennials
Gen X
Baby Boomers
The GI Generation
The Greatest Generation
2%7%
23%
22%
23%
23%
2010
5%
18%
19%
21%
22%
15%
2020
U.S.
Texas
Dallas
1980
30 yrs
20 yrs
40 yrs
1990 2000 2010
37
34
32
D R A F T - N E I G H B O R H O O D P L U S[ 10 ]
DA
LL
AS
IN T
HE
RE
GIO
NA
L C
ON
TE
XT
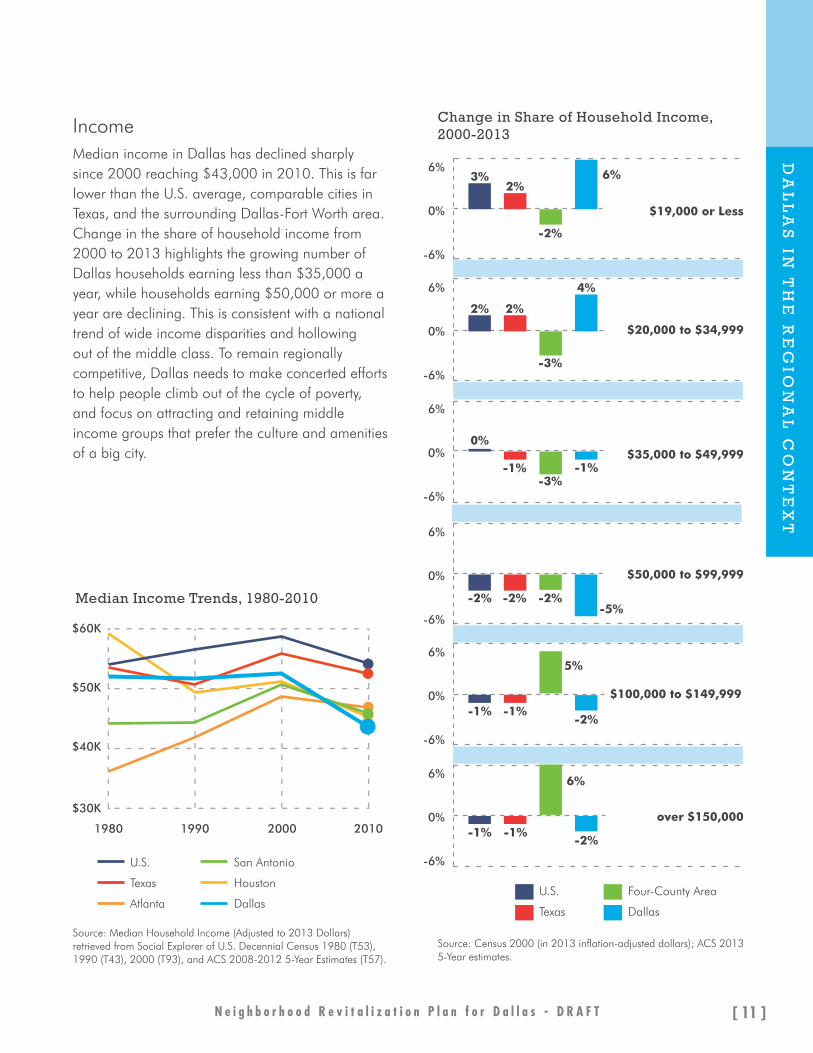
IncomeMedian income in Dallas has declined sharply since 2000 reaching $43,000 in 2010. This is far lower than the U.S. average, comparable cities in Texas, and the surrounding Dallas-Fort Worth area. Change in the share of household income from 2000 to 2013 highlights the growing number of Dallas households earning less than $35,000 a year, while households earning $50,000 or more a year are declining. This is consistent with a national trend of wide income disparities and hollowing out of the middle class. To remain regionally competitive, Dallas needs to make concerted efforts to help people climb out of the cycle of poverty, and focus on attracting and retaining middle income groups that prefer the culture and amenities of a big city.
Source: Median Household Income (Adjusted to 2013 Dollars) retrieved from Social Explorer of U.S. Decennial Census 1980 (T53), 1990 (T43), 2000 (T93), and ACS 2008-2012 5-Year Estimates (T57).
Median Income Trends, 1980-2010
$40K
$30K
$50K
$60K
1980 1990 2000 2010
U.S.
Texas
Atlanta
San Antonio
Houston
Dallas
Change in Share of Household Income, 2000-2013
Source: Census 2000 (in 2013 inflation-adjusted dollars); ACS 2013 5-Year estimates.
3%2%
-2%
6%
$19,000 or Less
6%
0%
-6%
2% 2%
-3%
4%
$20,000 to $34,999
6%
0%
-6%
0%
-1%-3%
-1%$35,000 to $49,999
6%
0%
-6%
$100,000 to $149,999
6%
0%
-6%
-1% -1%
5%
-2%
over $150,000
6%
0%
-6%
-1% -1%
6%
-2%
$50,000 to $99,999
6%
0%
-6%
-2% -2% -2%-5%
U.S.
Texas
Four-County Area
Dallas
N e i g h b o r h o o d R e v i t a l i z a t i o n P l a n f o r D a l l a s - D R A F T [ 11 ]

D A L L A S I N T H E R E G I O N A L C O N T E X T
PovertyAccording to the 2010 U.S. Census, over 20% of Dallas families live below the poverty line. This is a significant increase from 15% in 2000. While this trend is present throughout the country, it is being felt acutely in Dallas, where the median household income has continued to fall below our peer cities in Texas and the U.S., and below the state and national averages.
Despite Dallas’ diverse and growing economy, people of color and our youngest residents are disproportionately affected by poverty. This threatens the continued prosperity of Dallas and the region. Thirty percent of the Hispanic population and 30% of the African American population in Dallas are living in poverty. And for children under the age of 18 living in Dallas, 38% live in poverty, ranking Dallas last out of the nine other cities in the U.S. with populations over one million. A concerted and collaborative effort to break down barriers to fair and inclusive housing and to ensure equal access to quality schools and jobs that pay a living wage is critical to sustain a strong and thriving regional economy over the long-term.
Areas of Concentrated Poverty
City limits
20%-40%
41% and over
% of Residents Who Live in Poverty
Compared to the four-county area,
Dallas’ share of low-income residents
is increasing while its share of high-
income residents is decreasing.
Source: U.S. Census Data (2000 Decennial Census and ACS 2008-2012 Five-Year estimates) via Social Explorer T98/T179.
Percent of Families below the Poverty Line, 2000-2012
20%19%16%14%
20%
10%
0%2000 2012
Dallas
Houston
San Antonio
Austin
Source: Census Bureau, ACS 2009-2013.
D R A F T - N E I G H B O R H O O D P L U S[ 12 ]

DA
LL
AS
IN T
HE
RE
GIO
NA
L C
ON
TE
XT
Race and EthnicitySince 1980, the City has seen a steady demographic shift and increasing racial and ethnic diversity. Dallas has been a majority minority city for the past 20 years. The Hispanic community has grown dramatically over the past few decades, making up over 40% of the city’s population in 2013. Since 1980, the white population has declined significantly as a share of the whole, while the African American population has declined slightly, and the Asian population, although comprising a small percentage overall, has increased steadily. The City of Dallas is more diverse than the four-county region, with a significantly higher proportion of Hispanic and African American residents, although not as many Asian residents as other parts of the region.
Dallas will be reshaped and
strengthed by its racial, ethnic, cultural
and generational diversity.
Source: U.S. Census Bureau, Social Explorer, Decennial Census 1980 (SE:T13), 1990, (SE:T13), 2000 (SE:T15), and ACS 2013 5-Year estimates.
Source: ACS 2013 5-Year estimates and Social Explorer.
Change in Diversity, 1980-2013
Race and Ethnicity in Dallas Compared to the Four-County Area
1980 1990 2000 2013
12%
36% 41%
1%2% 2%
3% 3%
29%
26%
24%
58%
21%
1%
2%
29%
47%
33% 30%
White Non-Hispanic
Black or African American
Hispanic
Asian
Other
Race/Ethnicity Dallas Four-County Area
White Non-Hispanic 30% 46%
Black or African American 24% 16%
Asian 3% 6%
Hispanic 41% 29%
Other 2% 3%
N e i g h b o r h o o d R e v i t a l i z a t i o n P l a n f o r D a l l a s - D R A F T [ 13 ]

D A L L A S I N T H E R E G I O N A L C O N T E X T
Population by Race and Ethnicity, 2010
White Non-Hispanic
Black Non-Hispanic
Asian Non-Hispanic
Hispanic or Latino
Other
1 dot = 10 people
Source: 2010 Summary File 1 (SF1) Table P5.
D R A F T - N E I G H B O R H O O D P L U S[ 14 ]

DA
LL
AS
IN T
HE
RE
GIO
NA
L C
ON
TE
XT
This page intentionally left blank.
N e i g h b o r h o o d R e v i t a l i z a t i o n P l a n f o r D a l l a s - D R A F T [ 15 ]

Safety and security don’t just happen, they are the result of collective consensus
and public investment.
~ Nelson Mandela
image credit: msbrendadanderson

HOUSING CHOICE
IN DALLAS
H O U S I N G C H O I C E I N D A L L A S
Commitment to Housing Choice in Our Neighborhoods
For most of us, a home is the largest financial commitment we will ever make. Whether buying or renting, our housing expense typically consumes the largest part of our budget and is a major life decision. Choosing a home is based on many considerations – location, price range, housing type, neighborhood amenities and lifestyle preferences. Factors differ greatly from person to person and family to family.
Other factors may limit the choices we have, for example income, affordability and access to reasonable credit terms, or available housing stock and quality of neighborhoods. During some phases of our lives, renting a home may be more practical than buying, at other times, homeownership is clearly the right choice.
Understanding and responding to these factors to provide Dallas residents with quality, affordable housing is the core of the Neighborhood Plus Plan and its strategic goals, policies and actions. The City of Dallas is committed to expanding housing choice and ensuring a range of housing options are available to fulfill the needs, incomes and preferences of Dallas residents into the future.
Today’s Housing Stock
Deciding whether to rent or buy is a highly personal decision based on a variety of factors, from income and job security to lifestyle and family needs. Dallasites should have quality rental and homeownership options available across the income spectrum to support their choices.
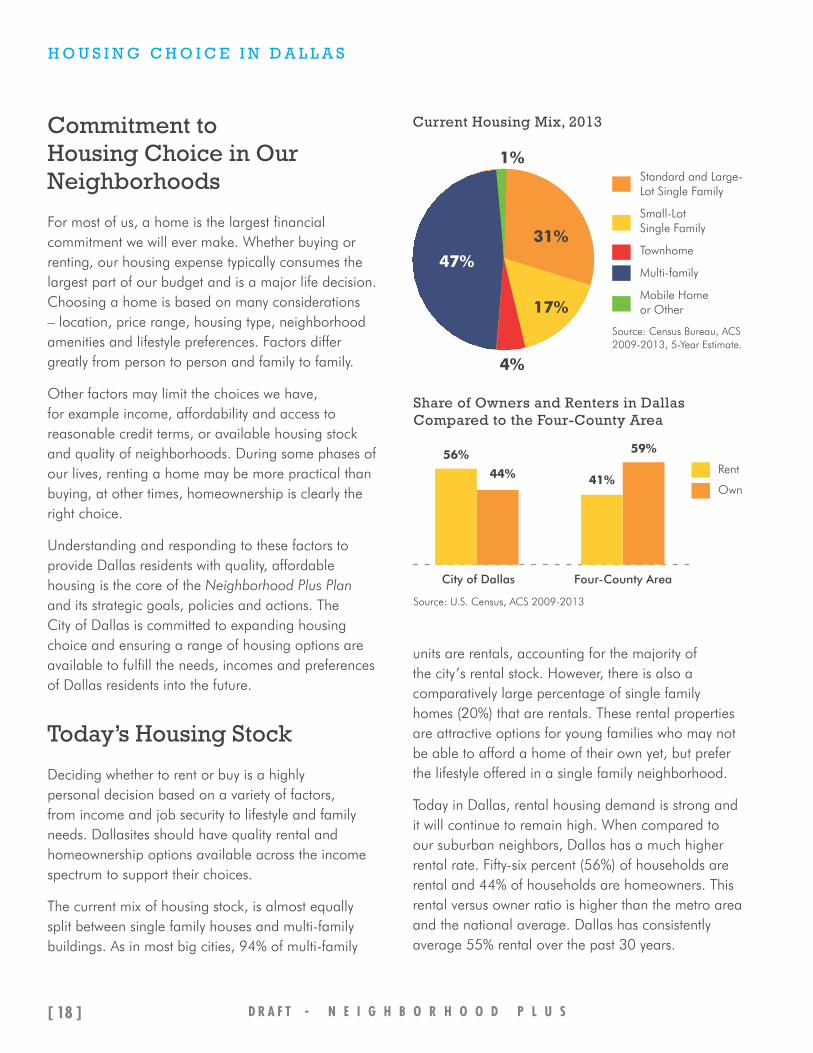
The current mix of housing stock, is almost equally split between single family houses and multi-family buildings. As in most big cities, 94% of multi-family
units are rentals, accounting for the majority of the city’s rental stock. However, there is also a comparatively large percentage of single family homes (20%) that are rentals. These rental properties are attractive options for young families who may not be able to afford a home of their own yet, but prefer the lifestyle offered in a single family neighborhood.
Today in Dallas, rental housing demand is strong and it will continue to remain high. When compared to our suburban neighbors, Dallas has a much higher rental rate. Fifty-six percent (56%) of households are rental and 44% of households are homeowners. This rental versus owner ratio is higher than the metro area and the national average. Dallas has consistently average 55% rental over the past 30 years.
Source: U.S. Census, ACS 2009-2013
Share of Owners and Renters in Dallas Compared to the Four-County Area
56%
44% 41%
59%
City of Dallas Four-County Area
Rent
Own
Current Housing Mix, 2013
Source: Census Bureau, ACS 2009-2013, 5-Year Estimate.
Standard and Large-Lot Single Family
Small-Lot Single Family
Townhome
Multi-family
Mobile Home or Other
31%
17%
4%
1%
47%
D R A F T - N E I G H B O R H O O D P L U S[ 18 ]
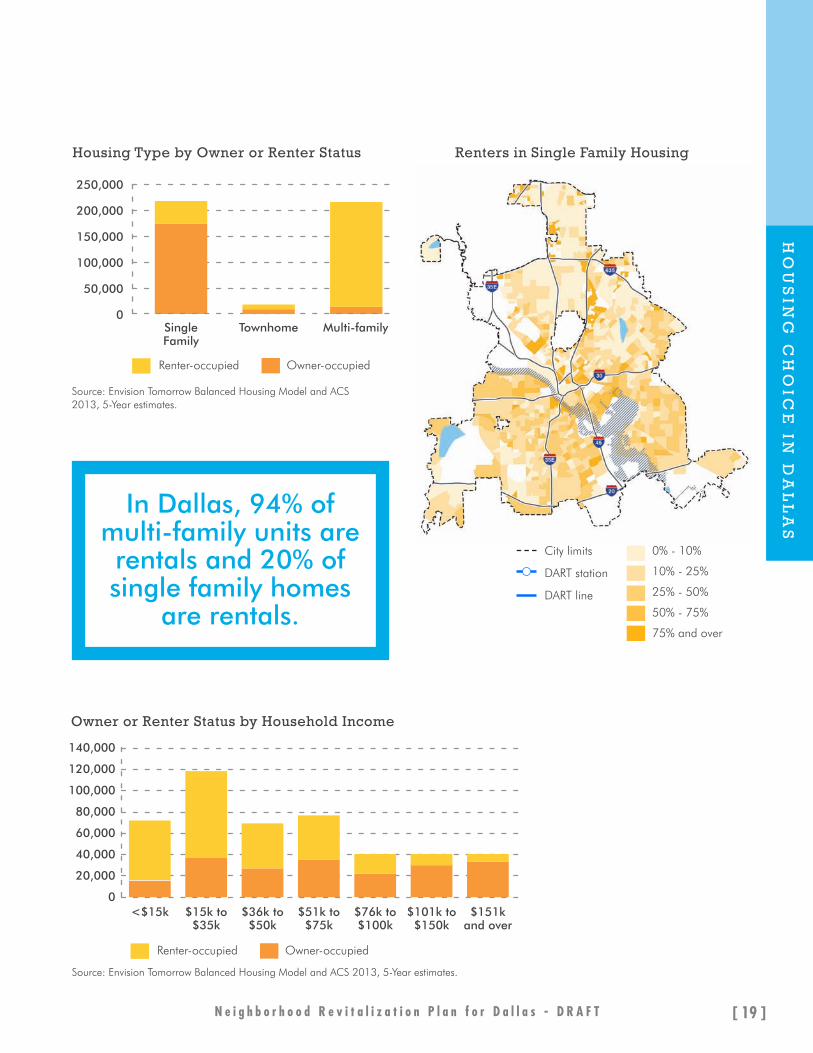
Source: Envision Tomorrow Balanced Housing Model and ACS 2013, 5-Year estimates.
Renters in Single Family Housing
City limits
DART station
DART line
0% - 10%
10% - 25%
25% - 50%
50% - 75%
75% and over
In Dallas, 94% of multi-family units are rentals and 20% of single family homes
are rentals.
Housing Type by Owner or Renter Status
250,000
200,000
150,000
100,000
50,000
0Single Family
Townhome Multi-family
Renter-occupied Owner-occupied
Source: Envision Tomorrow Balanced Housing Model and ACS 2013, 5-Year estimates.
Owner or Renter Status by Household Income
140,000
120,000
100,000
80,000
60,000
40,000
20,000
0
Renter-occupied Owner-occupied
<$15k $15k to $35k
$36k to$50k
$51k to$75k
$76k to$100k
$151k and over
$101k to$150k
N e i g h b o r h o o d R e v i t a l i z a t i o n P l a n f o r D a l l a s - D R A F T [ 19 ]
HO
US
ING
CH
OIC
E IN
DA
LL
AS
H O U S I N G C H O I C E I N D A L L A S
Elements of Housing Choice
This section looks at three broad elements of housing choice: housing affordability, housing preferences, and neighborhood and community character.
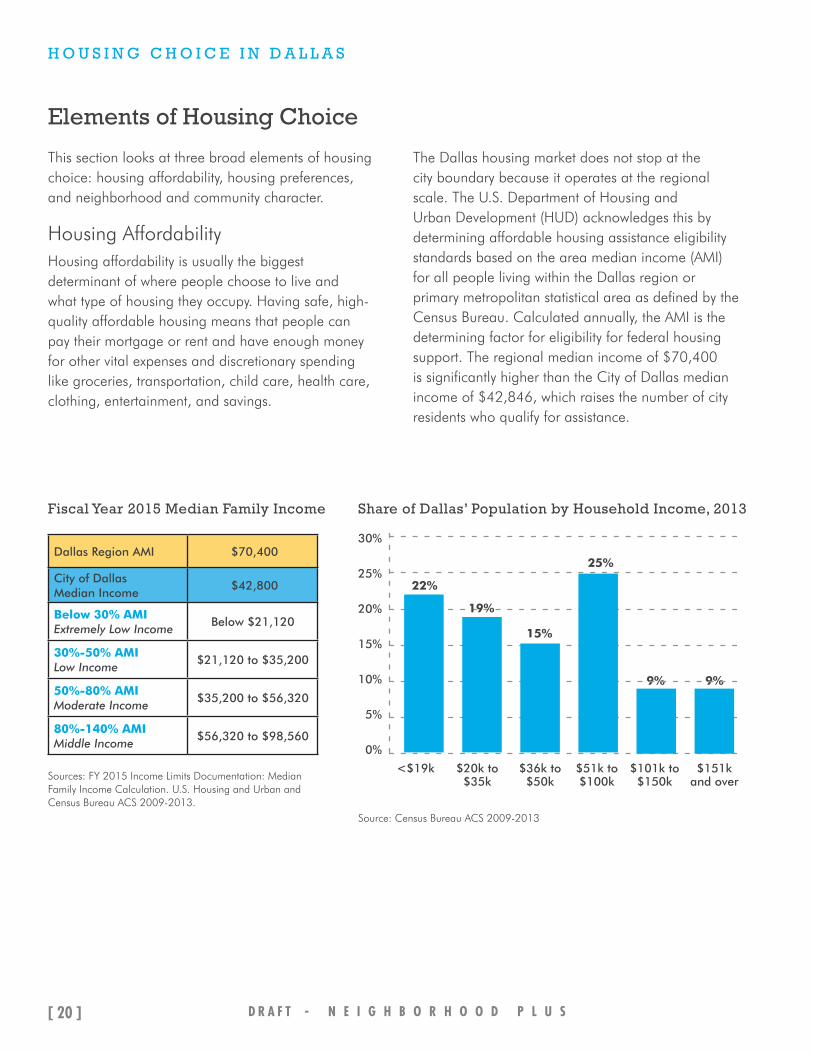
Housing AffordabilityHousing affordability is usually the biggest determinant of where people choose to live and what type of housing they occupy. Having safe, high-quality affordable housing means that people can pay their mortgage or rent and have enough money for other vital expenses and discretionary spending like groceries, transportation, child care, health care, clothing, entertainment, and savings.
The Dallas housing market does not stop at the city boundary because it operates at the regional scale. The U.S. Department of Housing and Urban Development (HUD) acknowledges this by determining affordable housing assistance eligibility standards based on the area median income (AMI) for all people living within the Dallas region or primary metropolitan statistical area as defined by the Census Bureau. Calculated annually, the AMI is the determining factor for eligibility for federal housing support. The regional median income of $70,400 is significantly higher than the City of Dallas median income of $42,846, which raises the number of city residents who qualify for assistance.
Sources: FY 2015 Income Limits Documentation: Median Family Income Calculation. U.S. Housing and Urban and Census Bureau ACS 2009-2013.
Source: Census Bureau ACS 2009-2013
Fiscal Year 2015 Median Family Income
Dallas Region AMI $70,400
City of Dallas Median Income
$42,800
Below 30% AMI Extremely Low Income
Below $21,120
30%-50% AMI Low Income
$21,120 to $35,200
50%-80% AMI Moderate Income
$35,200 to $56,320
80%-140% AMIMiddle Income
$56,320 to $98,560
Share of Dallas’ Population by Household Income, 2013
30%
25%
20%
15%
10%
5%
0%
<$19k $20k to$35k
$36k to$50k
$51k to$100k
$101k to$150k
$151k and over
22%
15%
25%
9% 9%
19%
D R A F T - N E I G H B O R H O O D P L U S[ 20 ]

Although the dollar amount varies from household to household, “affordable housing” means all housing costs, including utilities, insurance and taxes consume no more than 30% of gross household income. According to federal HUD guidelines, housing is unaffordable when 30% or more of a household’s income is spent on housing. Severely unaffordable or “severely cost burdened” housing costs occur when more than 50% of a household’s income is allocated to housing and related expenses. At the median income of $42,846, a Dallas household should spend less than $1,070 per month on housing costs to remain under 30% of gross household income.
There are clear affordability gaps in the current housing stock. Thirty-one percent (31%) of owners are living in homes unaffordable to them, and 48% of renters are living in housing that is considered unaffordable. Of all owner households, 18% are cost burdened and 13% are severely cost burdened. Of all rental households, about 25% are cost burdened, and 23% are severely cost burdened.
Source: Envision Tomorrow Balanced Housing Model.
Rental Housing Affordability in Dallas
Affordable
Unaffordable
Severely Unaffordable
23%
25%
52%
Owner Housing Affordability in Dallas
69%
18%
13% 31% of owners and 48% of renters are
living in housing that is unaffordable given
their income.
N e i g h b o r h o o d R e v i t a l i z a t i o n P l a n f o r D a l l a s - D R A F T [ 21 ]
HO
US
ING
CH
OIC
E IN
DA
LL
AS
H O U S I N G C H O I C E I N D A L L A S
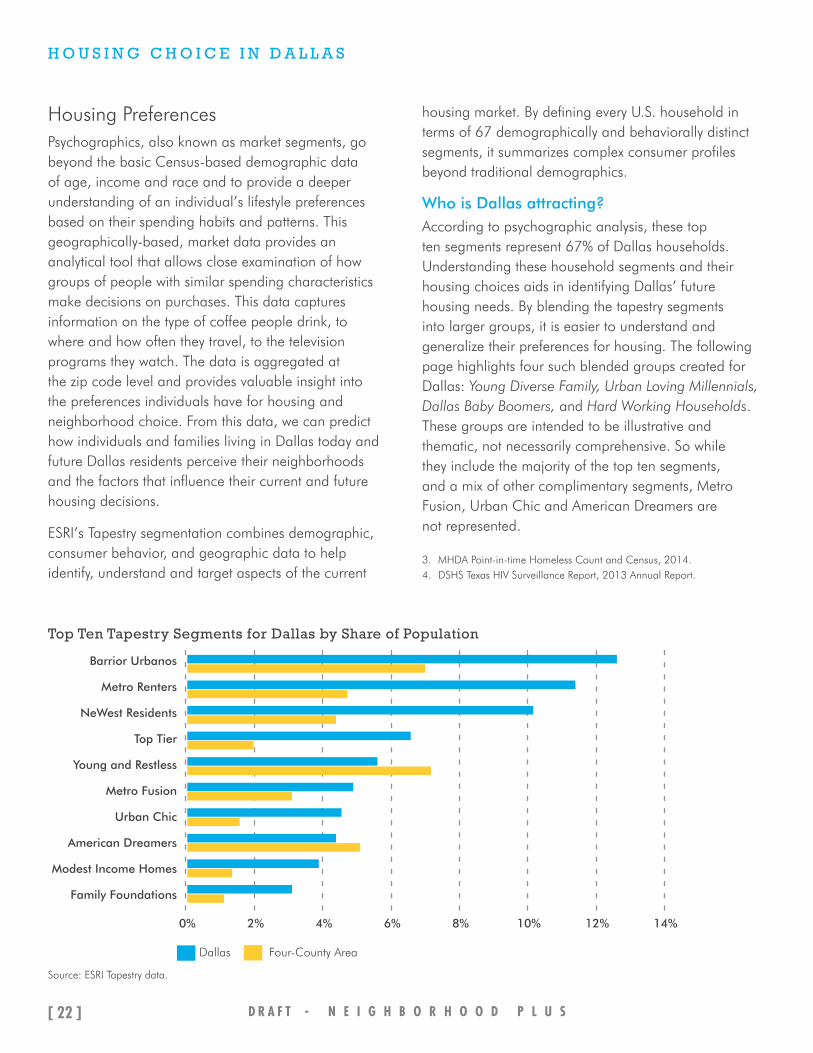
Housing PreferencesPsychographics, also known as market segments, go beyond the basic Census-based demographic data of age, income and race and to provide a deeper understanding of an individual’s lifestyle preferences based on their spending habits and patterns. This geographically-based, market data provides an analytical tool that allows close examination of how groups of people with similar spending characteristics make decisions on purchases. This data captures information on the type of coffee people drink, to where and how often they travel, to the television programs they watch. The data is aggregated at the zip code level and provides valuable insight into the preferences individuals have for housing and neighborhood choice. From this data, we can predict how individuals and families living in Dallas today and future Dallas residents perceive their neighborhoods and the factors that influence their current and future housing decisions.
ESRI’s Tapestry segmentation combines demographic, consumer behavior, and geographic data to help identify, understand and target aspects of the current
housing market. By defining every U.S. household in terms of 67 demographically and behaviorally distinct segments, it summarizes complex consumer profiles beyond traditional demographics.
Who is Dallas attracting?According to psychographic analysis, these top ten segments represent 67% of Dallas households. Understanding these household segments and their housing choices aids in identifying Dallas’ future housing needs. By blending the tapestry segments into larger groups, it is easier to understand and generalize their preferences for housing. The following page highlights four such blended groups created for Dallas: Young Diverse Family, Urban Loving Millennials, Dallas Baby Boomers, and Hard Working Households. These groups are intended to be illustrative and thematic, not necessarily comprehensive. So while they include the majority of the top ten segments, and a mix of other complimentary segments, Metro Fusion, Urban Chic and American Dreamers are not represented.
3. MHDA Point-in-time Homeless Count and Census, 2014.4. DSHS Texas HIV Surveillance Report, 2013 Annual Report.
Source: ESRI Tapestry data.
2% 4% 6% 8% 10% 12% 14%
Top Ten Tapestry Segments for Dallas by Share of Population
0%
Barrior Urbanos
Metro Renters
NeWest Residents
Top Tier
Young and Restless
Metro Fusion
Urban Chic
American Dreamers
Modest Income Homes
Family Foundations
Dallas Four-County Area
D R A F T - N E I G H B O R H O O D P L U S[ 22 ]

Young Diverse Families (21%)These are predominately Hispanic families with children, often living with grandparents in rental apartments or single family homes. These households are located mostly in the southeastern part of the City or central Dallas, west of Downtown.
Tapestry Segments: Barrios Urbanos (#1), NeWest Residents (#3), Las Casas* (#16)
Dallas Households (2012) = 112,627Hard Working Households (7%)
These are disproportionately older and predominantly single family households with moderate education and lower paying jobs.
Tapestry Segments: Family Foundations (#10), Traditional Living* (#52), Modest Income Households (#9)
Dallas Households (2012) = 36,269
Urban Loving Millennials (16%)These are single renters who are generally well-educated and environmentally conscious. They live mostly near the city center.
Tapestry Segments: Metro Renters (#2), Young and Restless (#5), Laptops and Lattes* (#18)
Dallas Households (2012) = 84,140
Dallas Baby Boomers (8%)These are empty nesters with high-value, single family homes predominantly in North Dallas.
Tapestry Segments: Top Tier (#4), Savvy Suburbanites* (#21), Exurbanites* (#14)
Dallas Households (2012) = 44,512
Dallas’ Blended Tapestry Segments
City limits
DART station
DART line
* While not included in the top ten segments for Dallas, these segments represent a growing trend of preferences for people living in urban areas.
N e i g h b o r h o o d R e v i t a l i z a t i o n P l a n f o r D a l l a s - D R A F T [ 23 ]
HO
US
ING
CH
OIC
E IN
DA
LL
AS

H O U S I N G C H O I C E I N D A L L A S
Neighborhood and Community CharacteristicsThe decision to rent or own, affordability, and housing type are all important factors in housing choice. The characteristics of a neighborhood, however, are just as important in making that decision. Neighborhood quality greatly influences the desirability and livability of housing options. Many factors influence a neighborhood’s quality, including the condition of the homes in the neighborhood and how easy or difficult it is to access important destinations. Crime and blight can erode the strength of a neighborhood until it is all but abandoned. Neighborhoods with
a large proportion of homes in poor condition require particular attention so that a perception of disinvestment does not cause further deterioration.
Access to important destinations such as work and school, medical services, and stores with healthy food choices all play an important role in the quality neighborhoods. Access to quality educational opportunities is one of the most-often cited indicators of a neighborhood’s desirability. Dallas suffers from geographic disparities in educational attainment. Ensuring all neighborhoods can readily access a high-quality education will benefit the city as a whole.
Percentage of People without a High School Diploma
City limits
0% - 5%
6% - 15%
16% - 20%
21% - 40%
41% or greater
Source: Census Bureau, ACS 2009-2013.
Percent of Housing in Poor Condition
City limits
6% - 10%
11% – 15%
more than 15%
Source: Dallas Central Appraisal District.
D R A F T - N E I G H B O R H O O D P L U S[ 24 ]
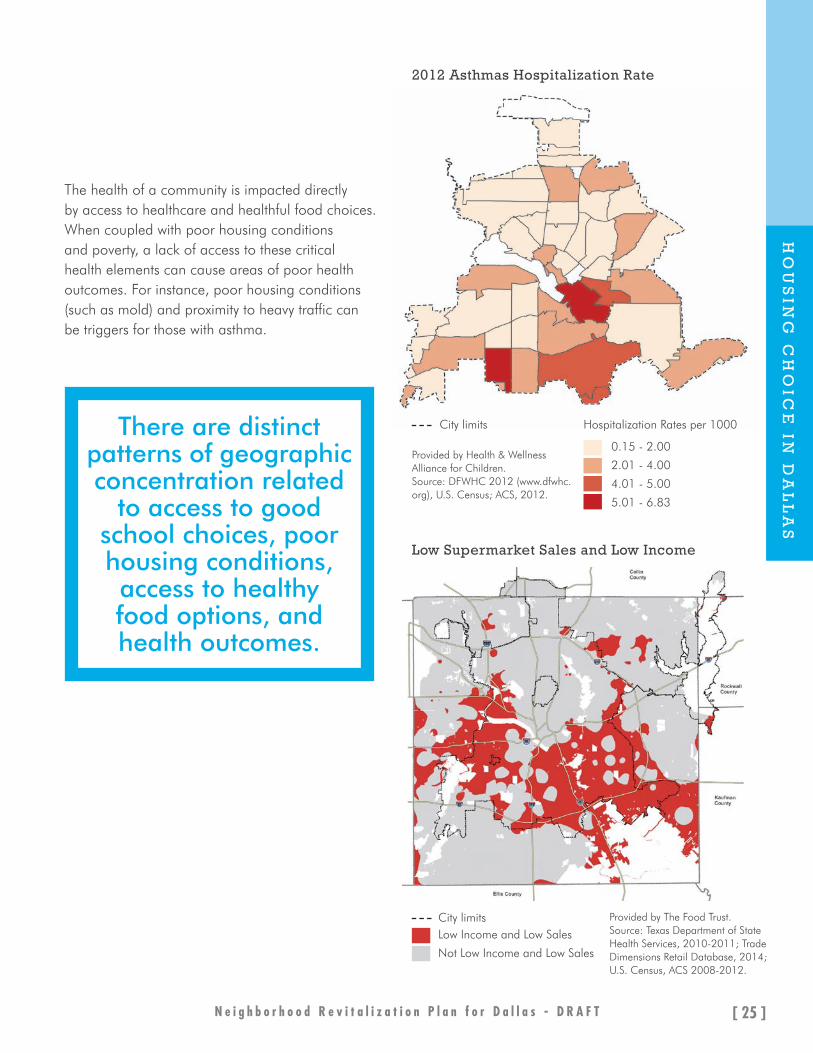
The health of a community is impacted directly by access to healthcare and healthful food choices. When coupled with poor housing conditions and poverty, a lack of access to these critical health elements can cause areas of poor health outcomes. For instance, poor housing conditions (such as mold) and proximity to heavy traffic can be triggers for those with asthma.
Low Supermarket Sales and Low Income
Provided by The Food Trust.Source: Texas Department of State Health Services, 2010-2011; Trade Dimensions Retail Database, 2014; U.S. Census, ACS 2008-2012.
There are distinct patterns of geographic concentration related
to access to good school choices, poor housing conditions, access to healthy food options, and health outcomes.
2012 Asthmas Hospitalization Rate
Provided by Health & Wellness Alliance for Children. Source: DFWHC 2012 (www.dfwhc.org), U.S. Census; ACS, 2012.
City limits Hospitalization Rates per 1000
0.15 - 2.00
2.01 - 4.00
4.01 - 5.00
5.01 - 6.83
City limitsLow Income and Low Sales
Not Low Income and Low Sales
N e i g h b o r h o o d R e v i t a l i z a t i o n P l a n f o r D a l l a s - D R A F T [ 25 ]
HO
US
ING
CH
OIC
E IN
DA
LL
AS

H O U S I N G C H O I C E I N D A L L A S
Accessing jobs is a critical factor in housing choice. Neighborhoods offering shorter commutes with a variety of transportation options are generally highly desirable places to live.
Adequate infrastructure such as connected and well-lit streets and sidewalks, safe intersections, and parks and open space will encourage walking, biking, and other routine physical activity that helps keep Dallasites healthy and invested in their communities.
Access to Jobs by Transit Access to Jobs by Car
Neighborhood Walkability
City limits
DART station
DART line
City limits
DART station
DART line
City limits
DART station
DART line
Walkability and accessibility to jobs varies a great deal
across the City.
Low
Medium
High
Low
Medium
High
Low
Medium
High
Source for all three maps: Envision Tomorrow Travel Demand Model.
D R A F T - N E I G H B O R H O O D P L U S[ 26 ]
Forecasting Future Needs
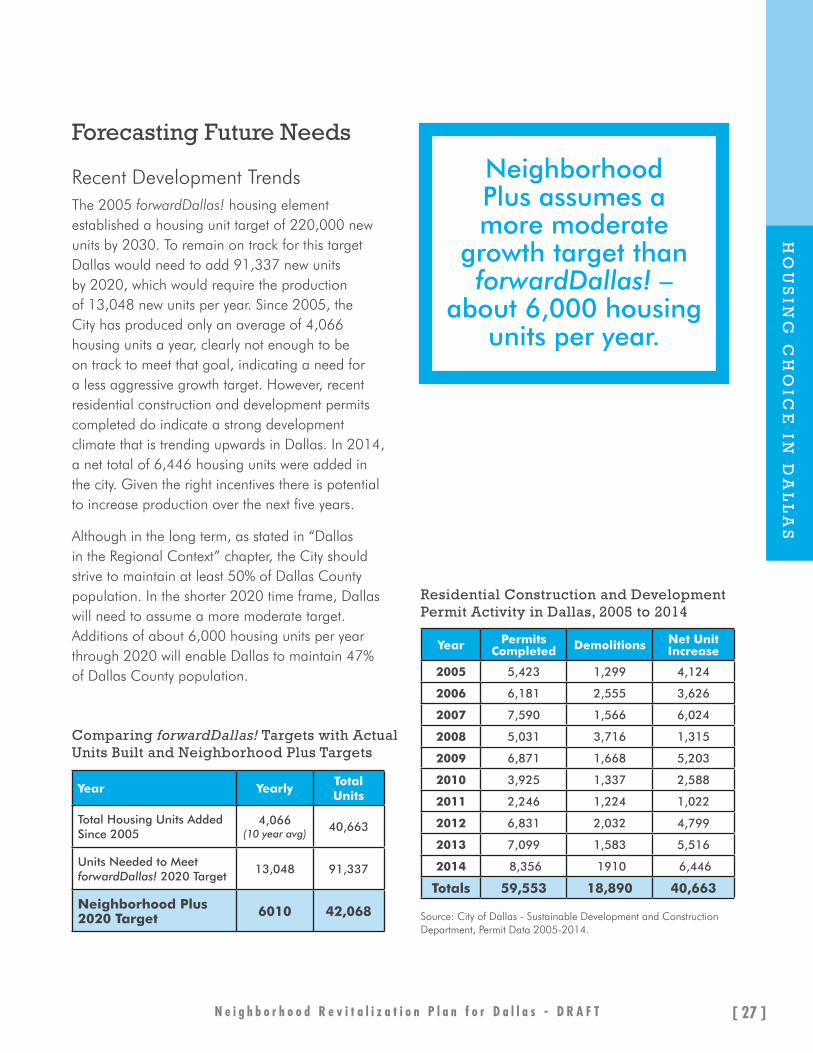
Recent Development Trends The 2005 forwardDallas! housing element established a housing unit target of 220,000 new units by 2030. To remain on track for this target Dallas would need to add 91,337 new units by 2020, which would require the production of 13,048 new units per year. Since 2005, the City has produced only an average of 4,066 housing units a year, clearly not enough to be on track to meet that goal, indicating a need for a less aggressive growth target. However, recent residential construction and development permits completed do indicate a strong development climate that is trending upwards in Dallas. In 2014, a net total of 6,446 housing units were added in the city. Given the right incentives there is potential to increase production over the next five years.
Although in the long term, as stated in “Dallas in the Regional Context” chapter, the City should strive to maintain at least 50% of Dallas County population. In the shorter 2020 time frame, Dallas will need to assume a more moderate target. Additions of about 6,000 housing units per year through 2020 will enable Dallas to maintain 47% of Dallas County population.
Year YearlyTotal Units
Total Housing Units Added Since 2005
4,066(10 year avg)
40,663
Units Needed to Meet forwardDallas! 2020 Target
13,048 91,337
Neighborhood Plus 2020 Target 6010 42,068
Comparing forwardDallas! Targets with Actual Units Built and Neighborhood Plus Targets
Year Permits Completed Demolitions Net Unit
Increase
2005 5,423 1,299 4,124
2006 6,181 2,555 3,626
2007 7,590 1,566 6,024
2008 5,031 3,716 1,315
2009 6,871 1,668 5,203
2010 3,925 1,337 2,588
2011 2,246 1,224 1,022
2012 6,831 2,032 4,799
2013 7,099 1,583 5,516
2014 8,356 1910 6,446
Totals 59,553 18,890 40,663
Residential Construction and Development Permit Activity in Dallas, 2005 to 2014
Source: City of Dallas - Sustainable Development and Construction Department, Permit Data 2005-2014.
Neighborhood Plus assumes a more moderate
growth target than forwardDallas! –
about 6,000 housing units per year.
N e i g h b o r h o o d R e v i t a l i z a t i o n P l a n f o r D a l l a s - D R A F T [ 27 ]
HO
US
ING
CH
OIC
E IN
DA
LL
AS

H O U S I N G C H O I C E I N D A L L A S
Housing Targets for 2020To sustain a growth target of about 6,000 housing units per year over five years, the city will need strong housing development with a diversity of housing types to meet emerging needs based on the age, income and housing preferences of future city residents. We can get a clearer picture of Dallas’ future housing needs through 2020, by looking at projected household changes in Dallas and the region and translating this into projections for owner-occupied and rental housing.
In addition, we should consider recent development trends as well as the City’s ability to influence development through policies and incentives. In recent years, multi-family residential development has accounted for the vast majority of the new housing. Since multi-family residential development tends to occur in cycles, this boom is likely to slow down during the next five years, although fairly strong demand is anticipated to persist. There is also strong, pent up demand for single family and townhouse development. Dallas has the opportunity to capture a healthy share of this demand, given the right public investment policies and incentives, and thus maintain or increase overall housing production over the next five years.
The housing targets for 2020 feature just over 50% of projected new housing units in multi-unit and mixed use developments. Nearly 25% of new demand is anticipated to be for smaller lot single family homes, and 15% for townhouses. Residents will increasingly opt for smaller homes in more connected places for reasons of access, neighborhood character, walkability, and affordability. When combined with existing housing stock, what emerges is a more balanced housing profile that will meet the needs of future residents by 2020.
Neighborhood Plus 2020 Targets Share of Growth by Housing Type
<1%
11%
26%
15%
47%
Housing Type 2020 Target(units added)
Annual Target
Standard and Large-Lot Single Family
4,606 658
Small-Lot Single Family 11,114 1,588
Townhome 6,277 897
Multi-family 19,911 4,719
Mobile Home / Other 160 33
Total 42,068 6010
Neighborhood Plus 2020 Targets by Type
Source: Envision Tomorrow Balanced Housing Model, Census Bureau ACS 2009-2013.
Demand projections are forecasted based on the current stock of owner
and renter-occupied housing units in Dallas, as reported in the American Community Survey (ACS). Regional population projections and anticipated household changes through 2020 were provided by Woods and Poole. Using the Envision Tomorrow Balanced Housing Model, these inputs were combined with the ESRI Tapestry market segment data in order to make realistic estimates of the kinds of future housing needs and preferences.
Standard and Large-Lot Single Family
Small-Lot Single Family
Townhome
Multi-family
Mobile Home or Other
D R A F T - N E I G H B O R H O O D P L U S[ 28 ]
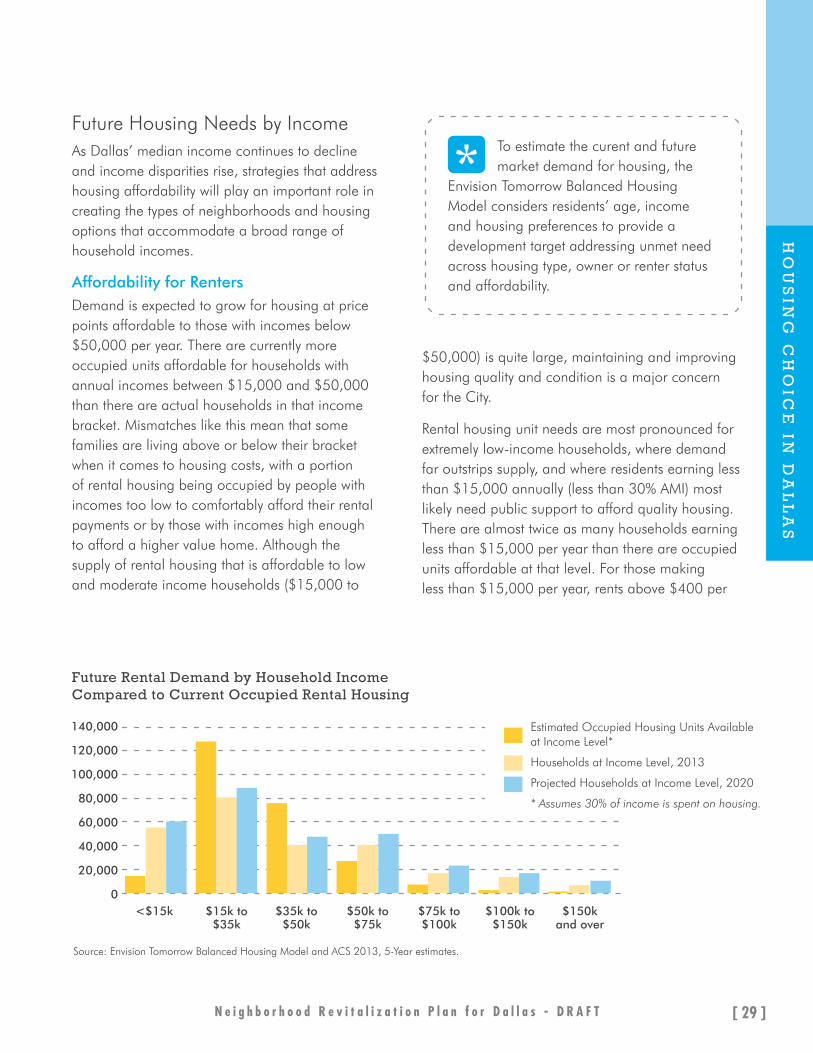
Future Housing Needs by IncomeAs Dallas’ median income continues to decline and income disparities rise, strategies that address housing affordability will play an important role in creating the types of neighborhoods and housing options that accommodate a broad range of household incomes.
Affordability for RentersDemand is expected to grow for housing at price points affordable to those with incomes below $50,000 per year. There are currently more occupied units affordable for households with annual incomes between $15,000 and $50,000 than there are actual households in that income bracket. Mismatches like this mean that some families are living above or below their bracket when it comes to housing costs, with a portion of rental housing being occupied by people with incomes too low to comfortably afford their rental payments or by those with incomes high enough to afford a higher value home. Although the supply of rental housing that is affordable to low and moderate income households ($15,000 to
$50,000) is quite large, maintaining and improving housing quality and condition is a major concern for the City.
Rental housing unit needs are most pronounced for extremely low-income households, where demand far outstrips supply, and where residents earning less than $15,000 annually (less than 30% AMI) most likely need public support to afford quality housing. There are almost twice as many households earning less than $15,000 per year than there are occupied units affordable at that level. For those making less than $15,000 per year, rents above $400 per
To estimate the curent and future market demand for housing, the
Envision Tomorrow Balanced Housing Model considers residents’ age, income and housing preferences to provide a development target addressing unmet need across housing type, owner or renter status and affordability.
Future Rental Demand by Household Income Compared to Current Occupied Rental Housing
Source: Envision Tomorrow Balanced Housing Model and ACS 2013, 5-Year estimates.
<$15k $15k to$35k
$35k to$50k
$50k to$75k
$75k to$100k
$100k to $150k
$150k and over
140,000
120,000
100,000
80,000
60,000
40,000
20,000
0
Estimated Occupied Housing Units Available at Income Level*
Households at Income Level, 2013
Projected Households at Income Level, 2020
* Assumes 30% of income is spent on housing.
N e i g h b o r h o o d R e v i t a l i z a t i o n P l a n f o r D a l l a s - D R A F T [ 29 ]
HO
US
ING
CH
OIC
E IN
DA
LL
AS

H O U S I N G C H O I C E I N D A L L A S
month are considered unaffordable. Many in the lowest income bracket are stretching to pay more than 30% of their income in rent due limited options that price point. Some of these households may be reliant on housing subsidies that are not counted as income on the U.S. Census.
These mismatches between household incomes and the current supply of housing affordable at each income level signal development opportunities for the construction of new rental housing aimed at low and extremely low-income households. As these segments are expected to grow by 2020, there will continue to be a strong need for subsidized housing for those earning $15,000 or less (extremely low income, less than 30% AMI), some of which should be designed for the elderly and other vulnerable populations.
Middle- and High-Income Renters
City limits
DART station
DART line
0 - 78
79 - 141
142 - 228
229 - 394
395 - 1840
Low-Income Owners
City limits
DART station
DART line
0 - 50
51 - 104
105 - 180
181 - 319
320 - 1057
Dallas has a high proportion of
middle- and upper-income renters,
households earning over $50,000 a year or roughly 80% AMI.
D R A F T - N E I G H B O R H O O D P L U S[ 30 ]

Dallas should work with other governmental agencies and low-income housing providers to develop strategies that will deliver additional rental options for extremely low-income households, those earning less than $15,000 per year (less than 30% AMI). These households are the most financially strained, and safe, quality affordable housing is critical to maintaining family stability and reducing the risk of homelessness
There are a sizeable number of moderate and middle income households (earning between $50,000 and $100,000) in Dallas who choose to rent, but the existing rental housing stock affordable to this segment may not be sufficient. This undersupply of housing for those in the moderate to middle income groups means that those families potentially face the dilemma of either choosing less desirable housing, or choosing housing that is too expensive relative to their income. In many cases, people may choose to move out of Dallas to find a better housing choice in one of the surrounding communities. This also represents an opportunity for new housing development in the City that caters to moderate and middle income households who want the flexibility of renting and the locational advantages of Dallas compared to more suburban locations.
On the high end of the income spectrum, there are a small but significant number of upper-income households that find Dallas a desirable community and choose to rent here despite the limited upscale housing options in the rental market. This strongly suggests a potential demand for additional high-amenity rental units for the market to capture. Dallas should work with the private, for-profit homebuilders and developers to develop strategies that identify and spur these housing market gaps. However, many of these higher income households may choose to continue paying less than 30% of their incomes on housing despite an increase in supply. Therefore, there will continue to be demand and competition for housing at price points affordable to moderate and middle income households from both directions.
Affordability for Owners While many people choose to rent, maintaining and expanding the quality affordable homeownership options in Dallas is a crucial factor in creating, retaining and preserving stable and vibrant neighborhoods throughout the city. Future homeownership housing needs, especially for the moderate and middle income households (earning between $50,000 and $100,000) are not so much
Future Owner Demand by Household Income Compared to Current Occupied Owner Housing
Source: Envision Tomorrow Balanced Housing Model and ACS 2013, 5-Year estimates.
<$15k $15k to$35k
$36k to$50k
$51k to$75k
$76k to$100k
$101k to $150k
$151k and over
60,000
50,000
40,000
30,000
20,000
10,000
0
Estimated Occupied Housing Units Available at Income Level, 2013 *
Actual Owner Households at Income Level
Project Households at Income Level, 2020
* Assumes 30% of income is spent on housing.
N e i g h b o r h o o d R e v i t a l i z a t i o n P l a n f o r D a l l a s - D R A F T [ 31 ]
HO
US
ING
CH
OIC
E IN
DA
LL
AS

H O U S I N G C H O I C E I N D A L L A S
an issue of housing supply, which is sufficient for current and future population projections, and more an issue of neighborhood quality and desirability. Neighborhood amenities, infrastructure and other targeted improvements like housing rehabilitation are detailed in the Goals, Strategies and Actions and will address these factors to make Dallas a more attractive place for moderate and middle income households and will build homeownership in Dallas, across the income spectrum.
In the low and extremely low-income segments (households earning below $50,000 per year) there is a relatively high rate of rental households compared to homeowners. This indicates a need to increase homeownership for those families and individuals making less than $50,000 per year. Less expensive housing options could take the form of smaller single family homes, townhomes as well as condominiums. Very few households at the lowest income levels (below 30% AMI) are likely able to afford a home unless they are mortgage-free. This category includes seniors and retirees, who have paid off their homes and consequently have low housing costs. These households typically face other affordability issues, such as having sufficient resources to maintain their home in good repair or pay costly utility bills.
Households earning above $100,000 typically pay less than 30% of their income on housing, so the mismatch between housing supply and demand at this income level is less than analysis might suggest.
These higher-earning households are occupying homes that would be affordable to families making less, thereby limiting the supply of housing affordable to those of more modest incomes.
Affordability for Vulnerable PopulationsIn addition to low and extremely low-income households, racial and ethnic minorities, the elderly, people with disability and mobility impairments, ex-offenders, individuals with HIV/AIDS, people experiencing homelessness and those at risk of homelessness are all groups who may need additional support to find and retain quality housing.
At 13.6%, Dallas has a lower percentage of elderly residents (60 years and over) than the national average of 19%. This population, however, experiences cost burden in housing at twice the rate of the city as a whole. Texas has a high rate of disability (11.5%), but Dallas (at 9.7%) is below the state average.1
Among the 50 states, Texas had the 4th highest homeless count in 2013.2 In Dallas, the homeless count increased from 2,972 in 2013 to 3,314 in 2014, which included 22% who are currently working and 24% who are ex-offenders. However, there has been a 65% drop in the number of chronically homeless people since 2005.3
HIV/AIDS cases in Texas are down, with a total of 26,065 cases and a rate of 574 cases per 100,000 in Dallas County. The City of Dallas is second to Houston in the number of diagnoses of HIV/AIDS in the state.4
1. Texas Workforce Investment Council. People with Disabilities: A Texas Profile, 2013.
2. U.S. HUD Annual Homeless Assessment Report to Congress, 2013.3. MHDA Point-in-time Homeless Count and Census, 2014.4. DSHS Texas HIV Surveillance Report, 2013 Annual Report.
In 2014, 22% of Dallas’ homeless were employed.
D R A F T - N E I G H B O R H O O D P L U S[ 32 ]
Opportunities for Change
A thorough understanding of the elements that influence housing choice in Dallas point to opportunities and challenges that compel needed changes. The six strategic goals and their related policies and actions outlined in the next chapter reflect these opportunities and challenges in Dallas’ neighborhoods. Many of the strategies work to alleviate the limitations to housing choice identified in the analysis, while others strive to build on Dallas’ existing assets through strategies not traditionally associated with housing policy, such as improving access to education, workforce training, and healthcare.
Additionally, by analyzing future housing needs, the City can work towards more targeted growth by housing type. These targets will work to guide strategic investments and partnerships in the future to ensure a broad range of quality rental and ownership housing within the context of building healthy and sustainable neighborhoods.
N e i g h b o r h o o d R e v i t a l i z a t i o n P l a n f o r D a l l a s - D R A F T [ 33 ]
HO
US
ING
CH
OIC
E IN
DA
LL
AS

The question is not whether we can afford to invest in every child; it is whether
we can afford not to.~ Marian Wright Edelman
image credit: Mason Cooper

STRATEGIC GOALS,
POLICIES AND ACTIONS

S T R A T E G I C G O A L S
A Neighborhood-Oriented Approach to Change
To ensure long term sustainable growth and to achieve a healthier city for all citizens, the City of Dallas must embark on a new approach that changes the way it delivers housing and neighborhood services. This chapter provides a comprehensive and strategic framework for this new approach. The intent is to influence how we allocate and leverage our resources, through effective deployment of both people-based and place-based strategies and programs, monitoring the results of city programs, expanding the range of programs to include the middle class, and partnering with the private, nonprofit, and other public agencies to ensure greater coordination and enhanced impact. Building partnerships that connect housing with education, health, transportation and economic empowerment can make real and lasting change in the lives of residents.
Our city is stronger as a whole if all neighborhoods are healthy and stable. We need to work towards making sure our neighborhoods have the services and amenities to retain residents and families at all levels of income. We also need to find more effective ways to engage and empower neighborhoods to build coalitions to address common issues. Working at the neighborhood level allows coordination of efforts to better serve residents and improve the quality of life for people of all incomes, ages and abilities. It also fosters innovative solutions better suited to the needs of each neighborhood, while enabling effective programs to be adapted and replicated in other similar neighborhoods.
Place matters: upward mobility of adults can be forecast by their childhood zipcode.
D R A F T - N E I G H B O R H O O D P L U S[ 36 ]
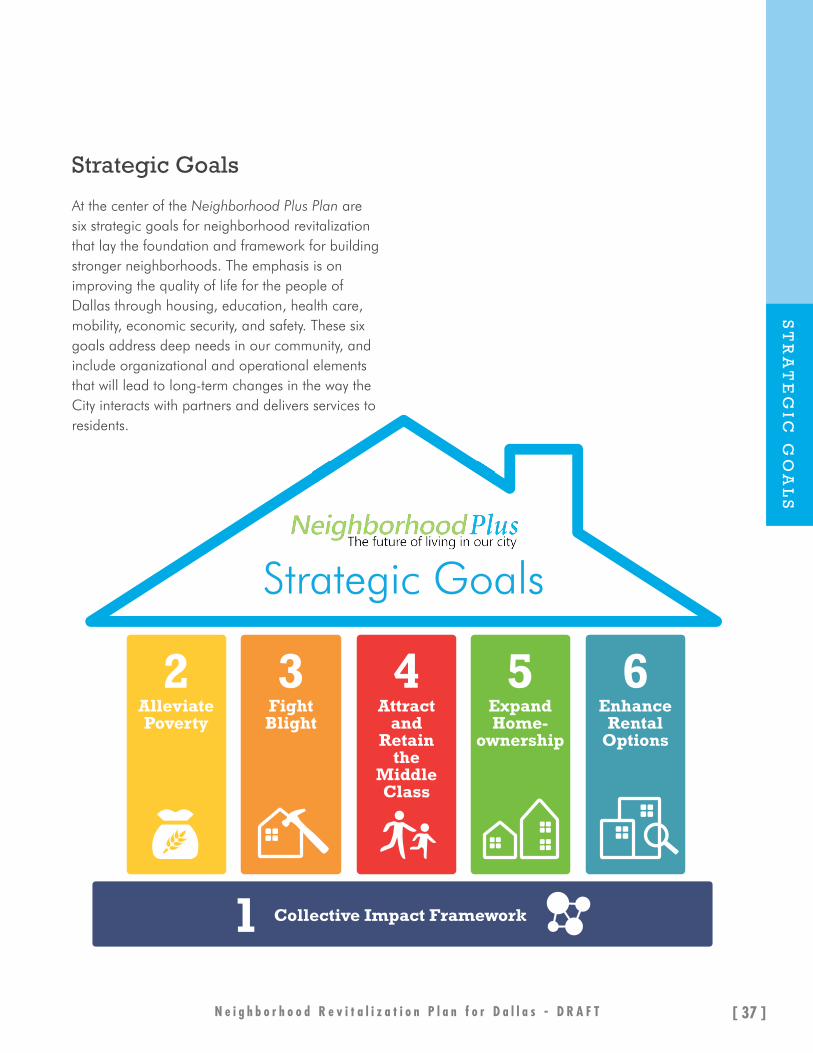
Strategic Goals
At the center of the Neighborhood Plus Plan are six strategic goals for neighborhood revitalization that lay the foundation and framework for building stronger neighborhoods. The emphasis is on improving the quality of life for the people of Dallas through housing, education, health care, mobility, economic security, and safety. These six goals address deep needs in our community, and include organizational and operational elements that will lead to long-term changes in the way the City interacts with partners and delivers services to residents.
N e i g h b o r h o o d R e v i t a l i z a t i o n P l a n f o r D a l l a s - D R A F T [ 37 ]
ST
RA
TE
GIC
GO
AL
S
S T R A T E G I C G O A L S
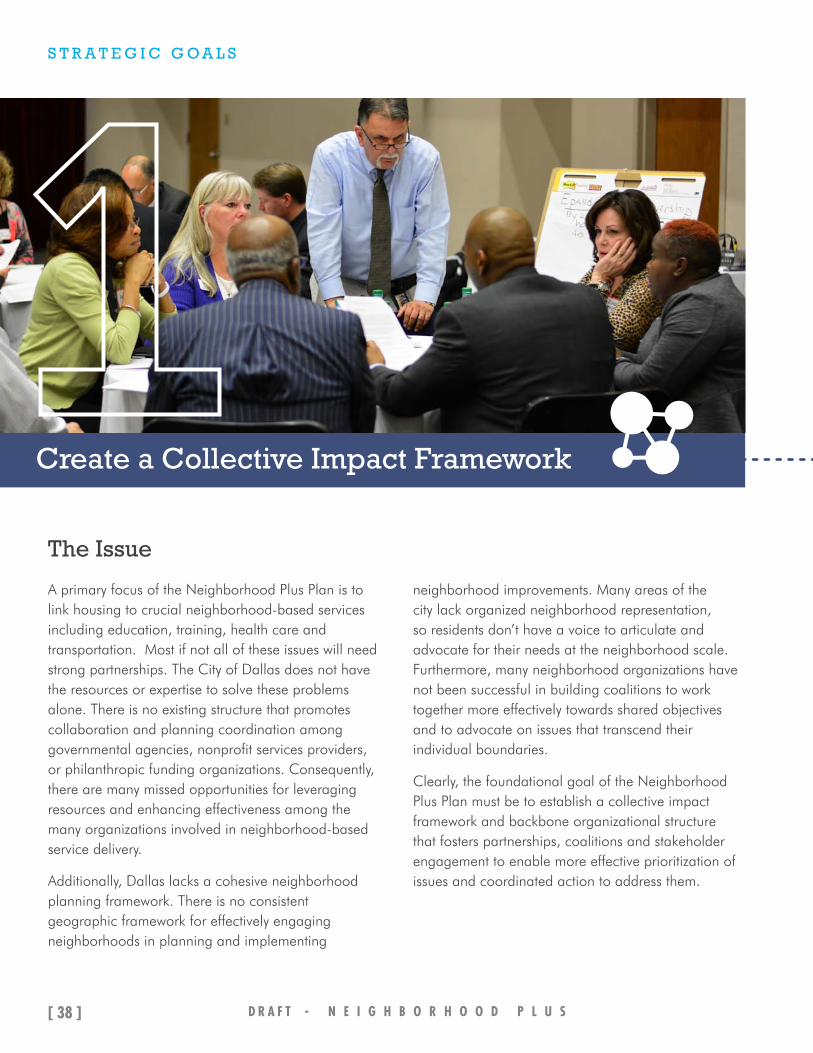
The Issue
A primary focus of the Neighborhood Plus Plan is to link housing to crucial neighborhood-based services including education, training, health care and transportation. Most if not all of these issues will need strong partnerships. The City of Dallas does not have the resources or expertise to solve these problems alone. There is no existing structure that promotes collaboration and planning coordination among governmental agencies, nonprofit services providers, or philanthropic funding organizations. Consequently, there are many missed opportunities for leveraging resources and enhancing effectiveness among the many organizations involved in neighborhood-based service delivery.
Additionally, Dallas lacks a cohesive neighborhood planning framework. There is no consistent geographic framework for effectively engaging neighborhoods in planning and implementing
neighborhood improvements. Many areas of the city lack organized neighborhood representation, so residents don’t have a voice to articulate and advocate for their needs at the neighborhood scale. Furthermore, many neighborhood organizations have not been successful in building coalitions to work together more effectively towards shared objectives and to advocate on issues that transcend their individual boundaries.
Clearly, the foundational goal of the Neighborhood Plus Plan must be to establish a collective impact framework and backbone organizational structure that fosters partnerships, coalitions and stakeholder engagement to enable more effective prioritization of issues and coordinated action to address them.
Create a Collective Impact Framework
D R A F T - N E I G H B O R H O O D P L U S[ 38 ]

Desired OutcomesBy 2016, Dallas will have a new back-bone nonprofit organization and framework for organizing, communicating, coordinating and partnering among public, private and nonprofit agencies for planning, resource allocation and service provision.
By 2020, Dallas will have established a working super-neighborhood organizing framework for building coalitions and engaging neighborhood associations in ongoing planning and implementation efforts.
1
Collective Impact came to the forefront when the Stanford Social Innovation Review published “Collective Impact” in the Winter of 2011, and “Channeling Change: Making Collective Impact Work,” in 2012. These synthesized lessons from existing process models for change that were already working and branded successful principles into a succinct theoretical framework. We envision creating a compact among partners engaged in housing and neighborhood-oriented services with the following framework:
Common Agenda: All partners have a shared vision for change, a common understanding, joint approach and agreed upon actions.
Shared Measurement: Collecting data and measuring results consistently across all sectors through alignment and accountability.
Mutually Reinforcing Activities: Activities are differentiated while still coordinated among all partners.
Continuous Communication: Consistent and open communication among all partners to build trust, and assure mutual objectives and common motivation.
Backbone Organization: An independent organization serves as backbone for the initiative and coordinates organizations.
What is Collective Impact?
N e i g h b o r h o o d R e v i t a l i z a t i o n P l a n f o r D a l l a s - D R A F T [ 39 ]
ST
RA
TE
GIC
GO
AL
S
S T R A T E G I C G O A L S
Policies
1.1 Promote inter-agency collaboration, leveraging of resources, coordination and co-location of services.
1.1.1 Expand the coalition created by the Mayor’s Poverty Task Force to create a nonprofit organizational framework to administer a Neighborhood Plus Compact among diverse public and private agencies engaged in housing, transportation, education, work force training, health care and other neighborhood-based service provision. ST
1.1.2 Establish and maintain a common agenda and shared work program among the Neighborhood Plus Compact partner agencies. Support the shared work program with multi-agency resources. Establish a shared monitoring program to measure outcomes. Coordinate with Action 1.3.1. ST
1.1.3 Develop a money matrix to identify and leverage existing and prospective resources available within a three to five year timeframe for deployment towards achieving the strategic goals of Neighborhood Plus. Begin with identifying City of Dallas resources and then expand to address multi-agency resources. Coordinate with Action 1.3.1. ST
1.1.4 Host an ongoing series of regional symposia to foster dialogue on Neighborhood Plus issues, particularly fair housing, at the regional level. Expand the Neighborhood Plus Compact to be regional in scope. LT
ActionsST = SHORT TERM (1 YEAR)
MT = MEDIUM TERM (2 - 3 YEARS) LT = LONG TERM (3 - 5 YEARS)
Strategies in ActionBest Practices for Collective Impact
Health and Wellness Alliance for Children
Partnership of more than 60 community organizations – spanning health, education, government, nonprofits and the faith community – that are focused on improving the health and well-being of children in Dallas County. The first clinical focus is on pediatric asthma.
Strive Together: Cradle to Career Network
National network of 55 community partnerships in 28 states and Washington DC working to improve education success by bringing together cross-sector partners around a community vision through collective impact compact. Started in Cincinnati and Northern Kentucky in 2006.
D R A F T - N E I G H B O R H O O D P L U S[ 40 ]
PoliciesST = SHORT TERM (1 YEAR)
MT = MEDIUM TERM (2 - 3 YEARS) LT = LONG TERM (3 - 5 YEARS) Actions
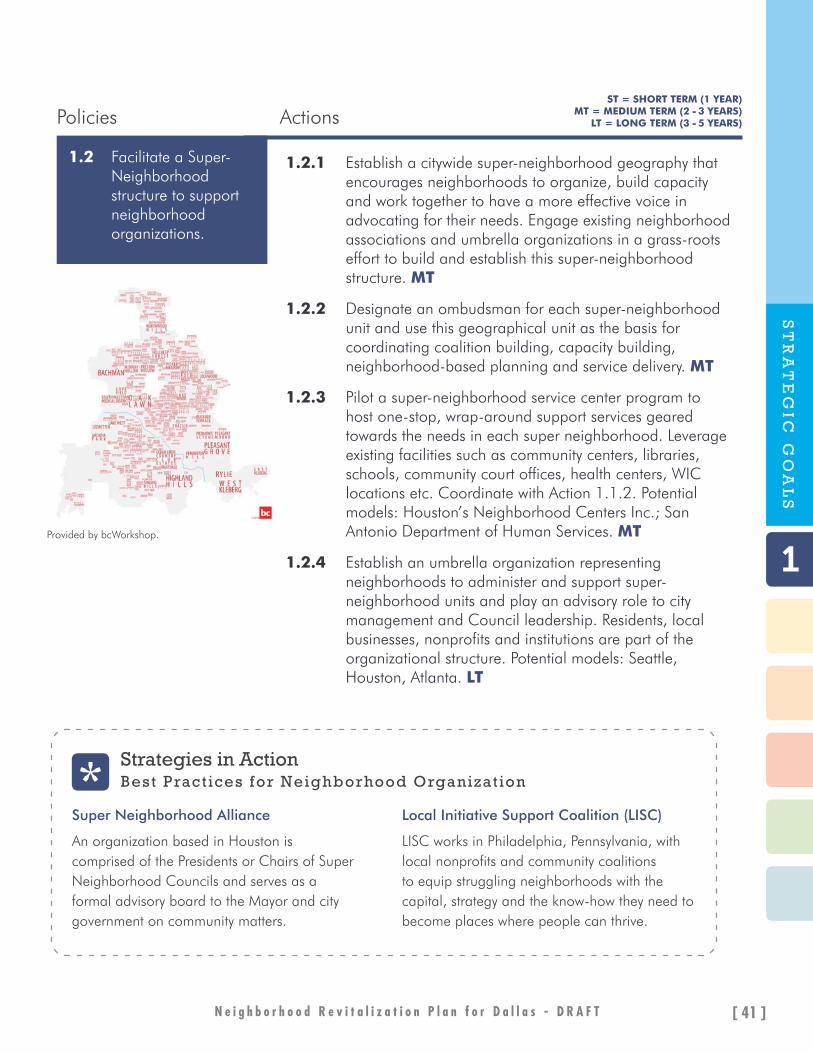
1.2 Facilitate a Super-Neighborhood structure to support neighborhood organizations.
1.2.1 Establish a citywide super-neighborhood geography that encourages neighborhoods to organize, build capacity and work together to have a more effective voice in advocating for their needs. Engage existing neighborhood associations and umbrella organizations in a grass-roots effort to build and establish this super-neighborhood structure. MT
1.2.2 Designate an ombudsman for each super-neighborhood unit and use this geographical unit as the basis for coordinating coalition building, capacity building, neighborhood-based planning and service delivery. MT
1.2.3 Pilot a super-neighborhood service center program to host one-stop, wrap-around support services geared towards the needs in each super neighborhood. Leverage existing facilities such as community centers, libraries, schools, community court offices, health centers, WIC locations etc. Coordinate with Action 1.1.2. Potential models: Houston’s Neighborhood Centers Inc.; San Antonio Department of Human Services. MT
1.2.4 Establish an umbrella organization representing neighborhoods to administer and support super-neighborhood units and play an advisory role to city management and Council leadership. Residents, local businesses, nonprofits and institutions are part of the organizational structure. Potential models: Seattle, Houston, Atlanta. LT
Strategies in ActionBest Practices for Neighborhood Organization
Super Neighborhood Alliance
An organization based in Houston is comprised of the Presidents or Chairs of Super Neighborhood Councils and serves as a formal advisory board to the Mayor and city government on community matters.
Local Initiative Support Coalition (LISC)
LISC works in Philadelphia, Pennsylvania, with local nonprofits and community coalitions to equip struggling neighborhoods with the capital, strategy and the know-how they need to become places where people can thrive.
1Provided by bcWorkshop.
N e i g h b o r h o o d R e v i t a l i z a t i o n P l a n f o r D a l l a s - D R A F T [ 41 ]
ST
RA
TE
GIC
GO
AL
S
S T R A T E G I C G O A L S
1.3.1 Launch a Neighborhood Plus target area program to focus and coordinate funding, incentives and programs across multiple agencies to facilitate systematic revitalization, stabilization, or enhancement of neighborhoods. Use objective criteria to identify target areas, harnessing external partnerships and leveraging market forces to implement catalyst projects. Identify a first round of target areas in which timely intervention can produce early and lasting results. Coordinate with Actions 1.1.1 and 1.1.2. ST
1.3.2 Develop Neighborhood Plus target area action plans in collaboration with community stakeholders and partner agencies within a year. Establish a multi-agency action team led by a general manager with responsibility to implement these plans within three years. Coordinate with Actions 1.1.1, 1.1.2 and 1.1.3. MT
1.3.3 Establish a three-year cycle for ongoing selection of target areas to be coordinated with the regular funding and resource allocation cycles of the City and other key collective impact partners. In year one, the first round of target areas would be selected. By year two, the action plan for the first round would be completed and the second round of target areas would be selected. By the end of year three, target areas would graduate from the program. LT
1.3 Strategically target resources to maximize neighborhood impact.
Strategies in ActionBest Practices for Neighborhood Improvement Programs
Promise Neighborhood Program
Federal grant program modeled on Harlem Children’s Zone that is designed as a comprehensive community based initiative around building high quality, coordinated health, social, community, and educational support within distressed neighborhoods.
WINS Initiative Working in Neighborhoods Strategically
A stakeholder-led collective impact initiative in South Dalls/Fair Park was crafted to revitalize this community by improving quality of life for its residents in five focus areas: education, economic development, housing, health, public safety.
Policies ActionsST = SHORT TERM (1 YEAR)
MT = MEDIUM TERM (2 - 3 YEARS) LT = LONG TERM (3 - 5 YEARS)
D R A F T - N E I G H B O R H O O D P L U S[ 42 ]

1.4.1 Establish a transparent approach and a clear set of evaluation criteria for public and private projects receiving City funding, subsidies or incentives, to be used as a consistent frame of reference across departments for all items brought forward for Council action. Tie the evaluation criteria to measurable outcomes related to Neighborhood Plus goals and policies. Monitor outcomes and periodically review effectiveness of projects and programs that are funded. Provide resources to projects that deliver the best outcomes for the dollars allocated. Coordinate with Actions 1.1.2 and 1.3.1. ST
1.4.2 Initiate an assessment of current pipeline projects that are behind schedule to evaluate them against these criteria. Terminate projects that are unable to meet these criteria and consider reallocation of funds. ST
1.4.3 Create a coordinated, shared central intake system so beneficiaries of services can register once to access a variety of programs related to workforce, childcare, health, education or home-ownership. Explore partnership opportunities with the 2-1-1 Initiative. Coordinate with Action 1.1.2. MT
1.4.4 Pilot a case management system to enable collaborative work, data and resource sharing to coordinate a complete set of wrap-around services necessary to further enhance health, education and employment opportunities for at risk households and individuals in areas of greatest need. Coordinate with Actions 1.1.2 and 1.2.4. LT
1.4 Promote efficiency and effectiveness across programs and agencies.
PoliciesST = SHORT TERM (1 YEAR)
MT = MEDIUM TERM (2 - 3 YEARS) LT = LONG TERM (3 - 5 YEARS) Actions
1
N e i g h b o r h o o d R e v i t a l i z a t i o n P l a n f o r D a l l a s - D R A F T [ 43 ]
ST
RA
TE
GIC
GO
AL
S

S T R A T E G I C G O A L S
The IssuePoverty is a major issue that is approaching crises proportions in Dallas. Today one in five Dallas residents lives in poverty. Over the last decade, the number of people living below the poverty line increased from 15% to 20%, and Dallas now has the highest poverty levels among Texas’ four largest cities including Austin, Houston and San Antonio. Poverty disproportionately affects children and people of color. Particularly disturbing, almost two in five children under the age of 18 live in poverty.
Although the Dallas metro’s economic output has increased nearly 70% in the last decade, the growth of individuals and families in poverty outpaced total population growth within the City. Among the working poor (households earning less than 200% of the poverty line), the threat of poverty looms. The Corporation for Enterprise Development concluded that 39% of Dallas households are asset poor and do not have the resources to survive for three months above the poverty line if they were to lose their jobs.
Desired OutcomeBy 2016, Dallas will develop a metric for identifying areas of concentrated poverty and establish a benchline for progress.
By 2020, Dallas will have two consecutive years of stability or decline in the number of areas of concentrated poverty.
Suggested MetricsPopulation in areas of concentrated poverty (defined as block groups or census tracts where over 20% of the population are below the federal poverty threshold).
The City of Dallas will find a partner to establish the Self Sufficiency Standard based on Center for Women’s Welfare model to better measure modern living expenses as an alternative to the federal poverty measure.
Alleviate Poverty
D R A F T - N E I G H B O R H O O D P L U S[ 44 ]

Areas of Concentrated Poverty
City limits
20%-40%
41% and over
2.1.1 Increase Earned Income Tax Credit (EITC) and financial literacy participation through partnerships with United Way, Childrens Hospital’s Operation Hope and others. Coordinate with Actions 1.1.2 and 1.2.4. MT
2.1.2 Pilot a day labor center in Dallas to provide safe opportunities for daily wage earners with locational considerations and appropriate supervision in a manner that minimizes negative impacts on neighborhoods. Potential models: City of Plano, City of Garland, City of Fort Worth. MT
2.1.3 Explore partnerships to create a grant program that provides tuition and stipends to qualified adults in targeted areas of high need to attend college full-time. Coordinate with Action 1.1.2. MT
2.1.4 Establish an appropriate minimum employee hourly rate for Dallas contractors (to match or exceed City of Dallas minimum wage). Encourage other government and private employers to follow suit in providing a living wage to Dallas workers. LT
2.1 Increase the earning capacity of low wage earners.
Policies Actions
% of Residents Who Live in Poverty
2
ST = SHORT TERM (1 YEAR) MT = MEDIUM TERM (2 - 3 YEARS)
LT = LONG TERM (3 - 5 YEARS)
Source: Census Bureau ACS 2009-2013.
N e i g h b o r h o o d R e v i t a l i z a t i o n P l a n f o r D a l l a s - D R A F T [ 45 ]
ST
RA
TE
GIC
GO
AL
S

S T R A T E G I C G O A L S
2.3 Expand health, childcare, and transportation programs for low income areas.
2.3.1 Launch a pilot partnership program to promote healthful food choices in existing stores in food deserts through education and incentives. Coordinate with Action 1.3.1. ST
2.3.2 Partner with health agencies to use Fire Department EMS personnel for wellness education and home visits. ST
2.3.3 Support partnerships to increase accessible healthcare in areas with high levels of need, particularly with multiple issues such as poverty concentration and high incidence of medical conditions such as diabetes, high blood pressure, asthma and obesity . Coordinate with Actions 1.2.4 and 1.3.1. Potential models: Parkland Hatcher Station, Children’s Initiatives - Weight Management Program with YMCA, Go Noodle and Telehealth partnerships with DISD. MT
2.3.4 Create a partnership between DHA, DART and other transportation providers for transportation passes for DHA residents, bicycle share programs and car share programs. Coordinate with Action 1.1.2. MT
2.3.5 Build partnerships between employers, transportation providers, apartment managers, developers, and childcare providers to increase accessibility of affordable childcare to working parents. Coordinate with Action 1.1.2. LT
2.2.1 Complete ongoing workforce ecosystem mapping for Dallas County through partnerships with Workforce Solution Greater Dallas to identify skills gaps and barriers and to better match needs with programs and opportunities. ST
2.2.2 Work with outreach partners to increase awareness of existing workforce training programs and to identify jobs/employers that do not require college degrees. Encourage new and expanding businesses to fill employment needs through workforce training partners. Coordinate with Action 1.1.2. MT
2.2.3 Create partnerships to strengthen employer sponsorships, apprenticeship programs, and second chance initiatives for at-risk youth. Coordinate with Actions 1.1.2 and 1.2.4. MT
2.2.4 Expand existing partnerships to provide accessible neighborhood-based literacy, ESL and GED classes in areas of need to enhance adult education and improve literacy rates and English proficiency. Coordinate with Actions 1.1.2, 1.2.4 and 1.3.1. MT
2.2.5 Create a comprehensive family self-sufficiency program to assist DHA residents to move from public housing to market housing. Coordinate with Action 1.1.2 and 1.4.3. MT
2.2 Expand workforce training programs.
Policies ActionsST = SHORT TERM (1 YEAR)
MT = MEDIUM TERM (2 - 3 YEARS) LT = LONG TERM (3 - 5 YEARS)
D R A F T - N E I G H B O R H O O D P L U S[ 46 ]

2.4.1 Support Commit 2 Dallas and DISD efforts to build or expand early childhood / pre-K education opportunities. Coordinate with Actions 1.1.2. ST
2.4.2 Create additional support for early learners outside the classroom by aligning resources and initiatives throughout the community such as drop-in learning environments in City of Dallas facilities, home visitation parent education programs, and improved communications to help caregivers navigate available resources and social services. Coordinate with Actions 1.1.2 and 1.2.4. MT
2.5.1 Increase the reach of Metro Dallas Homeless Alliance (MDHA) rapid rehousing efforts by extending homeless assistance center services through the super-neighborhood service center program’s one-stop wrap around support services. Coordinate with Action 1.2.3 MT
2.5.2 Work with MDHA to increase placement of homeless individuals in permanent housing through the Landlord Engagement Taskforce. MT
2
2.4 Improve Pre-K education opportunities for children in poverty.
2.5 Facilitate integration of homeless population back into the workforce and society.
Policies Actions
Strategies in ActionBest Practices for Programs for Low Income Workers
Zipcar partners with DC Housing Authority
Zipcar will place nine new carsharing vehicles at DCHA locations to enable residents to attend job interviews, doctor’s appointments or run errands in areas that lack transit access.
Purpose Built Model
Purpose Built works side-by-side with local leaders to plan and implement holistic revitalization efforts, providing services at no charge. They specialize in tailoring their approach to each community’s needs and the dynamics of the neighborhood they are working to revitalize.
2
ST = SHORT TERM (1 YEAR) MT = MEDIUM TERM (2 - 3 YEARS)
LT = LONG TERM (3 - 5 YEARS)
N e i g h b o r h o o d R e v i t a l i z a t i o n P l a n f o r D a l l a s - D R A F T [ 47 ]
ST
RA
TE
GIC
GO
AL
S
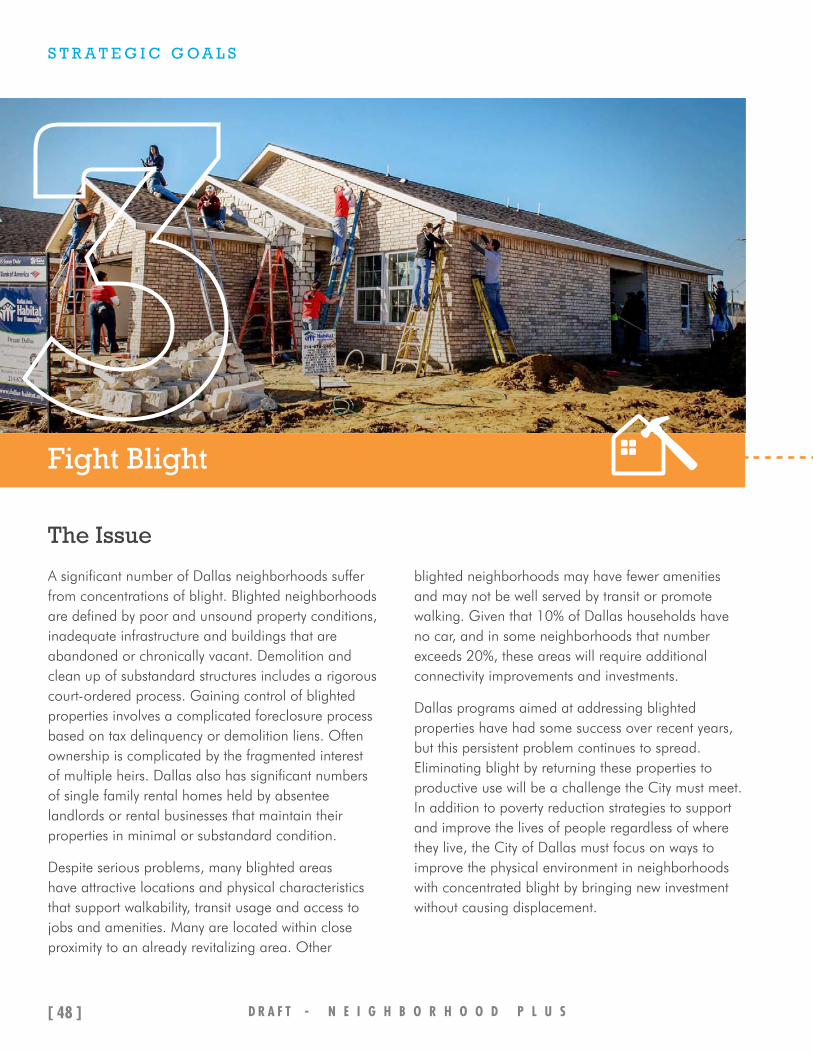
S T R A T E G I C G O A L S
The Issue
A significant number of Dallas neighborhoods suffer from concentrations of blight. Blighted neighborhoods are defined by poor and unsound property conditions, inadequate infrastructure and buildings that are abandoned or chronically vacant. Demolition and clean up of substandard structures includes a rigorous court-ordered process. Gaining control of blighted properties involves a complicated foreclosure process based on tax delinquency or demolition liens. Often ownership is complicated by the fragmented interest of multiple heirs. Dallas also has significant numbers of single family rental homes held by absentee landlords or rental businesses that maintain their properties in minimal or substandard condition.
Despite serious problems, many blighted areas have attractive locations and physical characteristics that support walkability, transit usage and access to jobs and amenities. Many are located within close proximity to an already revitalizing area. Other
blighted neighborhoods may have fewer amenities and may not be well served by transit or promote walking. Given that 10% of Dallas households have no car, and in some neighborhoods that number exceeds 20%, these areas will require additional connectivity improvements and investments.
Dallas programs aimed at addressing blighted properties have had some success over recent years, but this persistent problem continues to spread. Eliminating blight by returning these properties to productive use will be a challenge the City must meet. In addition to poverty reduction strategies to support and improve the lives of people regardless of where they live, the City of Dallas must focus on ways to improve the physical environment in neighborhoods with concentrated blight by bringing new investment without causing displacement.
Fight Blight
D R A F T - N E I G H B O R H O O D P L U S[ 48 ]

Desired OutcomesBy 2016, establish and maintain a GIS database of blighted properties in the City of Dallas, and define a consistent metric for areas of concentrated physical blight.
By 2020, Dallas will have two consecutive years of stability on reduction in the number of areas with concentrated physical blight.
Suggested MetricsPhysical blight as defined by the UNT/ Habitat 2011 blight study.
3
Percent of Housing in Poor Condition
City limits
6% - 10%
11% – 15%
more than 15%
Source: Dallas Central Appraisal District.
N e i g h b o r h o o d R e v i t a l i z a t i o n P l a n f o r D a l l a s - D R A F T [ 49 ]
ST
RA
TE
GIC
GO
AL
S

S T R A T E G I C G O A L S
3.1 Establish a unified blight removal and improvement program.
3.1.1 Create a permanent blight task force under one leader to coordinate and prioritize efforts across departments and agencies and to streamline accountability. ST
3.1.2 Define blight objectively and incorporate into the Dallas code. Evaluate available legal tools to address blight and strengthen them as needed. Coordinate with Action 6.1.1. ST
3.1.3 Create a GIS database of blighted properties along with a methodology for maintaining and updating it across departments. Link the blighted properties database with the Dallas Open Data Portal and collaborate with EPIC to enable residents to track the City’s progress on addressing blighted properties. Coordinate with Action 3.1.2. ST
3.1.4 Enact an ordinance for fee-based vacant property registry (similar to current program for CBD commercial property) and require owners or foreclosing lenders to register long-term vacant buildings with the City. ST
3.1.5 Proactively and systematically bring blighted properties into code compliance in areas of concentrated blight. Strategically work with high impact landlords to produce early and visible results. Coordinate with Actions 1.3.1 and 6.1.1. MT
Policies ActionsST = SHORT TERM (1 YEAR)
MT = MEDIUM TERM (2 - 3 YEARS) LT = LONG TERM (3 - 5 YEARS)
D R A F T - N E I G H B O R H O O D P L U S[ 50 ]

Policies Actions
Strategies in ActionBest Practices for Programs for Health Par tnerships
EPIC
EPIC’s website, mydallasneighborhood.org, allows community members to track information on completed code enforcement actions, build permits, and crime incidents. Searchable by address, it shows the property owner, property tax valuation, condition code, and property tax payments using up-to-date data from the City’s open data portal, Dallas Central Appraisal District, and Dallas County Tax Office.
Users can search for specific homes or browse what’s happening across the entire city, and then subscribe to receive alerts when new information is available.
BlightSTAT and BlightSTATUS
Monthly public meetings run by the Office of Performance and Accountability in New Orleans, Louisiana.
Everett Community Health Partnership
Received an urban agriculture grant from the State of Massachusetts exploring urban agriculture to fight blight and nutrition.
3.2 Develop programs and partnerships to return blighted properties to productive use.
3.2.1 Strategically target public investment for acquistion and improvement of properties in blighted areas to play a catalytic role in neighborhood revitalization through housing development, neighborhood green space and other public amenities. Coordinate with Actions 1.1.2, 1.3.1, 1.3.2 and with the bond program. MT
3.2.2 Engage private partners such as the Real Estate Council, Texas Trees Foundation, philanthropic foundations and others to sponsor neighborhood improvements in blighted areas to upgrade infrastructure such as parks, playgrounds, schools and other amenities. Coordinate with Actions 1.1.2 and 1.3.1. MT
3.2.3 Create a pilot vacant property re-seeding program to proactively put vacant properties in blighted areas to interim use through initiatives such as community gardens and pop up fitness zones. Potential models: H.I.S Bridgebuilders community garden model, Trust for Public Land Fitness Zones model. MT
3
ST = SHORT TERM (1 YEAR) MT = MEDIUM TERM (2 - 3 YEARS)
LT = LONG TERM (3 - 5 YEARS)
N e i g h b o r h o o d R e v i t a l i z a t i o n P l a n f o r D a l l a s - D R A F T [ 51 ]
ST
RA
TE
GIC
GO
AL
S
S T R A T E G I C G O A L S
3.3 Dispose of City-owned and land bank properties more strategically and efficiently.
3.3.1 Develop a comprehensive GIS database of all City-owned and land bank properties along with a methodology for maintaining and updating it across departments. ST
3.3.2 Enable greater flexibility to acquire, sell and redevelop land bank and city-owned properties. Expand exceptions in the Local Government Code for bidding and fair market value sales price requirements for problem properties. Include appropriate deed restrictions or reversionary rights to hold buyers accountable for maintenance requirements, tax payments and redevelopment deadlines. Establish flexible procedures for selling parcels to abutting property owners or owners in the same block. Enable private nonprofits to acquire bundles of lots to support community development. ST
3.3.3 Work with Dallas County and its legal agents to speed up the tax collection and foreclosure process to increase the number of tax foreclosures for land banking allowed each year under the current contract. ST
3.4.1 Partner with health care and other agencies to establish effective ways to link code-related housing and environmental conditions to asthma triggers and other chronic illnesses in areas of high incidence. Create partnerships to promote awareness about this link among residents and landlords. MT
3.4 Address endemic health issues in blighted areas with concentrated poverty.
Policies ActionsST = SHORT TERM (1 YEAR)
MT = MEDIUM TERM (2 - 3 YEARS) LT = LONG TERM (3 - 5 YEARS)
D R A F T - N E I G H B O R H O O D P L U S[ 52 ]

3
This page intentionally left blank.
N e i g h b o r h o o d R e v i t a l i z a t i o n P l a n f o r D a l l a s - D R A F T [ 53 ]
ST
RA
TE
GIC
GO
AL
S
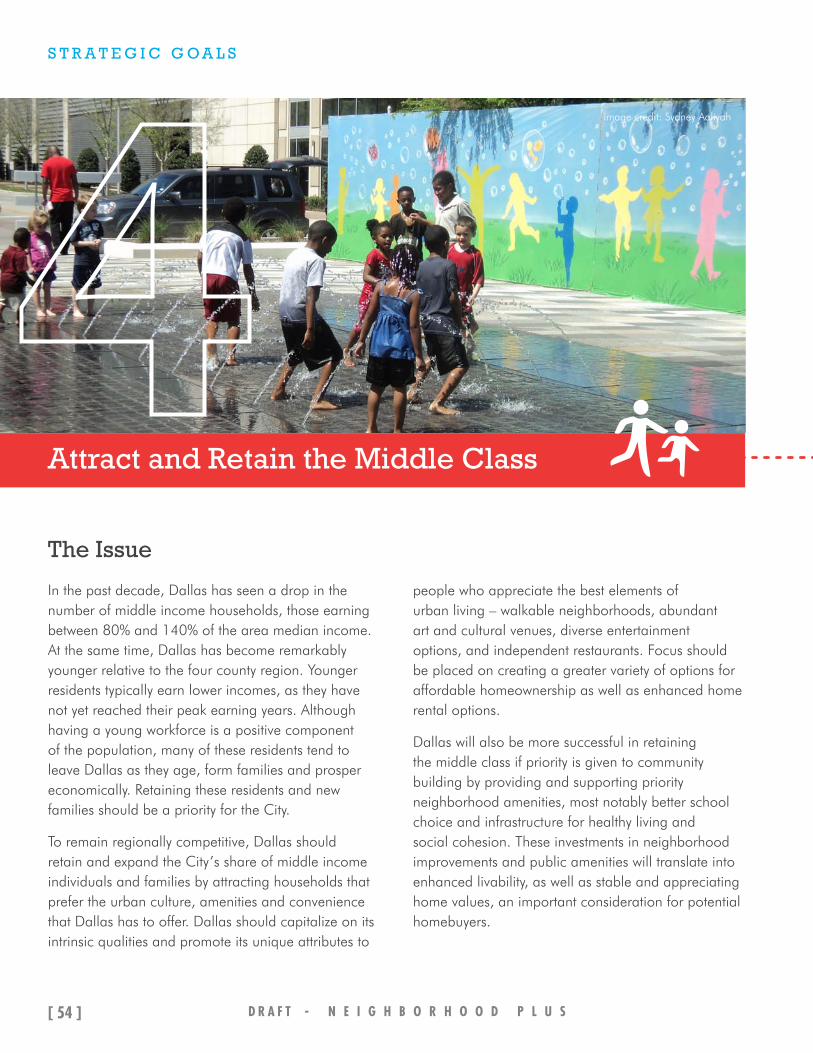
S T R A T E G I C G O A L S
The Issue
In the past decade, Dallas has seen a drop in the number of middle income households, those earning between 80% and 140% of the area median income. At the same time, Dallas has become remarkably younger relative to the four county region. Younger residents typically earn lower incomes, as they have not yet reached their peak earning years. Although having a young workforce is a positive component of the population, many of these residents tend to leave Dallas as they age, form families and prosper economically. Retaining these residents and new families should be a priority for the City.
To remain regionally competitive, Dallas should retain and expand the City’s share of middle income individuals and families by attracting households that prefer the urban culture, amenities and convenience that Dallas has to offer. Dallas should capitalize on its intrinsic qualities and promote its unique attributes to
people who appreciate the best elements of urban living – walkable neighborhoods, abundant art and cultural venues, diverse entertainment options, and independent restaurants. Focus should be placed on creating a greater variety of options for affordable homeownership as well as enhanced home rental options.
Dallas will also be more successful in retaining the middle class if priority is given to community building by providing and supporting priority neighborhood amenities, most notably better school choice and infrastructure for healthy living and social cohesion. These investments in neighborhood improvements and public amenities will translate into enhanced livability, as well as stable and appreciating home values, an important consideration for potential homebuyers.
Attract and Retain the Middle Class
image credit: Sydney Aaliyah
D R A F T - N E I G H B O R H O O D P L U S[ 54 ]

Desired OutcomesBy 2016, identify priority infrastructure projects aimed at attracting and retaining the middle class to be funded by the next bond program.
By 2020, Dallas will have two consecutive years of stable or increased middle income households (making 80%-140% of AMI).
Suggested MetricsShare of households making 80% to 140% of AMI based on ACS.
Percent of housing within ¼ mile of amenities that support healthy living.
City limits
$15,000 or less
$15,001 - $35,000
$35,001 - $50,000
$50,001 - $75,000
$75,001 - $100,000
$100,001 - $150,000
more than $150,000
City limits
under 10%
11% - 20%
21% - 30%
31% - 40%
more than 40%
Median Household Income
4
Share of Households Making 80% to 140% of AMI
Source: Census Bureau ACS 2009-2013.
N e i g h b o r h o o d R e v i t a l i z a t i o n P l a n f o r D a l l a s - D R A F T [ 55 ]
ST
RA
TE
GIC
GO
AL
S

S T R A T E G I C G O A L S
4.3 Enhance neighborhoods desirability by improving infrastructure, housing stock, recreation and safety.
4.3.1 Pilot a Neighborhood Revitalization TIF program to fund neighborhood improvements aimed at attracting new residents. Coordinate with Action 1.3.1. Potential model: City of Milwaukee Lindsay Heights neighborhood. MT
4.3.2 Work with utility companies to expand high-speed internet and mobile phone coverage (broadband or fiber) across the city to end inequitable access and to ensure economic opportunity and competiveness across the city. Coordinate with Action 1.3.1. MT
4.3.3 Identify and prioritize infrustructure and amenity enhancements to be funded in the next bond program in target areas aimed at attracting and retaining the middle class. MT
4.1 Promote Dallas as a city of neighborhoods and publicize neighborhood assets and programs.
4.1.1 Incorporate a “City of Neighborhoods” concept into Dallas’ brand and marketing initiatives aimed at attracting middle income residents while highlighting the amenities of living in Dallas. Coordinate with Action 1.2.1. ST
4.1.2 Engage Dallas citizens in an ongoing process of building/promoting/establishing neighborhood identity. Coordinate with Action 1.2.1. Potential model: LA Times model. MT
4.2 Support and leverage emerging school quality and school choice programs.
4.2.1 Leverage new DISD Choice Schools, KIPP schools, Uplift schools, parochial schools, and other high performing schools with targeted neighborhood improvements and private investment incentive programs aimed at attracting new residents. Coordinate with Actions 1.1.2, 1.2.4, 1.3.1, 5.2.1, 5.2.2, and 5.2.3. MT
4.2.2 Engage DISD and Charter school organizations in the super-neighborhood structure to support neighborhood based education improvement efforts through school choice programs. Coordinate with Action 1.2.3. MT
Policies ActionsST = SHORT TERM (1 YEAR)
MT = MEDIUM TERM (2 - 3 YEARS) LT = LONG TERM (3 - 5 YEARS)
D R A F T - N E I G H B O R H O O D P L U S[ 56 ]

This page intentionally left blank.
4
4
N e i g h b o r h o o d R e v i t a l i z a t i o n P l a n f o r D a l l a s - D R A F T [ 57 ]
ST
RA
TE
GIC
GO
AL
S

S T R A T E G I C G O A L S
The IssueDallas has 44% owner-occupied households and 56% rental households. The homeownership rate in Dallas is the lowest among its peer cities of Atlanta, Phoenix, Houston, Austin and San Antonio, and far below the national average of 65%. Although this has been a long-standing trend, the City should ensure the homeownership rate does not decline any further. This element of the City’s housing market does have positive aspects, however, as Dallas has become a primary landing point for people new to the region and those people with job mobility. Dallas should take pride in its success attracting the Millennial rental market compared to the region. The challenge will be to retain these young renters when they decide to buy homes by providing ownership opportunities in Dallas neighborhoods that fit their lifestyles and preferences.
To boost homeownership, the City must build high-quality neighborhoods with connectivity to urban amenities that can’t be found in more suburban parts of the region. Dallas needs to encourage more urban home styles and to provide incentives for private home investment in neighborhoods. The City and its many partners own land in neighborhoods that could be an excellent opportunity for providing the types of urban style home ownership options that are increasingly in demand. The City can also be much more effective in partnering with other agencies to provide combinations of incentives and amenities to attract private home investment.
Expand Homeownership
D R A F T - N E I G H B O R H O O D P L U S[ 58 ]
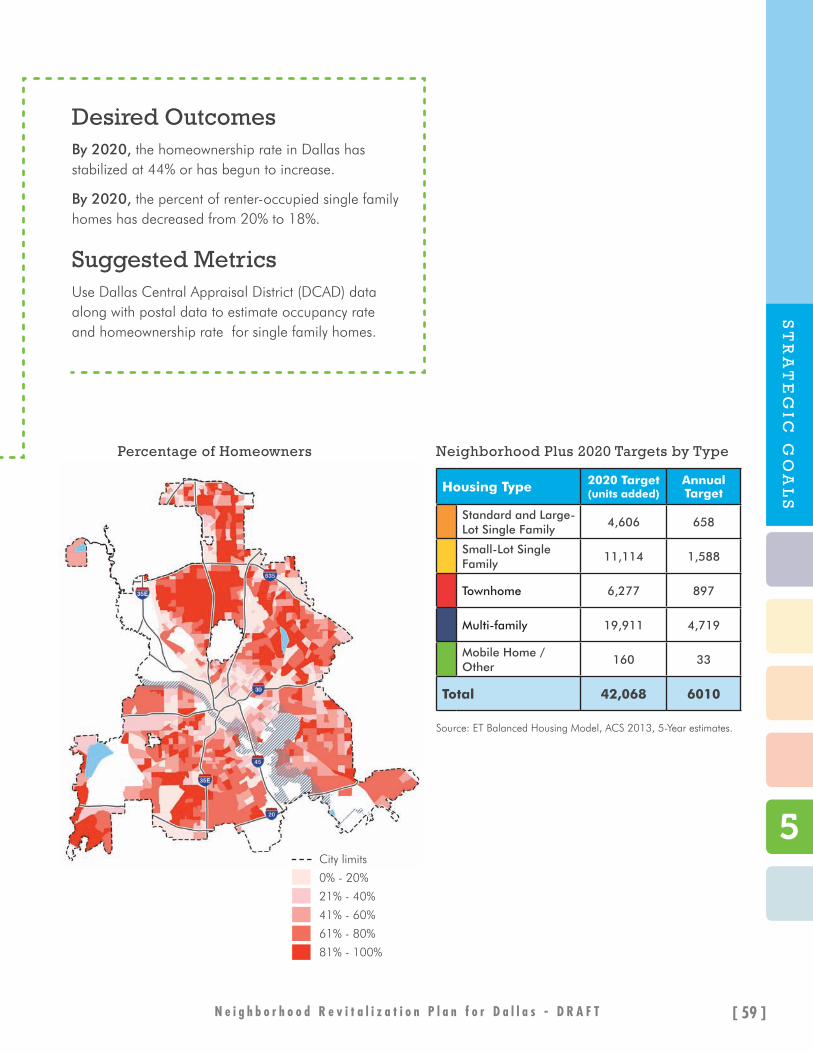
5City limits
0% - 20%
21% - 40%
41% - 60%
61% - 80%
81% - 100%
Percentage of Homeowners
Housing Type 2020 Target(units added)
Annual Target
Standard and Large-Lot Single Family
4,606 658
Small-Lot Single Family
11,114 1,588
Townhome 6,277 897
Multi-family 19,911 4,719
Mobile Home / Other
160 33
Total 42,068 6010
Neighborhood Plus 2020 Targets by Type
Source: ET Balanced Housing Model, ACS 2013, 5-Year estimates.
Desired OutcomesBy 2020, the homeownership rate in Dallas has stabilized at 44% or has begun to increase.
By 2020, the percent of renter-occupied single family homes has decreased from 20% to 18%.
Suggested MetricsUse Dallas Central Appraisal District (DCAD) data along with postal data to estimate occupancy rate and homeownership rate for single family homes.
N e i g h b o r h o o d R e v i t a l i z a t i o n P l a n f o r D a l l a s - D R A F T [ 59 ]
ST
RA
TE
GIC
GO
AL
S

S T R A T E G I C G O A L S
5.1 Encourage a wider range of well designed and affordable housing types as a response to emerging homeownership preferences.
5.1.1 Audit the development process to identify and eliminate processing, permitting, platting or other barriers that make infill housing and emerging types of housing products for homeownership more difficult, uncertain or costly. ST
5.1.2 Hold an architectural design contest to develop new prototypes to expand infill and small-lot housing design options, with an emphasis on affordability. Coordinate with Actions 5.1.1 and 5.1.3. ST
5.1.3 Conduct rezonings in target areas to remove barriers to more diverse and affordable single family homeownership options including small-lot single family, duplexes, townhomes, cottage homes, and courtyard homes. Coordinate with Actions 5.1.1 and 5.1.2. MT
Policies Actions
Strategies in ActionBest Practices for Expanding Homeownership
Demo/Rebuild Program
Richardson Program Development encourages the redevelopment of existing single familydetached residential properties with the construction of new, higher value, single familydetached residential structures.
Downpayment Plus Program in Wisconsin
Provides down payment and closing cost assistance to low- and moderate-income households receiving financing through a Federal Home Loan Bank Member. A secondary program assists with financing through a nonprofit like Habitat for Humanity.
ST = SHORT TERM (1 YEAR) MT = MEDIUM TERM (2 - 3 YEARS)
LT = LONG TERM (3 - 5 YEARS)
D R A F T - N E I G H B O R H O O D P L U S[ 60 ]

5.2 Encourage infill development and existing home improvements in target neighborhoods to attract and retain homeowners.
5.2.1 Pilot a Master Development Program in target areas for single family infill development to address infrastructure and other development impediments that are difficult to address on individual lots. Coordinate with Action 1.3.1 and 5.2.2. ST
5.2.2 Partner with Dallas Homebuilders Association and others to pilot an Affordable Street of Dreams program to develop well designed affordable infill housing options in target neighborhoods, using city-owned or land bank lots. Coordinate with Action 1.3.1, 1.3.2, 5.1.2, and 5.2.1. ST
5.2.3 Pilot a home improvement incentive program for target neighborhoods to provide a financial incentive to residents who make improvements to their homes. Coordinate with Action 1.3.1. Potential models: City of Richardson, City of Plano, City of Farmers Branch. MT
5.2.4 Develop public-private partnerships to explore alternative funding sources for low interest home improvement loans or grants to existing low to moderate income homeowners, particularly seniors, to help them maintain their homes. Coordinate with Action 5.2.5. MT
5.2.5 Create a tax abatement program for existing low-income homeowners who want to stay in target areas that are appreciating in value. Coordinate with Action 5.2.4. LT
Policies Actions
5
5
Strategies in ActionBest Practices for Home Improvement Programs
Home Restoration Programs in Irving, TX
Assistance is provided to homeowners for home restoration through partially forgivable loans. The loans assist with repairs such as window or roof replacement, adding insulation in the attic, plumbing and electrical work.
Housing Rehabilitation Program in Plano, TX
The City of Plano offers two opportunities to assist with housing repairs to eligible, income qualified Plano families who own and occupy their homes:
• Emergency assistance for conditions that pose a serious and immediate threat to the health or welfare.
• Limited essential repairs to revitalize the neighborhood, stop further deterioration of the home and improve energy efficiency. These repairs are offered in the form of partially forgivable loans at competitive terms and rates.
ST = SHORT TERM (1 YEAR) MT = MEDIUM TERM (2 - 3 YEARS)
LT = LONG TERM (3 - 5 YEARS)
N e i g h b o r h o o d R e v i t a l i z a t i o n P l a n f o r D a l l a s - D R A F T [ 61 ]
ST
RA
TE
GIC
GO
AL
S

S T R A T E G I C G O A L S
5.4 Expand home ownership programs to reach a broader range of potential homebuyers.
5.4.1 Expand the City of Dallas Mortgage Assistance Program to include middle income homebuyers with household incomes up to 140% of AMI. Coordinate with Action 1.1.2, 1.3.1 and with the bond program. MT
5.4.2 Create a match savings program and expand existing programs to promote down payment savings for homeownership. Coordinate with Action 1.1.2. MT
5.4.3 Work with lending partners to explore creating new mortgage products that benefit potential homebuyers with household incomes from 81% to 140% of AMI and credit scores above 640. Coordinate with Action 1.1.2. MT
5.4.4 Work with lending partners to establish a funding source/reserve to reduce the down payment gap for first-time homebuyers of low to moderate income. Coordinate with Action 1.1.2. MT
5.4.5 Develop public-private partnerships to explore financing for lease to buy programs. MT
5.4.6 Develop public-private partnerships to explore a land trust to increase affordable homeownership options available to potential home buyers with household incomes up 140% of AMI. MT
5.3 Increase the number of eligible mortgage loan applicants.
5.3.1 Create and maintain a database of nonprofit partners providing homebuyer education training programs for low to moderate income households and first-time homebuyers. Coordinate with Actions 1.1.2 and 1.2.3. ST
5.3.2 Partner with other agencies to host regular homebuyer education training events at City Hall and other locations for low to moderate income, first-time, and middle-income homebuyers. Coordinate with Action 1.2.3. ST
Policies ActionsST = SHORT TERM (1 YEAR)
MT = MEDIUM TERM (2 - 3 YEARS) LT = LONG TERM (3 - 5 YEARS)
D R A F T - N E I G H B O R H O O D P L U S[ 62 ]

5
This page intentionally left blank.
5
N e i g h b o r h o o d R e v i t a l i z a t i o n P l a n f o r D a l l a s - D R A F T [ 63 ]
ST
RA
TE
GIC
GO
AL
S

S T R A T E G I C G O A L S
The IssueIt is important to understand that renting, rather than owning, is a personal decision that may reflect age and income, but also a desire for mobility, flexibility, shared amenities, and convenience. Dallas has always had a higher rental rate than the region as a whole and this trend has been consistent for 25 years. For this reason, Dallas must build and maintain quality rental housing options in a variety of housing products.
Todoay, concentrations of older rental housing (apartments, condominiums and single family homes) in sub-standard condition are a persistent problem in Dallas that deplete neighborhood vitality. Dallas needs to uphold a higher standard for housing conditions in all rental housing.
Quality rental housing can be a positive driver of reinvestment and can anchor mixed-use and retail development, as already evident in downtown and
other urban neighborhoods. Dallas’ extensive light rail system can serve as a great catalyst for reinvestment that offers attractive rental housing options to a range of income groups while also providing excellent access to jobs and urban amenities.
Households of all incomes are choosing to rent in the City, and quality rental housing affordable to a variety of income levels can be harmoniously blended into most new neighborhoods. The goal should be to encourage mixed-income neighborhoods across the City, with housing options to fit a variety of incomes. Development projects in attractive areas seeking incentives or increased entitlements from the City must play a significant role in providing a component of affordable housing in these areas.
Enhance Rental Housing Options
D R A F T - N E I G H B O R H O O D P L U S[ 64 ]

City limits
0% - 20%
21% - 40%
41% - 50%
51% - 70%
71% - 100%
6
Desired OutcomesBy 2017, the City of Dallas has established a fee-based rental property registration, inspection and enforcement system.
By 2020, all residential and mixed-use projects located outside areas of concentrated poverty and receiving incentives or increases in entitlements from the City of Dallas must provide a complement of affordable housing.
Suggested MetricsPercent of rental housing that is substandard.
Number of affordable rental housing units that are located outside areas of concentrated poverty.
.
6Source: Census Bureau ACS 2009-2013
N e i g h b o r h o o d R e v i t a l i z a t i o n P l a n f o r D a l l a s - D R A F T [ 65 ]
ST
RA
TE
GIC
GO
AL
S
Renters Paying Over 30% of Income on Housing Costs
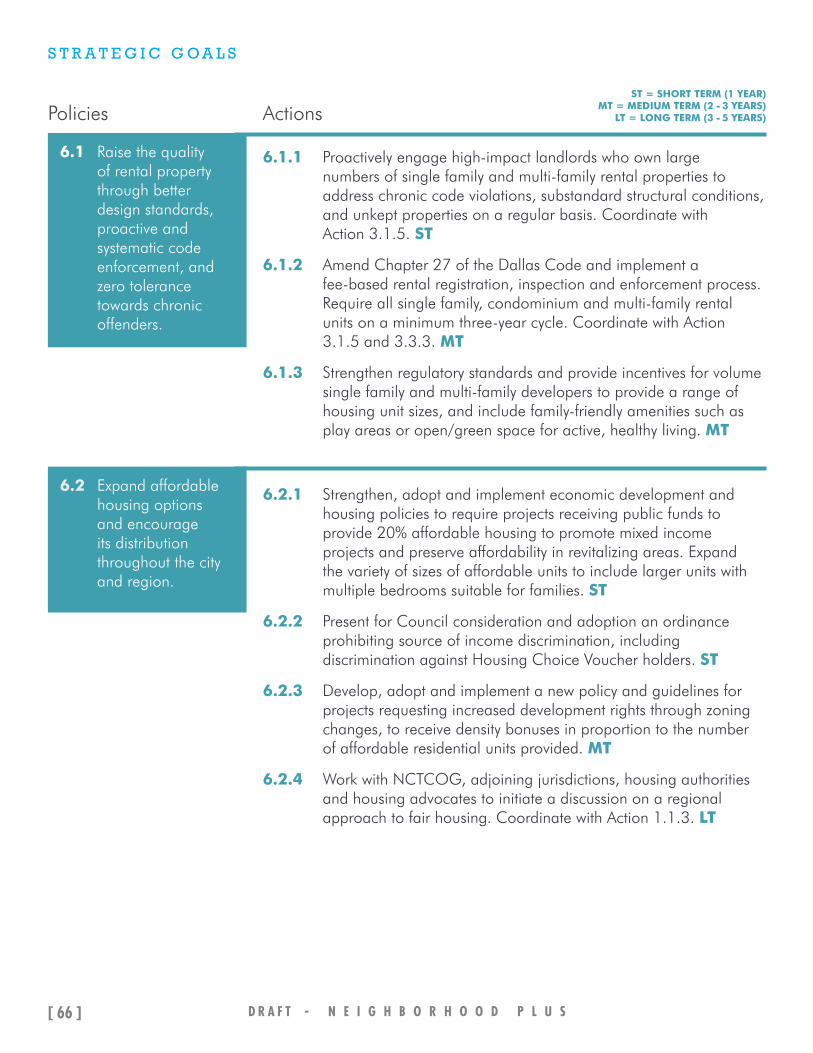
S T R A T E G I C G O A L S
6.1 Raise the quality of rental property through better design standards, proactive and systematic code enforcement, and zero tolerance towards chronic offenders.
6.1.1 Proactively engage high-impact landlords who own large numbers of single family and multi-family rental properties to address chronic code violations, substandard structural conditions, and unkept properties on a regular basis. Coordinate with Action 3.1.5. ST
6.1.2 Amend Chapter 27 of the Dallas Code and implement a fee-based rental registration, inspection and enforcement process. Require all single family, condominium and multi-family rental units on a minimum three-year cycle. Coordinate with Action 3.1.5 and 3.3.3. MT
6.1.3 Strengthen regulatory standards and provide incentives for volume single family and multi-family developers to provide a range of housing unit sizes, and include family-friendly amenities such as play areas or open/green space for active, healthy living. MT
6.2 Expand affordable housing options and encourage its distribution throughout the city and region.
6.2.1 Strengthen, adopt and implement economic development and housing policies to require projects receiving public funds to provide 20% affordable housing to promote mixed income projects and preserve affordability in revitalizing areas. Expand the variety of sizes of affordable units to include larger units with multiple bedrooms suitable for families. ST
6.2.2 Present for Council consideration and adoption an ordinance prohibiting source of income discrimination, including discrimination against Housing Choice Voucher holders. ST
6.2.3 Develop, adopt and implement a new policy and guidelines for projects requesting increased development rights through zoning changes, to receive density bonuses in proportion to the number of affordable residential units provided. MT
6.2.4 Work with NCTCOG, adjoining jurisdictions, housing authorities and housing advocates to initiate a discussion on a regional approach to fair housing. Coordinate with Action 1.1.3. LT
Policies ActionsST = SHORT TERM (1 YEAR)
MT = MEDIUM TERM (2 - 3 YEARS) LT = LONG TERM (3 - 5 YEARS)
D R A F T - N E I G H B O R H O O D P L U S[ 66 ]

6.3 Align planning, funding and community investments within a quarter mile of DART stations to promote transit-oriented development.
6.3.1 Work with DHA and DART and other agencies to pilot a mixed income TOD project on publicly-owned land to expand housing options near transit and facilitate accessibility to jobs and other services. MT
6.3.2 Prioritize infrastructure improvements such as sidewalks, streetscapes, and bike facilities to support walking, biking and better connectivity to transit. Coordinate with Actions 1.2.1, 1.2.2, 1.2.3, 1.3.1, and with the bond program. MT
Policies Actions
6
6
ST = SHORT TERM (1 YEAR) MT = MEDIUM TERM (2 - 3 YEARS)
LT = LONG TERM (3 - 5 YEARS)
N e i g h b o r h o o d R e v i t a l i z a t i o n P l a n f o r D a l l a s - D R A F T [ 67 ]
ST
RA
TE
GIC
GO
AL
S

image credit: Jeff Rolinc

CONCLUSION
C O N C L U S I O N
Preparing all of Dallas’ Children for the Future
Within the past few years, the correlation between a child’s neighborhood and the probability of that child achieving the American Dream when she reaches adulthood has been the subject of in-depth study by the nation’s finest universities. Big data is being used to understand the likelihood for a child who is born into poverty to obtain an adequate education and to secure the skills necessary to change the course of her life. The conclusions drawn from these studies reveal that the neighborhood environment a child grows up in has substantial influence on that child’s ability to escape the destructive effects of crime and violence, drug use and alcoholism, teen pregnancy, chronic childhood diseases, and educational opportunities inadequate to build a healthy, productive life.
The Neighborhood Plus Plan undertakes an in-depth study of our city’s neighborhoods. The Dallas-Fort Worth metro economy is the 4th largest metro economy in the nation and the 12th largest in the world. Today, Dallas powers that economic engine and enjoys unprecedented prosperity. The Neighborhood Plus Plan studies these factors and raises these questions: Will Dallas be able to sustain this leadership position in the fiercely competitive, knowledge-based economy of the 21st century? And are we preparing our youth to participate in this global-economic competition?
The trends and analyses undertaken in this study reveal that Dallas possesses the strengths and attributes that position the City to remain the economic, artistic, and cultural heart of the Metroplex. However data also reveals the structural weaknesses in this same robust economy that have led to the abandonment of vast areas of our City and have locked many of our residents out of opportunity and into the pernicious cycle of poverty.
Impoverished neighborhoods are economically unsustainable for everyone, including those who
prosper now. The Neighborhood Plus Plan explores opportunities and proposes solutions designed to change the physical, economic, and social trajectories that have stubbornly persisted for decades in the City of Dallas. The Neighborhood Plus Plan envisions a community that provides all residents and all areas of the City a chance to share in Dallas’ prosperity.
Urban Inflection through Collective ImpactDallas’ prosperity is most pronounced through the innumerable philanthropic foundations and nonprofit agencies working to bring equity and improved quality of life to Dallas residents. The Neighborhood Plus Plan recognizes these extensive commitments and acknowledges that City government, acting alone, cannot bring about the transformative change necessary to rid our impoverished neighborhoods of blight and poverty, to tip our struggling neighborhoods back into appreciating land values, or to entice the region’s middle income residents to make Dallas their home.
To accomplish these goals, the City must harness the combined efforts of the numerous stakeholders already engaged in bettering Dallas communities. The Neighborhood Plus Plan works to capture the dozens of effective programs and practices proposed by our partners and integrates these into a coordinated, strategic framework of pragmatic policies and tested actions that will achieve steady progress toward measured goals. These actions are also aligned to leverage complementary work and targeted investments to maximize benefits and ensure shared success. Collaboration between government agencies, academic institutions, philanthropic foundations, nonprofit organizations and private business is critical to the success of the Neighborhood Plus Plan. Working together we can ensure the economic leadership position of our City and reverse the trend that allows a zip code to determine the destiny of our children.
D R A F T - N E I G H B O R H O O D P L U S[ 70 ]
N e i g h b o r h o o d R e v i t a l i z a t i o n P l a n f o r D a l l a s - D R A F T [ 71 ]
CO
NC
LU
SIO
N