Draft National Waste Baseline Report - Department of...
87
NATIONAL WASTE INFORMATION BASELINE REPORT DRAFT 2 MAY 2012
Transcript of Draft National Waste Baseline Report - Department of...

NATIONAL WASTE INFORMATION BASELINE
REPORT
DRAFT 2
MAY 2012

i
Published by:
Department of Environmental Affairs
Private Bag X447
Pretoria
0001
Republic of South Africa
Copyright Reserved
No part of this publication may be reproduced in any manner without the full
acknowledgement of the source.
This report should be cited as:
Department of Environmental Affairs (2012). National Waste Information Baseline Report.
Department of Environmental Affairs, Pretoria, South Africa.
DEA Project Team
Mr Obed Baloyi (Project Leader)
Mr Donald Sehaswana
Mr Musa Maringa
Mr Jeremia Sibande
CSIR Project Team: Dr Suzan Oelofse
Ms Manja Schubert
Ms Hulde Swanepoel
Ms Linda Godfrey
Dr Lulama Wakaba
Dr Aubrey Muswema
COWI Project Team
Simon Graasbøll
Erik Nørby
ii
DISCLAMER:
The statements made and conclusions drawn in this report are based on the available documented
data and research findings. No primary data collection was done,. The project team can therefore
not be held accountable for the accuracy of the data on which the conclusions are based.

iii
Executive Summary
To be added when the report is finalised

iv
Abbreviations (List to be updated) DEA Department of Environmental Affairs
DEAT Department of Environmental Affairs and Tourism (now DEA)
DEADP Department of Environmental Affairs and Development Planning, Western Cape
GDACE Gauteng Department of Agriculture, Conservation and Environment
GDP Gross Domestic Product
IDP Integrated Development Plan
IWMP Integrated Waste Management Plan
LDEDET Department of Economic Development, Environment and Tourism, Limpopo Province
NWMSI National Waste Management Strategy Implementation
SAWIS South African Waste Information System
SAWIC South African Waste Information Centre (www.sawic.org.za)

v
Contents
Executive Summary ................................................................................................................. iii
Abbreviations (List to be updated) ........................................................................................... iv
1. Introduction ........................................................................................................................ 1
1.1 How to read the baseline ............................................................................................. 1
1.2 Background ................................................................................................................. 1
1.3 Method ........................................................................................................................ 3
1.4 Accuracy...................................................................................................................... 3
1.3.1. SAWIS ................................................................................................................. 3
1.3.2. Municipal Waste .................................................................................................. 4
1.3.2. Hazardous waste .................................................................................................. 5
2. National Waste Information ............................................................................................... 6
3 References .......................................................................................................................... 9

vi
List of Appendices
Appendix A: Stakeholder list ................................................................................................... 10
Appendix B: Competition Commission Resolution .................................................................. 1
Appendix C: Method.................................................................................................................. 5
1. Literature review ................................................................................................................ 6
1.1 Integrated Waste Management Plans .......................................................................... 7
1.2 Waste composition .................................................................................................... 10
1.3 General population and household statistics ............................................................. 12
1.4 General economic data .............................................................................................. 13
1.5 Hazardous waste management plans ......................................................................... 13
1.6 Hazardous waste generation by sector ...................................................................... 14
1.7 Provincial distribution of industries .......................................................................... 14
1.8 Literature findings pertaining to specific waste streams ........................................... 16
GW 01 - Municipal waste ........................................................................................... 16
GW 10 – Commercial and Industrial waste ..................................................................... 17
GW 20 – Organic waste ................................................................................................... 17
GW 30 – Construction and demolition waste .................................................................. 18
GW 50 – Paper ................................................................................................................. 18
GW 51 - Plastic ................................................................................................................ 19
GW 52 – Glass ................................................................................................................. 19
GW 53 – Metals ............................................................................................................... 19
GW 54 - Tyres ................................................................................................................. 20
GW 99 - Other ................................................................................................................. 20
HW 01 - Gaseous waste ................................................................................................... 20
HW 02 – Mercury containing waste ................................................................................ 20
HW 03 – Batteries ............................................................................................................ 21
HW 04 – POP waste ........................................................................................................ 21
HW 05 – Inorganic waste ................................................................................................ 21
HW 06 – Asbestos containing waste ............................................................................... 21
HW 07 – Waste oils ......................................................................................................... 22
HW 08 – Organic halogenated and/or sulphur containing solvents ................................ 22
HW 09 – Organic halogenated and/or sulphur containing waste .................................... 22
HW 10 – Organic solvents without halogens and sulphur ............................................... 22
HW 11 – Other organic waste without halogens or sulphur ............................................ 23
HW 12 – Tarry and Bituminous waste ............................................................................ 23
HW 13 and GW 13 - Brines ............................................................................................. 23

vii
HW 14, HW 15 GW 14 and GW 15 - Ash ...................................................................... 25
HW 16 - Slag ................................................................................................................... 27
HW17 and GW 17 – Mineral waste ................................................................................. 29
HW 18 and GW 18 – Waste of Electric and Electronic Equipment (WEEE) ................. 30
HW 19 - Health Care Risk Waste .................................................................................... 31
HW 20 – Sewage Sludge ................................................................................................. 33
1.9. Literature Reviewed .................................................................................................. 36
Annual Reports ................................................................................................................ 36
Audit reports .................................................................................................................... 37
Scientific papers ............................................................................................................... 37
National Government Reports ......................................................................................... 38
Datasets ............................................................................................................................ 40
Integrated Development Plans ......................................................................................... 41
Integrated Waste Management Plans – Metro’s and Local Municipalities ..................... 42
District Municipality and Provincial Waste Management Plans ..................................... 45
Industry reports and plans (not annual reports) ............................................................... 46
Water Research Commission Reports ............................................................................. 46
State of the Environment Reports .................................................................................... 48
Other reports .................................................................................................................... 49
2 GAP Identification ........................................................................................................... 53
3 Questionnaires and Interviews ......................................................................................... 54
4 Modeling .......................................................................................................................... 55
5 Stakeholder involvement ................................................................................................. 58
Appendix D: Modeling ............................................................................................................ 59
1. Database structure and modeling principles .................................................................... 60
2. User Guide ....................................................................................................................... 61
Schedule 1 ................................................................................................................................ 62

1
1. Introduction
1.1 How to read the baseline
In order to facilitate easy access to the Waste Information Baseline, the report is structured to
be short, focusing on the current waste information baseline as estimated for 2011.
Background and supporting information is provided in Appendices.
The waste information baseline reported here are best estimates aimed at answering the
question: “How much waste is generated, stored, treated, re-used, recycled, recovered and
disposed of in South Africa?” Although the available data does not support an answer at a
very high level of accuracy, the overall accuracy of the data that was used in the predictions
are deemed to be sufficiently high for the purposes of decision making at national level. The
estimates reported here are based on modeling results which were informed by background
research and interpretations of available data from various sources as indicated in Appendix
C.
In this report, Section 1 provides a short introduction outlining the background to the project
and providing a summary of the methods that was used to get to the information baseline.
Since no primary data was collected to establish this baseline, some comments are made on
the accuracy of the available data on which these estimates are based.
The results of the modeled data are presented in Section 2. The data is divided into relevant
groups and the conclusions are presented. Only aggregated data is provided to protect the
identity of the sources. The results presented here are representative of the waste tonnage
estimated for one year, namely 2011.
The references listed in Section 3 refer to literature referenced in Sections 1 and 2. A
complete list of all data sources consulted for this baseline is included in Appendix C.
1.2 Background
Implementation of the National Environmental Management: Waste Act, 2008, (Act No 59 of
2008) (hereinafter referred to as the Act) requires an accurate baseline of waste information
as evidence on which to base policy decisions. The Act states that the Minister must
establish a national waste management strategy and may amongst others:
• Declare priority waste streams;
• Prescribe measures for the management of identified waste streams;
• Set targets for recycling of certain waste streams;
• Set targets for the minimization of certain waste streams; and
• Ban certain waste streams from landfill.
The National Waste Management Strategy was approved by Cabinet in 2011and sets targets
to promote waste minimization, reuse, recycling and recovery of waste. The implementation

2
of the strategy must be monitored and the strategy must be reviewed at least every five years.
It is therefore imperative that the status quo of waste information in the country be recorded
as accurately as possible and be made available to decision-makers in government and
industry.
It is the intention of the South African Waste Information System (SAWIS), operated by the
Department of Environmental Affairs (DEA) to provide such a national baseline of the
tonnages of waste recycled, treated, landfilled and exported. However, until SAWIS moves
from voluntary reporting to enforced reporting under planned regulations, the system is
unable to provide annual reports on the state of waste. As such, this project aims to model
the baseline of waste generation, recycling, treatment and landfilling in South Africa, while
making use of existing waste data stored in provincial and national waste information
systems, and in public and private reports.
The DEA has recently gazetted draft waste classification regulations for public comment
(RSA, 2011). One of the aims of a national waste classification system is to standardize the
reporting of waste data. Until recently, waste data has been captured differently, by different
role players, which makes compiling data for a national waste baseline challenging. For
example, ‘Construction & demolition waste’ adopted in the draft waste classification system,
has also been referred to in other systems and reported as ‘builders’ rubble’, ‘builders waste’.
Draft waste information regulations were also gazetted for public comment (RSA, 2010).
The purpose of the waste information regulations is to regulate the reporting on waste
information for the protection of the environment and the management of waste. This gazette
includes general and hazardous waste categories (Levels 1, 2 and 3). The data presented in
this baseline is presented according to these categories. Comparing the results of this
baseline with previous baselines may therefore also be tricky.
The accuracy of general waste generation data is also often very low (Godfrey, 2008) and
largely based on estimates; general waste generation is often estimated based on population
statistics and economic activity within the municipality while industrial waste generation is
largely estimated based on production figures. Where accurate information is available from
industrial waste generators, the data is often considered to be sensitive. Waste data compared
to production figures provides a good indication of process efficiencies within an industry.
Similarly, in the case of commercial waste facilities, waste treatment and disposal data is
considered as sensitive data since it provides a clear indication of the market share treated or
disposed of at a specific facility. Hence, disclosure of hazardous waste data (generation,
treatment and disposal figures) is subject to a resolution by the Competition Commission.
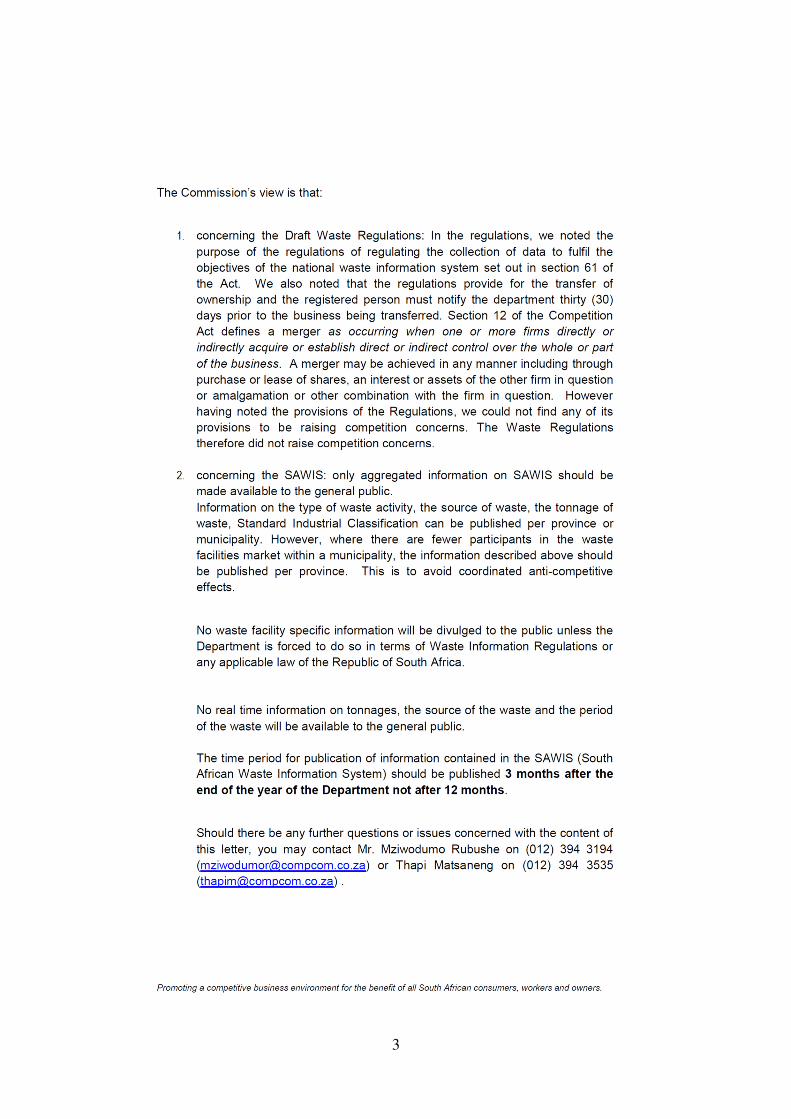
The Department of Environmental Affairs obtained a resolution on the confidentiality of
information contained in the South African Waste Information System as well as on
comments on the Waste Information Regulations (RSA, 2010). The Competition
Commission resolution is attached as Appendix B.
Every effort has been made to collect waste data at the highest possible level of accuracy.
However, it has not always been possible to do so for all waste streams, due to the issues
discussed above, as well as due to the fact that some waste data are not yet collected and
reported at the level of detail required for this study. It is anticipated that with the
implementation of the waste information regulations and waste classification system, more
accurate information will become available at the desired levels of detail in the foreseeable
future.

3
1.3 Method
In the absence of a single waste dataset for South Africa, establishing a national waste
baseline has been based on a strong scientific approach. In addition, ongoing consultation
and engagement with identified stakeholders has been crucial to ensuring that all potential
sources of waste data are identified and verified by peers in the waste sector.
A two-pronged approach was followed in developing a National Waste Information Baseline
for South Africa:
1. Collection, collation and interpretation of existing waste data
2. Numerical modeling of the national waste baseline
The existing data was collected from all relevant stakeholders in the South African waste
sector, including both public and private waste organisations by means of interviews and
extracting data from available reports and databases. A list of identified stakeholders is
included as Appendix A.
In addition to basic data collection, numerical modelling was undertaken in the following
instances:
• data simulation in the absence of accurate data;
• assessing the effectiveness of current reduce, reuse and recycling initiatives;
• determining the extent of energy recovery from waste;
• estimating trends in waste management over time;
• verifying the accuracy of available data.
Modeling of the waste generation via a well calibrated model that contains all readily
available waste data, as well as forecasted type and number of waste generators is considered
to be a reliable and cost-effective method to achieve the project objectives.
1.4 Accuracy
Since no primary data collection was undertaken in the preparation of this report, it is
important to make a few statements on the accuracy of the data collected from available
sources that was used in this estimate.
1.3.1. SAWIS
The Department of Environmental Affairs (DEA) developed and piloted the South African
Waste Information (SAWIS) between 2004 and 2006 as part of the National Waste
Management Strategy Implementation (NWMSI) project. The aim of SAWIS is to create a
single national repository of accurate and reliable tonnages of general and hazardous waste
recycled, treated and landfilled, as well as tonnages of waste exported out of South Africa
(DEAT, 2005). SAWIS has continued to be implemented by DEA on a voluntary basis since
the end of the project in 2006, pending the drafting and gazetting of national waste
information regulations. However, research suggests that the number of waste activities

4
reporting to SAWIS as at 2011, represents only a small fraction of operating waste facilities
in the country. For example, the number of landfills reporting data to SAWIS in 2011
represents an estimated 12-13% of currently operating landfills that would be required to
submit data as per the SAWIS framework (Godfrey et al, in press; DEAT, 2005).
Organisations reporting data to SAWIS include municipalities, industries and private waste
companies (DEA, 2005). Only 38 organisations reported data to the SAWIS in 2010 while
32 organisations reported data into the system for both 2009 and 2010 (Godfrey et al. in
press). There are over 2000 waste handling facilities in South Africa (DEAT, 2007) but only
46 waste activities reported data to the SAWIS in 2010 (29 Landfills; 9 treatment facilities
and 8 re-processors) (Godfrey et al. in press). The small fraction of operating waste facilities
reporting into the system renders the SAWIS data incomplete for the purposes of establishing
a national waste baseline. In addition, given the voluntary status of SAWIS, data within the
system has not yet been validated for accuracy. Reviewing the SAWIS data suggests that
there are inaccuracies within the system which will need to be corrected, such as order of
magnitude changes in waste tonnages from one month to the next, suggesting a data
capturing error in the placing of the decimal figure, or order of magnitude differences in data
for landfills of similar size, suggesting lack of consistency in units, i.e. tonnages versus
kilograms.
So while the data in SAWIS is useful to benchmark calculations made during this baseline
project, SAWIS cannot as yet provide a complete overview of waste data for South Africa.
In addition to SAWIS, the Western Cape and Gauteng provincial departments of environment
embarked on developing their own WIS. Although the two provincial WIS are not fully
operational, as with SAWIS, data from provincial systems has been used to verify
calculations made in this project.
However, it is acknowledged that reporting into the SAWIC is still voluntary and that
increased reporting is to be expected following the planned promulgation of Waste
Information Regulations.
1.3.2. Municipal Waste
Most municipal integrated waste management plans indicated reservations about the waste
data provided (DEADP, 2011) e.g. “not accurate”, “theoretical” or “assumed to be typical”.
Few waste characterization studies have been done in South Africa (Silbernagl, 2012), which
further complicates the issue of reporting waste streams at the required level of detail. A
study on the collection of waste information by municipalities (Godfrey, 2008) revealed that
in 2005, only 68.9% of municipalities were collecting some form of waste data. Sixty two
percent of those municipalities collecting data believed that they were collecting unreliable
data. It was further reported that only 74.6% of municipalities collecting waste data were
collecting data on landfills and 46.5% data on waste generators (not waste generation). Only
33.8% collected data on waste transportation, 14.1% on recyclers and 4.2% on waste
treatment (Godfrey, 2008). Since the municipalities collecting waste data often do so at
landfills, only waste disposed of at municipal landfills are accounted for. In addition, when
comparing service delivery data from the Community Survey, 2007 (StatsSA, 2007) with the
annual service delivery survey for the same year, the service backlog figures differs
significantly (National Treasury, 2011). It could therefore be expected that estimates of
waste that are not accounted for, is also a challenge.
5
It is thus clear that accurate municipal waste data, for the majority of municipalities in South
Africa, is not available.
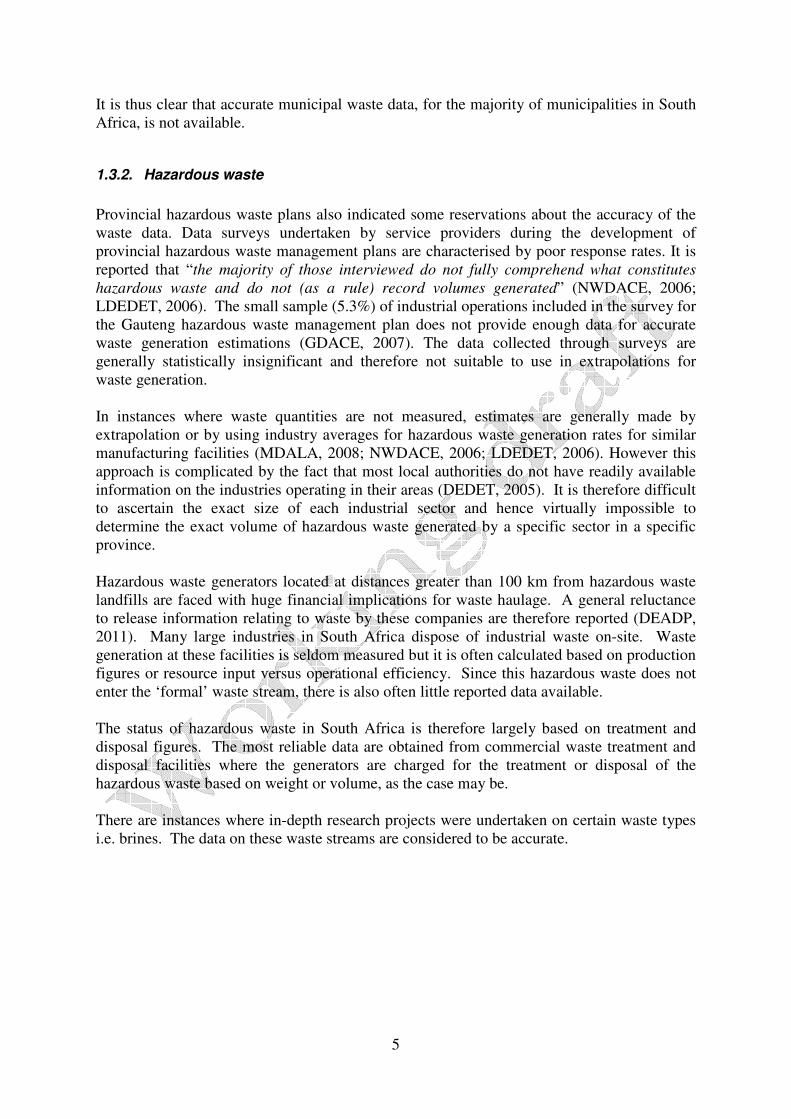
1.3.2. Hazardous waste
Provincial hazardous waste plans also indicated some reservations about the accuracy of the
waste data. Data surveys undertaken by service providers during the development of
provincial hazardous waste management plans are characterised by poor response rates. It is
reported that “the majority of those interviewed do not fully comprehend what constitutes
hazardous waste and do not (as a rule) record volumes generated” (NWDACE, 2006;
LDEDET, 2006). The small sample (5.3%) of industrial operations included in the survey for
the Gauteng hazardous waste management plan does not provide enough data for accurate
waste generation estimations (GDACE, 2007). The data collected through surveys are
generally statistically insignificant and therefore not suitable to use in extrapolations for
waste generation.
In instances where waste quantities are not measured, estimates are generally made by
extrapolation or by using industry averages for hazardous waste generation rates for similar
manufacturing facilities (MDALA, 2008; NWDACE, 2006; LDEDET, 2006). However this
approach is complicated by the fact that most local authorities do not have readily available
information on the industries operating in their areas (DEDET, 2005). It is therefore difficult
to ascertain the exact size of each industrial sector and hence virtually impossible to
determine the exact volume of hazardous waste generated by a specific sector in a specific
province.
Hazardous waste generators located at distances greater than 100 km from hazardous waste
landfills are faced with huge financial implications for waste haulage. A general reluctance
to release information relating to waste by these companies are therefore reported (DEADP,
2011). Many large industries in South Africa dispose of industrial waste on-site. Waste
generation at these facilities is seldom measured but it is often calculated based on production
figures or resource input versus operational efficiency. Since this hazardous waste does not
enter the ‘formal’ waste stream, there is also often little reported data available.
The status of hazardous waste in South Africa is therefore largely based on treatment and
disposal figures. The most reliable data are obtained from commercial waste treatment and
disposal facilities where the generators are charged for the treatment or disposal of the
hazardous waste based on weight or volume, as the case may be.
There are instances where in-depth research projects were undertaken on certain waste types
i.e. brines. The data on these waste streams are considered to be accurate.

6
2. National Waste Information In this chapter we present the results of the data particularly and the project in general. We
divide the data into relevant groups and we present the conclusions.
We try to answer “how much waste is generated, stored, treated, reduced, re-used, recycled,
recovered and disposed of.”
Presentation of data grouped by:
- Regions – If we do not have amounts on regional level – amounts will be calculated
either by GNP or population data.
- Waste type
- Source
- Treatment
The data and information obtained is at varying levels of detail and not necessarily aligned
with the waste categories as outlined in Schedule 1. Deciding the baseline year is also
challenging as data on different waste streams is not always available for corresponding
years. For this reason, all data is captured and normalized to one baseline year (2010) from
which future projections will then be made.
The data presented in the table below is the initial calculation of national data for the hole of
South Africa. Data has been collected from various sources. However, at this point in time
the data has not yet been fully verified. Data must therefore be read carefully. Data is
expected to be verified by the project team but also by outside experts.
The table presents waste amounts divided on the waste types from schedule 1. The waste
amounts have been calculated from various sources and different years. Many amounts are
not from the baseline year 2010 or amounts only covers one province. Calculations from
province level to national level or from one year to baseline year has been based on either
population or economic data. These data are presented later in this report.
For instance:
Waste amount/population in waste generation year * population 2010
In most cases the waste amounts are based on "waste generated" but in some cases it has only
been possible to find data on what has actually been collected. This division in methodology
has been impossible to avoid because of the lack of data and differences in data collection
approach. However, the differences are highlighted and the reader will thus know what kind
of methodology has been used to the different amounts. (This still needs to be done)
Please refer to annex XX for more details on the specific waste types and amounts.

7
Note: The figures in the table are still being verified and updated with more accurate data.
(We still have issues with double counting that are being sorted out.)
General Waste 2011 Tonnes
GW01 Municipal waste 19 419 600
GW10 Commercial and industrial waste 1 870 700
GW13 Brine See HW
GW14 Fly ash and dust from miscellaneous filter sources See HW
GW15 Bottom ash See HW
GW16 Slag See HW
GW17 Mineral waste See HW
GW18 Waste of Electric and Electronic Equipment (WEEE) See HW
GW20 Organic waste 20 793 600
GW21 Sewage sludge See HW
GW30 Construction and demolition waste 748
960
GW50 Paper 1 675 130
GW51 Plastic 1 263 910
GW52 Glass 924
836
GW53 Metals 3 061 150
GW54 Tyres 237
143
GW99 Other
General Waste, total 49 995 029

8
Hazardous Waste 2011 Tonnes
HW01 Gaseous waste
51
HW02 Mercury containing waste
868
HW03 Batteries
32
912
HW04 POP Waste
396
HW05 Inorganic waste
279
580
HW06 Asbestos containing waste
32
056
HW07 Waste Oils
275
400
HW08 Organic halogenated and /or sulphur containing solvents
108
HW09 Organic halogenated and/or sulphur containing waste
8
043
HW10 Organic solvents without halogens and sulphur
745
HW11 Other organic waste without halogen or sulphur
194
683
HW12 Tarry and Bituminous waste
255
832
HW13 Brine
4 005
850
HW14 Fly ash and dust from miscellaneous filter sources
31 420
500
HW15 Bottom ash
5 717
320
HW16 Slag
5 267
630
HW17 Mineral waste
369
000
HW18 Waste of Electric and Electronic Equipment (WEEE)
61
856
HW19 Health Care Risk Waste
43
673
HW20 Sewage sludge
648
820
HW99 Miscellaneous
326
954
HW500 Export of hazardous waste
25
523
HW600 Import of hazardous waste
67
183
Hazardous Waste, total
49 034
983
Note: The figures in the table are still being verified and updated with more accurate data.
(We still have issues with double counting that are being sorted out.)

9
3 References
DEDET (Department of Economic Development, Environment and Tourism, Polokwane)
(2005) Development of a hazardous waste management plan for Limpopo Province:
Status Quo Analysis of Hazardous waste management in Limpopo Province (Draft Final
Report V1.1.) DEDET, Polokwane.
DEADP (Department of Environmental Affairs and Development Planning, Western Cape)
(2011). Status Quo Report: Integrated Waste Management Plan for the Western Cape
Province. DEADP, Cape Town.
DEAT (Department of Environmental Affairs and Tourism) (2005). National Waste
Management Strategy Implementation, South Africa. Waste Information System
Framework Document, Final Report. DEAT: Pretoria.
DEAT (Department of Environmental Affairs and Tourism) (2007) Assessment of the status
of waste serviced delivery and capacity at the local government level. Department of
Environmental Affairs and Tourism. Pretoria, South Africa.
Gauteng Department of Agriculture, Conservation and Environment (GDACE) (2007) First
Generation Waste Management Plan for Gauteng (GHWMP) – G/DACE 07/2006.
Situation Analysis and Baseline Assessment Report. 3 December 2007.
Godfrey, L (2008). Facilitating the improved management of waste in South Africa through
a national waste information system. Waste Management 28: 1660-1671.
Godfrey, L., Scott, D., Difford, M. and Trois, C. (in press). Part 1: The role of waste data in
building knowledge: The South African waste information system. Waste Management.
LDEDET (Department of Economic Development, Environment and Tourism, Limpopo
Province) (2006). Hazardous waste management in Limpopo Province. Draft Final
Report. LDEDET, Polokwane.
NWDACE (Department of Agriculture, Conservation and Environment, North West
Province) (2006). Development of a hazardous waste management plan for North West
Province: Status Quo Analysis Report. NWDACE, Mmabatho.
RSA (Republic of South Africa). (2010). National Waste Information Regulations in terms if
the National Environmental Management: Waste Act, 2008 (Act No 59 of 2008).
Government Gazette No 33384 Government Notice 718 of 23 July 2010. Government
Printers: Pretoria.
RSA (Republic of South Africa). (2011). National Environmental Management: Waste Act
(59/2008): Draft waste classification and management regulations. Government Gazette
No. 34417, Vol. 553. Government Printers: Pretoria.
Statistics South Africa (StatsSA) (2007) Community Survey 2007: Municipal data on
household services. Report No 03-01-22(2007). Statistics South Africa. Pretoria, South
Africa.

10
Appendix A: Stakeholder list

1
Name ORGANISATION PHONE FAX E-MAIL
Chamane, Musa GroundWork 033 342 5662 033 342 5665 [email protected]
Dold, Di Wildlife & Environment Society of SA (WESSA) 031 201 3126 031 201 9525 [email protected]
Law, Stephen Environmental Monitoring Group (EMG) 021 448 2881 021 448 2922 [email protected]
Mokhine, Mabule Earthlife Africa (JHB) 011 720 3773 011 720 3532 [email protected]
Mohammed, Leila Sustainable Energy Africa (SEA) 021 702 3622 021 702 3625 [email protected]
Farred, Glenn SANGOCO 011 403 7746 011 403 8703 [email protected] [email protected]
Mazibuko, Brian (Rev) SANGOCO 011 403 7746 083 617 3100
Lakhani, Muna Institute for Zero Waste in Africa (IZWA) 083 471 7276 [email protected] / [email protected]
Oosthuizen, Ann Institute of Waste Management SA (IWMSA) 011 675 3462 011 675 3465 [email protected]
Meyer, D Clay Brick Association (CBA) 011 805 4206 011 315 3966 [email protected] / [email protected]
Barnardo, Danie Council for Geoscience 012 841 1072 012 841 1076
George, Xolile South African Local Government Association (SALGA) 012 369 8000 012 369 8005 086 642 4468
Kfir, Rivka Water Research Commission (WRC) 012 330 0340 012 331 2565 [email protected] / [email protected]
Lesufi, Niks Chamber of Mines 011 498 7661 [email protected]
Hunt, John Paper Manufacturers Association of SA (PAMSA) 011 803 5063 011 803 6708 [email protected]
Dieterich, Peter SA Iron & Steel Institute (SAISI) 012 320 2450 012 320 2456 [email protected]
The Southern African Institute of Mining and Metallurgy (SAIMM)
011 834 1273/7 011 838 5923 011 833 8156
Lotter, Laurraine Business Unity SA (BUSA) / Chemical & Allied Industries Association (CAIA)
011 726 8310 [email protected]
Rama, Dhiraj Association of Cementitious Materials Producers (ACMP)
011 315 0300 082 559 9958
011 315 0584 [email protected]
Van Der Merwe, Aj Ferro Alloy Producers Association (FAPA) 011 833 6033 011 838 1522 [email protected] / [email protected]
Brink, Danie SA Institute of Civil Engineers (SAICE) / Jones & Wagner
011 519 0200 011 519 0201 [email protected] / [email protected]
Anderson, Liz Responsible Container Management Assoc. of SA (RCMSA)
082 453 5020 032 942 8328 [email protected]
Smith, Alan Association of Veterinary and Crop Associations of South Africa (AVCASA)
082 414 5218 012 253 2904 [email protected]
Macdonald, Chris Technical Association of Pulp & Paper Industry of SA 032 437 2179 032 551 1622 [email protected]

2
Name ORGANISATION PHONE FAX E-MAIL
(TPPSA)
Hughes, David Plastics Federation of South Africa (Plasfed) 011 653 4787 086 612 4366 [email protected]
Mr B Addison / Ms T Botha Non-ferrous Metal Industries Association of SA (NFMI) 011 833 6033 011 838 1522 [email protected]
Van Dongen , Ellen African Explosives Limited 011 606 2846 011 606 3598 [email protected]
Botes-Schoeman, Nerine African Rainbow Minerals 011 779 1235 [email protected]
Botha, Paul Afrisam 011 767 7230 082 904 5560
Human, Charl Anglo Gold [email protected]
Haripursad, Nishi Anglo Platinum [email protected]
Malan, Jacobus Anglo Platinum [email protected]
Spanig, Siegfried Arcelor Mittal 083 300 7903 016 889 4051 [email protected]
Schoeman, Joe Assmang Chrome 082 373 4875 013 256 5139 [email protected]
Mahlaule, Ernest Bazisa Technical Waste Solutions 011 315 6971 011 805 7570 [email protected]
Howard, Mike BKS 012 421 3500 012 421 3501 [email protected]
Makwela, Matome Chamber of Mines [email protected]
Loreti, Oscar Chemserve [email protected]
Scurr, Peter Columbus Stainless 013 247 2357 013 247 3377 [email protected]
Jones, Ka Common Sense Technologies 012 998 0791 012 998 0791 [email protected]
Hillowitz, Les Croplife 083 305 2700 011 646 8682 [email protected]
Marler, Mike DBSA 011 313 3250 [email protected]
Saphira Patel DBSA 011 313 3083 [email protected]
Wiechers, Herman DNW 011 886 5709 011 787 6853 [email protected]
Bowles, Barry ECO 2 (Lafarge – NPC-Cimpor) 086 655 7507 011 257 3106 [email protected]
Baldwin, Dave ECC 011 792 1052 011 791 4222 [email protected]
Grobbelaar, Leon Enviro-Fill (Pty) Ltd 011 396 4601 011 396 1003 [email protected]
Brink, Neil Enviroserv 011 456 5607 011 388 3603 [email protected]
Gombault, Esmé Enviroserv 011 456 5422 011 453 9048 [email protected]
Jewaskiewitz, Stan Envitech Solutions 082 808 0586 [email protected]
Dittke, S EnviroSense 021 706-9829 086 647 1475 [email protected]
Haycock, Alison FFS Refiners (Pty) Ltd 031 465 3103 031 465 1430 [email protected]
Scotcher, John ForestLore Consulting 083 626 8990 033 330 7255 [email protected]
Ball, Jarrod Golder Associates Africa 082 880 1058 011 315 0317 [email protected]
Bredenhann, Leon Golder Associates Africa 012 366 0100 012 366 0111 [email protected]
Hefer, Ben Hernic Ferrochrome [email protected]
Graham, Fran Impala Platinum [email protected]
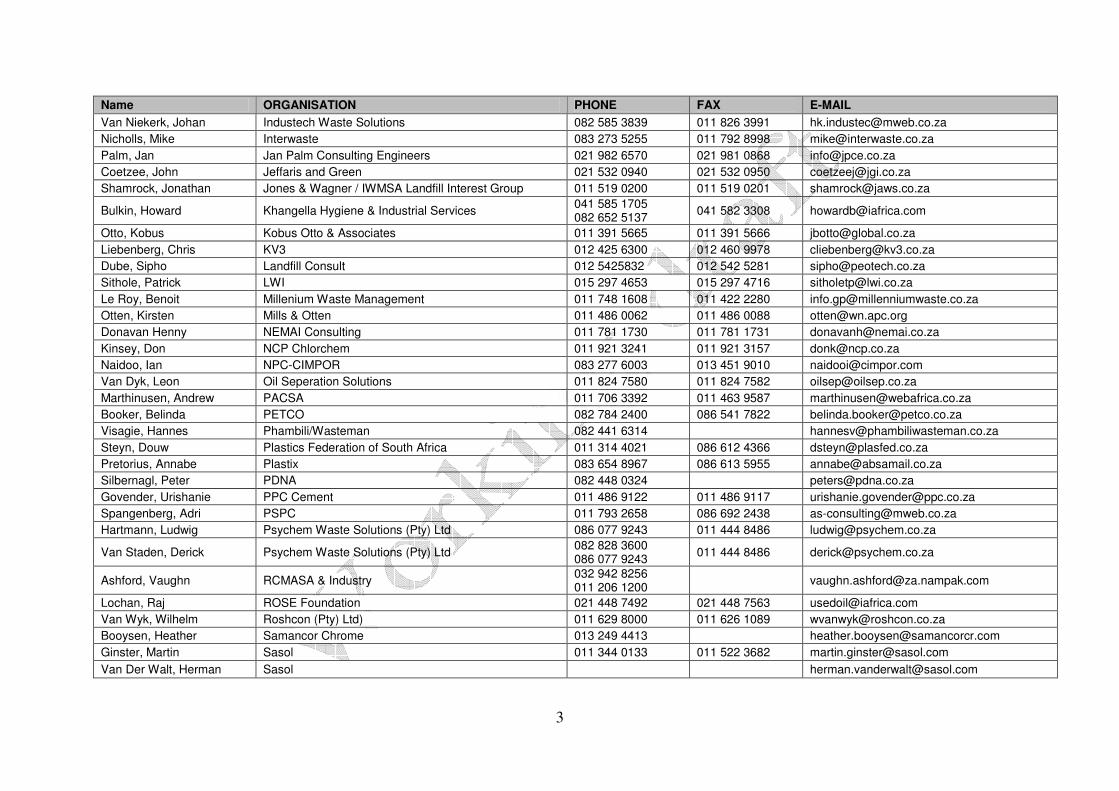
3
Name ORGANISATION PHONE FAX E-MAIL
Van Niekerk, Johan Industech Waste Solutions 082 585 3839 011 826 3991 [email protected]
Nicholls, Mike Interwaste 083 273 5255 011 792 8998 [email protected]
Palm, Jan Jan Palm Consulting Engineers 021 982 6570 021 981 0868 [email protected]
Coetzee, John Jeffaris and Green 021 532 0940 021 532 0950 [email protected]
Shamrock, Jonathan Jones & Wagner / IWMSA Landfill Interest Group 011 519 0200 011 519 0201 [email protected]
Bulkin, Howard Khangella Hygiene & Industrial Services 041 585 1705 082 652 5137
041 582 3308 [email protected]
Otto, Kobus Kobus Otto & Associates 011 391 5665 011 391 5666 [email protected]
Liebenberg, Chris KV3 012 425 6300 012 460 9978 [email protected]
Dube, Sipho Landfill Consult 012 5425832 012 542 5281 [email protected]
Sithole, Patrick LWI 015 297 4653 015 297 4716 [email protected]
Le Roy, Benoit Millenium Waste Management 011 748 1608 011 422 2280 [email protected]
Otten, Kirsten Mills & Otten 011 486 0062 011 486 0088 [email protected]
Donavan Henny NEMAI Consulting 011 781 1730 011 781 1731 [email protected]
Kinsey, Don NCP Chlorchem 011 921 3241 011 921 3157 [email protected]
Naidoo, Ian NPC-CIMPOR 083 277 6003 013 451 9010 [email protected]
Van Dyk, Leon Oil Seperation Solutions 011 824 7580 011 824 7582 [email protected]
Marthinusen, Andrew PACSA 011 706 3392 011 463 9587 [email protected]
Booker, Belinda PETCO 082 784 2400 086 541 7822 [email protected]
Visagie, Hannes Phambili/Wasteman 082 441 6314 [email protected]
Steyn, Douw Plastics Federation of South Africa 011 314 4021 086 612 4366 [email protected]
Pretorius, Annabe Plastix 083 654 8967 086 613 5955 [email protected]
Silbernagl, Peter PDNA 082 448 0324 [email protected]
Govender, Urishanie PPC Cement 011 486 9122 011 486 9117 [email protected]
Spangenberg, Adri PSPC 011 793 2658 086 692 2438 [email protected]
Hartmann, Ludwig Psychem Waste Solutions (Pty) Ltd 086 077 9243 011 444 8486 [email protected]
Van Staden, Derick Psychem Waste Solutions (Pty) Ltd 082 828 3600 086 077 9243
011 444 8486 [email protected]
Ashford, Vaughn RCMASA & Industry 032 942 8256 011 206 1200
Lochan, Raj ROSE Foundation 021 448 7492 021 448 7563 [email protected]
Van Wyk, Wilhelm Roshcon (Pty) Ltd) 011 629 8000 011 626 1089 [email protected]
Booysen, Heather Samancor Chrome 013 249 4413 [email protected]
Ginster, Martin Sasol 011 344 0133 011 522 3682 [email protected]
Van Der Walt, Herman Sasol [email protected]

4
Name ORGANISATION PHONE FAX E-MAIL
Griffith, Des SATRP 083 287 6919 011 791 1310 [email protected]
Human, Etienne SATRP Co 011 791 1449 086 503 9880 [email protected]
Waldeck, Rudolf South Africa Zero Waste 013 656 0599 013 656 0599 [email protected]
Wigston, Bruce Sentrachem 011 575 0681 011 576 0681 [email protected]
Nieuwoudt, Daleen SEF 012 349 1307 012 349 1229 [email protected]
Leach, Steve SiVest 011 798 0600 011 803 7272 [email protected]
De Bruyn, Izak SKC 012 362 1424 012 362 1420 [email protected]
Adams, Edgar Solid Waste Technologies 021 556 9167 021 556 9168 [email protected]
Boshoff, Johann SRK 011 441 1111 011 880 8086 [email protected].
Van Niekerk, Dirk The Waste Group (Pty) Ltd 012 562 0330 012 562 0335 [email protected]
Eleftheriades, Christos Thermopower 011 316 1800 011 316 4999 [email protected]
Rittner, Gunter Thermoselect 011 802 8980 011 802 8391 [email protected]
Gruber, Joe Tiger Chemical Treatment / Rechem Industries (Pty) Ltd 011 828 5652 011 828 4741 [email protected]
De Wet, Dirk Veolia Environmental Services 011 310 0500 011 310 0510 [email protected]
Abbott, Kathryn Veolia Environmental Services 011 922 5900 086 617 9831 [email protected]
Smal, Henry Waste Giant 011 493 2441 011 499 1407 [email protected]
Davies, Debbie Wasteman Group 011 681 7800 011 681 7820/1 [email protected]
Lourens, Bertie WastePlan 086 111 6699 [email protected]
Naiker, Lillian Waste Rite 043 726 4860 043 726 1048 [email protected]
Hurter, Tommie Xstrata Alloys [email protected]

1
Appendix B: Competition Commission Resolution

2
3
4

5
Appendix C: Method
6
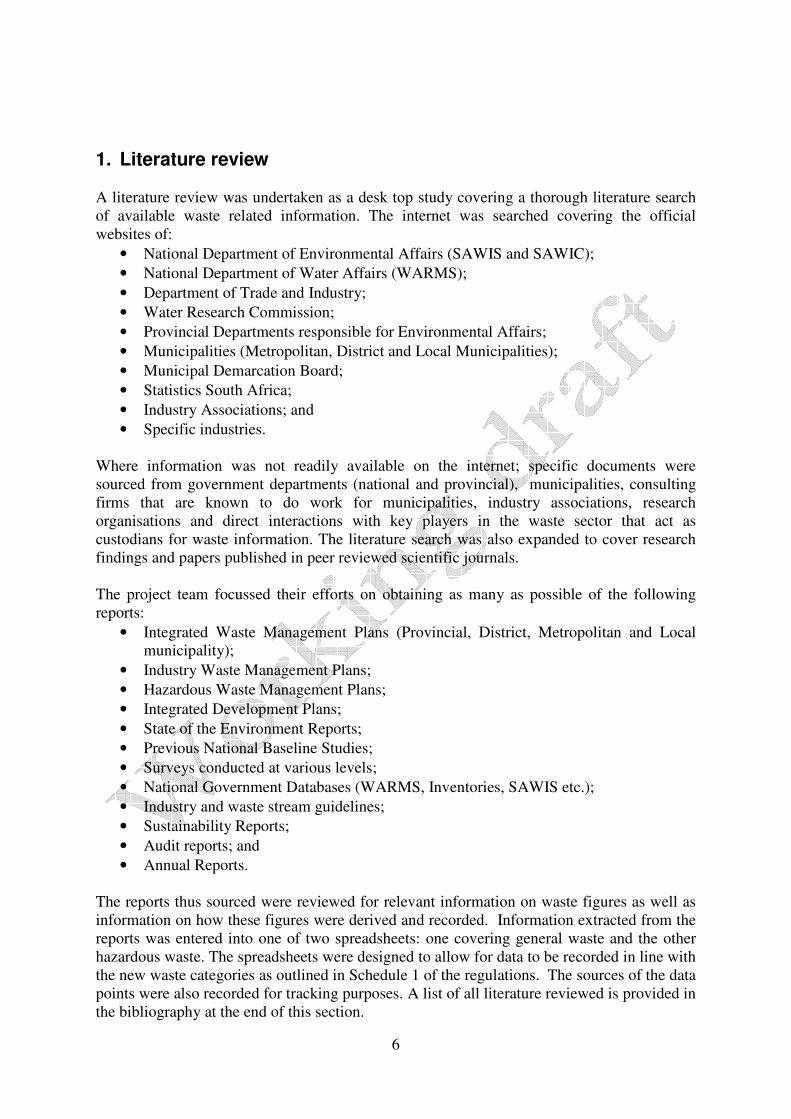
1. Literature review
A literature review was undertaken as a desk top study covering a thorough literature search
of available waste related information. The internet was searched covering the official
websites of:
• National Department of Environmental Affairs (SAWIS and SAWIC);
• National Department of Water Affairs (WARMS);
• Department of Trade and Industry;
• Water Research Commission;
• Provincial Departments responsible for Environmental Affairs;
• Municipalities (Metropolitan, District and Local Municipalities);
• Municipal Demarcation Board;
• Statistics South Africa;
• Industry Associations; and
• Specific industries.
Where information was not readily available on the internet; specific documents were
sourced from government departments (national and provincial), municipalities, consulting
firms that are known to do work for municipalities, industry associations, research
organisations and direct interactions with key players in the waste sector that act as
custodians for waste information. The literature search was also expanded to cover research
findings and papers published in peer reviewed scientific journals.
The project team focussed their efforts on obtaining as many as possible of the following
reports:
• Integrated Waste Management Plans (Provincial, District, Metropolitan and Local
municipality);
• Industry Waste Management Plans;
• Hazardous Waste Management Plans;
• Integrated Development Plans;
• State of the Environment Reports;
• Previous National Baseline Studies;
• Surveys conducted at various levels;
• National Government Databases (WARMS, Inventories, SAWIS etc.);
• Industry and waste stream guidelines;
• Sustainability Reports;
• Audit reports; and
• Annual Reports.
The reports thus sourced were reviewed for relevant information on waste figures as well as
information on how these figures were derived and recorded. Information extracted from the
reports was entered into one of two spreadsheets: one covering general waste and the other
hazardous waste. The spreadsheets were designed to allow for data to be recorded in line with
the new waste categories as outlined in Schedule 1 of the regulations. The sources of the data
points were also recorded for tracking purposes. A list of all literature reviewed is provided in
the bibliography at the end of this section.

7
1.1 Integrated Waste Management Plans
The concept of integrated waste management plans was first introduced in South Africa as
part of the National Waste Management Strategy Implementation project in 2000. The
purpose of integrated waste management planning (IWMP) is to improve the quality of life of
all South Africans, through maximised efficiency of waste management services, provided at
least cost with minimum environmental impacts (DEAT 2000). Such integrated planning will
provide local government with “resource allocation, time scheduling and allocation of
responsibilities” (DEAT 2000:1). To achieve this, IWMPs must include all aspects of waste
management from generation through to disposal, covering waste prevention, generation,
collection, transportation, treatment and final disposal (Godfrey and Dambuza 2006). The
Department of Environmental Affairs therefore developed a guideline in support of the
compilation of IWMPs (DEAT, 2000).
Some municipalities voluntarily developed IWMPs before it became a legal requirement with
the promulgation of the Waste Act. In terms of section 11 of the Waste Act, 2008 (Act 59 of
2008), all municipalities are compelled to develop IWMPs which must be approved by the
MEC. The approved IWMP must be included in the Integrated Development Plan (IDP) of
the municipality as contemplated in the Municipal Systems Act, 2000 (Act 32 of 2000).
The percentage of municipalities for which the project team could source IWMPs (or Status
Quo Reports) are summarised in Table 1. These include all IWMPs (and Status Quo Reports)
developed since 2000. The IWMPs reviewed by municipal category is summarised in Table
2.
Table 1: Percentage of Municipalities for which at least 1st generation IWMPs could be
sourced as part of the project
Province
Local Municipalities District Municipalities Metropolitan Municipalities
IWMP Total % of
municipalities IWMP Total
% of municipalities
IWMP Total % of
municipalities
Eastern Cape
8 38 21.1 2 6 33.3 1 1 100.0
Free State 5 20 25.0 0 5 0.0 - - -
Gauteng 2 9 22.2 2 3 66.7 3 3 100.0
KwaZulu-Natal
19 50 38.0 6 10 60.0 1 1 100.0
Limpopo 16 26 61.5 4 6 66.7 - - -
Mpumalanga
7 17 41.2 1 3 33.3 - - -
North West
4 21 19.0 0 4 0.0 - - -
Northern Cape
18 26 69.2 4 5 80.0 - -
Western Cape
24 24 100.0 5 5 100.0 1 1 100.0
Total 103 231 44.6 24 47 51.1 6 6 100.0

8
Table 2: Summary of IWMPs reviewed by municipal category
Number of
Municipalities
1st
Generatio
n Plans
% 1st
Generatio
n Plans
2nd
Generatio
n Plans
% 2nd
Generatio
n Plans
3rd
Generatio
n Plans
% 3rd
Generation Plans
Provincial 9 7 77.8 1 11.1 0 0.0
Metropolitan municipalitie
s 6 6 100.0 2 33.3 0 0.0
B1 – Local municipalitie
s 21 12 57.1 2 9.5 0 0.0
B2 – Local municipalitie
s 29 17 58.6 0 0.0 0 0.0
B3 – Local municipalitie
s 111 49 44.1 1 0.9 0 0.0
B4 – Local municipalitie
s 70 25 35.7 1 1.4 0 0.0
District municipalitie
s 47 24 51.1 1 2.1 1 2.1
Figure 1: Geographic distribution of reviewed District Municipality IWMPs.
The majority of the District Municipality IWMPs that were reviewed (Figure 1) were drafted
before 2009 and therefore before the National Environmental Management: Waste Act, 59 of
2008 came into effect.

9
The majority of local municipality IWMPs that were reviewed (Figure 2) were also drafted
before 2009. Where available, the data from the status quo reports were used to inform this
study. Generally aggregated data is presented in IWMPs whereas Status Quo reports contain
more detailed waste data.
Figure 2: Geographical distribution of reviewed Local Municipality IWMPs
Some important observations were made while reviewing these reports. It was found that
where the same professional service provider compiled plans for different municipalities, the
level of detail in the reports were comparable. However, the authenticity of these plans and
their applicability to local conditions in each local municipality is questionable as many of
the reports appears to be identical in many respects with only the waste figures adapted to the
local conditions. This observation raised questions on the involvement of the local
stakeholders in the development of the plan as well as the level of ownership taken for these
plans. This in turn raised concerns over the implementation of these plans. Although an audit
of the implementation of the plans is beyond the scope of this project, it may be something
that government should consider.
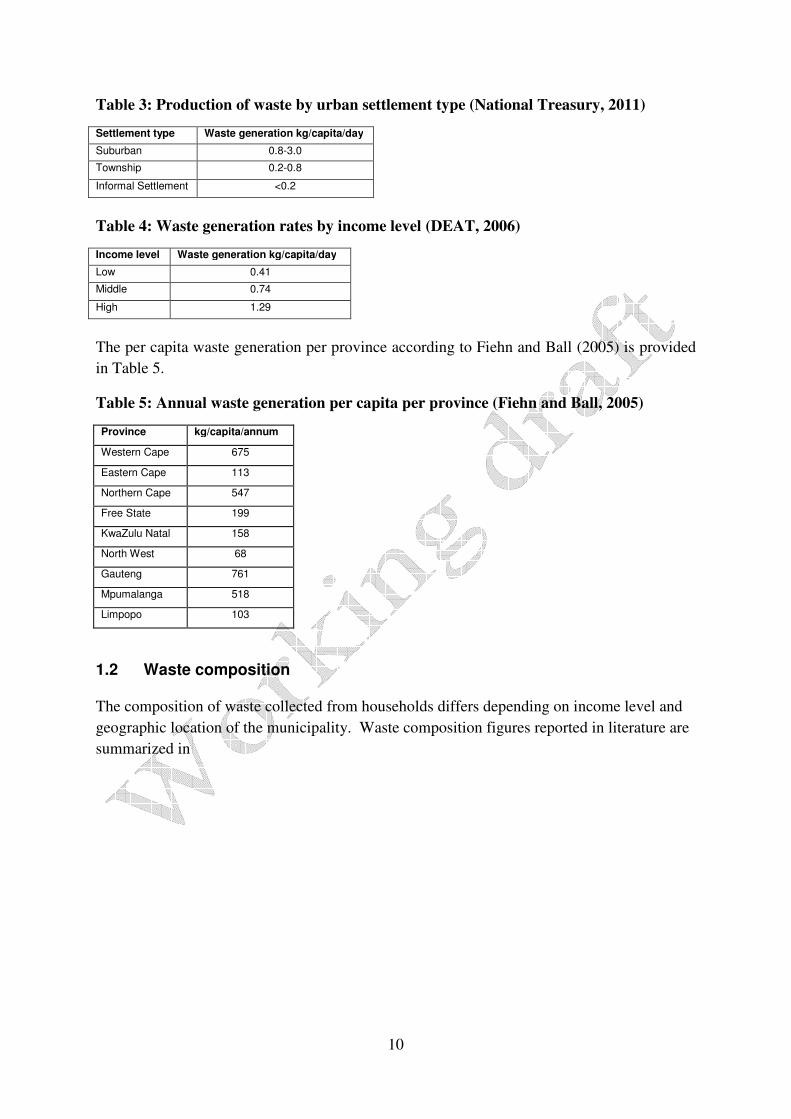
Household waste generation statistics vary considerably by settlement type as illustrated in
Table 3 and by income level as indicated in Table 4. A comparison of the waste generated by
urban residents in different settlement types demonstrates the point that wealthier consumers
are predominantly located in low density suburbs (National Treasury, 2011).
10
Table 3: Production of waste by urban settlement type (National Treasury, 2011)
Settlement type Waste generation kg/capita/day
Suburban 0.8-3.0
Township 0.2-0.8
Informal Settlement <0.2
Table 4: Waste generation rates by income level (DEAT, 2006)
Income level Waste generation kg/capita/day
Low 0.41
Middle 0.74
High 1.29
The per capita waste generation per province according to Fiehn and Ball (2005) is provided
in Table 5.
Table 5: Annual waste generation per capita per province (Fiehn and Ball, 2005)
Province kg/capita/annum
Western Cape 675
Eastern Cape 113
Northern Cape 547
Free State 199
KwaZulu Natal 158
North West 68
Gauteng 761
Mpumalanga 518
Limpopo 103
1.2 Waste composition
The composition of waste collected from households differs depending on income level and
geographic location of the municipality. Waste composition figures reported in literature are
summarized in

11
Table 6. Waste generations rates per income group also differ and consequently also the
composition of the waste as is indicated in Table 7.

12
Table 6: Household waste composition in South Africa as reported in literature (Data
must be updated)
Cape Town (Gibb,
2008) Limpopo (Ogola et al 2008)
RAG guideline on How to start a recycling collection business
Waste type % of waste stream collected by municipality
Average % waste generated per week
% of waste household waste
Garden waste 17.4 6 29
Plastic 17.2 18 14
Paper 12.8 20
Food waste 12.5 34 37 Cardboard 9
Glass 6.6 11 3
Textiles 5.7
Soil 4.2
e-Waste 4.2
Cans 3.6 11 4 Books 2
Other 4.8 13
Table 7: Waste composition (Percentage) by income group (data from other provinces
must be added if reported)
Limpopo (Ogola et al 2008)
Waste stream analysis of the general waste stream prepared for the City of Johannesburg and DANCED by Jarrod Ball and Associates, 2001
Waste type Low Middle High Low Middle High
Garden waste 15 5 2 3-15 23-41 20-30
Plastic 14 17 24 9-12 9-10 8-10
Paper & cardboard
14 19 25 12-13 15-18 16-26
Food waste 25 36 37 12-26 7-17 7-8
Glass 20 10 7 4-6 3-4 5-6
Cans 12 13 5 2-3 3 2-3
Other
1.3 General population and household statistics
General statistics on population and household numbers per province for the period 2002 to
2010 is summarized in Table 8 and Table 9 below. In some of the calculations population
data has been used to calculate from regional level to national level or from one year to the
baseline year.
Table 8: Number of individuals per province (StatsSA, 2010a)
Province Total population (thousand)
2002 2003 2004 2005 2006 2007 2008 2009 2010
Western Cape 4646 4755 4859 4964 5071 5162 5258 5369 5468
Eastern Cape 6521 6541 6558 6574 6587 6612 6633 6649 6656
Northern Cape 1088 1098 1106 1115 1123 1131 1140 1148 1154
Free State 2777 2795 2811 2826 2842 2863 2884 2905 2919
KwaZulu Natal 9683 9802 9915 10024 10134 10242 10348 10461 10551

13
North West 3227 3261 3294 3325 3357 3389 3421 3454 3479
Gauteng 9189 9387 9577 9766 9961 10142 10333 10556 10754
Mpumalanga 3391 3430 3464 3493 3519 3546 3576 3610 3639
Limpopo 5011 5048 5081 5111 5138 5171 5201 5230 5250
Total 45533 46117 46665 47198 47732 48258 48794 49382 49870
Table 9: Number of Households per province, GHS 2002-2010
Province Number of households (thousand)
2002 2003 2004 2005 2006 2007 2008 2009 2010
Western Cape 1 166 1 204 1 244 1 286 1 333 1 379 1 428 1 478 1 532
Eastern Cape 1 484 1 517 1 549 1 580 1 614 1 654 1696 1 738 1 781
Northern Cape 256 263 270 277 284 293 302 311 320
Free State 713 731 749 768 788 812 837 861 885
KwaZulu Natal 2 073 2 140 2 208 2 278 2 356 2 438 2 525 2 615 2 712
North West 791 811 831 852 876 901 928 954 982
Gauteng 2 683 2 785 2 891 3 005 3 132 3 258 3 392 3 531 3 684
Mpumalanga 768 795 821 848 877 909 943 978 1 015
Limpopo 1 081 1 115 1 148 1 181 1 216 1 258 1 302 1 346 1 394
Total 11 013 11 362 11 712 12 075 12 476 12 901 13 351 13 812 14
1.4 General economic data
General statistics on Gross Domestic Product numbers per province for the period 2000 to
2009 is summarized in Table 10 below. In some of the calculations GNP data has been used
to calculate from regional level to national level or from one year to the baseline year.
Table 10: Gross Domestic Product per province in South Africa
1.5 Hazardous waste management plans
Provincial integrated waste management plans generally contain some hazardous waste data
and a few provinces have hazardous waste management plans in place.
2000 2001 2002 2003 2004 2005 2006 2007 2008 2009
WC 130.983 144.586 165.265 183.462 209.603 229.150 256.935 293.243 324.381 336.234
EC 75.417 82.412 91.123 101.806 112.593 123.551 135.503 151.785 172.376 182.147
NC 21.443 23.510 25.793 28.168 30.776 34.049 39.455 45.498 52.526 54.917
FS 49.650 54.690 65.847 69.425 76.220 81.362 95.334 108.552 122.370 130.973
KZN 150.910 168.411 191.434 209.133 232.572 254.939 285.663 324.961 363.512 384.937
NW 59.898 67.533 77.110 80.082 87.933 100.628 114.069 130.072 149.948 156.374
GT 311.992 337.479 392.706 428.624 477.927 539.121 598.114 685.942 765.323 811.907
MP 62.900 73.089 83.162 87.432 94.980 104.168 122.069 138.842 161.610 169.973
LP 58.954 68.297 78.644 84.404 92.670 104.113 120.280 137.269 162.093 168.506
Total 922.147 1.020.008 1.171.085 1.272.537 1.415.273 1.571.082 1.767.422 2.016.165 2.274.139 2.395.967
Economic data 2000-2009 - Current prices - Rand million

14
The following reports were reviewed for hazardous waste:
• The need for and location of high hazardous waste sites for KwaZulu-Natal: Final
report (2000)
• Status Quo of Hazardous Waste Management in Limpopo Province (2005)
• First Generation Integrated Hazardous waste Management plan for Gauteng: Situation
analysis and baseline assessment report (2006)
• Hazardous waste management plan for the North West Province: Status Quo Analysis
report (2007)
• Development of a Hazardous waste management plan for Mpumalanga Province:
Status Quo Report (2008)
• Integrated Hazardous waste management plan for the Free State Province (2009)
• Integrated Waste Management Plan for the Western Cape Province: Status Quo
Report (2011)
1.6 Hazardous waste generation by sector
Hazardous waste generated per sector has been described for the 1998 national perspective on
waste. The mining sector generated the greatest proportion of waste which includes tailings
dams, slag dams, rock dumps and the like (Fiehn and Ball, 2005). The Waste Act, 2008 is
not applicable to residue deposits and reside stockpiles that are regulated under the Mineral
and Petroleum Resources Development Act, 2002 (RSA, 2008). Residue stockpile is defined
as ‘any debris, discard, tailings, slimes, screening, slurry, waste rock, foundry sand,
beneficiation plant waste, ash or any other product derived from or incidental to a mining
operation and which is stockpiled, stored or accumulated for potential re-use or which is
disposed of’ (RSA, 2002). Therefore, mining waste as was previously reported in waste
baseline studies is excluded from the scope of this project.
According to Heath et al. (2009), South African industries produce either organic or
inorganic waste. This categorisation may be useful when reporting waste data according to
the waste categories as listed in Schedule 1.
1.7 Provincial distribution of industries
It is useful to understand the geographic distribution of industries and industry sectors, when
compiling waste inventories for specific areas. The provincial distribution of industries in the
chemical sector is for instance, provided in

15
Table 11.

16
Table 11: Provincial distribution of the Chemical Sector by number of facilities in SA
(Department of Labour, 2008)
Province Gauteng KZN WC EC FS NW Limpopo Mpu NC Total
Rubber
conversion
70 22 18 12 2 6 2 5 2 139
Plastic
Conversion
389 156 138 42 17 6 4 6 0 758
Consumer
Chemicals
121 38 46 16 3 1 2 2 1 230
Pharmaceuticals 70 7 12 5 1 0 0 0 0 95
Bulk
formulated
14 7 6 1 12 5 1 4 1 51
Specialities 283 114 81 20 5 1 2 3 0 509
Fine Chemicals 2 1 1 0 1 0 0 0 0 5
Commodity
Inorganics
25 12 5 1 1 1 0 3 0 48
Primary
polymers &
Rubbers
0 3 1 0 4 0 0 1 0 9
Commodity
Organics
5 6 2 1 2 0 0 1 0 17
Liquid fuels 0 2 2 0 1 0 0 1 0 6
1.8 Literature findings pertaining to specific waste streams
A number of waste streams are listed under both general and hazardous waste in Schedule 1.
Since no primary data was collected it was not possible to split the general and hazardous
portions of the reported waste figures. Therefore, following a precautionary approach, all the
data on these waste streams are reported under the hazardous waste categories.
GW 01 - Municipal waste
Municipal waste generation data is primarily estimates based on modeling techniques.
Modeling is perhaps preferred as it is the quickest and cheapest way of generating data in the
absence of primary data collection. Unfortunately this approach is dependent on good quality
input data which, in most municipalities, are not available.
Disposal data for municipal waste is limited to landfill records which are mostly unreliable as
it is seldom based on accurate measurement techniques. There are a few reports of studies
where waste generation and disposal data was collected through direct measurements. A
comparison and alignment of modeled data to direct measured data is considered to lead to
accurate estimates.
The Western Cape Province is the only province where all local and district municipalities
have IWMPs in place (see Table 1). Therefore four different methods were used to calculate
waste generation figures for the province. The average tonnages for the Western Cape and all
district municipalities in the province were derived. A mean and standard deviation was
calculated to provide an indication of the confidence associated with these figures.

17
The quantification methods reported are:
1. Population figures, growth rates and per capita waste generation rates reported in or
derived from IWMPs were used to calculate waste generation figures for the baseline
year. The per capita waste generation rates were weighted according to the urban/rural
distribution where provided. An urban/rural ratio of 60/40 was applied where no
population ratios were available.
2. Waste figures from municipal IWMPs were used and projected to the base year based
on reported or calculated growth rates.
3. Differences between census populations for 2001 and 2007 were used to calculate a
growth rate to project the population data. These results were then multiplied by a
weighted per capita waste generation rate of 1.0 kg/p/d for urban and 0.11kg/p/d for
rural.
4. Current population and waste figures as supplied by the districts were used together
with calculated per capita waste generation rates.
GW 10 – Commercial and Industrial waste
Commercial and industrial waste is related to the type and scale of industries prevalent in a
specific region. The best sources of information on commercial waste are municipal service
providers and the relevant industry associations for industrial waste. It should however be
noted that not all industries are affiliated to industry associations. Therefore, data obtainable
from industry associations are limited to their membership.
Data on general commercial and industrial waste was obtained from the Chemical and Allied
Industries Association (CAIA), some IWMPs and national government reports.
It may be worth investigating whether commercial and industrial waste data can be related to
GDP, in a manner that is consistent with historical data. One example could be to use an
elasticity approach in the following manner:
Extrapolated waste = (initial waste)*(expected GDP)^(elasticity)
This type of approach would require historical waste and GDP data, in order to estimate the
elasticity (using regression). In addition, it would require a projection of future GDP values
(possibly from National Treasury) in order to obtain extrapolated waste data. Naturally, this
approach operates under the assumption that the elasticity remains unchanged over the period
of extrapolation. Otherwise stated, this method assumes that the overall mechanism which
produces the waste remains the same (i.e. there are no structural changes).
GW 20 – Organic waste
Data on general organic waste is found in IWMPs, landfill records and a national government
report looking at the potential of biomass waste as an alternative energy source (DME, 2004).
There are also two research papers on food waste estimates for South Africa.
Organic waste is generally reported as garden, green, putrescible and in some instances
notifiable waste. The waste classification (Schedule 1) refers to garden waste and food waste
at level 3of reporting.

18
Since food waste is not separated at household level, little if any data is available. Similarly,
food waste is not separated from general kitchen waste generated at restaurants and food
outlets. It is possible to estimate household food waste based on waste characterization
studies. However, reports on waste character1sation studies in South African municipalities
are scarce. It is possible to estimate waste at each stage of the food supply chain per
commodity group based on estimated percentages reported for sub-Saharan Africa. It was
therefore possible to calculate the food wastage at each stage of the food supply chain in SA
based on production figures for each corresponding commodity group.
GW 30 – Construction and demolition waste
Information on this waste stream is limited. Recycling data is calculated at 630 000
tonne/annum in 2007 (Dti, 2009).
Some IWMPs report builder’s rubble data, but this is the exception rather than the rule. It is
difficult to calculate waste generation data because it is such a complex waste stream.
GW 50 – Paper
Paper recycling data is reported at national level by the Paper and Packaging Industry
Association (PACSA) as well as the Paper Recycling Association of South Africa (PRASA).
Recycling rates are generally reported as a percentage of recoverable paper. Of the 38%
paper recycled in 2000, 24% was post consumer paper comprising 20% from the wholesalers
and retailers, 2% domestic and 2% offices. It was estimated that the potential for additional
recycling from wholesalers and retailers is 19% (362 tpa), for domestic sources 17% (317
tpa) and 10% (194 tpa) from offices (DEAT, 2000).
The Paper and Packaging Industry Waste Management Plan is considered to be the most
accurate source of data on waste tonnages. PRASA reports on the recovery rate of
recoverable paper (Figure 3).
Paper recovery rate as percentage of recoverable paper
2005-2008
0
10
20
30
40
50
60
70
1973 2005 2006 2007 2008
Year
Perc
en
tag
e r
eco
vere
d
Recoverable paper

19
Figure 3 Paper recovery rate as percentage of recoverable paper 2005-2008 (source:
Paper Recycling Association of South Africa)
According to a waste characterization study in the City of Cape Town (Gibb, 2008) paper
constitutes 12.8% and cardboard 9% of the municipal waste stream (Table 6). This
percentage varies between 12 and 26% per household depending on the income level (Table
7).
GW 51 - Plastic
As with paper, data on plastics mainly relates to recycling and sources of recyclables. The
PlasticsSA recycling surveys are considered to be the most comprehensive source of plastics
waste data in South Africa. The 2010 survey covering 2009 data included personal
interviews with 132 recyclers. Another 49 recyclers were interviewed telephonically.
A list of plastics recyclers is available on the SAWIC.
Data on plastics recycling is reported by polymer family and the source of the recyclables.
GW 52 – Glass
Data on glass largely relates to recycling. The data for individual cities and municipalities
are primarily estimates. However, the national data is reported by the Packaging Council of
South Africa and the Glass Recycling Company. Despite being 100% recyclable,
approximately 32% of all non-returnable glass containers produced annually was retrieved
for recycling in South Africa in 2010.
GW 53 – Metals
The most comprehensive data on metal waste is available from the Metal Recyclers
Association of South Africa. According to their records, South Africa produces 2 640 000
tonnes of steel scrap per annum and 420 000 tonnes of non-ferrous scrap per annum. The
members of this association is responsible for collection and processing of more than 80% of
all scrap metal in South Africa for beneficiation by downstream industries.
Collect-a Can reports on the recovery rate of used beverage cans. The used beverage can
recovery rate between 1994 and 2008 is illustrated in Figure 4.

20
Figure 4: Used beverage can recovery rate 1994-2008 (source: Collect-a-Can)
GW 54 - Tyres
Data on waste tyres are based on tyre sales in South Africa. The REDISA Industry waste
management plan estimated that 275 000 tonnes of tyres are sold per year. The SATRP
Industry waste management plan quotes a figure of 225 000 tonnes of waste tyres generated
every year. This figure is calculated based on a 18% reduction in weight between new and
waste tyres.
GW 99 - Other
No national data is available for this waste stream. Many IWMPs report “other” waste
streams covering Packaging materials, Forest biomass, Sawmill biomass, sugarcane biomass,
Abattoir waste, Hydraulic hoses and pipes, brake pads, printer cartridges, etc.
HW 01 - Gaseous waste
There is no data on gaseous waste available in the literature.
HW 02 – Mercury containing waste
All data pertaining to mercury waste that is available in the literature relates to the Guernica
Chemicals (Pty) Ltd Industrial site (previously Thor Chemicals). The Thor facility is a
historic, nonoperational site with a stockpile of mercury-containing waste. Operations at the
site ceased in 1998. Total amount of waste stored at this site: 2705 tonnes. Of this amount,
972 tonnes are stored in drums in warehouses. The remaining amount (1733 tonnes) is stored
in a leach pad.
Mercury containing lamps are covered under HW18.
Used beverage can recovery rate
1994-2008
0
10
20
30
40
50
60
70
80
1992 1994 1996 1998 2000 2002 2004 2006 2008 2010
Year
Perc
en
tag
e r
eco
very
Used beverage cans

21
HW 03 – Batteries
Data on lead acid batteries are limited to North West Province and Mpumalanga.
Calculations are based on the assumption that one battery weighs 15 kg.
Dry-cell battery manufacturers are:
• Uniross (Midrand): Alkaline AAA, AA, C, D and Type 1 9V;
• Eveready (PE); Zinc C (AA, AAA, C and D) batteries and import other types for
distribution, most importantly, the alkaline batteries, Lithium Ion (Li-ion) and small
numbers of the platinum batteries for special applications plus many types of
rechargeable batteries.
• Karbochem (Sasolburg) manufacture Li batteries; and
• A few smaller manufacturers and importers
According to Uniross Batteries, more than 50 million batteries are consumed in South
African every year of which 90% is ordinary batteries. The bulk of the ordinary batteries are
discarded into the general household waste. This equates to approximately 2500 tonnes of
hazardous battery waste being disposed into landfills every year.
HW 04 – POP waste
Data on this waste stream is limited. ESKOM reports PCB data produced at their plants in
the ESKOM Integrated Report while national data for 2008 is reported in a Disposal
Technology study. It is estimated that 70 000 tonnes of this waste stream is stockpiled in
South Africa, but no data is available on waste generation figures.
HW 05 – Inorganic waste
Data on some inorganic waste streams is reported in the Hazardous waste management plans
of Mpumalanga and North West province. There is no national figures repoted.
HW 06 – Asbestos containing waste
There is no comprehensive report on asbestos waste in South Africa. ESKOM reports
asbestos disposal figures on an annual basis but not waste generation figures. Data contained
in the Mpumalanga hazardous waste management plan is assumed to be largely based on the
ESKOM data since most of the ESKOM power stations are situated in Mpumalanga.
The audit report for Bulbul drive H:h landfill also reports disposal data.
It can be assumed that the biggest asbestos waste generators are:
• Department of Public Works
• Transnet
• Eskom
• Municipalities

22
Due to the asbestos regulation with its requirement to remove all asbestos by 2015, the
number contracts to remove asbestos from houses are increasing on a monthly basis. It is
therefore expected that asbestos waste from municipal sources will increase up to 2015.
HW 07 – Waste oils
Based on the US system, about 50% of oil becomes waste oil. In SA it is estimated at
between 40-45% - because of losses from old vehicles and oil leaks. This is not an exact
science. It is estimated that about 270 million litres of new oil enters the South African
market annually and about 120 million litres of used oil becomes collectable.
Waste oil is collected and treated by the ROSE foundation in South Africa
Approved Processors of waste oil in South Africa are:
• Oil Separation Solutions Sales & Services (Pty) Ltd, Germiston
• BME, Delmas
• PPC Lime Limited, Limeacres
• The Old Oil Man, Krugersdorp
• FFS Refiners (Pty) Ltd, Durban, Pietermaritzburg, Cape Town, Johannesburg
• Green Mamba Oil Refinery, Centurion
• Kudu Oils, Nelspruit
• Enfields Chemicals CC, Durban
• Gecco Fuels, Cape Town
HW 08 – Organic halogenated and/or sulphur containing solvents
No national data on this waste stream is available in literature. Landfill data from hazardous
waste landfills could provide data on this waste stream.
HW 09 – Organic halogenated and/or sulphur containing waste
No national data on this waste stream is available in literature. Landfill data from hazardous
waste landfills could provide data on this waste stream.
HW 10 – Organic solvents without halogens and sulphur
No national data on this waste stream is available in literature. Landfill data from hazardous
waste landfills could provide data on this waste stream.
The Hazardous Waste Management Plan for North West Province report 50 ton/annum of
inks, glue, solvents and water being flushed down drains or dumped at local general waste
sites.

23
HW 11 – Other organic waste without halogens or sulphur
No national data on this waste stream is available in literature. Landfill data from hazardous
waste landfills could provide data on this waste stream.
There is some data available for North West Province and the waste generated in the Eastern
Cape that is disposed of in the Western Cape.
HW 12 – Tarry and Bituminous waste
No national data on this waste stream is available in literature. Landfill data from hazardous
waste landfills could provide data on this waste stream.
In Gauteng, poisonous and toxic waste consists predominantly of coal tar and pitch which is
reported as 770.57 t/a.
HW 13 and GW 13 - Brines
A total of just over 530 000 kℓ/d of effluent is discharged to inland systems, containing
approximately 1 060 t/d of salt (Van der Merwe et al, 2009). Discharges of salt to the marine
environment were not considered although a considerable amount of brines is discharged to
sea. The figures quoted are considered to be accurate as it is based on questionnaires
completed by the industry. The major industries contributing to the inland volume and salt
load are:
• Mining;
• Power generation;
• Paper & pulp;
• Petroleum;
• Steel & metals processing.
A summary of industry sectors generating brines, the volumes of effluent and salt load to the
environment is provided in Table 19.

24
Table 12: Industry sectors generating brines (Van der Merwe et al, 2009)
Sector
Total Effluent Salt load to the environment
Total effluent Total excl
marine
Portion excl
marine Total Salt
Total salt excl marine
Portion excl
marine kl/day kl/day % t/day t/day %
Paper & pulp/wood General packaging Steel/metals processing Petroleum Chemical Power generation Mines Chemical suppliers Dairy Sugar Canning General food Pharmaceutical & personal care Animal nutrition Poultry & meat Beverage Textile Waste management Fish processing
272001 1950
30500 839000 13070
132000 145025
528 2700 8100 2200
13970 1430 1205
12100 14670 6000 1909
220700
89001 1950
30500 69100 11070
132000 145025
528 2700 3900 2200
10970 1430 1205
12100 14670 6000 190 200
16.6 0.4 5.7
12.9 2.1
24.7 27.1 0.1 0.5 0.7 0.4 2.1 0.3 0.2 2.3 2.7 1.1 0.0 0.0
1440 2
72 354 51
158 350
0 4
10 1
11 1 1 8
11 13 5
7921
80 2
72 300 44
158 350
0 4 2 1 5 1 1 9
11 13 5 1
7.6 0.2 6.8
28.4 4.2
15.0 33.1 0.0 0.4 0.2 0.1 0.5 0.1 0.1 0.8 1.0 1.2 0.5 0.1
Totals 962239 534739 100 10413 1058 100
For general industry, effluent volumes are likely to be relatively stagnant despite anticipated
future growth. This is mainly as a result of cleaner production techniques and recycling
opportunities foreseen. In contrast, volumes in the gold and coal mining sectors are expected
to increase significantly over the next 20 years and in particular after 2012. This trend is
expected to apply in general to all mining basins (Van der Merwe et al, 2009).
The current and projected future generation of brines per major industry sector is summarized
in Table 17.
Table 13: Current and future projected brine generation by industry sector (van der
Merwe et al, 2009).
Industry sector Brine (tons/day)
Current (2009) 5 year 10 year 20 year
Paper and Pulp/wood 50 50 50 50
General packaging 0 0 0 0
Steel/metals processing 240 240 240 240
Petrochemical 100 100 100 100
Power generation 1600 1600 1600 1600 Mining – Platinum 13 13 16 21
Mining - Gold 300 2610 3360 4350
Mining - Coal 840 1740 3240 11010
Other 0 2 2 2
Despite uncertainties inherent to the database (Van der Merwe et al 2009), the following
specific trends was identified in the study:
• Brine volumes generated as a result of coal and gold mining will probably represent
the most important challenge over the medium term. Cumulatively, it is possible that
brine volumes could be around 4000 t/d within 5 years, and as much as 15 000 t/d of
brine within 20 years.

25
• In terms of the areas in which brine will be generated, in the short term (depending on
future strategies to manage the West and East Rand Basins) brine generation could be
relatively evenly split between the Johannesburg area, and the Witbank area;
• The greatest increase in brine generation is expected (in the longer term) to be in the
area of the Witbank Coal Fields.
.
HW 14, HW 15 GW 14 and GW 15 - Ash
Approximately 90% of power generated in South Africa is generated by means of coal-fired
processes (Van Zyl and Premlall, 2005) generating ash as primary waste stream. Fly ash and
course ash are produced during the combustion process. Coarse ash is damped by water
sprays and the slurry is either fed to ash dams where the ash settles down and water are
recycled, or it is conveyed to ash bunkers where the surplus moisture is drained off prior to
discharge for disposal. Fly ash is small coal particles that did not burn completely and is
separated from the flue gasses in scrubbers by means of electrostatic precipitators or bag filter
systems (Heath, 2009). The fly ash to coarse ash ratio is a function of the type of mill used to
pulverize the coal. Boilers equipped with tube mills generally produce approximately 10%
coarse ash (90% fly ash) whereas boilers equipped with ball mills generally produces 20%
coarse ash (80% fly ash) (Heath, 2009).
Eskom owns 13 coal-fired power stations, the majority situated in Mpumalanga. There are
also 5 smaller coal fired stations operated by either regional municipalities or Public Private
Partnerships (Van Zyl and Premlall, 2005). The net capacity of Eskom coal –fired power
stations as at 31 March 2011 is 37 745 MW (Eskom, 2011). The Eskom coal-fired power
stations are fully operated at all times i.e. on a 24 hour basis. Municipal and private power
stations add another 900 MW (Van Zyl and Premlall, 2005).
In the order of 25 million tons of combustion fly ash is produced annually, most of which is
disposed on land in ash dams or ash dumps (Heath et al, 2009). Approximately 1.2 million
tons of fly ash per year is sold to amongst others, the cement industry (Heath, 2009).
The net power generating capacity of the coal-fired power stations is summarized in Table
18.
Table 14: Net power Generating capacity of Coal-fired power stations
Power stations Net Maximum Capacity (MW)
Eskom 37745
Municipal and Private 900 Total 38645
The actual power generation and ash production by the Eskom coal-fired power stations are
summarized in

26
Table 15.

27
Table 15: Power generation and ash production by Eskom coal-fired power stations
over time (Eskom, 2011)
Year Total electricity produced by Eskom
coal-fired power stations GWh(net)
Ash produced (Mt)
2007 215211 34.16 2008 222908 36.04
2009 211941 36.66
2010 215940 36.01
2011 220219 36.22
HW 16 - Slag
Iron and steel manufacturing
The South African steel industry produces in the order of 10 million tons crude steel per
annum (SAISI, n.d.). According to a Fact Sheet of the Worldsteel Association on Steel
industry by-products (2010), “the recovery and use of steel industry by-products has
contributed to a material efficiency rate of 97% worldwide”. Iron ore-based steelmaking
accounts for about 70% of the world steel production while scrap-based steel accounts for
about 30%. The main by-products produced during the iron and crude steel production are
slags (90%), dusts and sludges as illustrated in
Figure 5.
Figure 5: Main by-products of steelmaking

28
Waste from the Iron and Steele industry sector in South Africa can be calculated based on the
crude steel production figures provided by SAISI and the by-product estimates and ratio’s
provided by the Worldsteel Association. With BF/BOF at about 70% and EAF at about 30%,
the total by-product production in SA can be estimated (Table 16).
Table 16: Estimated waste production in the steelmaking industry
By-product/waste kg/ton crude steel t/ton crude steel t/7 million ton
crude steel
Blast Furnace dust and sludge 20.3 0.0203 142100
Basic Oxygen Furnace dust and sludge 22.9 0.0229 160300
Blast Furnace slag 275 0.275 1925000
Basic Oxygen furnace slag 125.8 0.1258 880600
kg/ton crude steel t/ton crude steel t/3 million ton
Electric Arc Furnace dust and sludge 12.8 0.0128 38400
Electric Arc Furnace Slag 168.6 0.1686 505800
Sintering operations can emit significant dust levels of about 20 kg per metric ton (kg/t) of
steel while pelletizing operations can emit dust levels of about 15 kg/t of steel. Process sold
waste from the conventional process, including furnace slag and collected dust, is generated
at an average rate raging from 300kg/t of steel manufactured to 500kg/t, of which 30kg may
be considered hazardous depending on the concentration of heavy metals present (World
Bank, 1998)
Blast furnace slag should be generated at a rate of less than 320kg/t of iron, with a target of
180kg/t. Slag generation rates from the BOF should be between 50 and 120kg/t of steel
manufactured. However, both the generation rates depend on the impurities in the feed
materials (World Bank, 1998).
Ferro Alloys Industry
The current status (2007) of the ferro alloys plant capacities in South Africa is shown in
Table 17.
Table 17: Installed capacities of the SA Ferro Alloys Plants (Basson et al, 2007)
Type Capacity (t/a)
Primary Charge Chrome 3940000
Recovery Charge Chrome 200000 MCFeCr 70000
LCFeCr 40000
SiMn 160000
Recovery SiMn 5000
HCFeMn 480000
Recovery HCFeMn 25000 MCFeMn 160000
FeSi 136000
Si metal 40000
FeV 12500
Ferrochrome slag is generated at a rate of between 1.1 and 1.6 ton per ton of ferrochrome
produced (Samancor, 2007). The production figures were obtained from the latest available

29
SAMI Report (DMR, 2010). The slag generation over a period of 10 years is calculated as
illustrated in Table 25.
Table 18: Calculated Ferrochrome slag generation based on production figures
Ferrochrome production Slag production estimate
Year kt 1.1 t/t 1.6 t/t
2000 2574 2831 4118
2001 2141 2355 3426
2002 2351 2586 3762
2003 2813 3094 4501
2004 3032 3335 4851
2005 2802 3082 4483
2006 3030 3333 4848
2007 3561 3917 5698
2008 3269 3596 5230
2009 2346 2581 3754
The ratio of slag to metal usually varies between 0.8 and 1.2, given typical South African
manganese ores (Assmang, 2009). Slag generation can therefore be calculated as indicated in
Table 23.
Table 19: Ferromanganese slag generation as calculated based on production figures.
Ferromanganese Production
Slag production
Year Ton 0.8 t/t 1.2 t/t
2000 596873 477498.4 716247.6
2001 523844 419075.2 628612.8
2002 618954 495163.2 742744.8
2003 607362 485889.6 728834.4
2004 611914 489531.2 734296.8
2005 570574 456459.2 684688.8
2006 656235 524988 787482
2007 698654 558923.2 838384.8
2008 502631 402104.8 603157.2
2009 274923 219938.4 329907.6
HW17 and GW 17 – Mineral waste
The mineral waste included in Schedule 1 is limited to foundry sand, refractory waste and
other.
There is no data on mineral waste at this level available in literature. Data was therefore
obtained from the South African Institute of Foundrymen.
There are several waste streams arising from the metal casting process namely:

30
• SLAG AND DROSS – Estimated to be 15 000 tons of slag and 2 000 tons of non-
ferrous dross per annum ( Comprising various metal oxides, from which some of
original metallics are recovered through recycling)
• DUST FROM FURNACE FUME EXTRACTION – Estimated to be 5 000 tons per
annum
• SPENT SAND – Chromite sand estimated to be 20 000 to 24 000 tons per annum;
silica sand estimated to be 300 000 to 350 000 tons per annum
• PARTICULATE EMMISSIONS – Very small amounts of dust are also emitted to
atmosphere, but we do not have any detailed information on the quantities.
These figures are based on 2011 output information and may vary from time to time.
HW 18 and GW 18 – Waste of Electric and Electronic Equipment (WEEE)
An estimated 1.5 million computers enter the SA market every year, with more computers
sold than recycled. Another estimate puts the amount of EEE that entered the market in 2007
at 99 K tonnes comprising of TVs, computers, printers, mobile phones and refrigerators
(Ongondo et al. 2011)
Reports indicate that the amount of white goods, consumer electronics and IT in SA homes
range between 1 and 2 million tonnes, most of which was likely to enter the waste stream
between 2013 and 2018.
Typical material fractions in WEEE are:
• Printed circuit boards 2%
• CRT & LCD screens 12%
• Cables 2%
• Metal-plastic mixture 5%
• Plastics 15%
• Metals 60%
• Pollutants 3%
• Others 1%
Schleup et al. (2009) estimate that 59.7 K tonnes of WEEE, including computers, printers,
mobile phones, TVs and refrigerators were generated in 2007 in SA.
Estimated Weight and lifespan of EEE
Appliance Lifetime in years Weight (Kg)
PC + Monitor 5-8 25
Laptop 5-8 5
Printer 5 8
Mobile Phone 4 0.1
TV 8 30
Refrigerator 10 45

31
Estimated WEEE generation in South Africa (Schluep et al. 2009)
Quantities of EEE entering the SA market (Metric ton/annum)
Quantity of e-waste generated (Metric ton/annum)
Assessment date 2007 2007
PCs 32000 19400
Printers 6800 4300
Mobile phones 1900 850
TVs 35800 23700
Refrigerator 22300 11400
These estimates are based on development indicators from the CIA World Factbook (WDI,
WFB). It is estimated that e-waste flow will increase by a factor 2 to 4 by 2020 for
computers.
For the prediction of e-waste flows from PCs it is important to take the future development of
technology into account. Currently, the present market shows a tendency to move away from
desktop computers and towards laptop computers. Additionally, CRT-monitors will be
substituted by LCD-monitors. Thus, the weight of future e-waste flows will decrease relative
to the number of units discarded and the material composition will also change. These
developments will have an effect both on recycling technologies and the secondary market
HW 19 - Health Care Risk Waste
The literature cover health care risk waste generation, treatment and disposal to a wide extend
covering all nine provinces and include national data as well.
Waste generation and disposal/treatment data include public and non-public hospitals and
clinics, mine clinics, as well as specialized, district and regional hospitals for the period
between 2002 and 2010. Most of these data are given in waste generated per bed per day
units.
The number of clinics and hospitals in each province together with the quantities of treated
health care risk waste (HCRW) are listed in Table XX (DEAT, 2006).

32
The numbers of public and non-public hospitals in each province are given in Table XX as
well as number of total beds and usable beds in each province. An estimation of the waste
generated in also listed here. Table XX gives similar data related to clinics (Rogers et al,
2006).

33
HW 20 – Sewage Sludge
Industrial wastewater in municipal areas is discharged into the municipal sewers. It is
therefore impossible to distinguish between sewage sludge and industrial wastewater sludge
generation in urban areas in South Africa.
Approximately 309 556 t/a, mainly domestic with some industrial waste sludge is generated
in South Africa based on calculations (Herselmann et al, 2005). Sewage sludge is generated
at wastewater treatment plants, but the Department of Water Affairs does not track the
generation or disposal of sewage sludge other than irrigation with wastewater. A total of 821
wastewater treatment facilities receive a total flow of 5 258 Mℓ/day. The collective hydraulic
design capacity of these facilities are 6 614 Mℓ/day (DWA, 2009).
Table 20: Approximate volumes of sludge produced in South Africa by industry sector
(Herselmann et al, 2005).
Activity/Industry Typical volumes produced Comment
Sewage sludge 312 000 t/a (DEAT, 1997)
Mining Industry 250 000-400 000t/a (estimate) Neutralisation of mine water probably the main producer of sludge at present
Paper and pulp industry 234 000 t/a in 2003 @ 50% moisture content (DME, 2004)
Quantity and quality varies according to mill configuration and moisture content
Electricity generation ESKOM does not report sludge volumes specifically
Tanneries 7 200 m3/a (DEAT, 1997) effluent plant
sludges
Petrochemical industries Data not available
Textile industry Effluent plant sludge 240 m3/a
Wool washing sludges20 700 m3/a
(DEAT, 1997)
Timber processing industry Treatment sludges: 95 m3/a (DEAT,
1997) – excludes paper industry
The sludge make by industry sector and projected figures for the next 5, 10 and 20 years are
summarized in Table 15.
Table 21: Projected sludge make by industry sector (Van der Merwe et al, 2009)
Industry sector Sludge (tons/day)
Current (2009) 5 year 10 year 20 year
Paper and Pulp/wood 5 5 5 5 General packaging 0 0 0 0
Steel/metals processing 24 24 24 24
Petrochemical 10 10 10 10
Power generation 160 160 160 160
Mining – Platinum 3 3 4 6 Mining – Gold 30 261 336 435
Mining – Coal 84 174 324 1101
Other 0 0 0 0 Total 316 637 863 1741
Smith and Vasiloudis (1989) estimate sludge generation in South Africa at 16.5 kg of dry
sludge per person per year (Quoted by other WRC reports). DWA 1997 used 50g dry sludge
per person per day in their calculations to get to a total of 309 556 t/annum (Herselman et al.
2005). Sewage sludge production in South Africa is therefore estimated at between 45 and
50g of dry sludge per person per day. The production of sludge can be calculated based on

34
population figures as well as on the number of households with access to flush toilets
connected to municipal sewer systems. The results of such calculations are presented in
Table XXX
Table 22: Sewage sludge generation estimates (Tonne/annum) for 2009 (calculated based on
General Household Survey, 2009 data: Statistical release P 0318)
Province Population Households Average no of people per household
Households with flush toilet
Sludge generation t/a based on 45g/p/d with access to flush toilet
Sludge generation t/a based on 50g/p/d with access to flush toilet
Sludge generation t/a based on 45g/p/d for entire population
Sludge generation t/a based on 50g/p/d for entire population
Western Cape 5369 1478 3.6 1476 88 469 97 852 88 589 97 984
Eastern Cape 6649 1738 3.8 1730 109 204 120 786 109 709 121 344
Northern Cape
1148 311 3.7 310 18 881 20 884 18 942 20 951
Free State 2905 861 3.4 860 47 877 52 955 47 933 53 016
KZN 10461 2615 4.0 2613 172 474 190 767 172 607 190 913
North West 3454 954 3.6 954 56 991 63 036 56 991 63 036
Gauteng 10556 3531 3.0 3527 173 977 192 429 174 174 192 647
Mpumalanga 3610 978 3.7 970 59 078 65 344 59 565 65 883
Limpopo 5320 1346 4.0 1331 86 802 96 008 87 780 97 090
Total 49382 13812 3.6 13772 812 443 898 612 814 803 901 222
The estimated sewage sludge generation for South Africa in 2009 is therefore estimated at
between 812 443 and 901 222 t/a.
Another way of calculating the sludge produced in SA is by using the total daily inflow
(DWA, 2011) and geometric mean of 676 mg/l (Snyman et al 2004) as used in previous
studies.
Table 23: Actual inflow at WWTW during 2010 (DWA, 2011)
No of WWTW Total design capacity(Ml/d)
Total daily inflow (Ml/d)
Mp 76 323.1 159.1
NW 35 315.8 143.8
FS 95 482.2 197.9
GP 56 2595.1 2579
KZN 143 1076.2 715.9
LP 67 150.4 123.2
WC 155 1031.4 901.2
NC 71 150.3 93.3
EC 123 489.5 344.9
Total 821 6614 5258.3
It is suggested that both methods be used to calculate the sludge generation for comparative
purposes.

35
Sludge disposal strategies
Herselmann et al (2005) did a survey of disposal options at 234 treatment facilities in South
Africa. The results of their survey indicated that sludge is stockpiled at 33% of the surveyed
facilities while 3 % is landfilled and only 8% composted (Figure 6).
Figure 6: Sewage sludge disposal options at 234 surveyed sites (after Herselmann et al,
2005).
Current sludge disposal strategies per industry sector is summarized in Table 18.
Table 24: Sludge disposal strategy by industry sector (Van der Merwe et al, 2009)
Industry Technology utilized in South Africa Comments
Sewage sludge • Agriculture
• Land disposal (on or off site)
• Beneficial use (mine rehab, soil amelioration , etc)
• Thermal treatment
• Compost, brick making, pellets
In the Eu the split is typically
• 32% agriculture
• 13% incineration
• 5% ocean
• 48% landfill
Mining (acid mine drainage) • Disposal into lined facilities
• Sludge deposited inside clay lined water retention dams during neutralization
• Co-disposal with other wastes
Paper and pulp industry • Landfill An assessment by the DME of the commercially exploitable biomass resources in the bagasse, wood and sawmill waste and pulp in South Africa showed that 94 GWh of electricity could be generated from this waste stream (DME, 2004)
Electricity generation Co-disposal with ash Current study by Eskom is looking at assimilative capacity within the ashing system
Tanneries Landfill (on or off site) Treatment technologies
Petrochemical industries Landfilling of some sludges, but recycling of others
Textile industry Landfill (off site) Timber processing industry Landfill (off- site)

36
1.9. Literature Reviewed
Annual Reports
Year Report title Author/owner
1998 SASOL Environmental Report 1996-1998 SASOL
2002 SASOL Sustainable development Report 2000-2002 SASOL
2003 Solid waste management annual report (Ekhuruleni) Ekurhuleni Metropolitan
Municipality
2004 SASOL Sustainable Development Report 2002-2004 SASOL
2005 SASOL Sustainable Development Report 2005 SASOL
2006 SASOL Sustainable Development Report 2006 SASOL
2007 SASOL Sustainable Development Report 2007 SASOL
2008 Eskom Holdings Limited, Annual Report 2008 Eskom Holdings Limited
2008 Eskom, Together, Rinsing to the Challenge: Annual Report 2008 ESKOM
2008 SASOL Sustainable Development Report 2008 SASOL
2008 Annual report solid waste landfill section (Ekurhuleni) Ekurhuleni Metropolitan
Municipality
2009 Safe Sustainable Steel, Arcelor Mittal South Africa Limited Sustainability Report 2009
Arcelor Mittal
2009 Nampak packaging excellence, Annual Report 2009 Nampak
2009 SASOL Sustainable Development Report 2009 SASOL
2010 South African Petroleum Industry Association, Annual Report 2010 Sapia
2010 South Africa's mineral industry 2009/2010 - SAMI Department of Mineral
Resources
2010 SASOL Sustainable development Report 2010 SASOL
2010 Arcelor Mittal South Africa Annual Report Arcelor Mittal
2011 Eskom Partnering for a Sustainable Future: Integrated Report 2011 ESKOM

37
Audit reports
Year Report title Author/owner
2009 Holfontein HH landfill site, Gauteng: External Compliance and Environmental Audit March 2009
Enviroserv
2009 Compliance and Status Quo audit of Bulbul Drive H:h landfill site operated by WasteMan KwaZulu Natal, April 2009
Wasteman
2011 Shongweni H:h Landfill site, KwaZulu Natal: External Compliance and Environmental audit Apr 2011
Enviroserv
2011 Vissershok waste management facility: External Audit, February 2011 Enviroserv
Scientific papers
Year Report title Author/owner
1988 Asbestos in South Africa HP Hart
2000 Guidelines for the copilation of integraed waste management plans, Wastecon 2000, Somerset West, September 2000
Wiechers HNS, Borland J, Hanks Jand Scott W
2003 Cape Plc: South African Mineworkers Quest for Justice Richard Meeran, JD
2003 Asbestos mining in southern Africa, 1893-2002 Jock Mcculloch
2003 Appropriate approach in measuring waste generation, composition and density in developing areas. Journal of the South African Institution of Civil Engineering, 45(3) pages 2-10, Paper 477.
Mbande, C
2005 consumer choice in an energy efficient lighting context, May 2005 Jabavu Clifford Nkomo
2006 Projection of Hospital and Clinic Health Care Risk Waste Generation Quantities and Treatment Capacities for South African National Waste Management Strategy Implementation Project
Rogers DEC, Molefe S, Gcwensa Q, Van den Bergh C, Kristiannsen,T and Otto, JB
2007 Still Nothing happening at Thor. Groundwork Volume 9(3) Sept 2007
Euripidou, R and Peek, B
2010 Solar drying and composition of sewage sludge without a bulking agent.
Boyd, RJA, Deacon, SL and Van Niekerk, AM
2011 How are WEEE doing? A global review of the management of electrical and electronic wastes. Waste Management 31: 714-730
Ongondo FO, Williams ID and Cherrett, TJ.

38
National Government Reports
Date Report title Author/owner
1999 Action plan for integrated waste management planning DEAT
2000 Programme for the implementation of the national waste management strategy, Starter document for guidelines for the compilation of integrated waste management plans, Final draft, May 2000
DEAT
2001 Number W.7.0: First Edition. Situation Analysis based on baseline studies regarding waste management in South Africa (in preparation for the National Waste Management Strategy for South Africa)
DWAF
2001 Profiling South African middle-class households, 1998 2006 StatsSA
2004 Assessment of the status quo of cleaner production in South Africa , Final report, August 2004
DEAT
2004 Design, management and supervision of waste treatment, waste disposal and decontamination at the Guernica Chemicals (Pty) Ltd Industrial Site (Thor Chemicals) in Cato Ridge. Output A - Detailed Waste Inventory. Report No 331652
DEAT
2004 Capacity Building in Energy Efficiency and Renewable Energy. Assessment of Commercially exploitable Biomass Resources: Bagasse, Wood and Sawmill waste and pulp in South Africa
DME
2004 SAMI Report 2003/4 DME
2005
Department of environmental affairs and tourism, Draft national framework guidelines for integrated waste management plans for municipalities, Development of national framework guidelins for integratede waste management plans, Draft document for discussion at work sessions, June 2005
DEAT
2005 Draft national framework guidelines for integrated waste management plans for municipalities, Development of national framework guidelines for integrated waste management plans, Draft document for discussion at work sessions, June 2005
DEAT
2005 Implementation Plan for Transfer of the Waste Permitting Function (Census 2005) Draft 2, December 2005
DEAT
2005 National State of the Environment Project - Integrated Waste management. Background research paper produced for the South Africa Environment Outlook report
DEAT
2005 National waste management strategy implementation for South Africa: Recycling, Waste stream analysis and prioritisation for recycling, Annexure H, April 2005
DEAT
2005 Status quo of waste management and waste disposal site permitting in South Africa, Final version
DEAT
2005 South Africa's Mineral Industry (SAMI) 2004-5 DME
2006 Environmental Outlook report 2006 DEA
2006 National Waste Management Strategy Implementation for South Africa: Projections for Health Care Risk Waste Treatment
DEAT

39
2006 National waste management strategy implementation south Africa, waste information system guideline on technical implementation, October 2006
DEAT
2007 Assessment of the status of waste service delivery and capacity at the local government level. August 2007 Draft 3. (Data sheet of this project as also consulted)
DEAT
2007 Community Survey 2007 Municipal data on household services, Key Municipal data StatsSA
2007 General household survey StatsSA
2008 Survey of Generation Rates, Treatment Capacities and Minimal Costs of Health Care Waste in the 9 Provinces of RSA
DEAT
2008 Local Government Budgets and Expenditure Review: 2003/04 - 2009/10 National Treasury
2008 General household survey StatsSA
2008 Income and expenditure of households 2005/2006: Analysis of results StatsSA
2008 Income and expenditure of households 2005/2006: Statistical release P0100 StatsSA
2009 National Waste Quantification and Waste Information System DEA
2009 Department of trade and industry, Proposed road map for the recycling industry: a recycling industry body (RIB) with relevant working groups, January 2009
Dti
2009 Proposed road map for the recycling industry: a Recycling industry body (RIB) with relevant working groups, January 2009
Dti
2009 Green Drop Report 2009 Version 1. South African Waste water Quality management Performance
DWA
2009 General household survey StatsSA
2009 Selected development indicators. A discussion document sourced from the General Household Survey, 2009
StatsSA
2010 South Africa's mineral industry 2009/2010 - SAMI-, Department mineral resources Republic of South Africa, December 2010
DMR
2010 Blue drop report 2010, South African drinking water quality management performance DWA
2010 Statistical release: Gross domestic product, Annual estimates 2000-2009, Regional estimates 2000-2009, Third quarter:2010, November 2010
StatsSA
2011 South Africa's Plan for the implementation of the Stockholm Convention on Persistent Organic Pollutants
DEAT
2011 2011 Green Drop Report DWA
n.d. Technical background document for Mercury waste disposal DEAT

40
Datasets
Year Report title Author/owner
2000 Waste Stream Analysis - appendix City of Johannesburg
2007 PDG data sheet on capacities DEA
2007 PDG full municipal listing DEA
2007 PDG municipality responses DEA
2007 Sewage works inventory DWA
2007 Landfill yearly mass stats 1999 - 2007 eThekwini
2009 CAIA waste table 2004-2009 CAIA
2009 Disposal site permit database DEA
2009 List of plastic recyclers DEA
2009 DWA inventory of WWTW DWA
2009 Treatment process water care works DWA
2009 Forestry and Forest Products industry facts 1980 to 2009 SA Forestry Industry
2009 categories and quantities of tires - SATRP Company SATRP
2010 City of Tshwane, Landfill yearly waste volumes received: 2001/2 - 2009/10 City of Tshwane
2010 Waste sum landfill City of Tshwane
2010 Pikitup Landfill per category July 2007 to March 2010 Pikitup
2010 Pikitup Landfill Tonnage Report 2001 -2010 Rev 2 Pikitup
2011 Minimisations stats July 2011, 2006 to 2011 data Cape Town City of Cape Town
2011 SAWIS all data extracted, February 2011 DEA
2011 SAWIS general waste data extracted, February 2011 DEA
2011 SAWIS hazardous waste data extracted, February 2011 DEA
2011 Inventory of Waste Water Treatment Works Authorisations DWA
2011 WARMS database DWA
2011 LEDET Summary Limpop Department
2011 Waste volumes received at Arlington Landfill Nelson Mandela Metro
2011 The glass recycling company, Provincial Cullet (Waste Glass) Recoveries, F10/11, 1 July 2010 to 30 June 2011
The glass recycling company
nd Food waste estimates Earth Probiotic
nd Pikitup - Composition of waste streams Pikitup

41
Integrated Development Plans
Year Report title Author/owner
2002 Ehlanzeni Integrated development plan: Waste management in-depth study June 2002
Ehlanzeni District Musicality
2004 Central Karoo District Municipality Integrated Development Plan Review 2004/05 for implementation 2005/06
Central Karoo District Municipality
2004 Dipaleseng municipality Integrated Development Plan - Revision 2004 Dipaleseng municipality
2005 Lephalale Municipality Reviewed integrated development plan 2005 Lephalale Municipality
2006 Greater Sekhukhune District Municipality Integrated Development Plan 2006/07-2008/11
Greater Sekhukhune District Municipality
2006 Mbombela Local Municipality Integrated Development plan 2006-2011 Review 2007/8
Mbombela Local Municipality
2006 Nkomazi Local Municipality Integrated Development Plan 2006/7 Nkomazi Local Municipality
2006 Zululand District Municipality Environmental Management Plan. Municipal wide analysis as a component of the Municipality Integrated Development Plan incorporating the Brief Strategic Environmental Assessment. Final Report
Zululand District Municipality
2007 Albert Luthuli local municipality IDP 2007-2011 Reviewed for 2008/9 Albert Luthuli local municipality
2007 Bushbuckridge Local Municipality Five year Integrated Development Plan 2007-2011
Bushbuckridge Local Municipality
2007 Emalahleni Local Municipality Integrated Development Plan Emlahleni Local Municipality
2007 Mopani District Municipality Reviewed Integrated Development Plan for 2007/8 Mopani District Municipality
2007 Msukaligwa Municipality IDP 2007-2012 Msukaligwa Municipality
2008 Eden District Municipality Revised Integrated Development Plan 2008/2009 Eden District Municipality
2008 Ehlanzeni District Municipality Integrated Development Plan Ehlanzeni District Municipality
2008 Gert Sibande District Municipality Integrated Development Plan Gert Sibande District Municipality
2008 Lekwa Local Municipality Reviewed IDP 2008-2011 Lekwa Local Municipality
2008 Metsweding District Municipality IDP review 2008-2009 Metsweding District Municipality
2008 Thaba Chweu Local Municipality Integrated Development Plan 2008/2009 Thaba Chweu Local Municipality
2008 Umjindi Municipality IDP 2008/09 Umjindi Local Municipality
2009 Amajuba District Municipality Integrated Development Plan review for 2009/10 Final report May 2009
Amajuba District Municipality
2009 Mbombela Local Municipality Integrated Development plan review2009-2010 Mbombela Local Municipality

42
Integrated Waste Management Plans – Metro’s and Local Municipalities
Code Year Title/ Municipality
A 2003 The Waste management plan for the City of Johannesburg Final report: A Framework for sustainable waste management in the City of Johannesburg, June 2003
A 2004 City of Cape Town Integrated solid waste management plan Final status quo report, March 2004
A 2004 City of Tshwane Draft IWMP for comment
A 2004 Integrated waste management plan for Ethekwini Municipality, Augsut 2004
A 2005 Integrated waste management plan 2005-2010. Nelson Mandela Metropolitan Municpality, July 2005
A 2006 Waste optimisation study: Ekhuhuleni
A 2007 Solid waste management department sector plan for integrated waste management and service delivery in Cape Town
A 2011 City of Johannesburg Integrated waste management plan
B1 2004 Drakenstein Municipality integrated waste management plan, December 2004
B1 2004 Integrated Waste management plan Polokwane municipality: Environmental and waste management (Draft)
B1 2005 Mangaung: Final draft IWMP
B1 2005 George IWMP
B1 2005 uMhlatuze local municipality: Integrated waste management plan for the uMhlatuze Municpality Kwazulu-Natal April 2005
B1 2006 Local Muncipality of Madibeng: Status Quo and needs analysis study, June 2006
B1 2006 Mbombela local municipality draft integrated waste management plan.
B1 2006 Rustenburg Local municppality Integrated waste management plan, April 2006
B1 2006 Stellenbosch
B1 2007 Nkangala District Municipality: Emalahleni Local Muncipality Integrated waste management plan. Status Quo report, Draft report No 20149-REP-002. April 2007
B1 2008 Emfuleni municipality Status quo and needs analysis study for the Emfuleni municipality October 2008
B1 2009 Drakenstein Muncipality Integrated waste management plan 2nd version December 2009
B1 2009 Emalahleni Municipality Status Quo and needs analysis study for the Emlahleni municipality, May 2009
B1 2009 Msunduzi Local Municipality (KZN) Review IWMP
B2 2005 Breede Valley Local Municipality
B2 2005 Gert Sibande District Municipality Msukaligwa Local Municipality: Integrated waste management plan: Phase 1 Information gathering and Gap analysis, September 2005
B2 2006 //Khara Hais Municipality status quo and needs analysis study for the //khara Hais Municipality
B2 2006 Knysna Municipality
B2 2006 Mossel Bay local municipality, Integrated waste management plan for the Mossel bay local municipality, Western Cape, June 2006
B2 2006 Oudtshoorn
B2 2006 Saldanha Bay
B2 2008 Kungwini Local Municipality: Metsweding District. Integrated Waste Management Plan, November 2008
B2 2008 Makana municipality Status Quo and needs analysis study for the Makana municipality July 2008
B2 2008 Metsimaholo municipality Status quo and needs analysis study for the Metsimaholo municipality May 2008
B2 2008 Moqhaka municipality Status quo and needs analysis study for the Moqhaka municipality April 2008
B2 2009 Emakhazeni Municipality, Status quo and needs analysis study for the Emakhazeni municipality June 2009
B2 2009 Integrated waste management plan (Second edition) Overstrand Municipality, February 2009
B2 2009 Umdoni Local Municipality (KZN) Final IWMP
B2 2009 Umngeni Local Municipality (KZN) Review of IWMP
B2 2010 Hibiscus coast municipality integrated waste management plan for the Hibiscus coast municipality, Draft Final, February 2010
B2 2010 Integrated waste management plan for Emnambithi/Ladysmith Municipality
B3 2004 Ga - Segonyana
B3 2004 Gammagara IWMP

43
B3 2004 Greater Ba Phalaborwa Local Municipality: Mopani District Municpality. Integrated watse management plan Feasibility study, August 2005
B3 2004 Vhembe District; Musina Local Municipality Integrated waste management strategy plan, February 2005
B3 2005 Beaufort West
B3 2005 Kareeberg Municipality Status Quo and needs analysis study for the Kareeberg Municpality. December 2005
B3 2005 Laingsburg local Municipality; Integrated waste management plan for the Laingsburg local muncipality Western Cape, September 2005
B3 2005 Prince Albert IWMP
B3 2005 Swartland IWMP
B3 2005 uMvoti Municipality: Status Quo and needs Analysis study for the Umvoti muncipality Kwazulu- Natal. May 2005
B3 2006 Bergrivier (Draft Report)
B3 2006 Bitou
B3 2006 Breede River Winelands Municipality
B3 2006 Cape Augulhas (Draft Report)
B3 2006 Hantam draft IWMP
B3 2006 Hessequa
B3 2006 Kamiesberg
B3 2006 Kannaland
B3 2006 Karoo hoogland
B3 2006 Khai Ma
B3 2006 Matzikama Local Municipality (Draft Report)
B3 2006 Nama Khoi
B3 2006 Richtersveld
B3 2006 Swellendam Local Municipality (Draft Report)
B3 2007 Cederberg Municipality
B3 2007 Emthanjeni muncipality: Status Quo and needs analysis study for the Emthanjeni municpality final July 2007
B3 2007 Kareeberg municipality Status quo and needs analysis study for the Kareeberg municipality September 2007
B3 2007 Ndlambe municipality Status quo and needs analysis study for the Ndlambe municipality June 2007
B3 2007 Renosterberg muncipality Status quo and needs analysis study for the Renosterberg municipality
B3 2007 Siyancuma muncipality Status quo and needs analysis study for the Siyancuma municipality
B3 2007 Siyathemba muncipality Status quo and needs analysis study for the Siyathemba municipality September 2007
B3 2007 Theewaterskloof Municipality Draft Report
B3 2007 Thembelihle muncipality Status quo and needs analysis study for the Thembelihle municipality September 2007
B3 2007 Ubuntu muncipality Status quo and needs analysis study for the Ubuntu municipality September 2007
B3 2007 Umsobomvu municipality Status quo and needs analysis study for the Umsobomvu municipality September 2007
B3 2007 Witzenberg Municipality (Draft Report)
B3 2008 Baviaans municipality Status quo and needs analysis study for the Baviaans municipality , August 2008
B3 2008 Camdeboo municipality Status quo and needs analysis study for the Camdeboo municipality , July 2008
B3 2008 Ikwezi municipality Status Quo and needs analysis study for the Ikwezi municipality August 2008
B3 2008 Kouga municipality Status Quo and needs analysis study for the Kouga municipality August 2008
B3 2008 Kou-kamma municipality Status Quo and needs analysis study for the Kou-Kamma municipality August 2008
B3 2008 Mafube municipality Status quo and needs analysis study for the Mafube municipality April 2008
B3 2008 Ramotshere Moila municipality Status quo and needs analysis study for the Ramotshere Moila municipality July 2008

44
B3 2008 Sunday's River Valley municipality Status Quo and needs analysis study for the Sunday's River Valley municipality August 2008
B3 2009 Delmas municipality Status Quo and needs analysis study for the Delmas municipality June 2009
B3 2009 Mkhambathini Local Municipality (KZN) Review IWMP
B3 2009 Mpofana Local Municipality (KZN) Review of IWMP
B3 2009 Status Report Setsoto Local Municipality integrated waste management plan May 2009 Final version 2
B3 2010 Umuziwabantu Local municipality, integrated waste management plan for the Umuziwabantu local municipality, Draft Final, February 2010
B4 2004 Capricorn District Muincipality. Integrated waste management plan Aganang local municipality Staus quo report Volume 1, November 2004
B4 2004 Fetakgomo Local Municpality Integrated waste management plan
B4 2004 Greater Giyani Local Municipality: Mopani District Integrated waste management plan: Status Quo report; May 2005
B4 2004 Greater Letaba Local Municpality: Mopani District Integrated waste management plan: Status Quo Report, May 2005
B4 2004 Greater Tzaneen Local Municipality: Mopani District Integrated waste management plan, Status Quo report, May 2005
B4 2004 Maruleng Local Municipality Mopani District Integrated waste management plan Status Quo report, March 2006
B4 2004 Moshaweng Local Municipality
B4 2004 Mutale Municipality Status Quo and needs analysis study( for the development of an integrated waste management plan) for the Mutale local municipality, May 2010
B4 2004 Sekhukhune District Greater Tubatse Local Municipality Integrated Waste Management Strategy Plan February 2005
B4 2004 Sekhukhune District, Greater Groblersdal Local Municipality Integrated waste management plan: Draft Status Quo report September 2004
B4 2004 Sekhukhune District, Greater Makhuduthamaga Local Municipality Integrated waste management plan: Draft status quo report, September 2004
B4 2004 Sekhukhune District, Greater Marble Hall Municipality Integrated waste management plan: Draft status quo report, September 2004
B4 2004 Vhembe District; Makhado Local Municipality Integrated waste management strategy plan, February 2005
B4 2004 Vhembe District; Mutale Local Municipality Integrated waste management strategy plan, February 2005
B4 2004 Vhembe District; Thulamela Local Municipality Integrated waste management strategy plan, February 2005
B4 2006 Bushbuckridge Local Municipality Draft copy Status quo study for the integrated waste management plan of the Bushbuckridge local municipality Mpumalanga
B4 2006 Integrated Waste Management Plan for Nkandla Local Municipality
B4 2009 Dr JS Moroka Municipality, Status quo and needs analysis study for the Dr JS Moroka municipality May 2009
B4 2009 Richmond Local Municipality (KZN) Review of IWMP
B4 2009 Umshwathi Local Municipality (KZN) Review of IWMP
B4 2010 Ezinqoleni Local municipaltiy, Integrated waste management plan for the Ezinqoleni local municipaltiy, Draft Final, February 2010
B4 2010 Jozini municipal integrated waste management plan (IWMP), Draft Status quo reprot for discussion - Jozini, October 2010
B4 2010 Review of the Integrated Waste Managemen t plan of the uMgungundlovu District Municipality (IWMP - 2009 Update) Impendle Local Municpality IWMP
B4 2010 Umzumbe local municipality, integrated waste management plan for lthe umzubme local municipality, Final draft, February 2010
B4 2010 Vulamehlo local municipalty, integrated waste management plan for the Vulamehlo local municipality, Final draft, February 2010
B4 2011 Okhahlamba Draft IWMP

45
District Municipality and Provincial Waste Management Plans
Code Year Title
C 2002 uMgungundlovu District Muncipality Integrated Waste management plan Report 261575/3 - Volume 1 of 2. August 2002
C 2002 Zululand DM (KZN) Solid Waste Management Master Plan
C 2003 Amajuba DM (KZN) Integrated Waste Management Master Plan
C 2003 Nkangala District Municipality General Waste management plan: Status Quo Report. Final report Nopvember 2003
C 2004 Integrated Solid Waste Management Plan for the uMkhanyakude District Municipality
C 2004 Kgalagadi IWMP
C 2004 uMgungundlovu District Muncipality Integrated Waste management plan (IWMP -2004 update) Volume 1 of 3, November 2004
C 2005 Chris Hani District Municipality: Status Quo study for the Integrated Waste management plan, June 2005
C 2005 Central Karoo District Management Area
C 2005 Greater Sekhukhune District Municipality Integrated waste management Strategy Plan. February 2005
C 2005 Metsweding District Municipality Integrated waste management plan. Final report April 2005
C 2005 uMzinyathi District Municipality Status Quo and needs analysis study: uMzinyathi District Municipality
C 2005 uThungulu District Municipality Integraed waste management plan, August 2005
C 2005 Vhembe District Municipality Integrated waste management strategy plan status quo report, January 2005
C 2006 Eden District Municpality Integrated waste management plan for the Eden District Municipality. Western Cape, November 2006
C 2006 Greater Mopani District Municipality Integrated waste management plan. Status Quo report April 2006
C 2006 Namakwa: IWMP
C 2006 Waterberg District: IWMP
C 2007 Cape Winelands District Municipality (Draft Report)
C 2007 Pixley ka Seme District management area
C 2007 Overberg District Municipality Plan (Draft Report)
C 2007 Pixley ka Seme: Summary of Local Municipality IWMPs
C 2007 West Coast District Municipality (Draft Report)
C 2008 Cacadu District management area Status quo and needs analysis study for the Cacadu district management area August 2008
C 2009 Advanced integrated solid waste management sytem: Umgungundlovu
C 2010 Integrated waste management plan 2010-2020 Compiled on behalf of West Rand District Municipality
C 2010 Siyanda District Municipality (NC) Condensed IWMP
P 2005 Limpopo: Hazardous waste management plan (Status Quo)
P 2006 North West: Hazardous waste management plan (Status Quo)
P 2007 Gauteng: 1st generation Hazardous waste managemetn plan
P 2008 Mpumalanga: Draft Final status Quo - Hazardous waste management plan
P 2008 Northern Cape Province Integrated Watse Managemetn plan: Final draft IWMP April 2008
P 2008 Provincial Integrated waste management plan: North West, Status Quo report
P 2009 Draft Integrated General Waste Management Plan: Eastern Cape
P 2010 Provincial Integrated waste management plan for the Western Cape Draft 1. November 2010
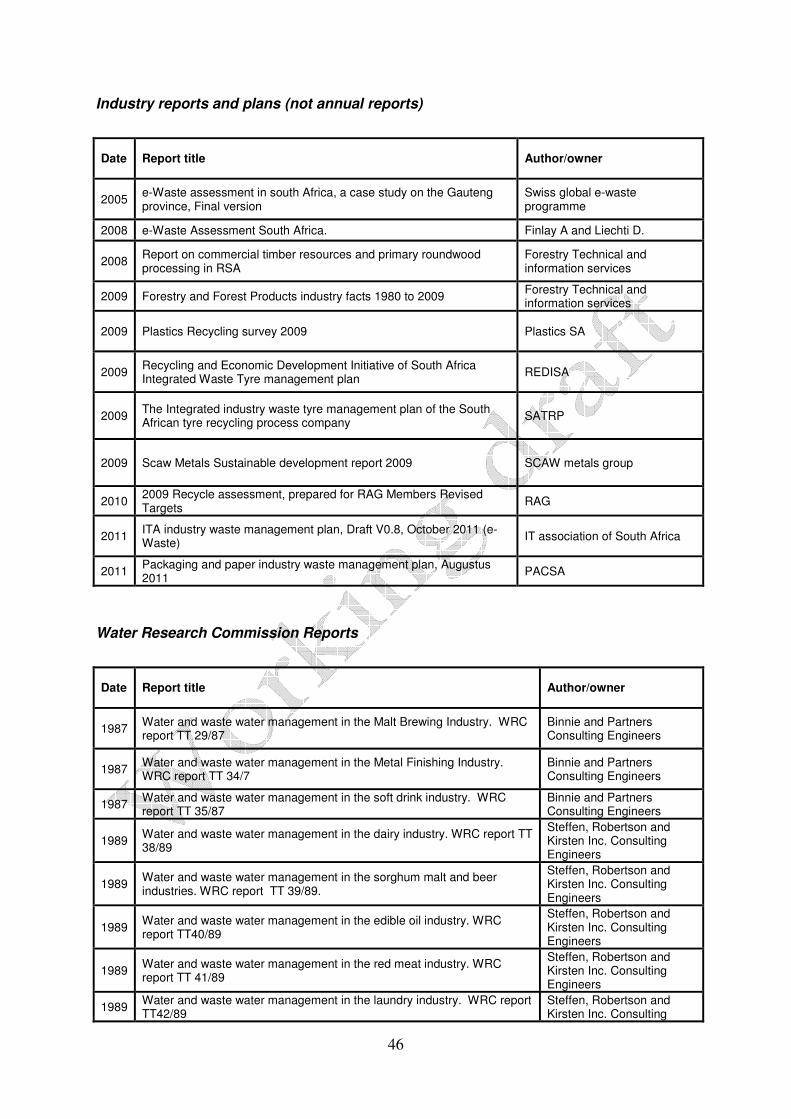
46
Industry reports and plans (not annual reports)
Date Report title Author/owner
2005 e-Waste assessment in south Africa, a case study on the Gauteng province, Final version
Swiss global e-waste programme
2008 e-Waste Assessment South Africa. Finlay A and Liechti D.
2008 Report on commercial timber resources and primary roundwood processing in RSA
Forestry Technical and information services
2009 Forestry and Forest Products industry facts 1980 to 2009 Forestry Technical and information services
2009 Plastics Recycling survey 2009 Plastics SA
2009 Recycling and Economic Development Initiative of South Africa Integrated Waste Tyre management plan
REDISA
2009 The Integrated industry waste tyre management plan of the South African tyre recycling process company
SATRP
2009 Scaw Metals Sustainable development report 2009 SCAW metals group
2010 2009 Recycle assessment, prepared for RAG Members Revised Targets
RAG
2011 ITA industry waste management plan, Draft V0.8, October 2011 (e-Waste)
IT association of South Africa
2011 Packaging and paper industry waste management plan, Augustus 2011
PACSA
Water Research Commission Reports
Date Report title Author/owner
1987 Water and waste water management in the Malt Brewing Industry. WRC report TT 29/87
Binnie and Partners Consulting Engineers
1987 Water and waste water management in the Metal Finishing Industry. WRC report TT 34/7
Binnie and Partners Consulting Engineers
1987 Water and waste water management in the soft drink industry. WRC report TT 35/87
Binnie and Partners Consulting Engineers
1989 Water and waste water management in the dairy industry. WRC report TT 38/89
Steffen, Robertson and Kirsten Inc. Consulting Engineers
1989 Water and waste water management in the sorghum malt and beer industries. WRC report TT 39/89.
Steffen, Robertson and Kirsten Inc. Consulting Engineers
1989 Water and waste water management in the edible oil industry. WRC report TT40/89
Steffen, Robertson and Kirsten Inc. Consulting Engineers
1989 Water and waste water management in the red meat industry. WRC report TT 41/89
Steffen, Robertson and Kirsten Inc. Consulting Engineers
1989 Water and waste water management in the laundry industry. WRC report TT42/89
Steffen, Robertson and Kirsten Inc. Consulting

47
Engineers
1989 Water and waste water management in the poultry industry. WRC report TT43/89
Steffen, Robertson and Kirsten Inc. Consulting Engineers
1989 Water and waste water management in the tanning and leather finishing industry. WRC report TT44/90
Steffen, Robertson and Kirsten Inc. Consulting Engineers
1990 Water and waste water management in the sugar industry. WRC report TT47/90
Steffen, Robertson and Kirsten Inc. Consulting Engineers
1990 Water and waste water management in the paper and pulp industry WRC report TT49/90
Steffen, Robertson and Kirsten Inc. Consulting Engineers
1993 Water and waste water management in the textile industry. WRC report TT 50/90
Steffen, Robertson and Kirsten Inc. Consulting Engineers
1993 Water and waste water management in the wine industry. WRC report TT51/90
Steffen, Robertson and Kirsten Inc. Consulting Engineers
2004 A Metal Content Survey of South African Sewage Sludge and an evaluation of analytical methods for their determination in sludge. WRC Report 1283/1/04
Snyman HG, Herselman, JE. And Kasselman, G.
2004 Laboratory and field scale evaluation of agricultural use of sewage sludge. WRC report 1210/1/04
Snyman, HG and Van der Waals, J.
2005 An evaluation of dedicated land disposal practices for sewage sludge. WRC report 1209/1/05
Herselman JE, Wade PW, Steyn CE and Snyman HG
2005 Water and waste water management in the oil refining and re-refining industry. WRC Report TT 180/05
Pearce, K and Whyte, D.
2005 Water and waste water management in the power generating industry. WRC report TT 240/05
van Zyl, HD and Premlall, K.
2006 Premise for the development of Volume 1 and 2 of the South African Sludge Guidelines. WRC report 1453/1/06
Snyman HG and Herselman, JE.
2006 Guidelines for the utilisation and Disposal of Wastewater Sludge. Volume 1: Selection of Management options. WRC report TT 261/06
Snyman HG and Herselman, JE.
2006 Guidelines for the utilisation and Disposal of Wastewater Sludge. Volume 2 of 5: Requirements for the Agricultural use of Wastewater Sludge. WRC Report TT 262/06
Snyman HG and Herselman, JE.
2007 Methodology and survey of organic pollutants in South African Sewage Sludges. Volume 1. WRC Report 1339/1/07
Jaganyi, D
2007 Methodology and survey of organic pollutants in South African Sewage Sludges. Volume 2. WRC Report 1339/2/07
Jaganyi, D
2009 First Order Assessment of the Quantity and Quality of non-point sources of pollution associated with Industrial, mining and power generation. WRC report 1627/1/09
Heath RG, Van Zyl HD, Schutte CF and Schoeman JJ.
2009 Guidelines for the Utilisation and Disposal of Wastewater sludge. Volume 4: Requirements for the beneficial use of sludge at high loading rates. WRC report TT350/09
Herselman JE and Moodley, P.
2009 Guidelines for the Utilisation and Disposal of wastewater Sludge. Volume 5: Requirements for thermal sludge management practices and for commercial products containing sludge. WRC report TT 351/09
Herselman JE, Burger LW and Moodley P.
2009 Guidelines for the Utilisation and Disposal of Wastewater sludge. Volume 3: Requirements for the on-site and off-site disposal of sludge. WRC report TT 349/09
Herselman, JE and Snyman, HG.

48
2010 a first order inventory of water use and effluent production by SA industrial mining and electricity generation sectors, April 2010
TE Cloete, A Gerber & LV Maritz
State of the Environment Reports
Date Report title Author/owner
1999 Midrand State of Environment Report Fakir S and Broomhall L.
2002 State of the Environment Report for City of Cape Town Year 5 (2002)
City of Cape Town
2002 North West Province State of the Environment Report, Overview 2002
North West Department of Agriculture, Conservation and Environment
2003 Limpopo Overview State of the Environment, October 2003 Department of Finance and Economic Development, Limpopo
2003 Ekurhuleni Metropolitan Municipality First year State of the Environment Report, 2003
Ekurhuleni Metropolitan Municipality
2003 Mangaung state of the environment report 2003 Mangaung
2003 Mbombela State of the Environment 2003. Final Report Mbombela Local Municipality
2003 State of the Environment Report for the Mogale City Local Municipality 2003
Mogale City
2003 Mpumalanga State of the Environment Report Mpumalanga Department of Agriculture, Conservation and Environment
2003 State of the environment report 2003, City of Johannesburg City of Johannesburg
2004 Gauteng State of the Environment Report GDACE
2004 Eastern Cape State of the Environment Report Eastern Cape Department of Economic Affairs, Environment and Tourism
2005 State of the Environment Report 2005 Year one. Provincial government of the Western Cape
DEDP WC
2005 Drakenstein State of Environment Report Popular version, December 2005
Drakenstein local Municipality
2005 Knysna Municipality State of the Environment Report Year 0ne Knysna Municipality
2006 Nkangala district municipality State of the environment report, 2006
Nkangala District Municipality
2009 Free State Environmental Outlook Free State Government
2002 uMhlathuze Municipality State of the Environment report, Strategic environmental assessment for the uMhlathuze municipality, June 2002
uMhlatuze Municipality

49
Other reports
Date Report title Author/owner
1997 Energy Efficient Lighting in the Republic of South Africa Robert Henderson, Electrotek, Technology Research and Investigations, Eskom, SA
2000 Nkomazi Local Municipality Waste management best practice Nkomazi Local Municipality
2000 The need for and location of high hazardous waste sites for KwaZulu Natal.
Town and regional planning commission
2001
Danced environmental capacity building project, Johannesburg. Mini-project WM4 on metro-wide waste management planning- Phase 1, Current waste management in the city of Johannesburg, A waste stream analysis of the general waste stream, December 2001
Johannesburg Municipality
2001 Profiling South African middle-class households, 1998 2006 StatsSA
2002 statistical infrastructure review of the Demarcated Municipalities Development Bank
2002 Waste management in-depth study - Ehlanzeni integrated development plan
Ehlanzeni municipality
2002 study on solid waste management options for Africa, Project report final draft version, July 2002
Richard J Palczynski
2003
City of Tshwane metropolitan municipality waste management section in association with USAID, draft, educational strategy to produce increased awareness at the community level in Tshwane regarding solid waste management, Version V2.0, October 2003
BE Ngeleza, LP Mohajane, SJ bellinger and HNS Wiechers
2003
General management assistance contract (GMAC): City of Tshwane metropolitan municipality waste management section in association with USAID, Draft, Educational strategy to produce increased awareness at the community level in Tshwane regarding solid waste management, Version V2.0, October 2003
BE Ngeleza, LP Mohajane, SJ bellinger and HNS Wiechers
2003
Kwazulu natal provincial government, Department of agriculture and envrionmental affairs, guidelines for the development of integrated waste management plans for local goverments, 2nd draft document, January 2003
DAEA, KZN
2003 Assessment of existing waste management conditions and recommendations concerning service delivery improvement in the Govan Mbeki Municipality, May 2003
Govan Mbeki Municipality
2003 composition and generation of Healt Care Risk Waste in South Africa
Torben Kristiansen et al
2004 Pikitup Johannesburg Material reclamation study Johannesburg Municipality
2004 A Report for the Assessment of Waste Disposal Sites in the Province of Kwazulu-Natal
KZN Provincial Planning and Development Commission
2004 Integrated Environmental management plan Mangaung local Municipality September 2004
Mangaung
2005 Greater Ba Phalaborwa Local Municipality: Mopani District Municipality. Integrated waste management plan Feasibility study, August 2005
Ba Phalaborwa Local Municipality
2005 eThekwini Municipality, Association of clean communities, 2004/2005 Projects
Ethekwini municipality
2005 Learning with Mogale City Part 2. Lessons learnt from conducting a participation process for civil society in developing Mogale City's Integrated Waste Management Policy
Victor Munnik and Joey Mokone
2005 Association of clean communities 2004/2005 Projects

50
2005 National waste management strategy implementation South Africa - Recycling. Waste stream analysis and prioritisation for recycling
2006 Assessment for the best practicable Environmental Option for managing priority hazardous waste streams for the Western Cape.
DEDP WC
2006 Ekurhuleni Metropolitan Municipality waste management optimization feasibility study Volume 2 March 2006
Ekurhuleni Metropolitan Municipality
2006 Waste Origin: Summary report July 2005 - June 2006 Ekurhuleni municipality
2006 Hazardous Waste management in Limpopo province, Draft final report, Augustus 2006
Limpopo municipality
2006 Mittal Steel South Africa Sustainability report 2006 Mittal Steel
2006 Projection for health care risk waste treatment, September 2006 National waste management strategy implementation south Africa
2006 From waste to resource, An abstract of 2006 world waste survey
2007 Penge Asbestos hazard: Site visit and assessment Donohue, S
2007 Integrated Analysis Solid waste baseline Report Engledow, S-A
2007 South Africa's Ferro alloys industry - present status and future outlook
Mintek
2007 Report to Pikitup Johannesburg on development of Strategic road map Phase 2. Volume 1 of 3 Report
Pikitup Johannesburg
2007 Report to Pikitup Johannesburg on development of Strategic road map Phase 2. Volume 2 of 3 Annexure A to G
Pikitup Johannesburg
2007 Report to Pikitup Johannesburg on development of Strategic road map Phase 2. Volume 3 of 3 Annexure H to I
Pikitup Johannesburg
2007 Community Survey 2007 Municipal data on household services, Key Municipal data
StatsSA
2007 General household survey StatsSA
2007 Theme: Waste management
2008 Disposal Technology Options Study (POPs waste) Africa Stockpiles Programme
2008 Municipal demarcation board assessment of capacity for the 2007/08 period district municipality report, Capricorn district municipality (DC35), Limpopo
Capricorn district municipality
2008 Waste Origin: Summary report July 2007 - June 2008 Ekurhuleni municipality
2008 Gauteng Department of Agriculture, Conservation and Environment. General Waste Minimisation Plan for Gauteng (Version 4.1) October 2008
Gauteng Department of Agriculture, Conservation and Environment.
2008 Development of a general waste minimisation plan for Gauteng - Status gap and waste minimisation options report (Draft Final Report, Version3.1)
Gauteng Department of Agriculture, Conservation Environment and Land Affairs
2008 General waste minimisation plan for Gauteng Version V4.1, December 2008
Gauteng municipality
2008 Private Hospital Review 2008, Examination of factors impacting on private hospitals
Hospital Association of South Africa
2008 Municipal capacity assessment 2007/2008 - 48 reports - (One report per District Municipality).
Municipal demarcation board
2008 Local Government Budgets and Expenditure Review: 2003/04 - 2009/10
National Treasury
2008 North West Province Environment outlook, Draft environment outlook report, Revision 3, September 2008
North West Department of Agriculture, Conservation and Environment
2008 General household survey StatsSA
2008 Income and expenditure of households 2005/2006: Analysis of results
StatsSA

51
2008 Income and expenditure of households 2005/2006: Statistical release P0100
StatsSA
2008
Seprotech expands water treatment services to include plant operations; Black & Veatch leads desalination research effort; Partnership are key to water markets in south Africa; Nitto denko RO membrane helps win environmental award, membrane technology news, November 2008
2008 Waste oil management for the Rose Foundation , South Africa Rose Foundation
2009 Province of kwazulu-natal, department of agriculture environmental affairs and rural development, development of a provincial integrated waste management plan for kwazulu-natal
department of agriculture environmental affairs and rural development
2009
Development of a hazardous waste management plan for kwazulu natal, Department of agriculture, environmental affairs and rural development, Bid number: ZNB 6119/09A, Closing date 10 December 2009
Department of agriculture, environmental affairs and rural development
2009 general and hazardous waste management plans, draft integrated general waste management plan, November 2009
Department of Economic Development and Environmental Affairs
2009 Waste Origin: Summary report July 2008 - June 2009 Ekurhuleni municipality
2009 GDARD EIA review system: Feasibility study for the development of an EIA review system, September 2009
Gauteng department of agricultural & rural development
2009 Hospital association of South Africa, Private Hospital Review 2009 Hospital Association of South Africa
2009 From waste to resource, An abstract of world waste survey, 2009 Philippe Chalmin & Cathenine Gaillochet
2009 Costing the integrated waste management bylaw with specific reference to airspace savings, Draft report Phase II, June 2009
Solid waste management department, city of cape town & School of public management and planning, University of Stellenbosch
2009 General household survey StatsSA
2009 Selected development indicators. A discussion document sourced from the General Household Survey, 2009
StatsSA
2009 Quotation for discussion - Proposal to undertake an application for licensing of Bultfontein Dump, Tswelopele municipality, April 2009
Tswelopele municipality
2009 Terms of reference for integrated waste management plan, Ugu district municipality, financial year 2008/2009
Ugu district municipality
2009
uMgungundlovu DM - Solid waste management, Consulting services Elaboration of a Feasibility Study for an Advanced integrated solid waste management system for uMgungundlovu district municipality*, Terms of reference, December 2009
uMgungundlovu DM
2009 Stockholm Convention on Persistent Organic Pollutants (POPs) as amended in 2009
UNEP
2009 Sustainable Innovation and Technology Transfer Industrial Sector Studies. Recycling - From E-Waste to Resources
UNEP
2009 An investigation of Innovative Approaches to Brine Handling. WRC report 1669/1/09
Van der Merwe IW, Lourens A and Waygood, C
2010 Solid Waste Management Sector Plan (Incorporating Integrated Waste Management Plan) 2010 Review
City of Cape Town
2010 Gaps and needs analysis - Final report, Integrated waste management plan for the Western cape, Augustus 2010
DEDP WC
2010 Synthesis report, Integrated waste management plan for the western cape province, October 2010
Department of Environmental affairs and development planning
2010 Waste Origin: Summary report July 2009 - June 2010 Ekurhuleni municipality

52
2010 P9115 Unit data 2009 and 2010 StatsSA
2010 Statistical release: Gross domestic product, Annual estimates 2000-2009, Regional estimates 2000-2009, Third quarter:2010, November 2010
StatsSA
2010 Fact sheet steel industry by-products, Achieving the goal of zero waste, February 2010
Worldsteel association
2010 Technical guidelines for the Environmentally sound management of waste consisting of, containing or contaminated with Mercury - 5th draft
2011 A socio economic profile of south African households in 2010 Andre Roux
2011 Local Government Budgets and Expenditure Review: 2006/07 - 2012/13
Department: National Treasury
2011 Waste Origin: Summary report July 2010 - June 2011 Ekurhuleni municipality
2011 Eskom reporting on Disposal data of ash, brines and compact fluorescent lamps. An overview of the disposal for the period Apr 2010 to March 2011
ESKOM
2011 Foundry industry waste John Davies
2011 New Technology furthers the Recycling of Waster Oil in SA. Nora-SA News Issue 1:2011
National Oil Recycling Association of SA
2011 Packaging and paper industry waste management plan, Draft version 5.7.2011
Packaging council of South Africa
2011 Blue drop Green Drop assessment Report
nd Cape agulus Draft integrated waste management plan, industrial survey
Cape Agulus municipality
nd Using indicators to track environmental change, Chapter 9 Waste management
Gauteng provincial department
nd Hotazel landfill site Checklist Hotazel landfill site
nd Environmental measures: Kgalagadi district municipality Kgalagadi district municipality
nd health care waste in Southern Africa: a civil society perspective lewellyn Leanord
nd Environmental management framework for the Msunduzi municipality, Stakeholder survey questionnaire
Msundi Local Municipality
nd South African Iron and steel institute, Introduction to the south African iron and steel institute (SAISI)
South African Iron and Steel Institute
nd Extract from instructions to members on waste information to be submitted
nd review of the integrated waste management plan and solid waste recycling project, Section 2, Clients requirements and terms of reference

53
2 GAP Identification Based on the literature review we identify gaps in the knowledge. Additional data will be
collected through self-administered questionnaires and semi- structured interviews targeting
the selected municipalities and industries. This primary data collection will be done where
gaps in data exist as well as to verify selected data collected in the desktop study.

54
3 Questionnaires and Interviews Where we need additional information we collect this information by asking relevant people,
e.g. persons representing businesses, local/regional government, treatment facilities etc

55
4 Modeling Here we give a short description on how we have used/modelled the data in order to give the
reader an understanding of the way we get from the input data to the output data.
Due to the current lack of available accurate data at a national scale, combined with the
limited time for accurate data collection, a waste survey model was developed to simulate
data where gaps in current data exist. Actual accurate data is used to populate the model in
order to test the accuracy of the simulations, where it exists. Once the accuracy of the model
is verified, estimations of waste quantities are run, where data is not available.
Figure 7: Modelling of missing waste information
As illustrated in Figure 7, closing all waste information gaps through primary data collection
entails prohibitive costs. As often seen, collection of actual data on 80% of the waste can be
done for 20% of the resources required to collect data on all the waste. Given proper
accuracy and precision of the existing waste information, it is clear that more modelling of
information will have a negative impact on the accuracy of the model outputs. It is therefore
important to select a level of primary data collection, which will provide for the required
accuracy of the model outputs within the available resources.
Actual accurate data is used to populate the model in order to test the accuracy of the
simulations based on real data, where it exists. Once the accuracy of the model is verified,
simulations of different scenarios will be done to estimate waste where data is not available.
This approach will provide a reasonably accurate estimation of waste volumes in South
Africa.

56
Figure 8: Model components
Modelling of missing information is based on input of the available waste information
combined with geographic information and statistics on demography and economic activities,
and expected economic growth. This happens in the Model Input Module, which serves for
initial model input as well as subsequent updating of the model. Model updates can be
performed by DEA staff or via an external consultant.
The actual modelling of the missing information happens in the Modelling Module, which is
protected by password from incidental modification. Modelling is based on a scientifically
credible and properly documented approach. Updating of the Modelling Module will not be
necessary to produce an updated waste information baseline, just updating of the model input.
Model Results will be available in a range of formats, e.g. tables, bar and pie charts, and
XML files.
The effectiveness of reduce, reuse and recycling initiatives as well as the extent of energy
recovery from waste will be determined through scenario modelling. Historical data on waste
management hierarchical trends will be required in order to effectively model future trends
based on economic and population growth. DEA involvement in the scenario development
will be critical to facilitate a good understanding of, and interpretation of the modelling
results.
The model will include facilities to make waste generation forecasts. DEA will be able to use
the model to produce updated forecasts when more recent or accurate data becomes available.
Optional extensions of the model could be facilities like:

57
• Waste management treatment capacity planning
• Calculation of waste management climate effects
• Support for calculation of waste management costs
• Scenario analysis
The envisaged model will be simple and easy to use and based on standard tools like
Microsoft Excel or Access to enable seamless integration with current DEA systems. DEA
staff will be trained and capacitated to use the model in future surveys. The Department may
wish to engage with external parties to undertake official five-year assessments using the
model, as required.

58
5 Stakeholder involvement As part of the quality assurance we discuss the approach with different stakeholders during
the project. We also need stakeholder support for the methodology.

59
Appendix D: Modeling

60
1. Database structure and modeling principles Technical description of the database supporting the Baseline Report and the modelling
principles used to fill in the gaps

61
2. User Guide Here we include a step by step guide on how to use the model. This is expected to be useful
especially with future updates of the model.

62
Schedule 1
GENERAL WASTE TYPES FOR REPORTING TO THE SOUTH AFRICAN WASTE INFORMATION SYSTEM
LEVEL 1 LEVEL 2 -Major Waste Type LEVEL 3 - Specific Waste Type
GE
NE
RA
L W
AS
TE
No Name No Name
GW 01 Municipal waste 01
GW10 Commercial and industrial waste 01
GW13 Brine 01
GW14 Fly ash and dust from miscellaneous filter sources
01
GW15 Bottom ash 01
GW16 Slag
01 Ferrous metal slag
02 Non-ferrous metal slag
03 Other
GW 17 Mineral waste
01 Foundry sand
02 Refractory waste
03 Other
GW 18 Waste of Electric and Electronic Equipment (WEEE)
01 Large Household Appliances
02 Small Household Appliances
03 Office, information & Communication Equipment
04
Entertainment & Consumer Electronics and toys, leisure, sports & recreational equipment and automatic issuing machines
05 Lighting equipment
06 Electric and Electronic tools
07 Security & health care equipment
08 Mixed WEEE
GW 20 Organic waste 01 Garden waste
02 Food waste
GW 21 Sewage sludge 01 Sewage sludge
GW30 Construction and demolition waste 01
GW50 Paper
01 Newsprint and magazines
02 Brown grades
03 White grades
04 Mixed grades
GW51 Plastic 01 PET
02 Others
GW52 Glass 01
GW53 Metals 01 Ferrous metal
02 Non-ferrous metal
GW54 Tyres 01
GW99 Other 01

63
HAZARDOUS WASTE TYPES FOR REPORTING TO THE SAWIS
LEVEL 1 LEVEL 2 - Major Waste Type LEVEL 3 - Specific Waste Type H
AZ
AR
DO
US
WA
ST
E
No Name No Name
HW 01 Gaseous waste 01 Gases (excluding Greenhouse gases)
02 Obsolete ozone depleting gases
HW 02 Mercury containing waste 01 Liquid waste containing mercury
02 Solid waste containing mercury
HW 03 Batteries
01 Lead Batteries
02 Mercury batteries
03 Ni/Cd batteries
04 Manganese dioxide and alkali batteries
05 Lithium & Lithium ion batteries
06 Nickel-metal hydride batteries
07 Mixed batteries
HW 04 POP Waste 01 PCB containing waste (>50mg/kg)
02 Other POP-containing waste
HW 05 Inorganic waste
01 Liquid and sludge inorganic waste
02 Solid inorganic waste
03 Spent pot lining (inorganic)
HW 06 Asbestos containing waste 01 Asbestos containing waste
HW 07 Waste Oils 01 Waste oil
HW 08
Organic halogenated and /or sulphur containing solvents
01 Solvents containing halogens and/or sulphur
HW 09 Organic halogenated and/or sulphur containing waste
01 Liquids and sludges containing halogens and/or sulphur
Solids containing halogens and/or sulphur
HW 10 Organic solvents without halogens and sulphur 01
Solvents without halogens and sulphur
HW 11 Other organic waste without halogen or sulphur
01 Liquid and sludge organic waste
02 Solid organic waste
03 Spent pot lining (organic)
HW 12 Tarry and Bituminous waste 01 Tarry waste
02 Bituminous waste
HW 13 Brine 01 Brine
HW 14 Fly ash and dust from miscellaneous filter sources
01 Fly ash
HW 15 Bottom ash 01 Bottom ash
HW 16 Slag
01 Ferrous metal slag
02 Non-ferrous metal slag
03 Other
HW 17 Mineral waste
01 Foundry sand
02 Refractory waste
03 Other
HW 18 Waste of Electric and Electronic 01 Large Household Appliances

64
Equipment (WEEE) 02 Small Household Appliances
03 Office, information & Communication Equipment
04
Entertainment & Consumer Electronics and toys, leisure, sports & recreational equipment and automatic issuing machines
05 Lighting equipment
06 Electric and Electronic tools
07 Security & health care equipment
08 Mixed WEEE
HW 19 Health Care Risk Waste
01 Pathological waste
02 Infectious waste and sharps
03 Chemical waste
HW 20 Sewage sludge 01 Sewage sludge
HW 99 Miscellaneous 01 Miscellaneous
For mixtures, report under the waste type which represents the largest fraction of the waste under
consideration. Report under a specific waste type e.g. mercury battery would be reported under
mercury battery and not mercury containing waste.
WASTE MANAGEMENT METHODS:
LIST OF RECYCLING, RECOVERY, TREATMENT AND DISPOSAL (R, R, T & D)
CODES FOR CATEGORIZATION
Code Description
RECYCLING AND RECOVERY
R1 Direct recovery of energy from waste
R2 Direct recovery of raw material from waste
R3 Regeneration or rejuvenation of waste (solvents, carbons, acids & alkalis)
R4 Recycling of organic substances
R5 Recycling of metals and metal compounds
R6 Recycling of other inorganic materials Treatment (treatment not for the purposes of disposal)
T1 Biological treatment (e.g. biodegradation, composting, biogas generation)
T2 Physical treatment
T3 Chemical treatment
T4 Thermal treatment (incineration, pyrolysis etc.)
Disposal
D1 Disposal of waste to land (e.g. specially engineered landfill)
D2 Disposal of waste to landfill (e.g. non-engineered landfill)
D3 Storage/disposal of waste in surface impoundments (e.g. placement of liquid or sludge discards into pits, ponds, lagoons etc.)
D4 Release of waste into water bodies (except seas/oceans)
D5 Permanent storage (stabilization, micro-encapsulation, macro-encapsulation)
1